Download to read offline


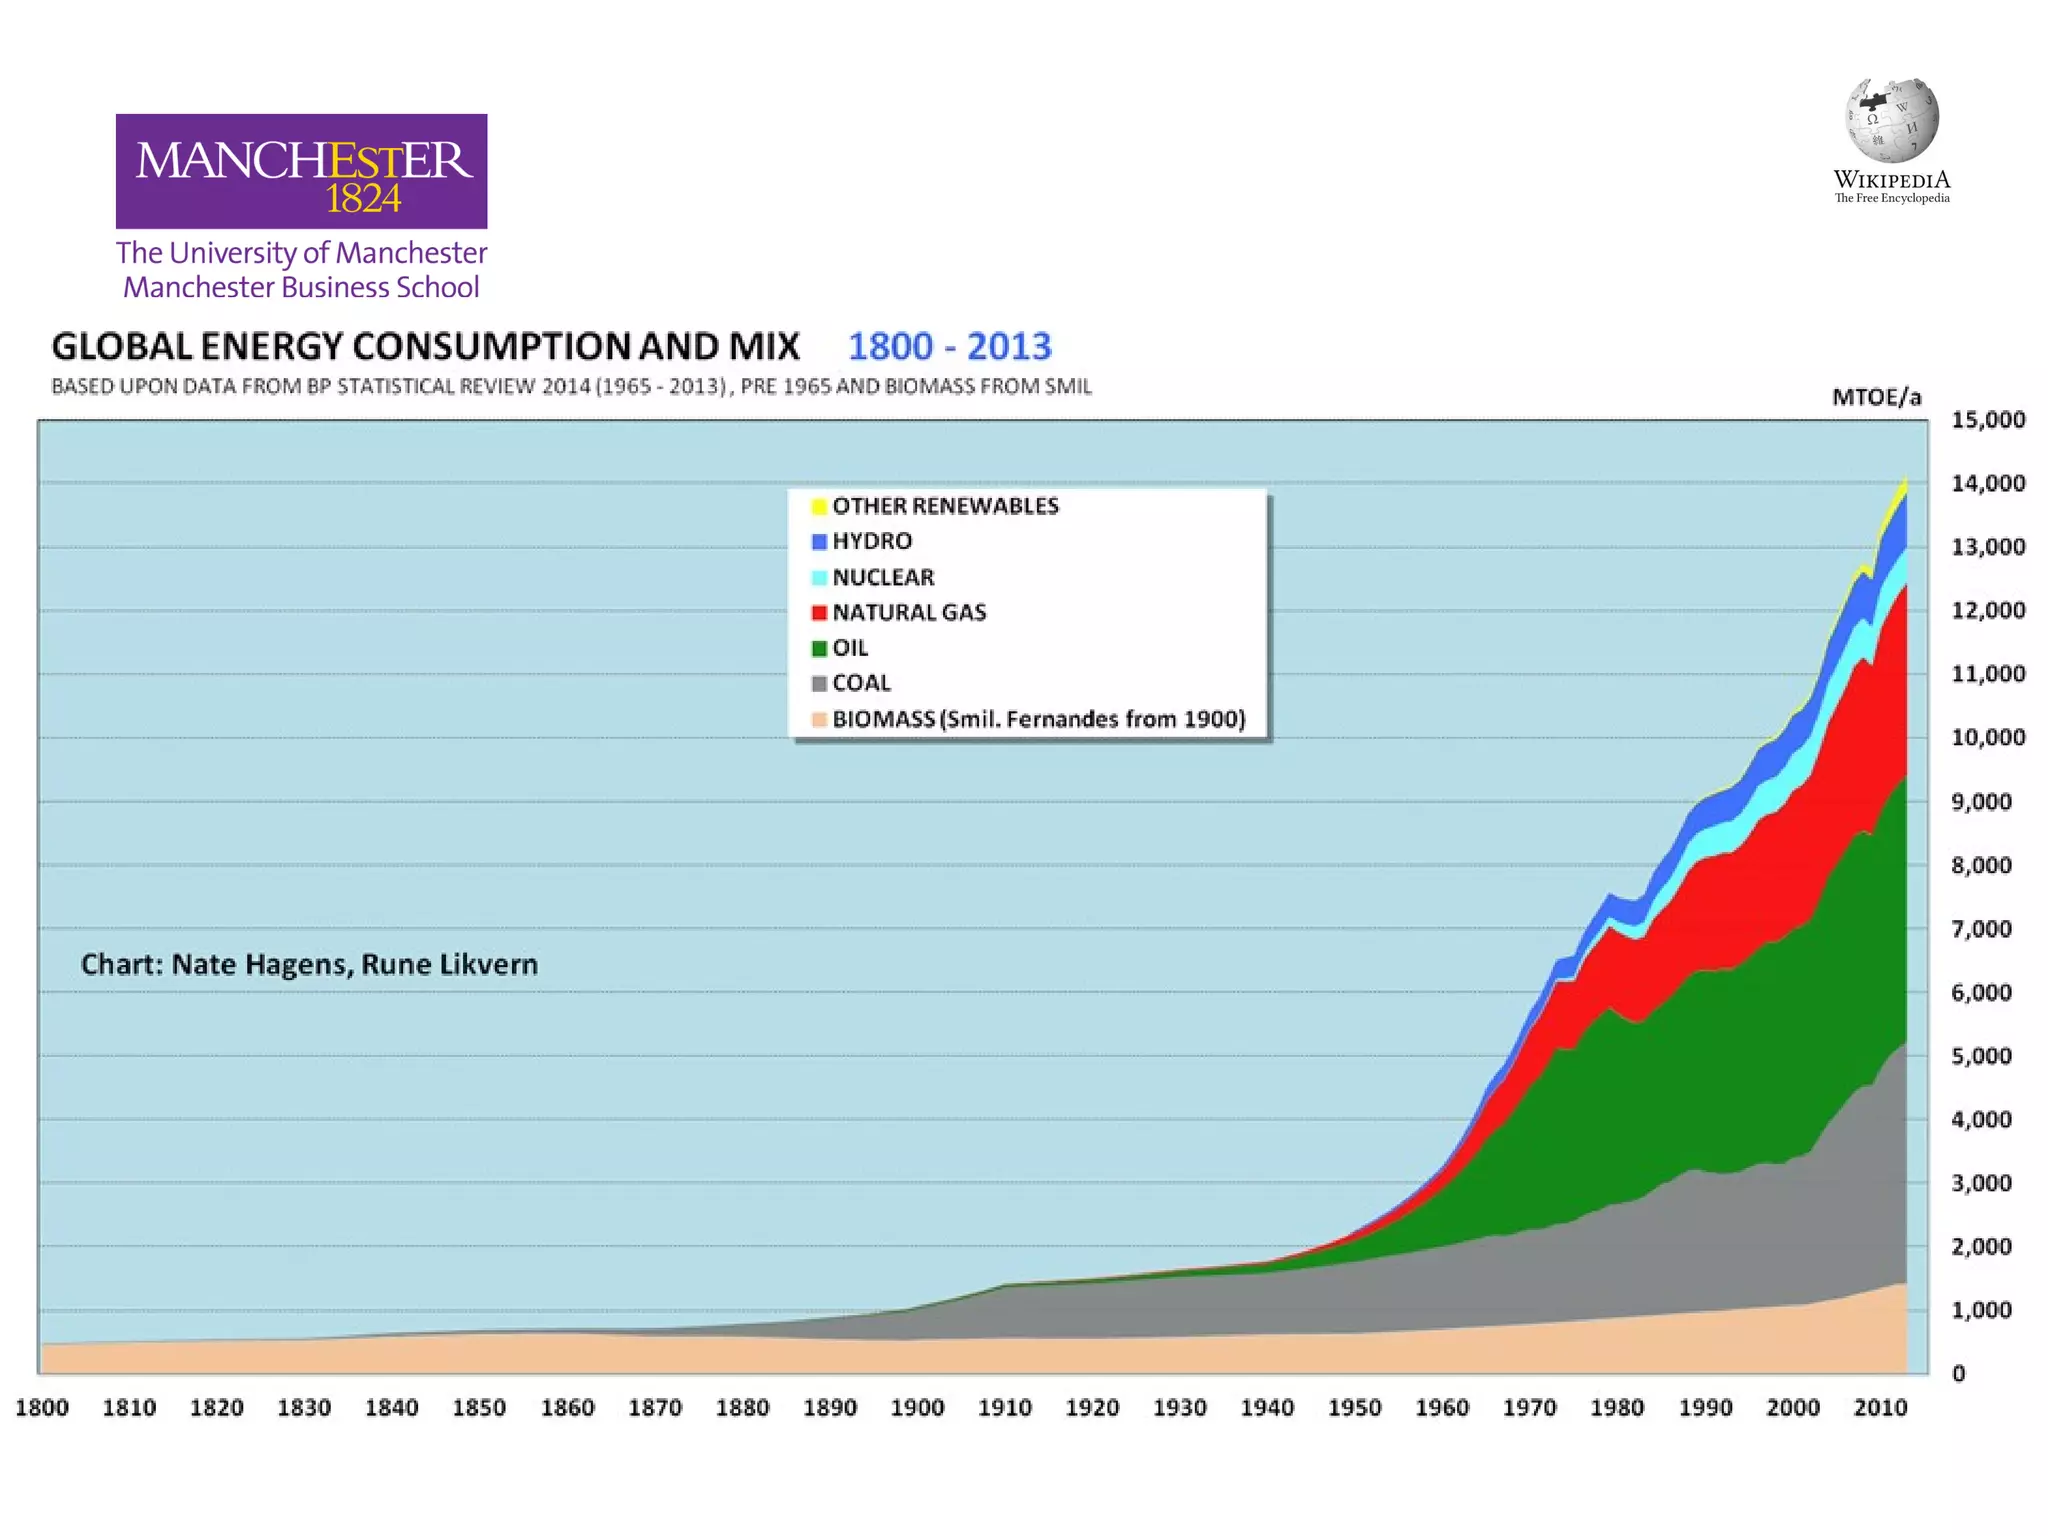


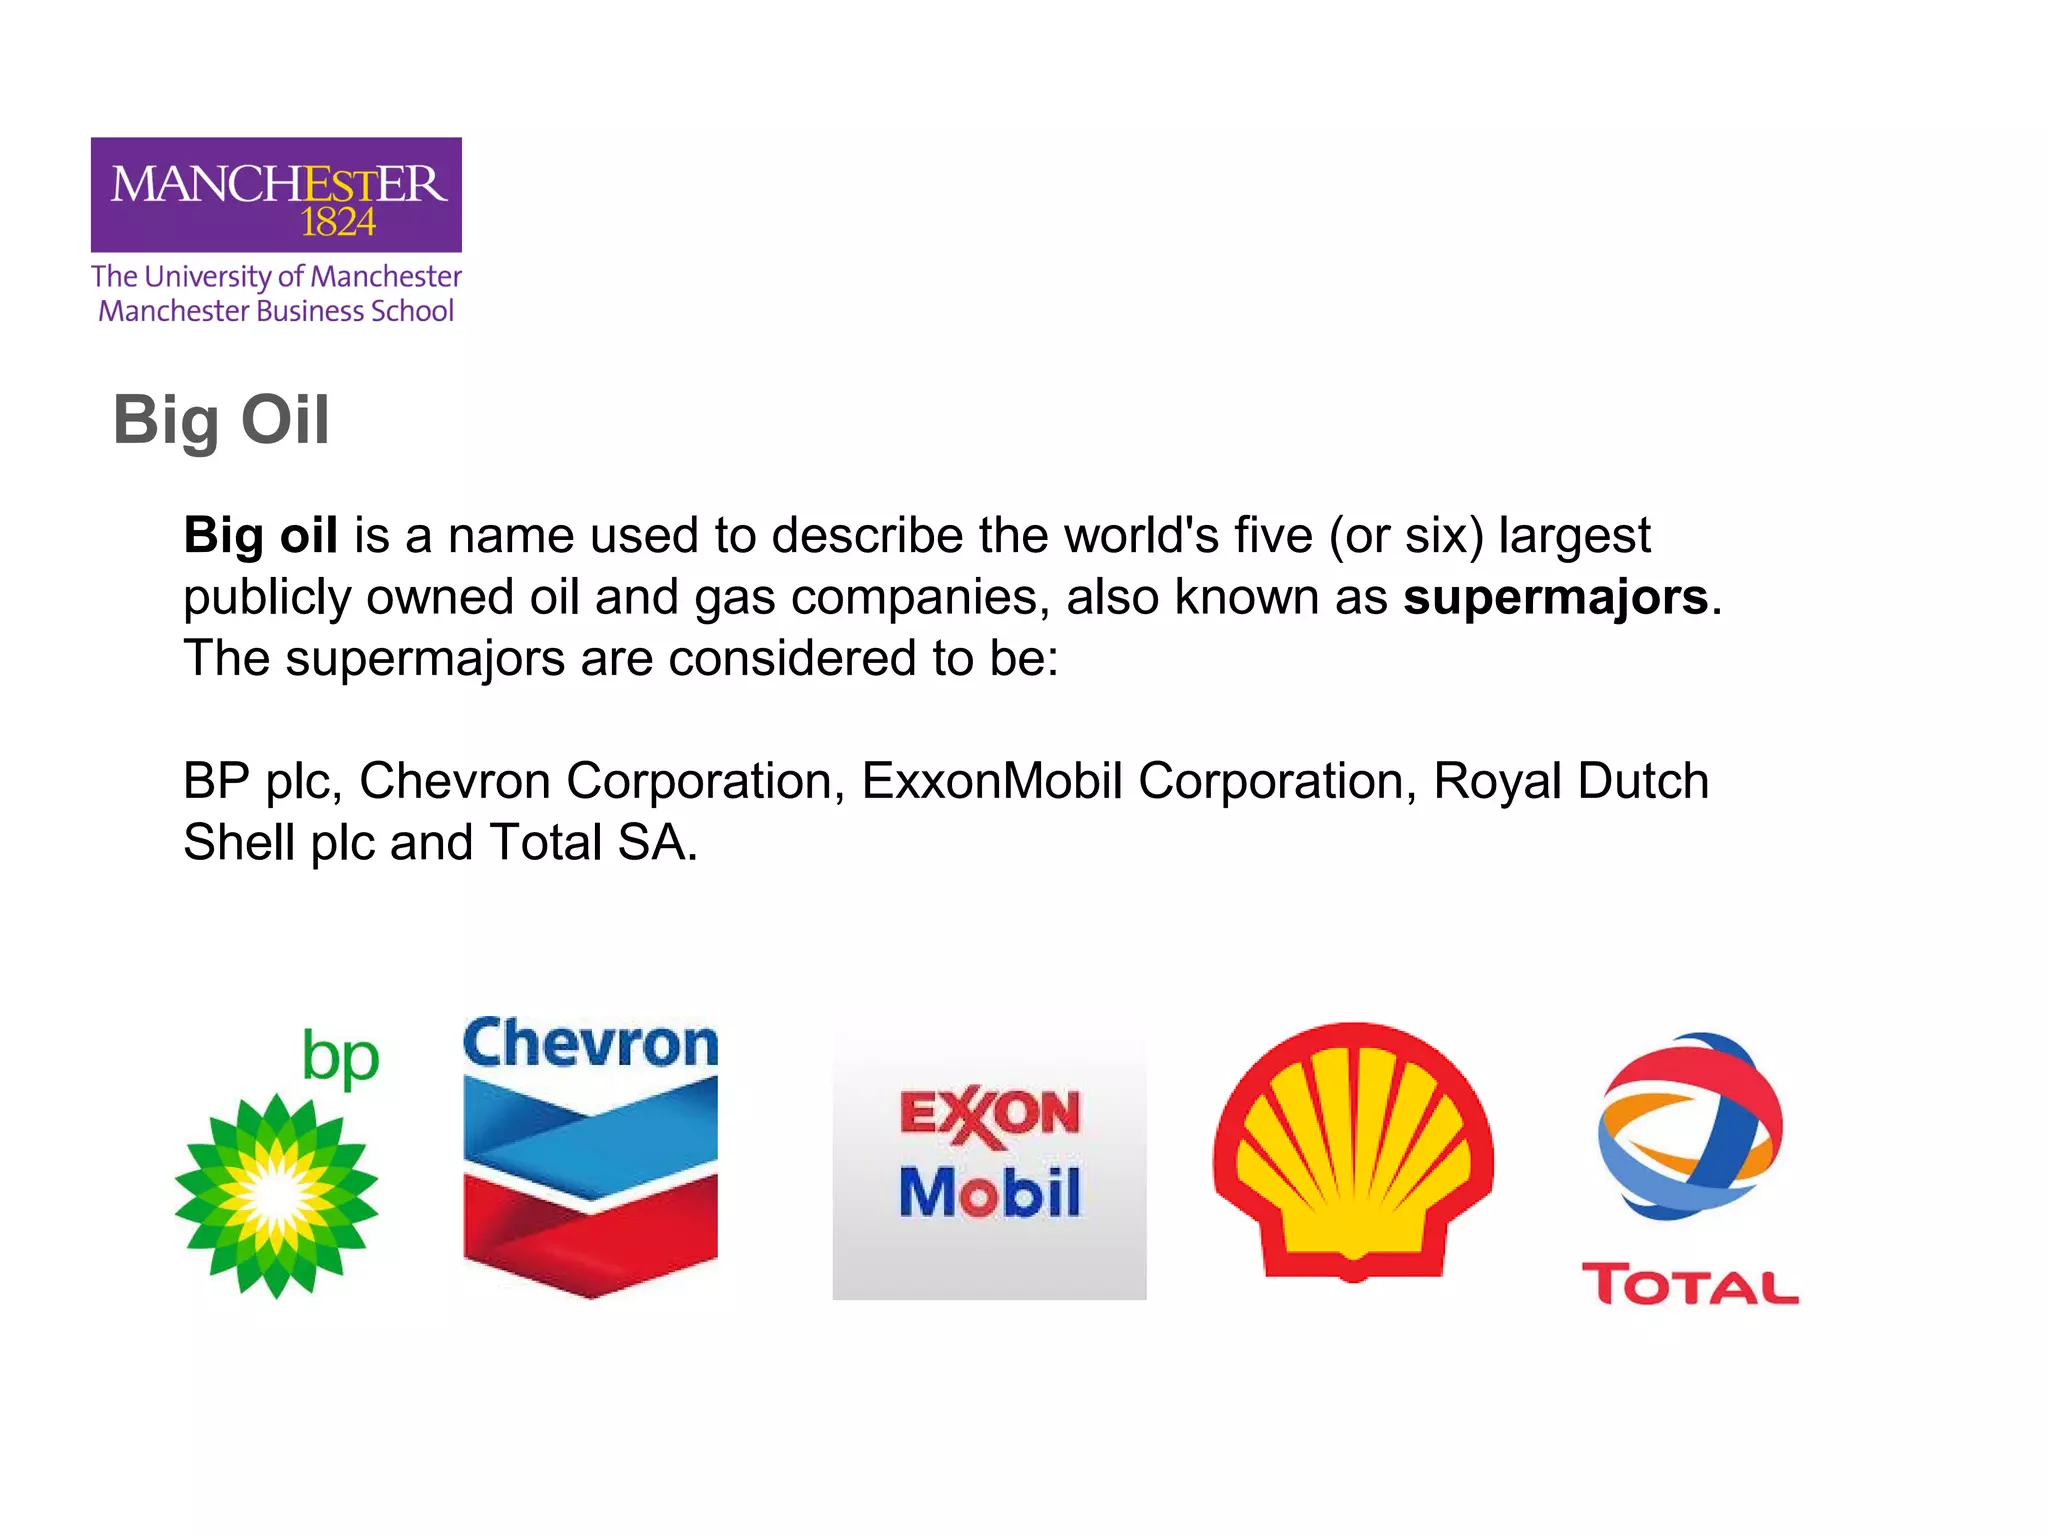
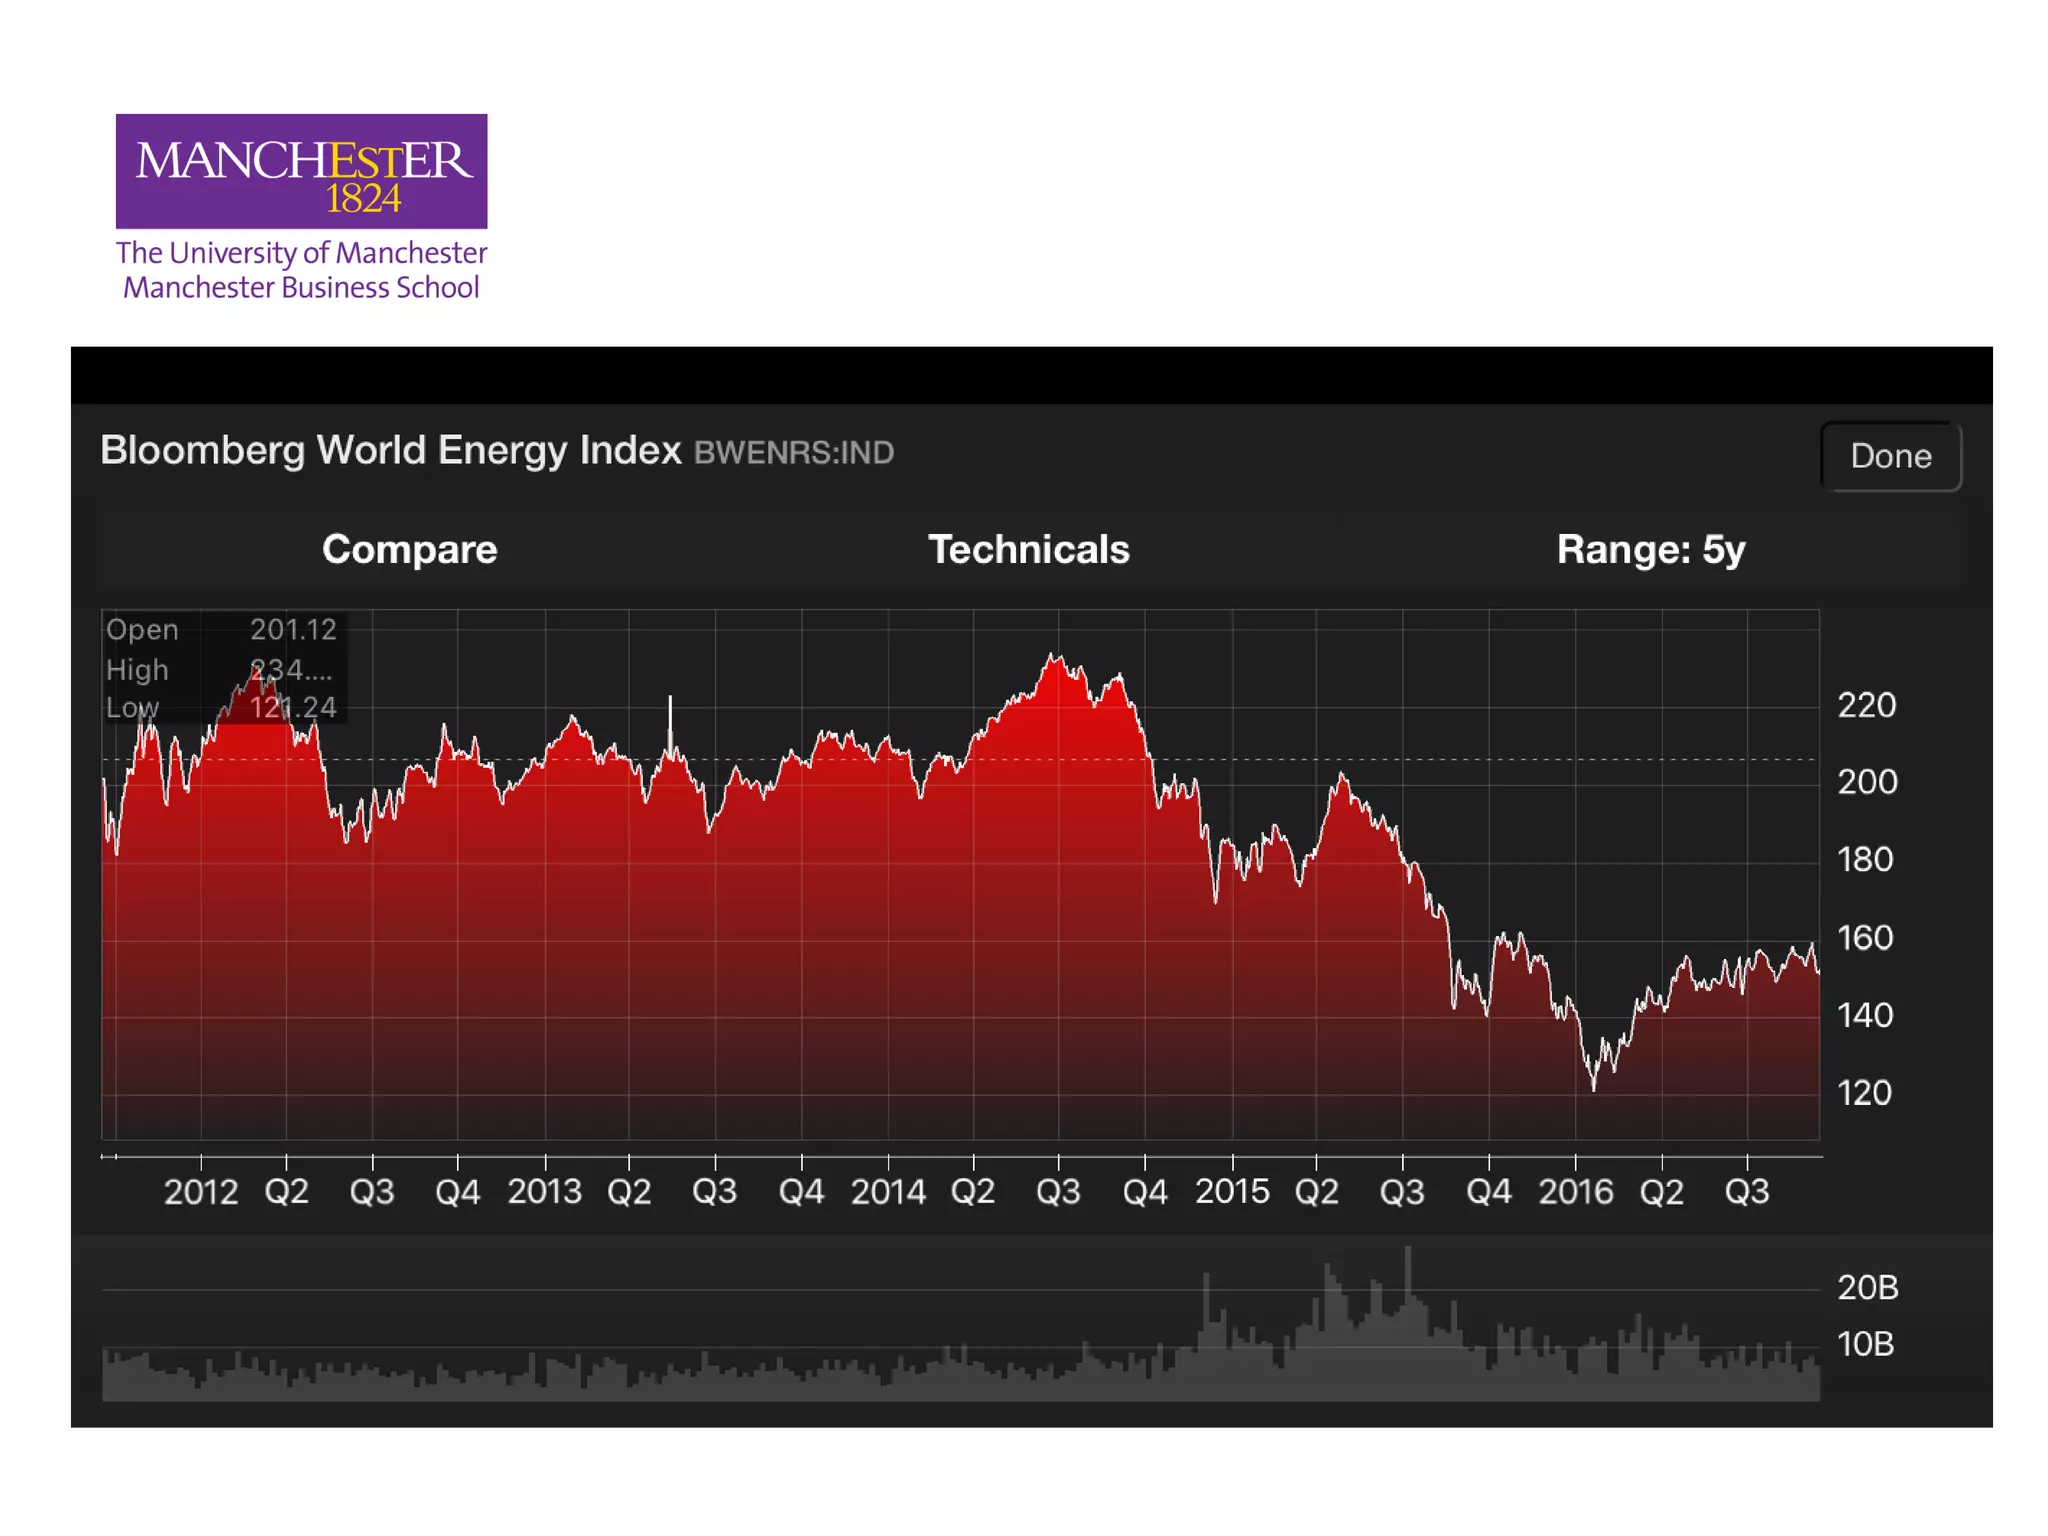


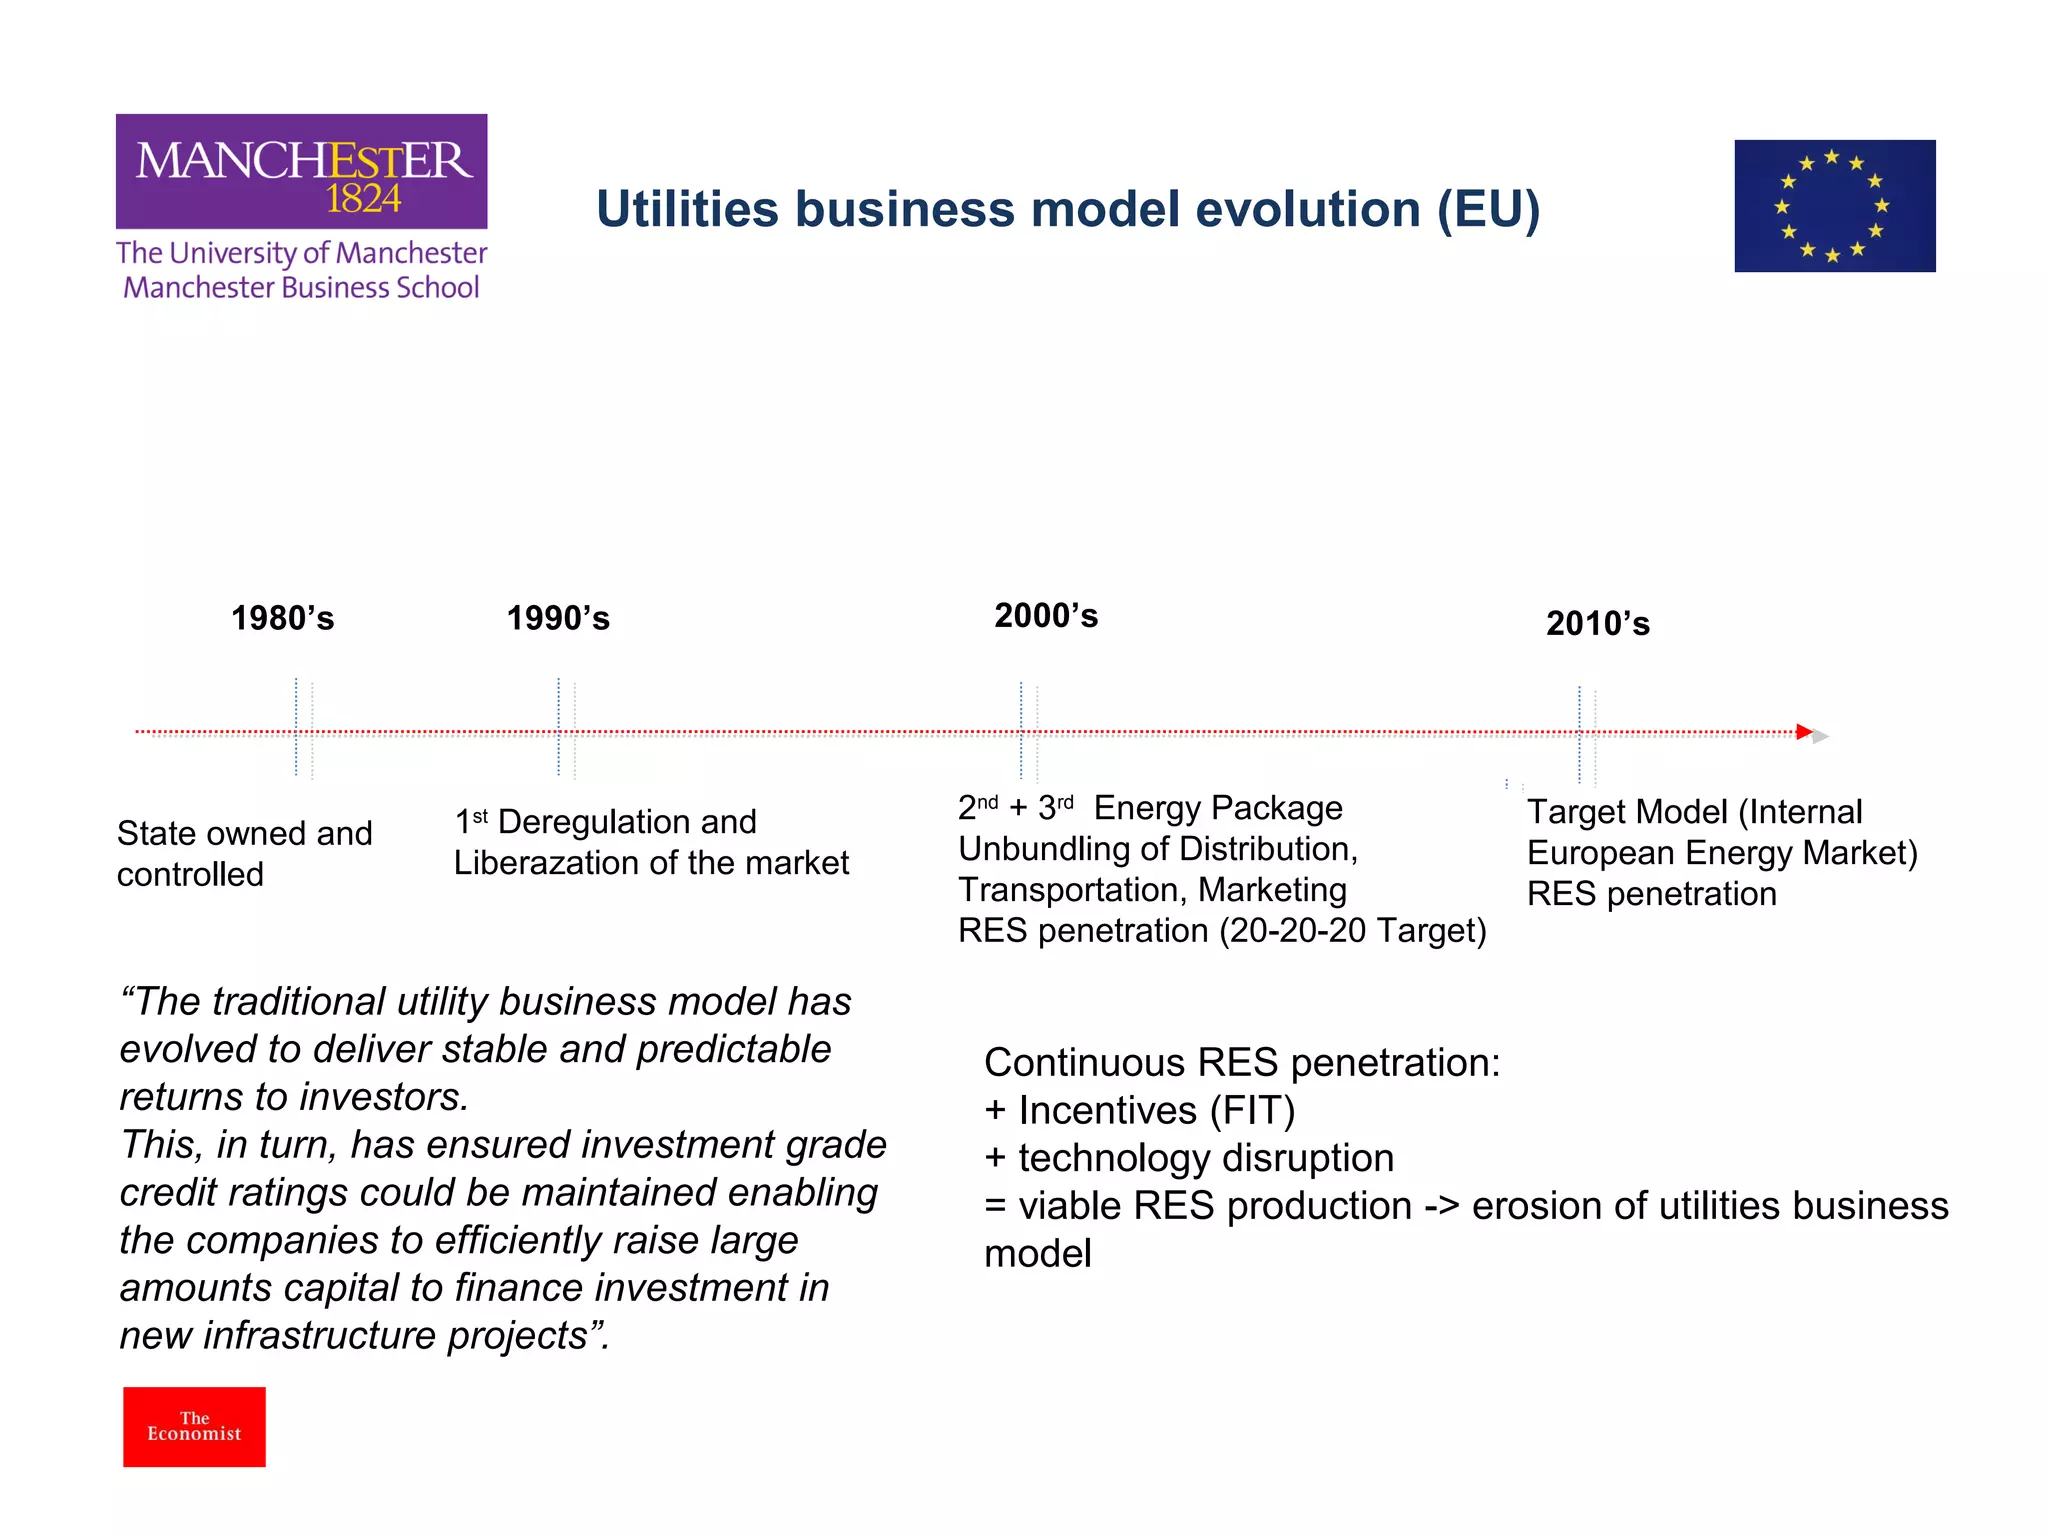


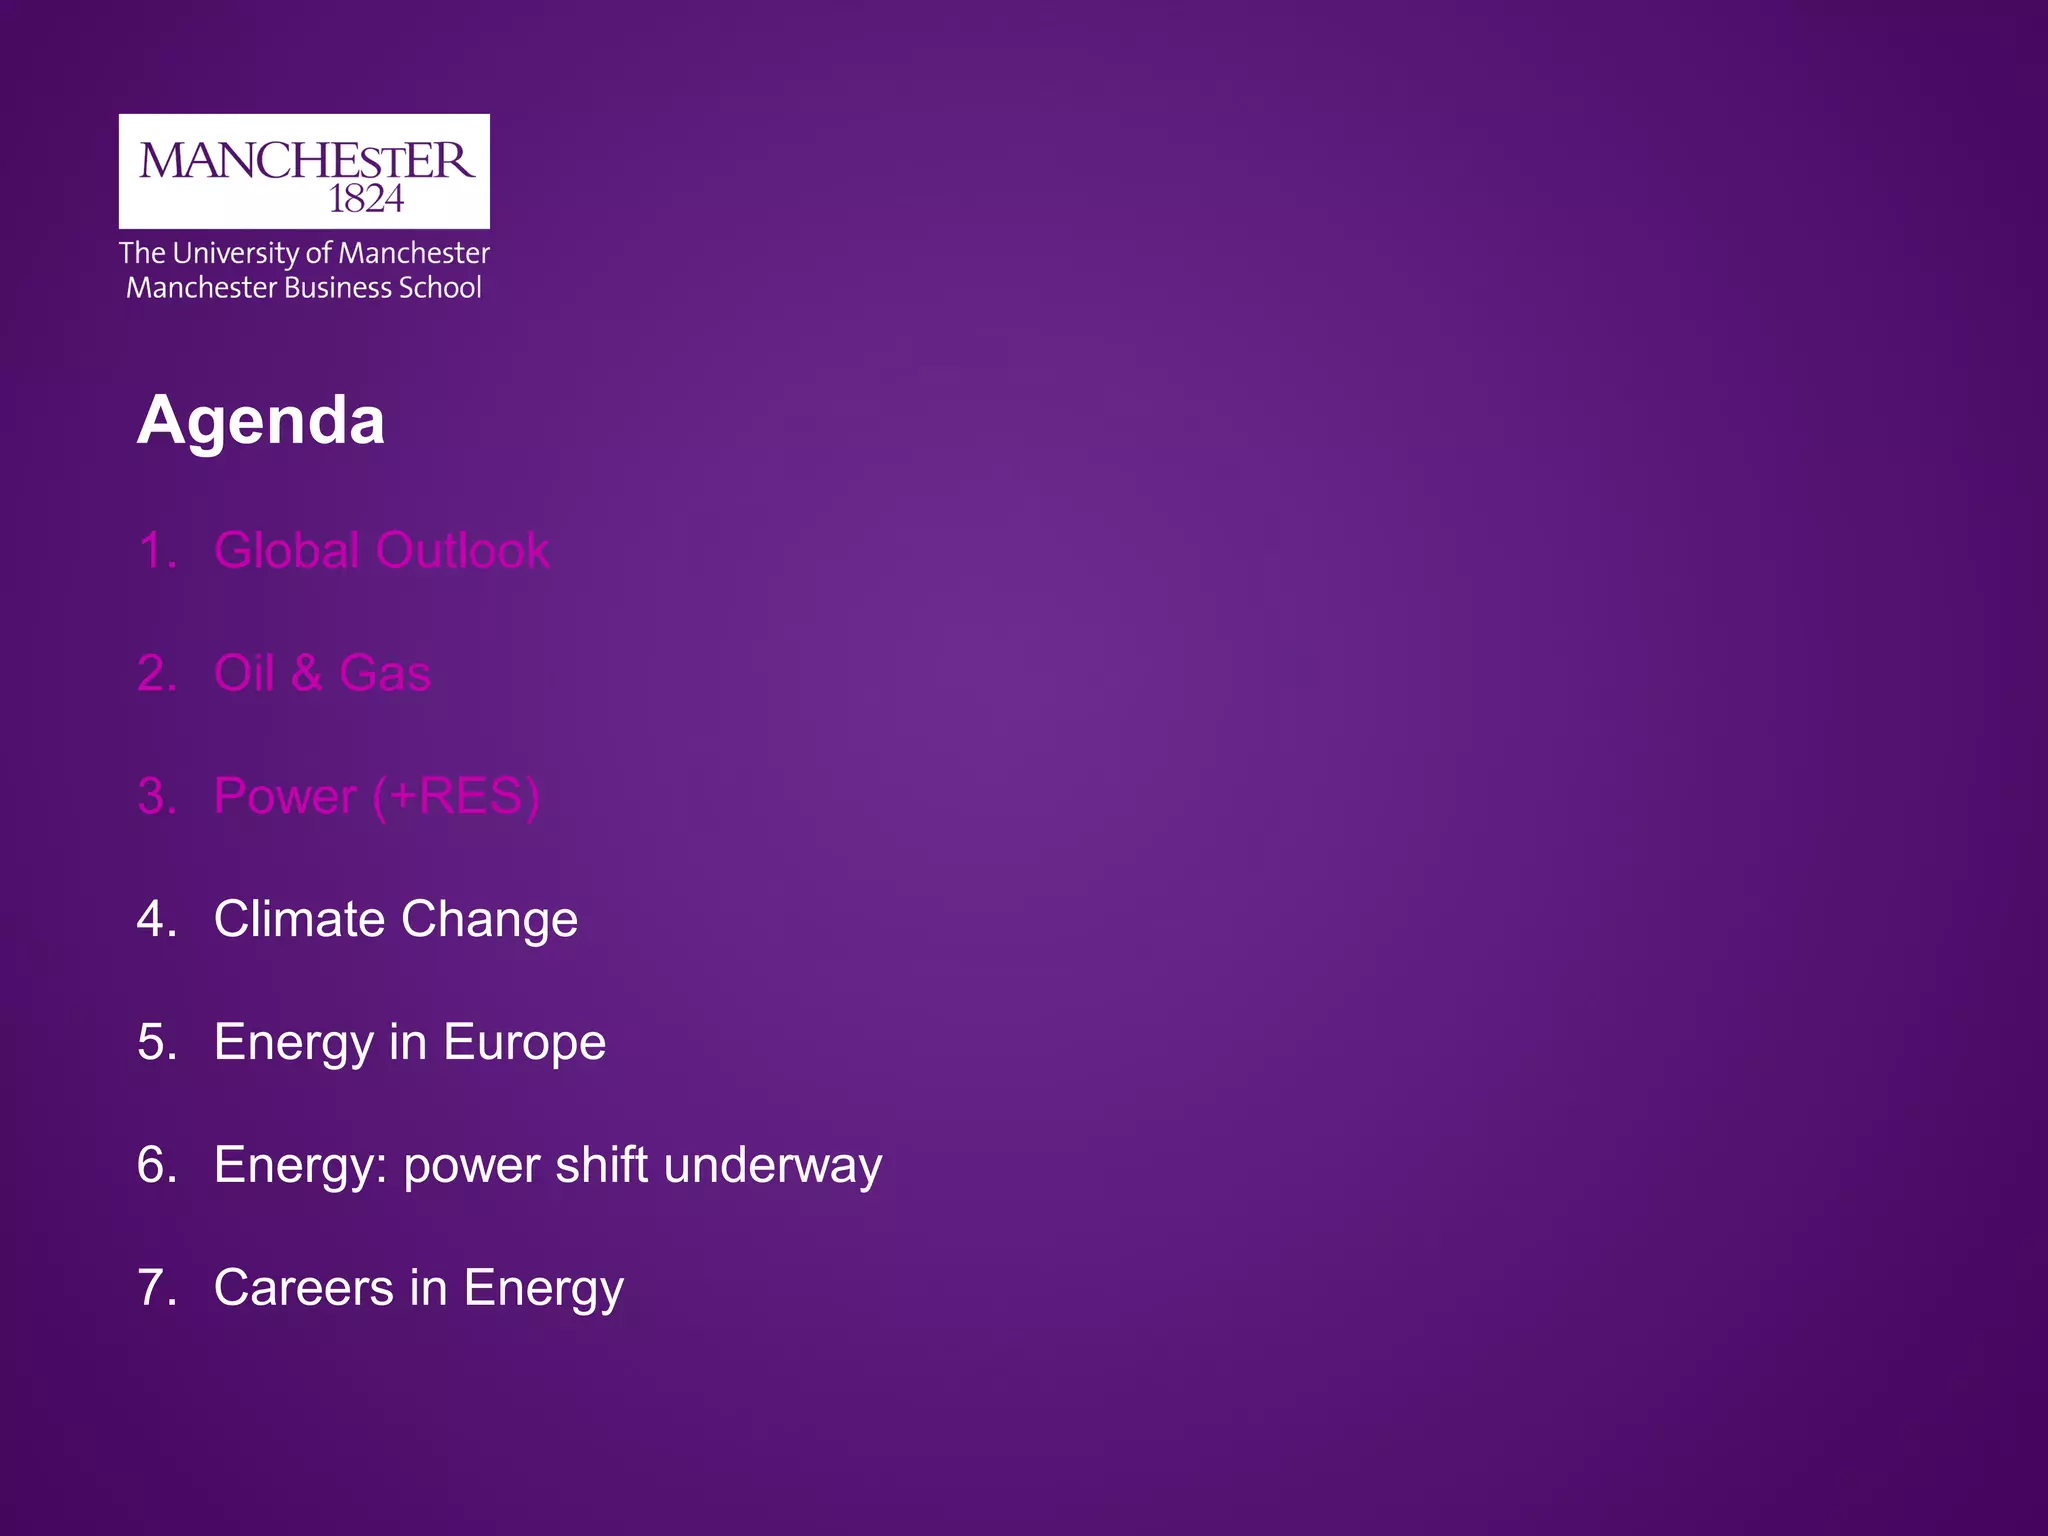


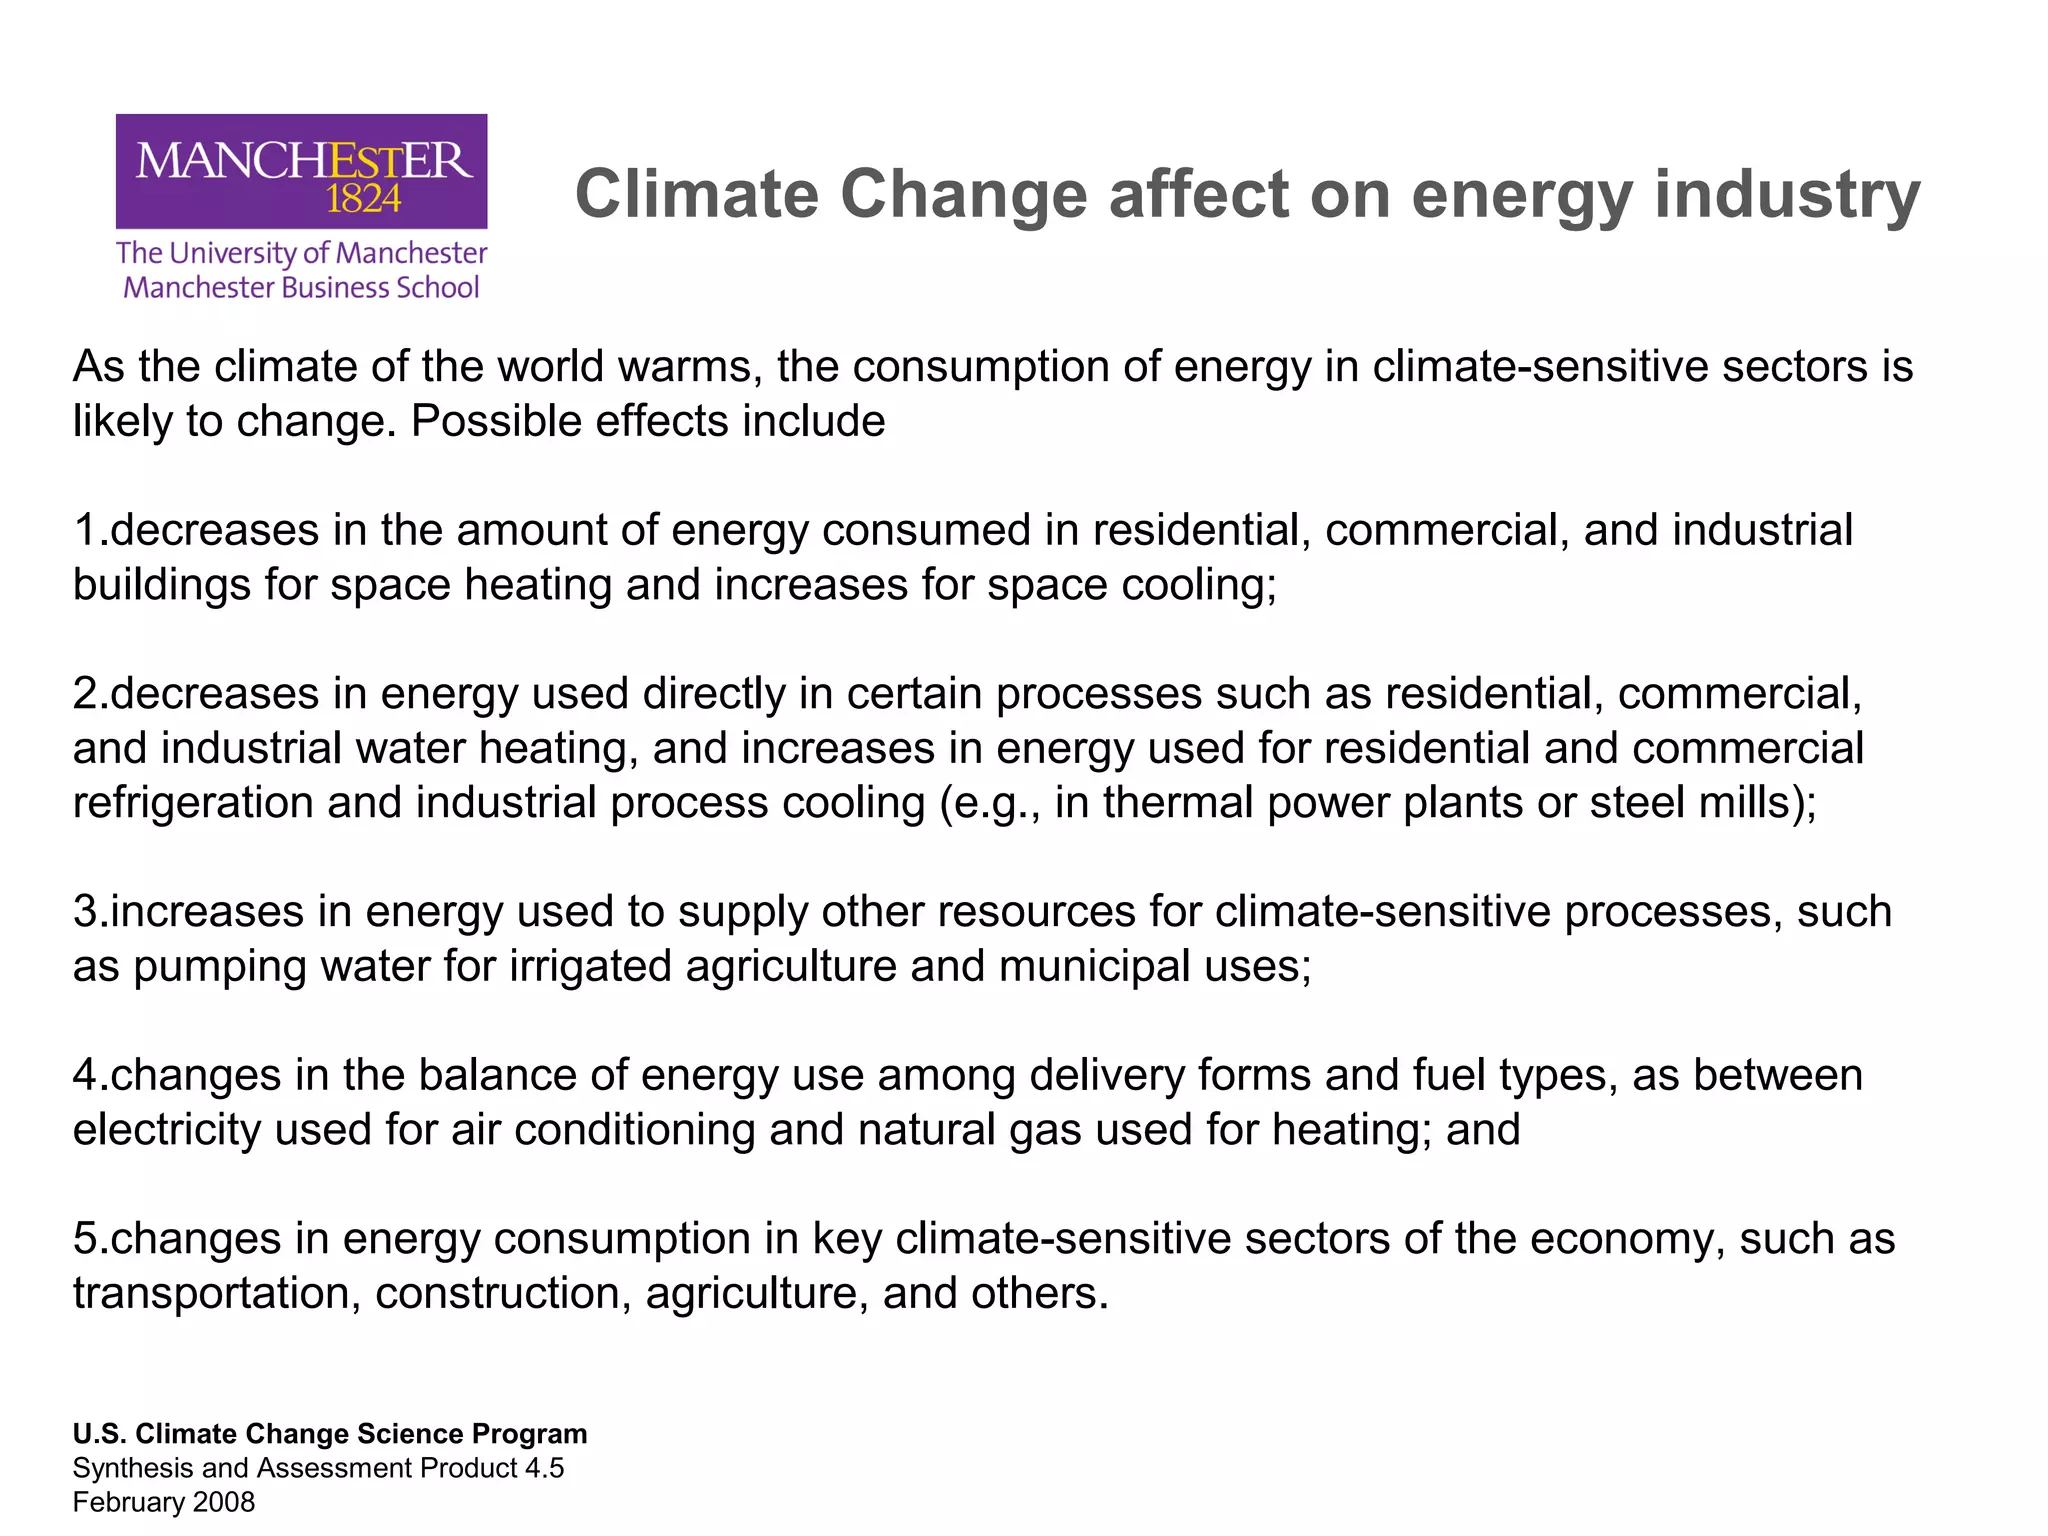


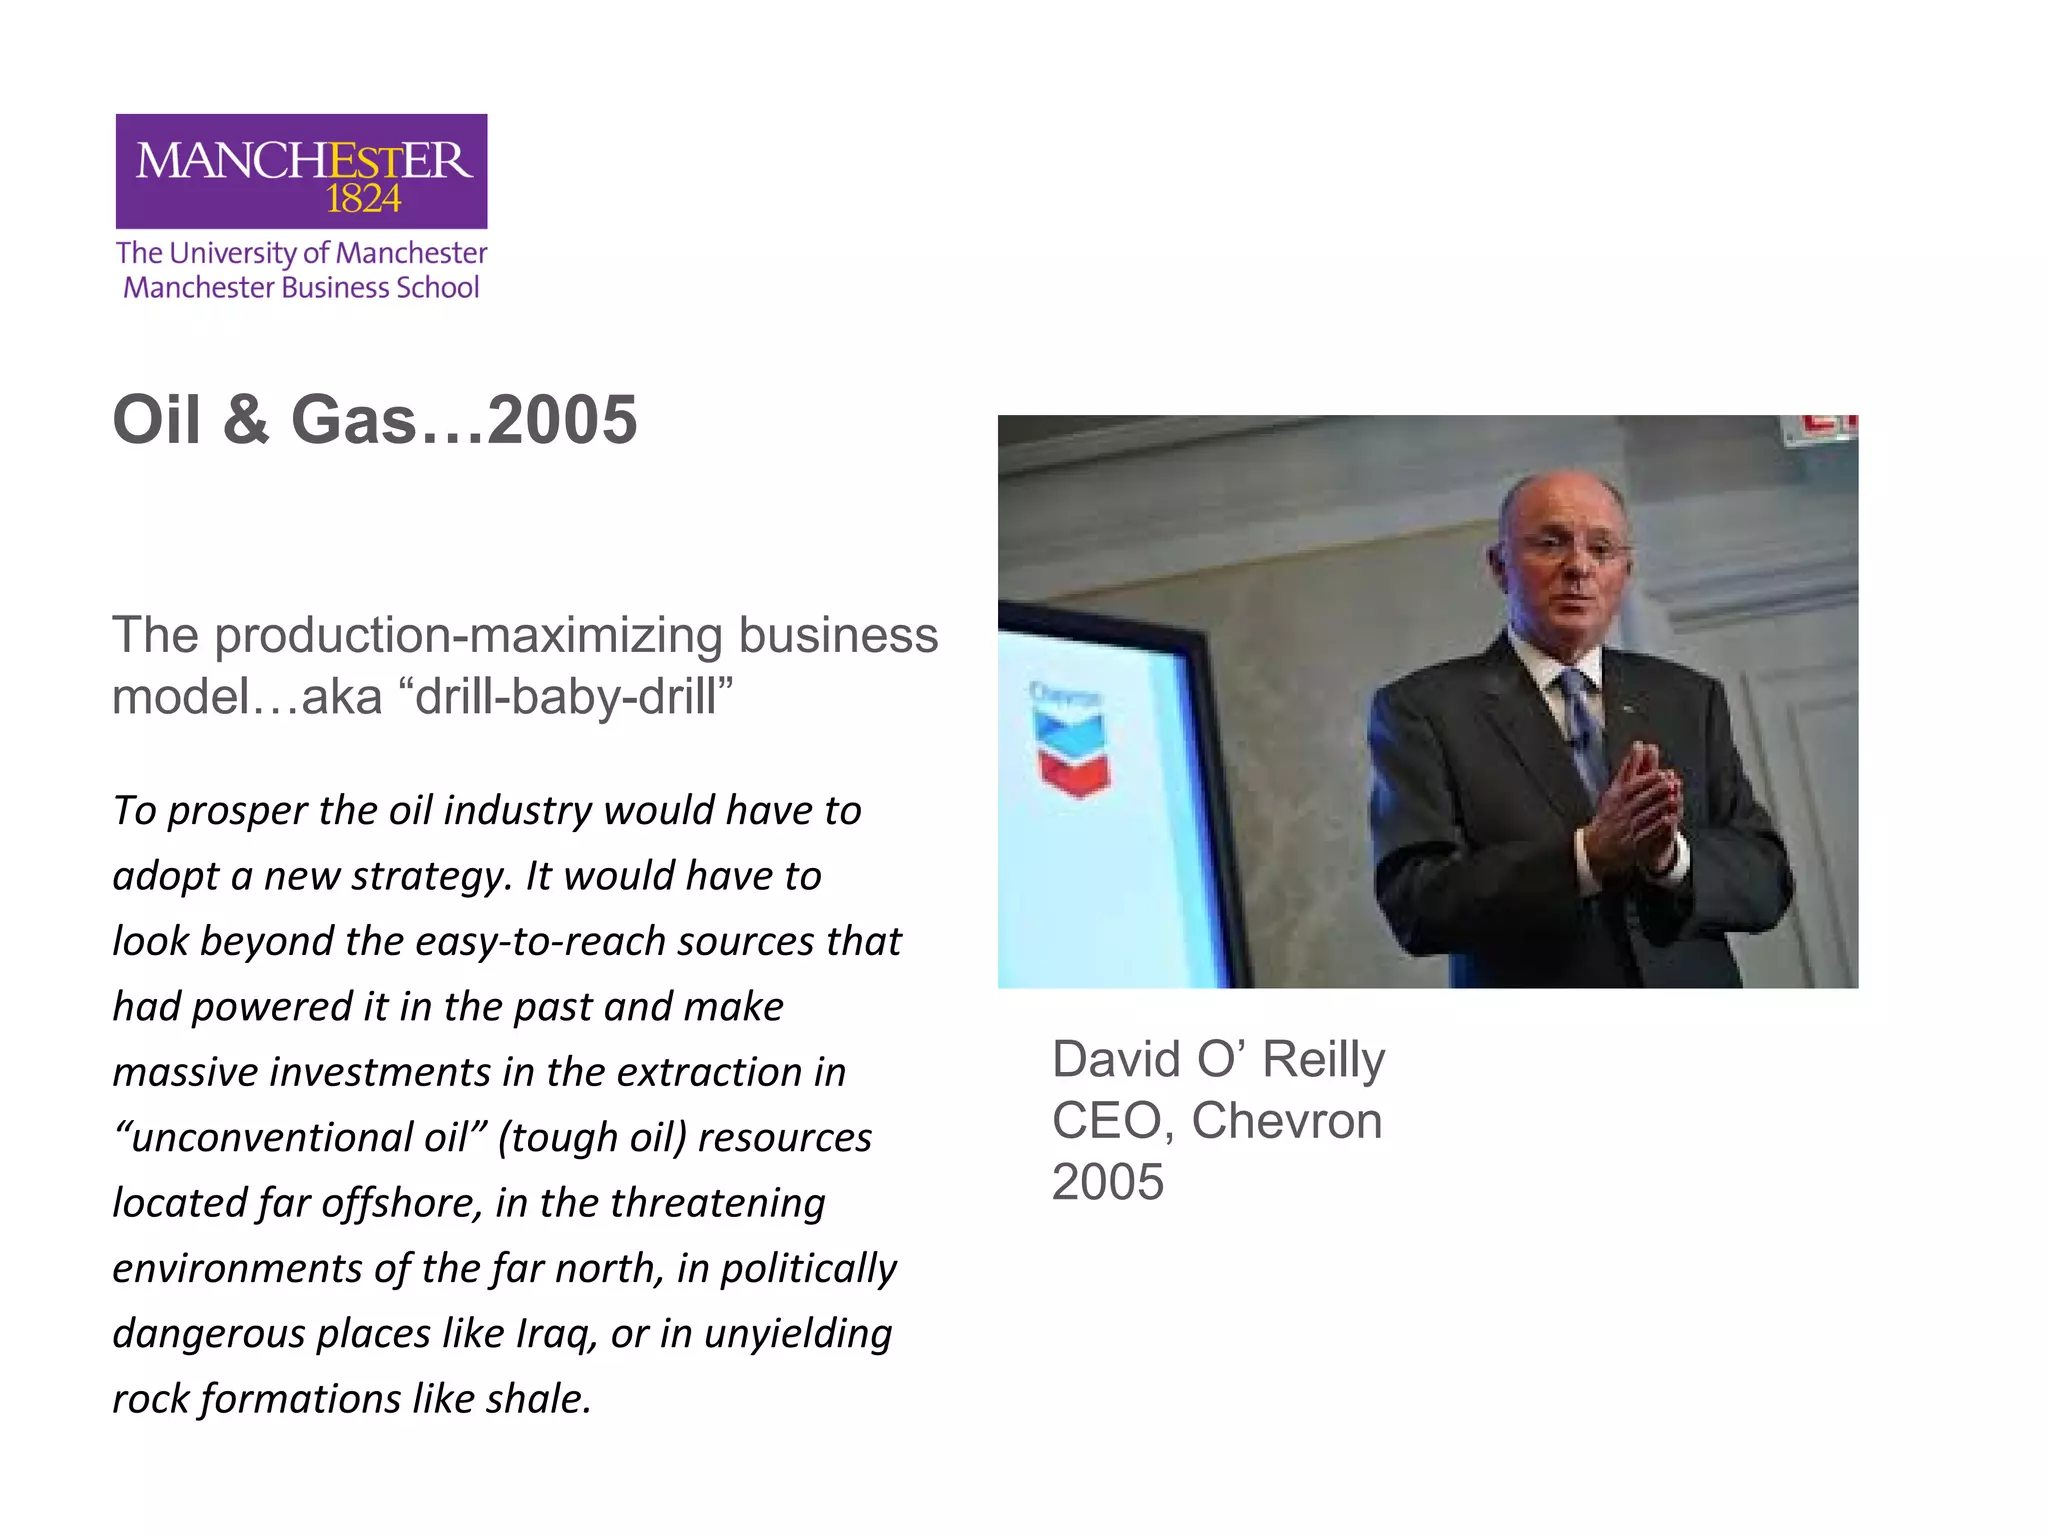
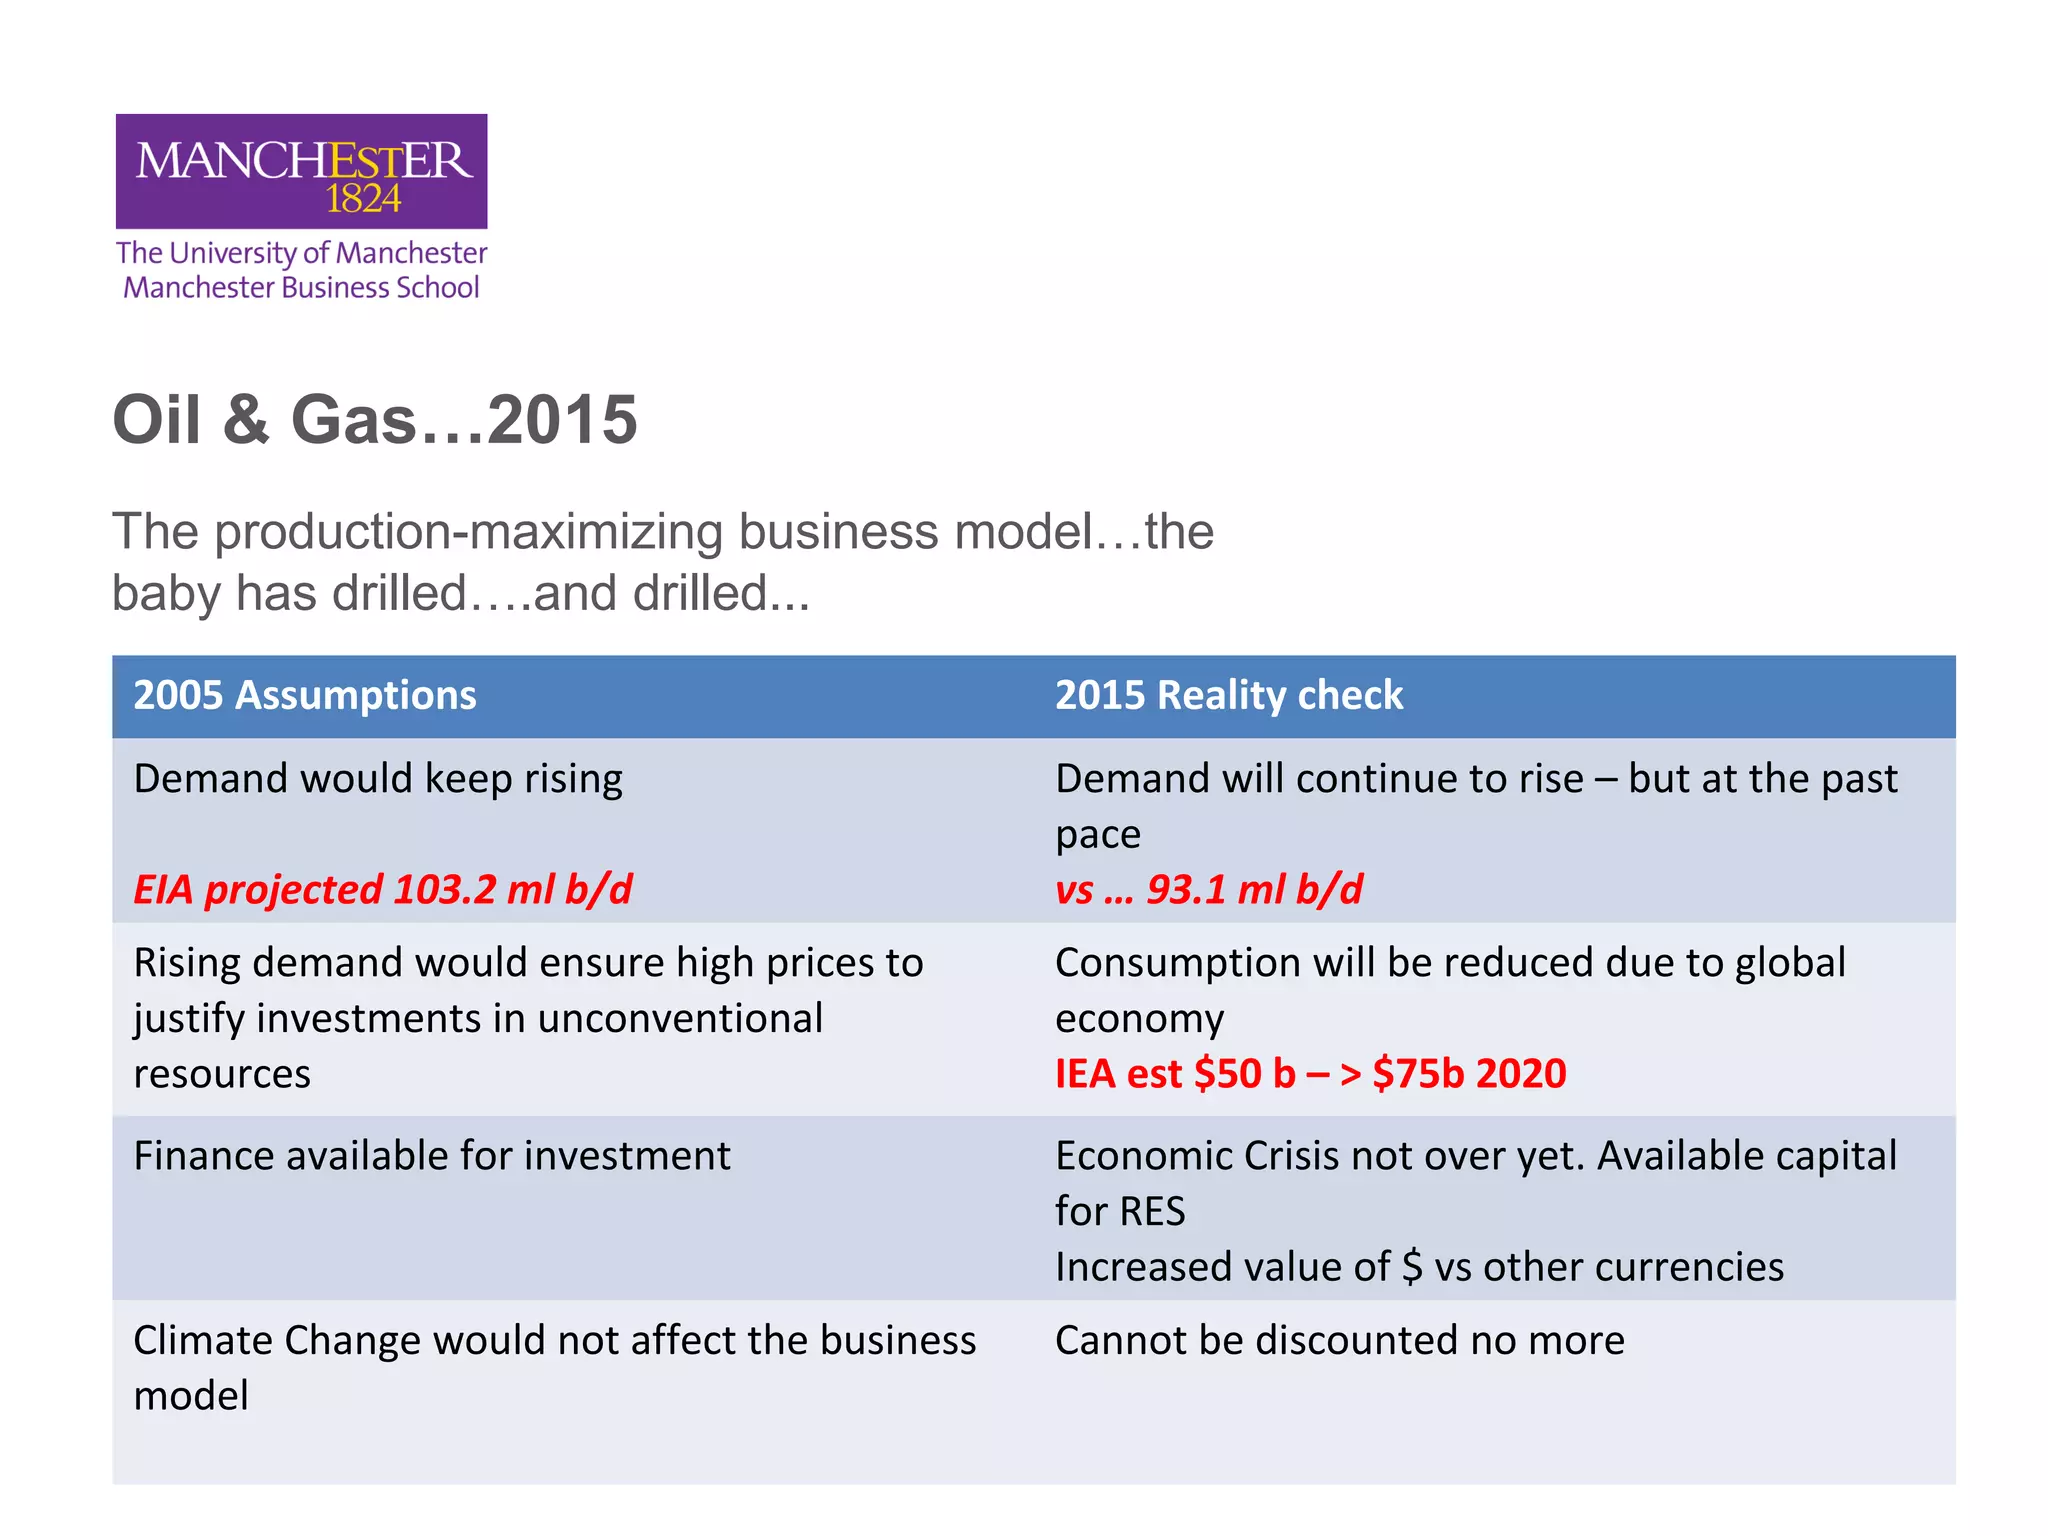


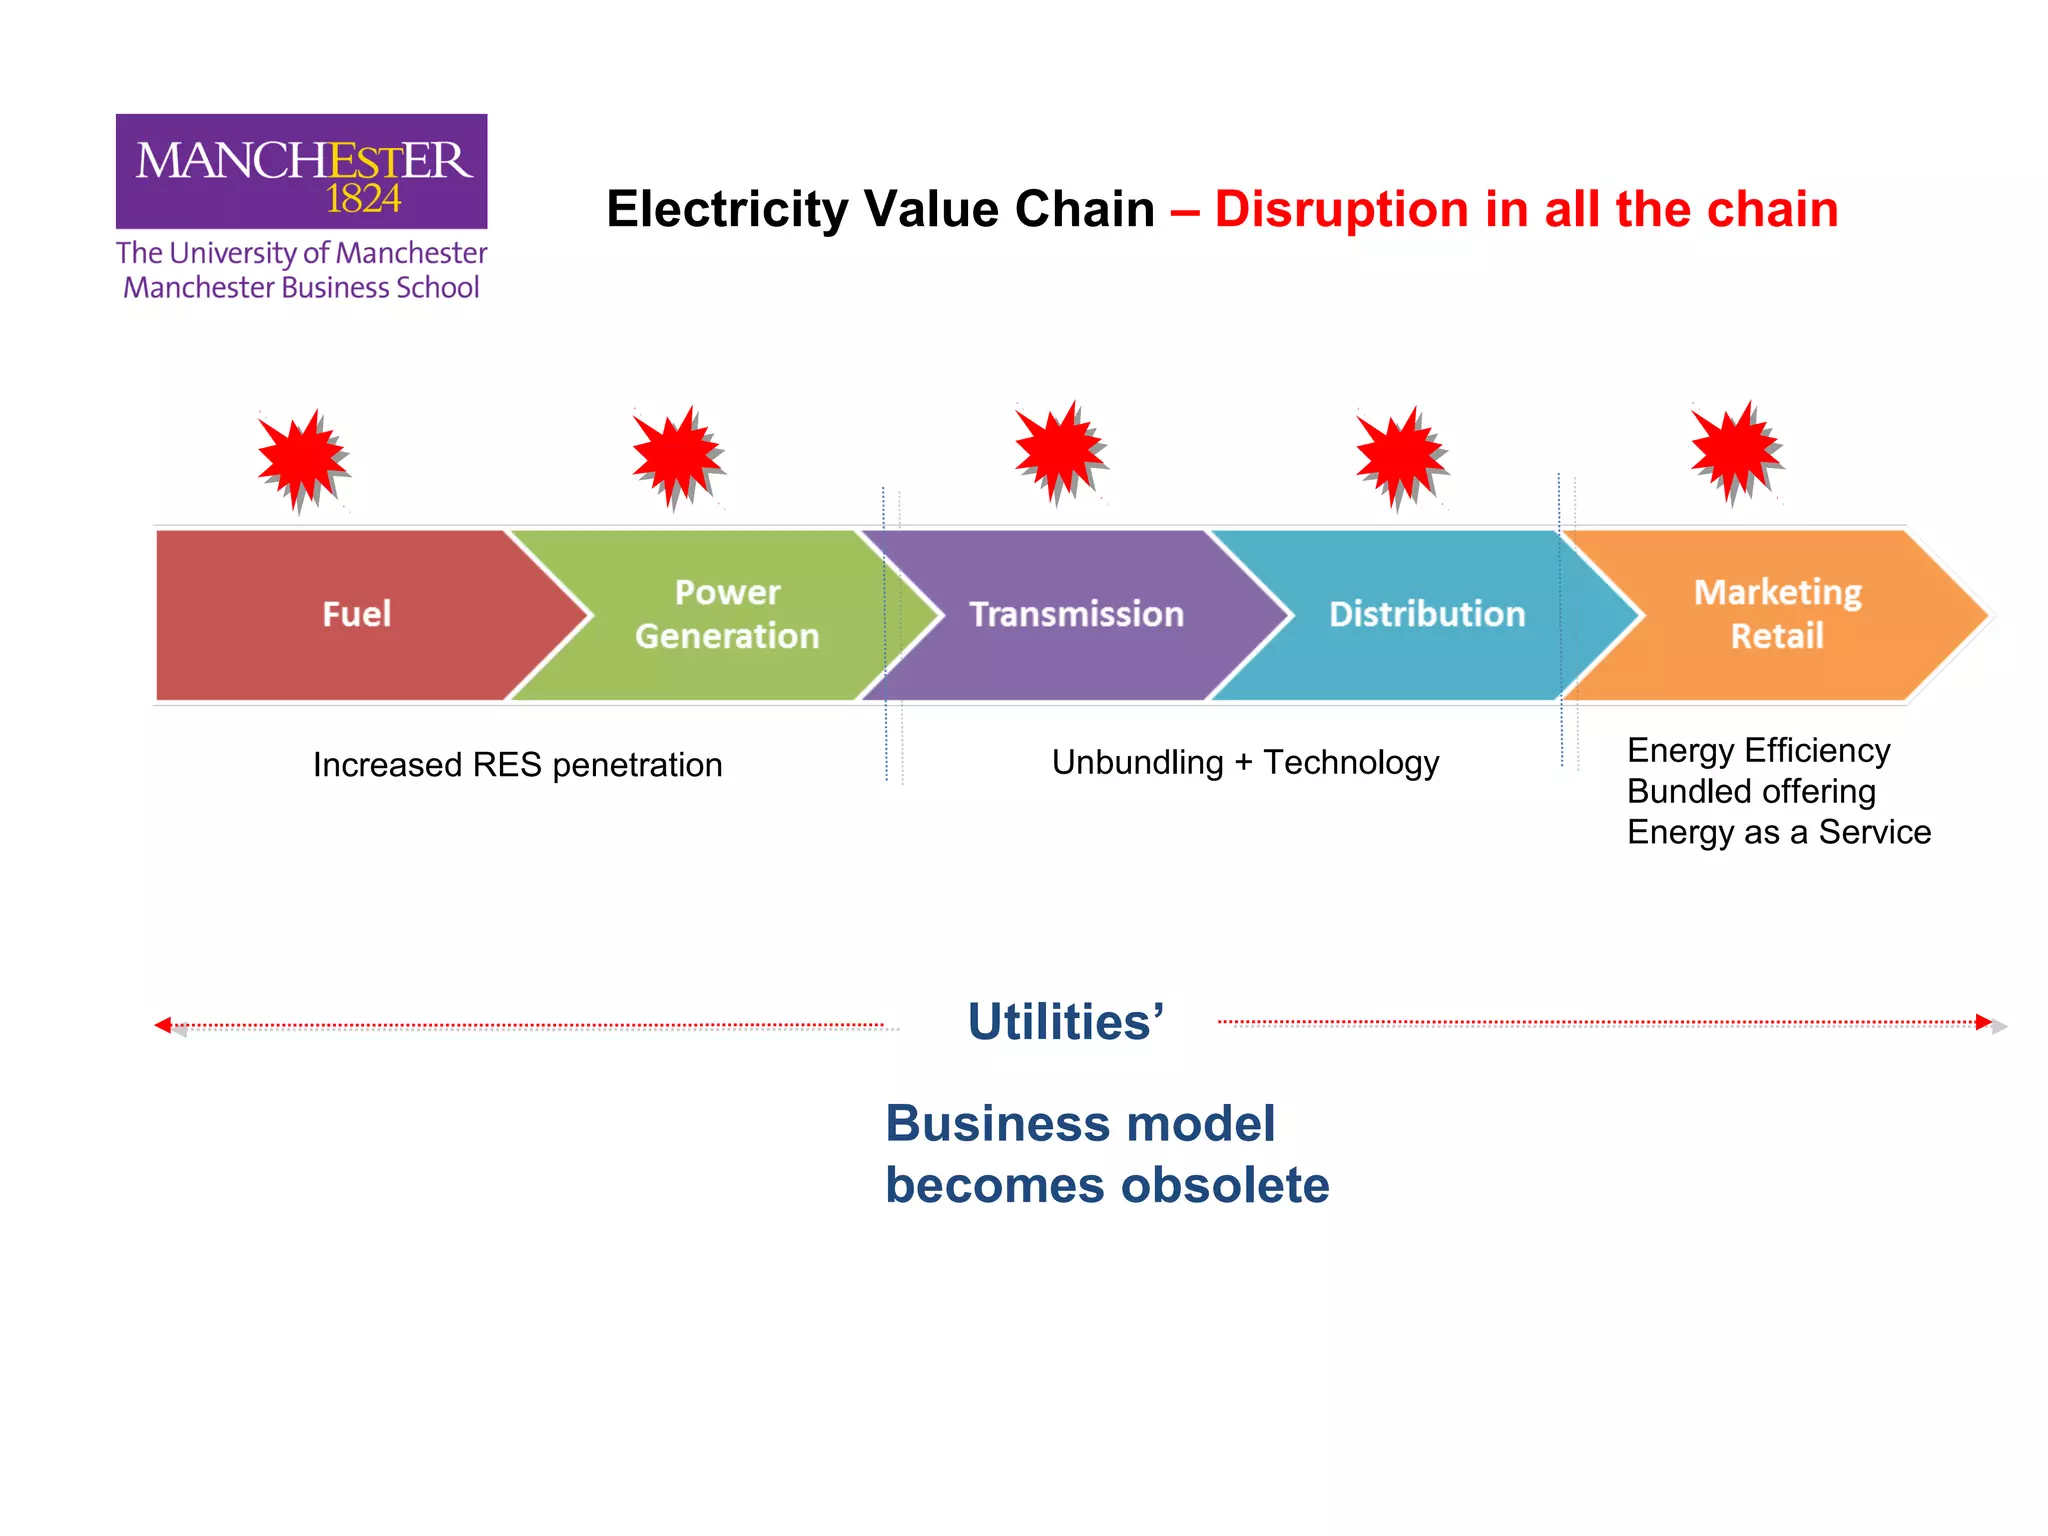


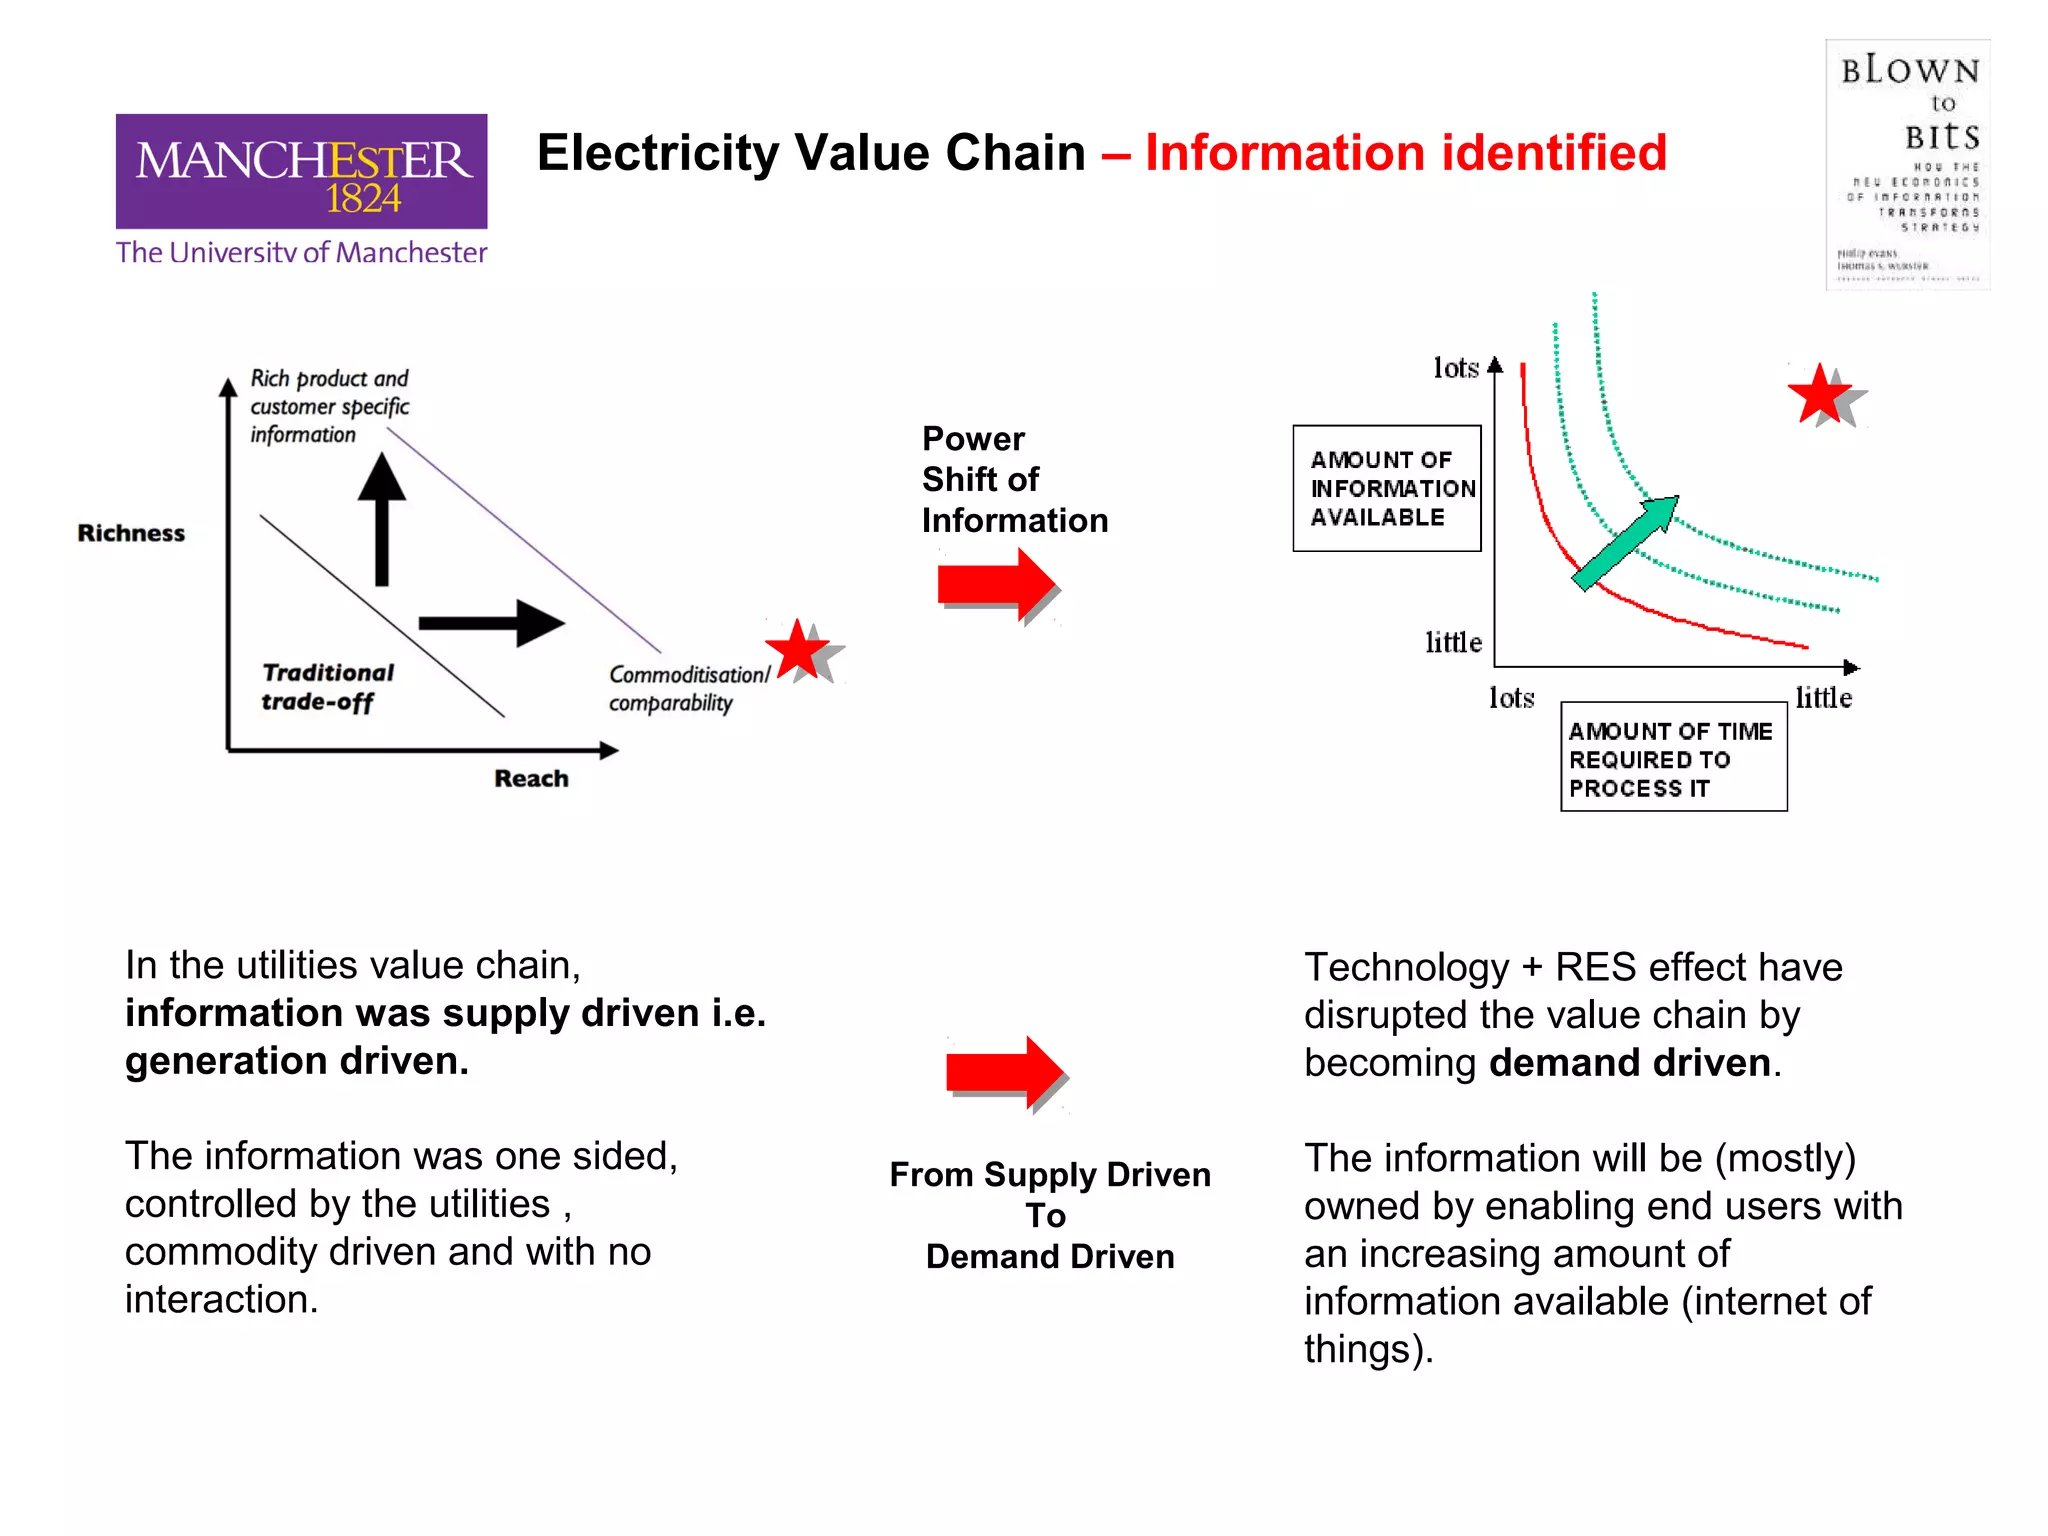


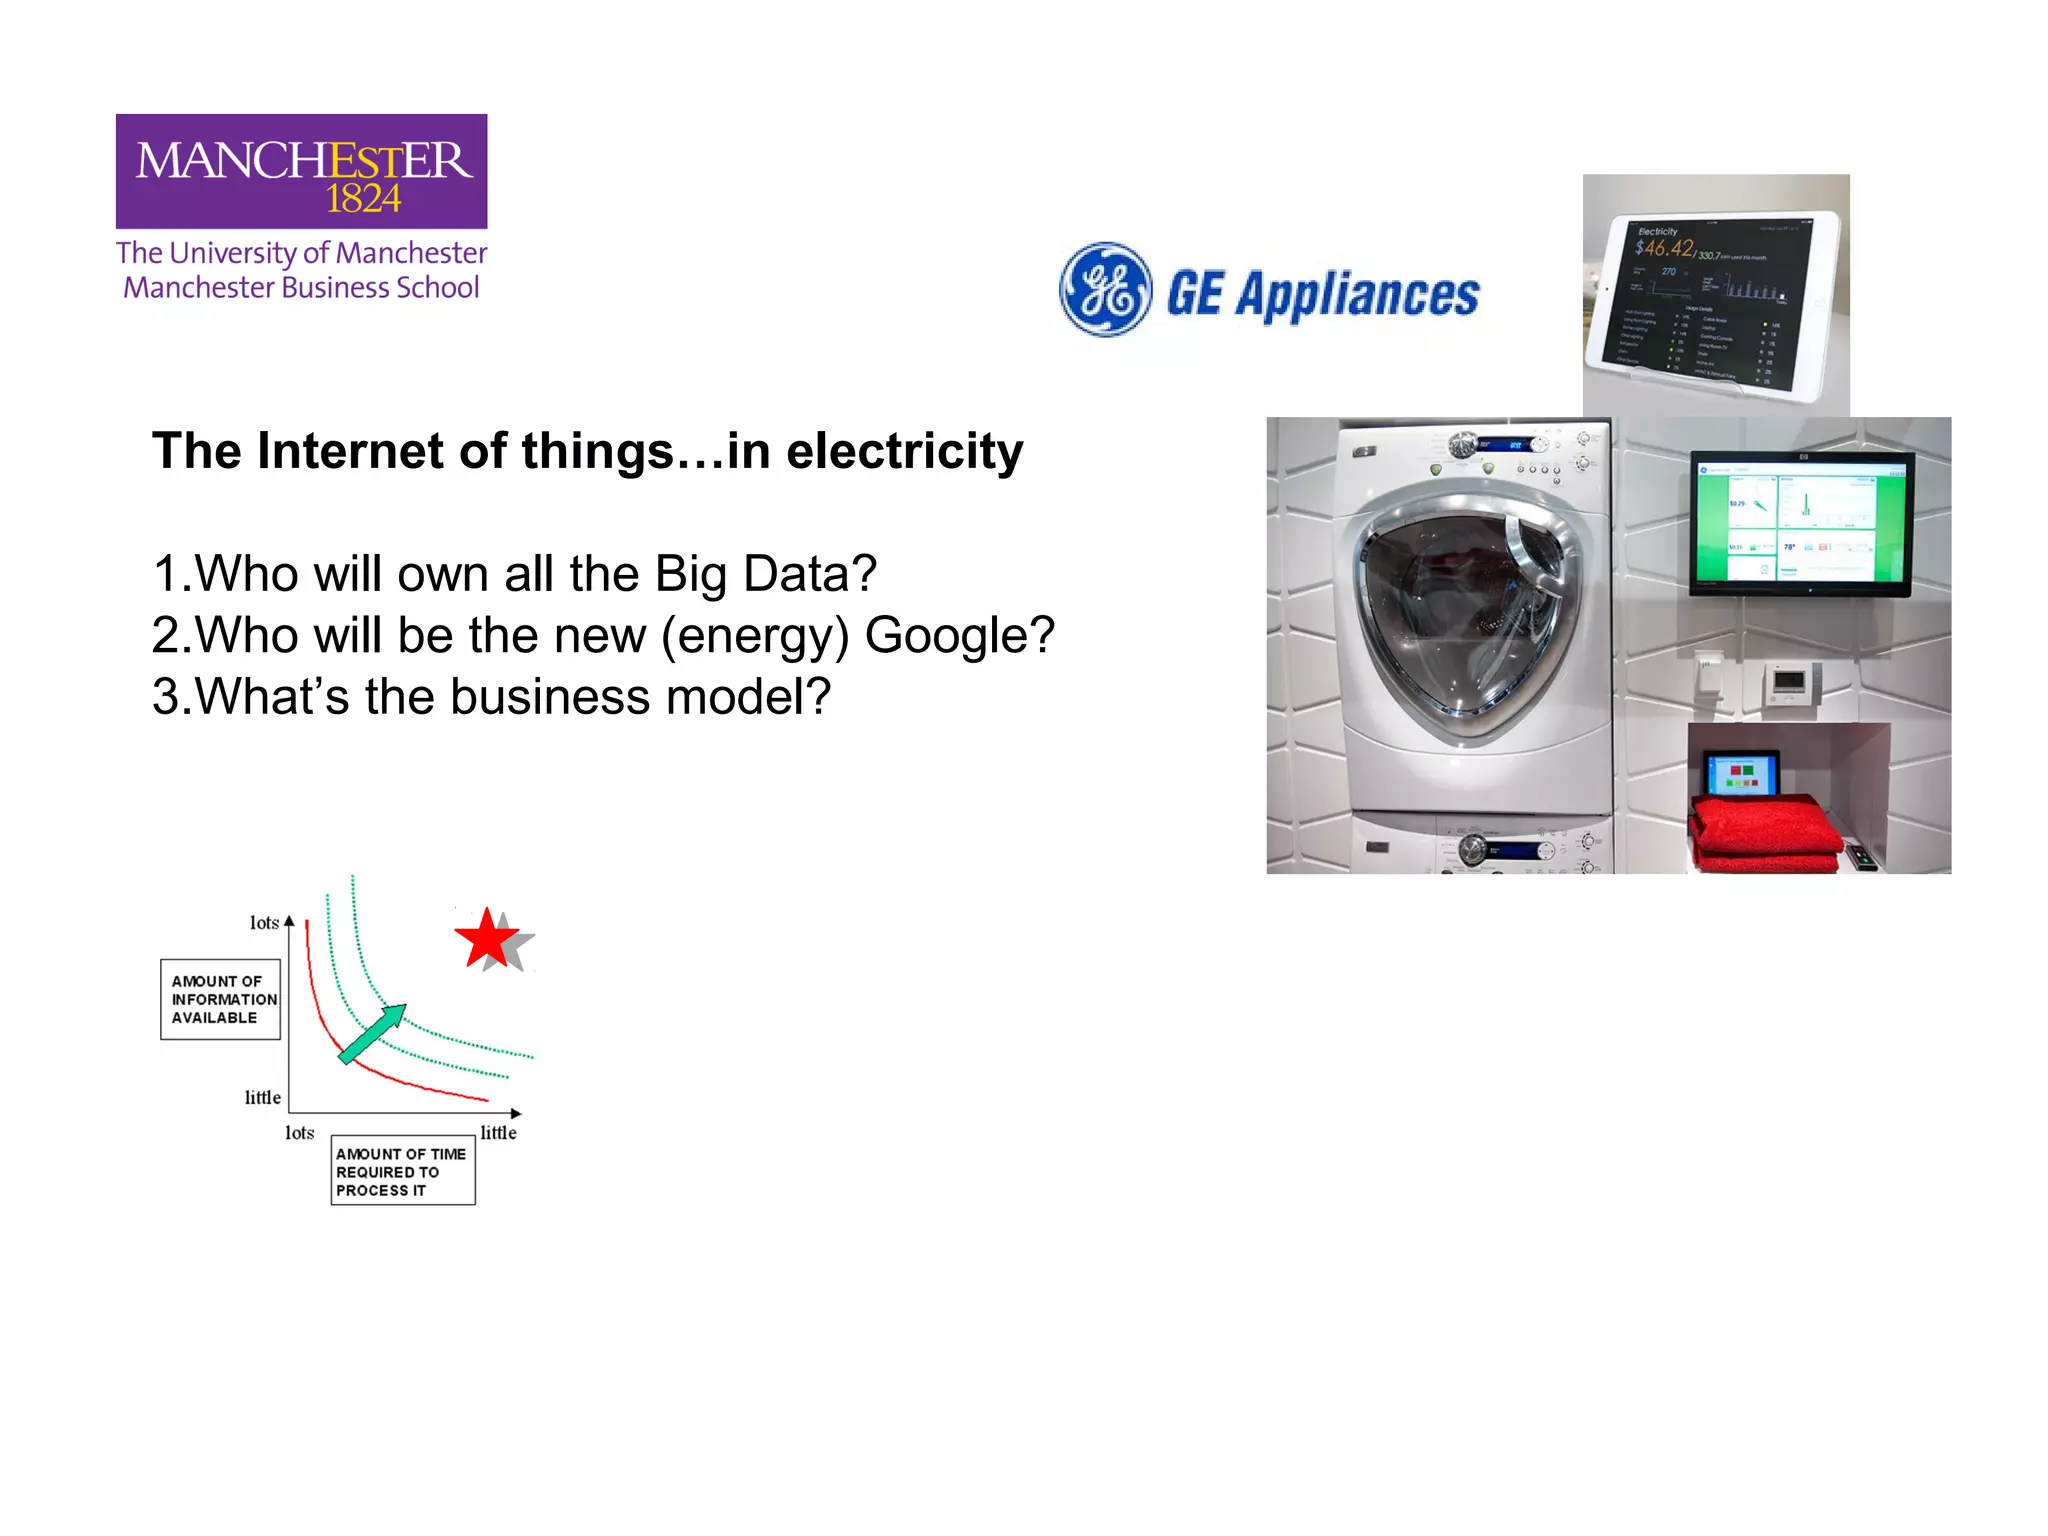


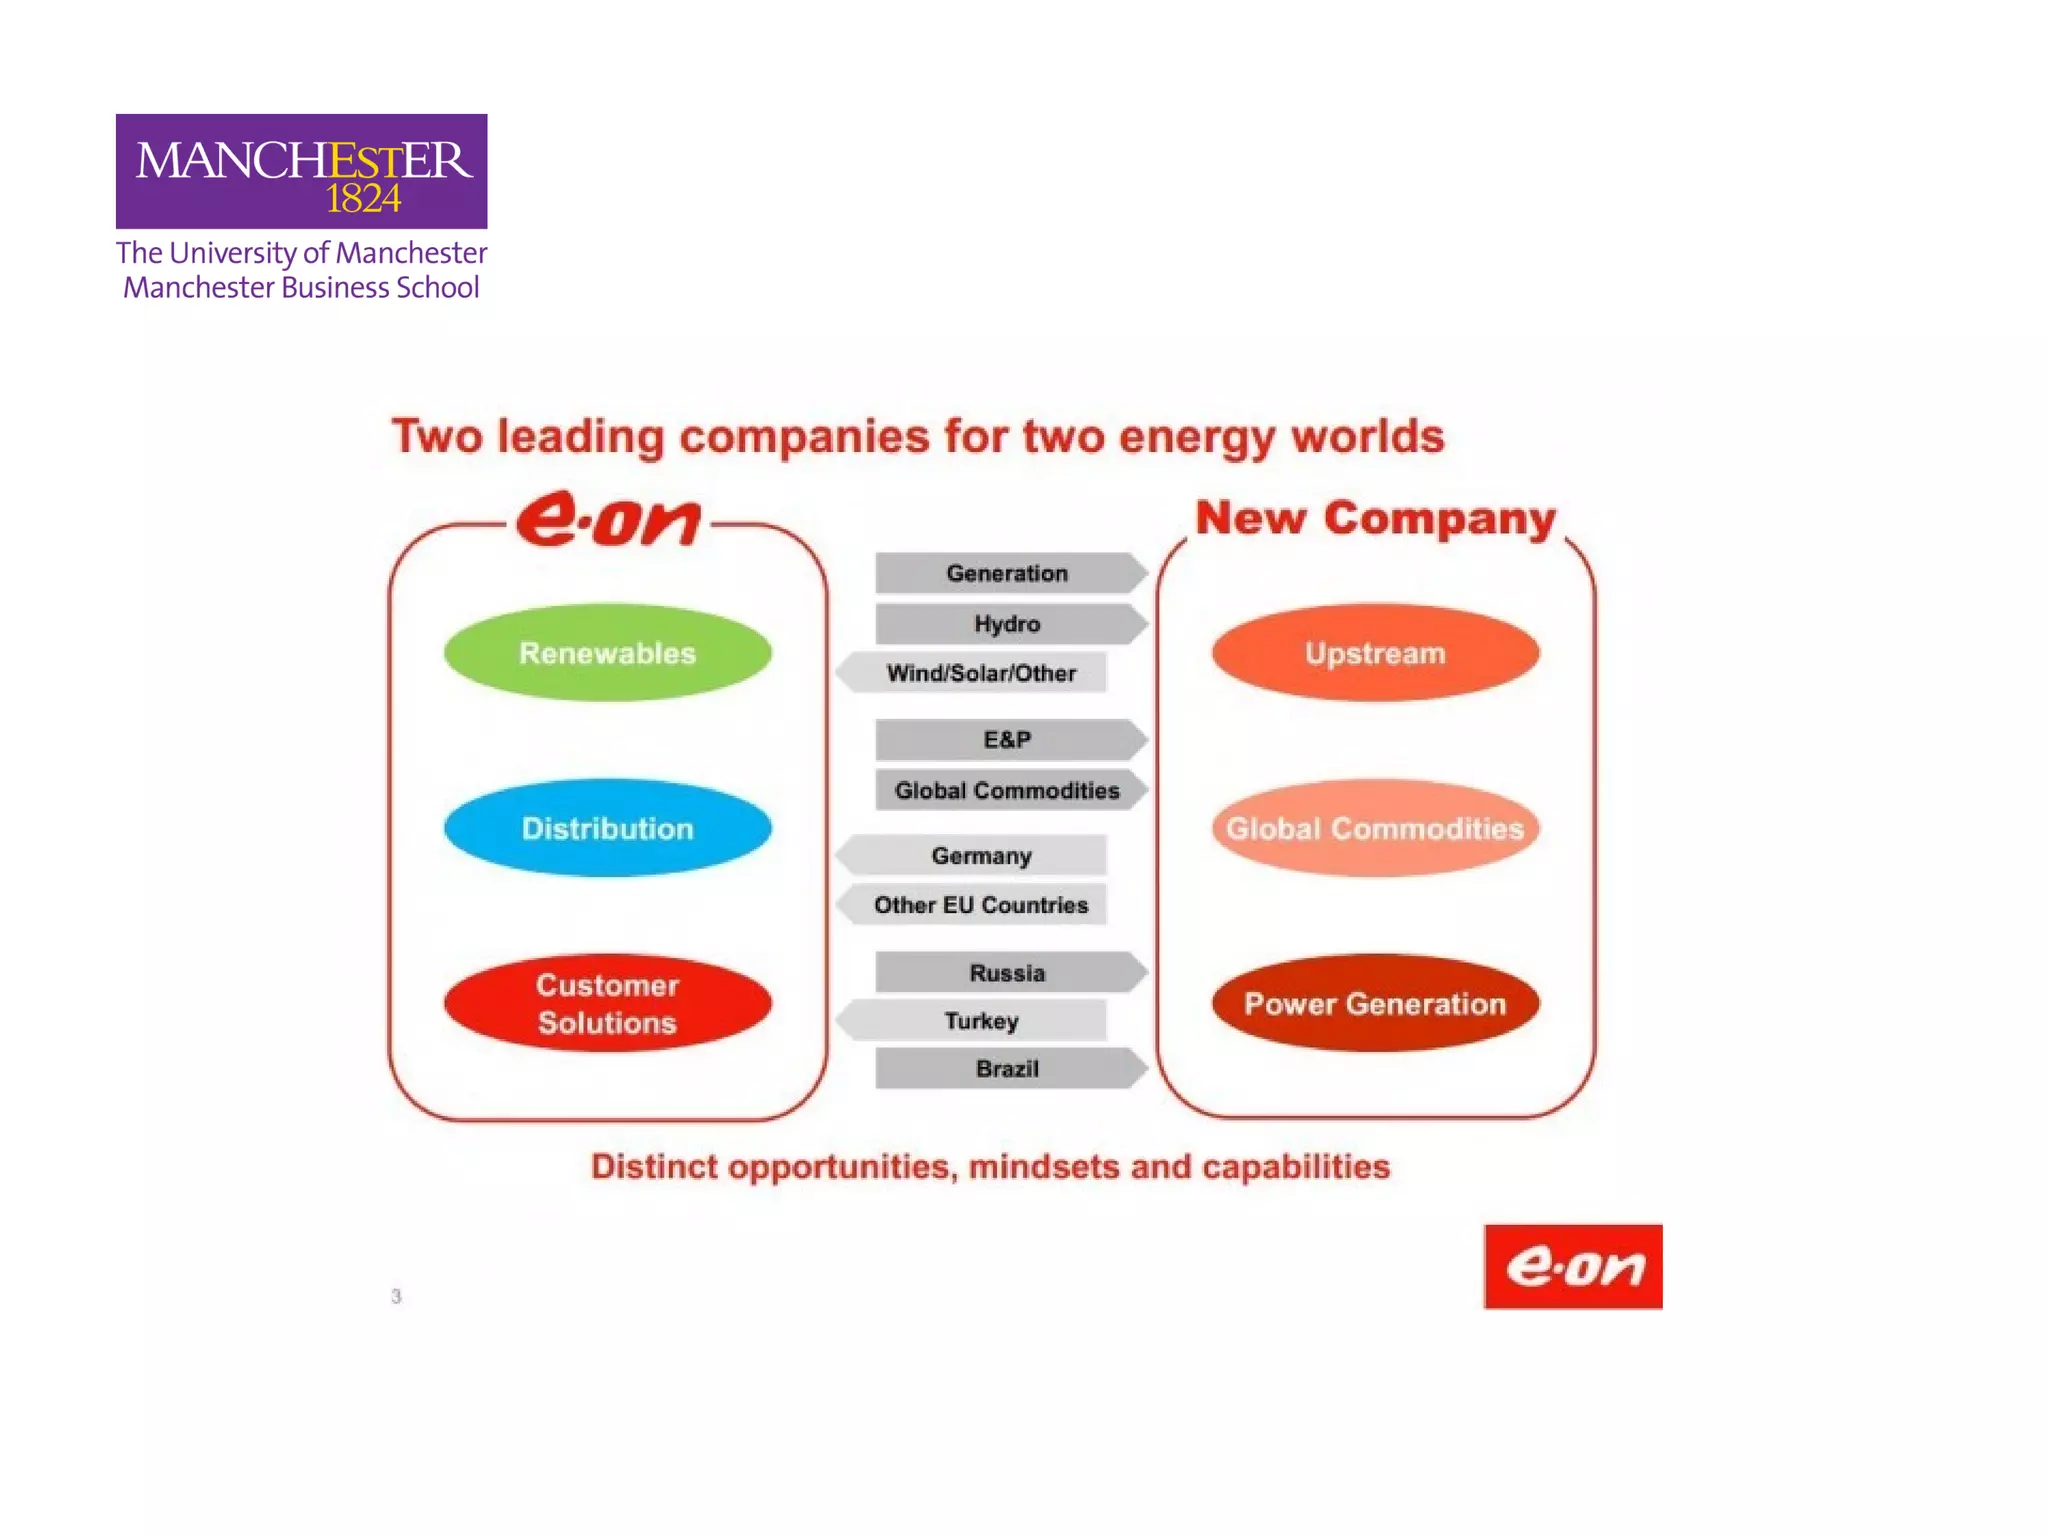
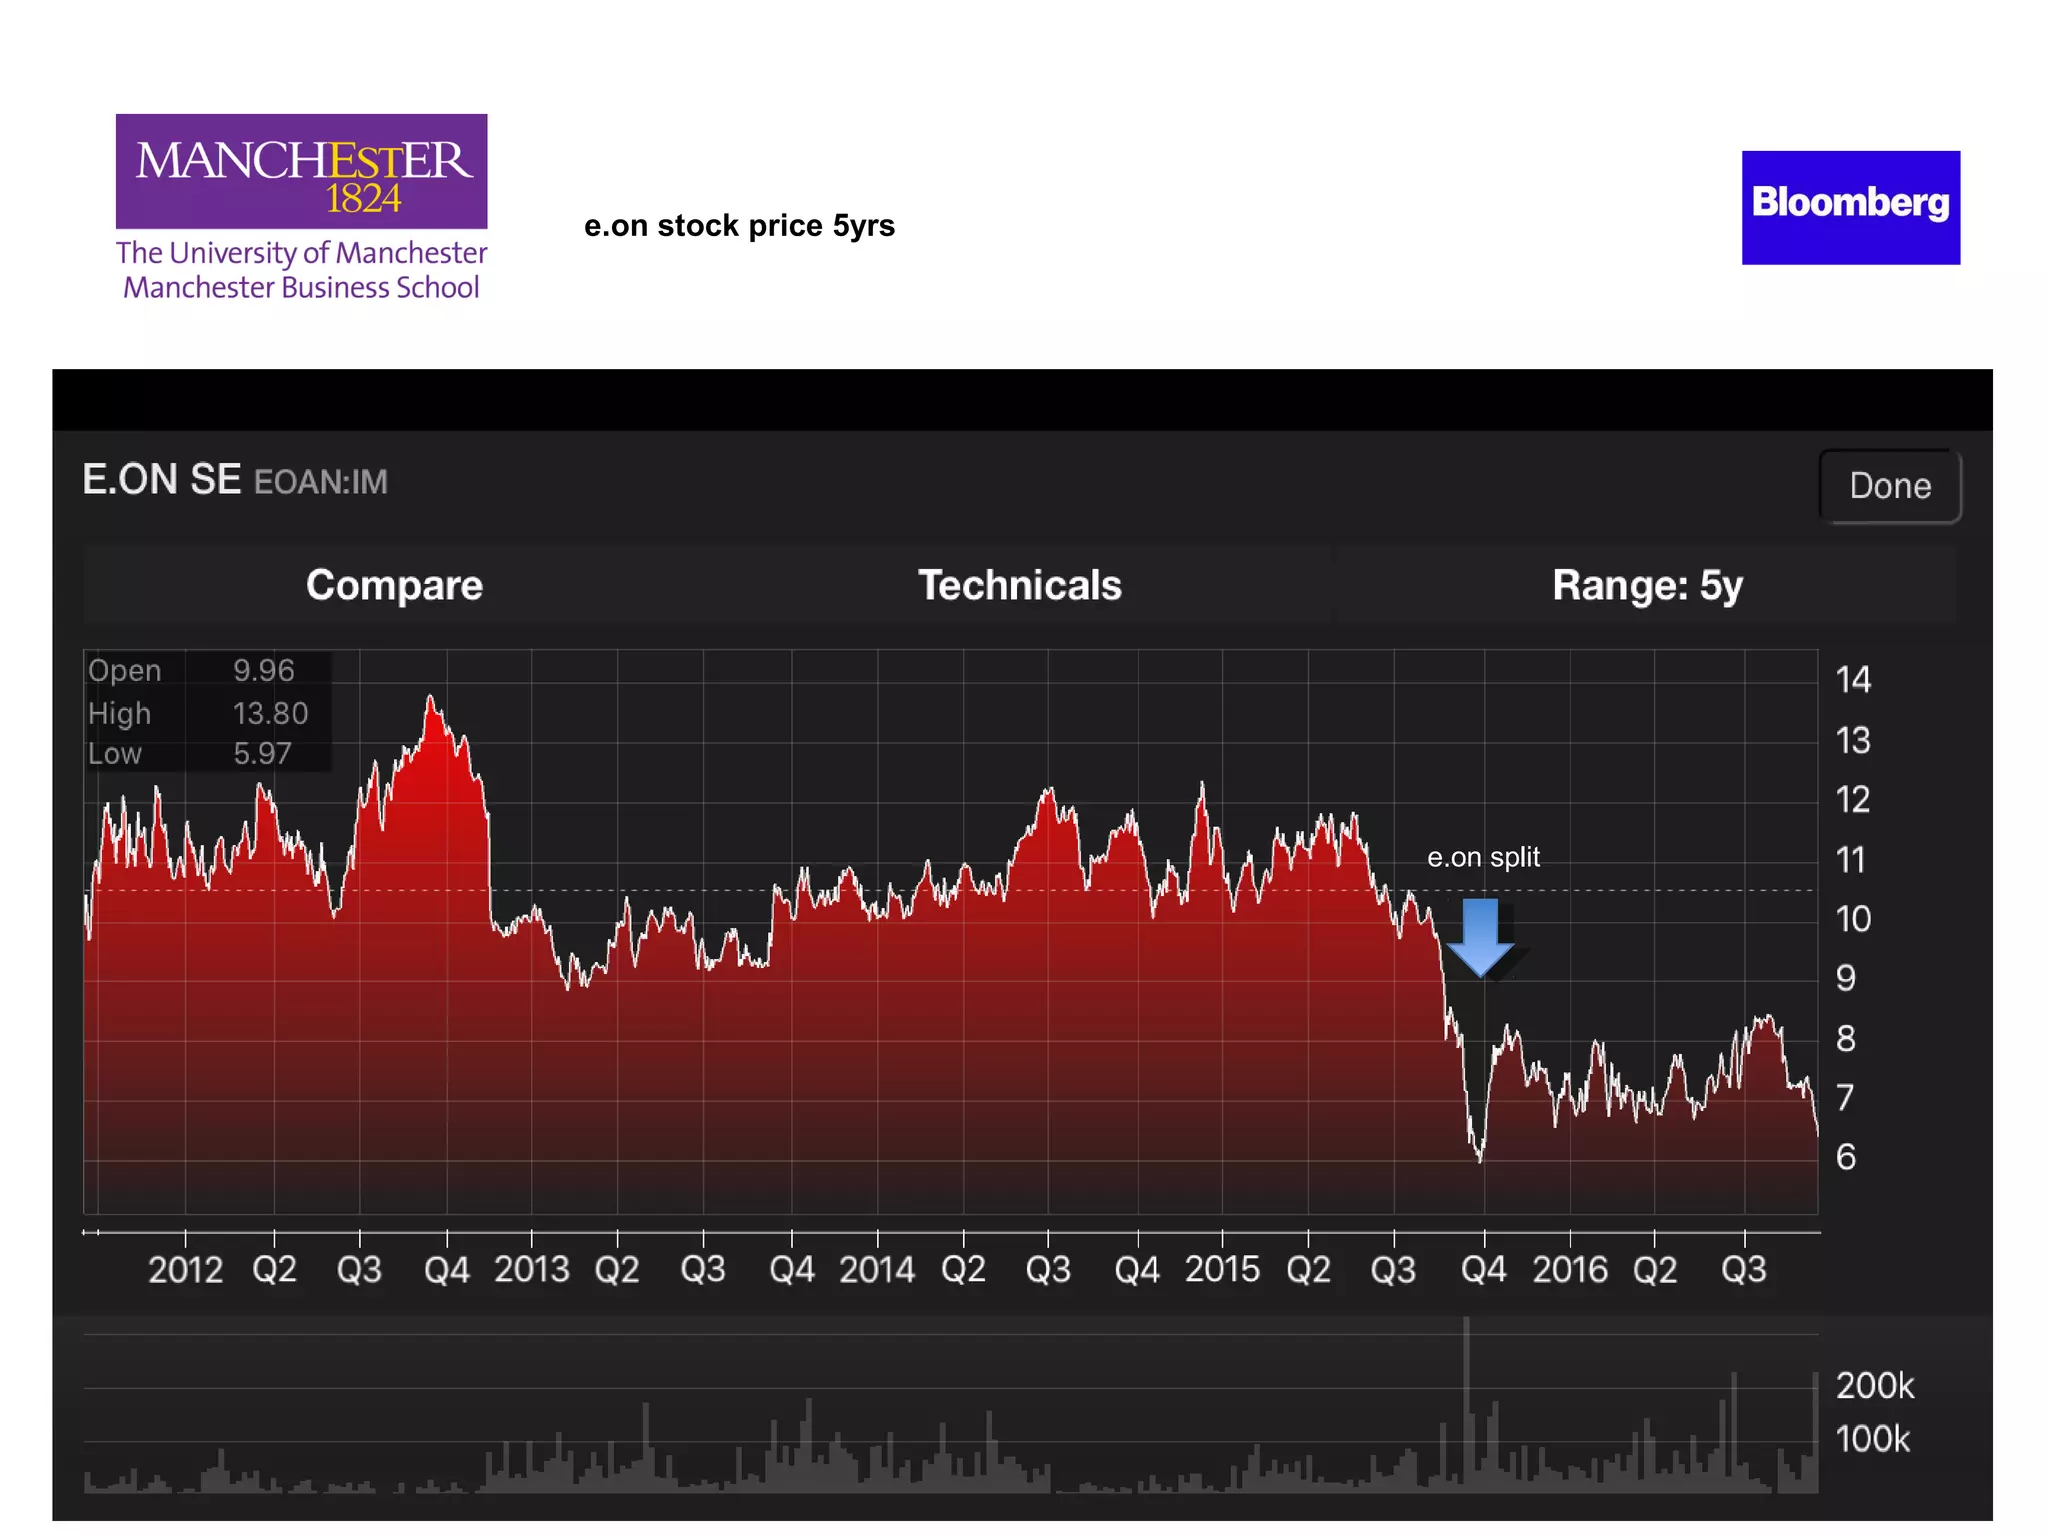

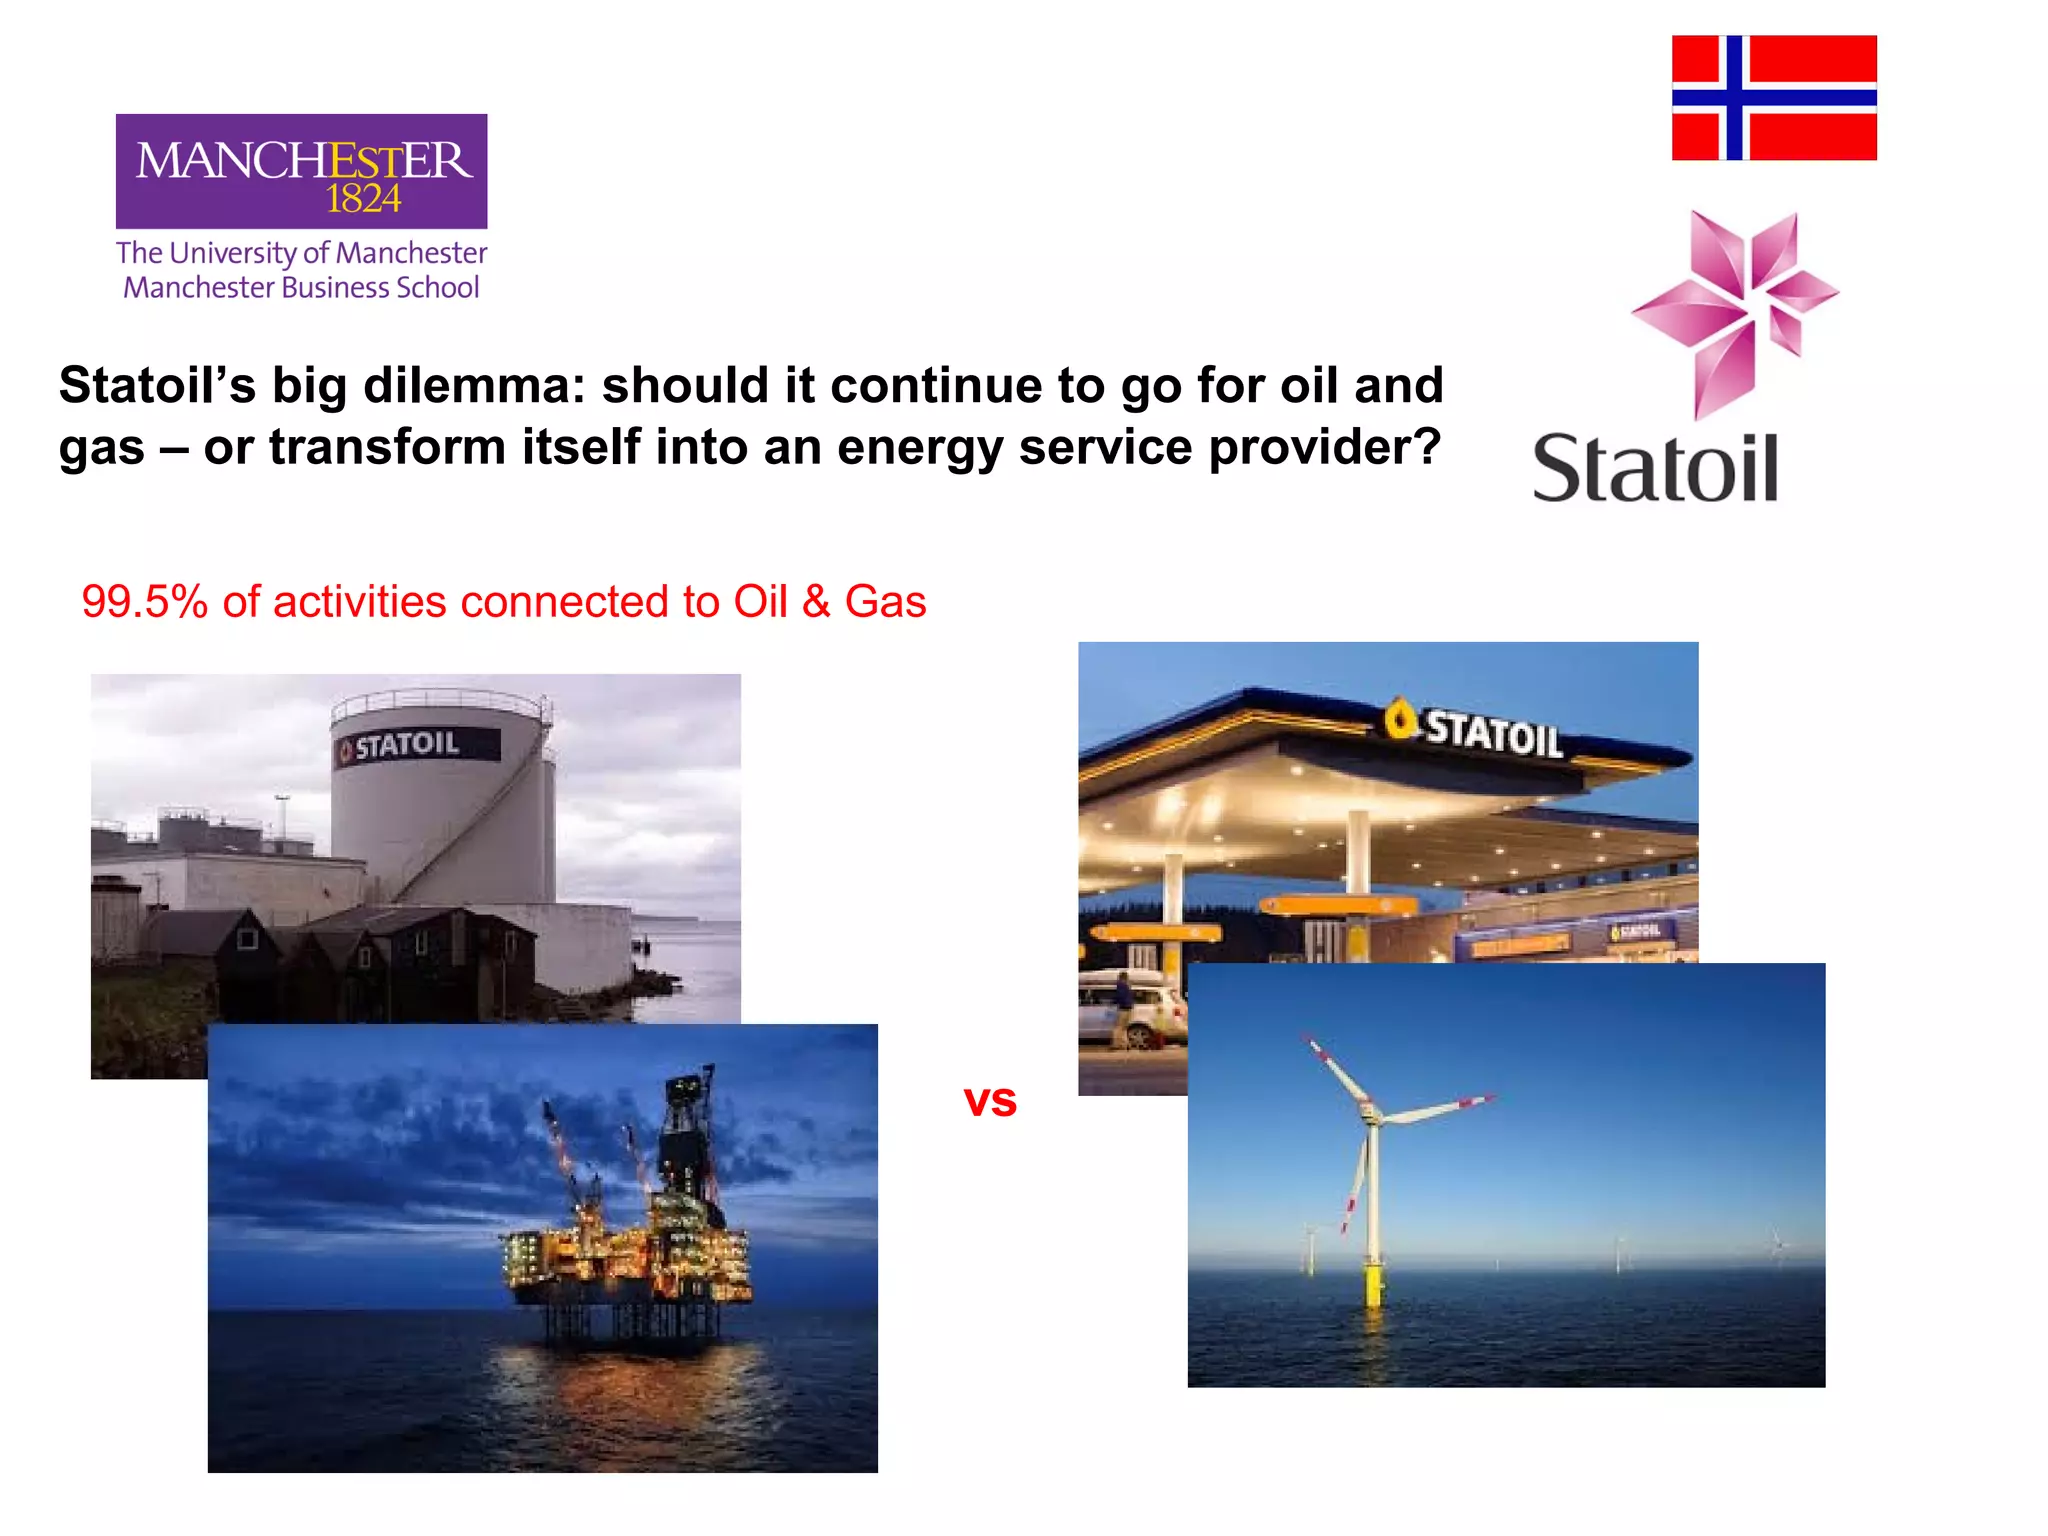


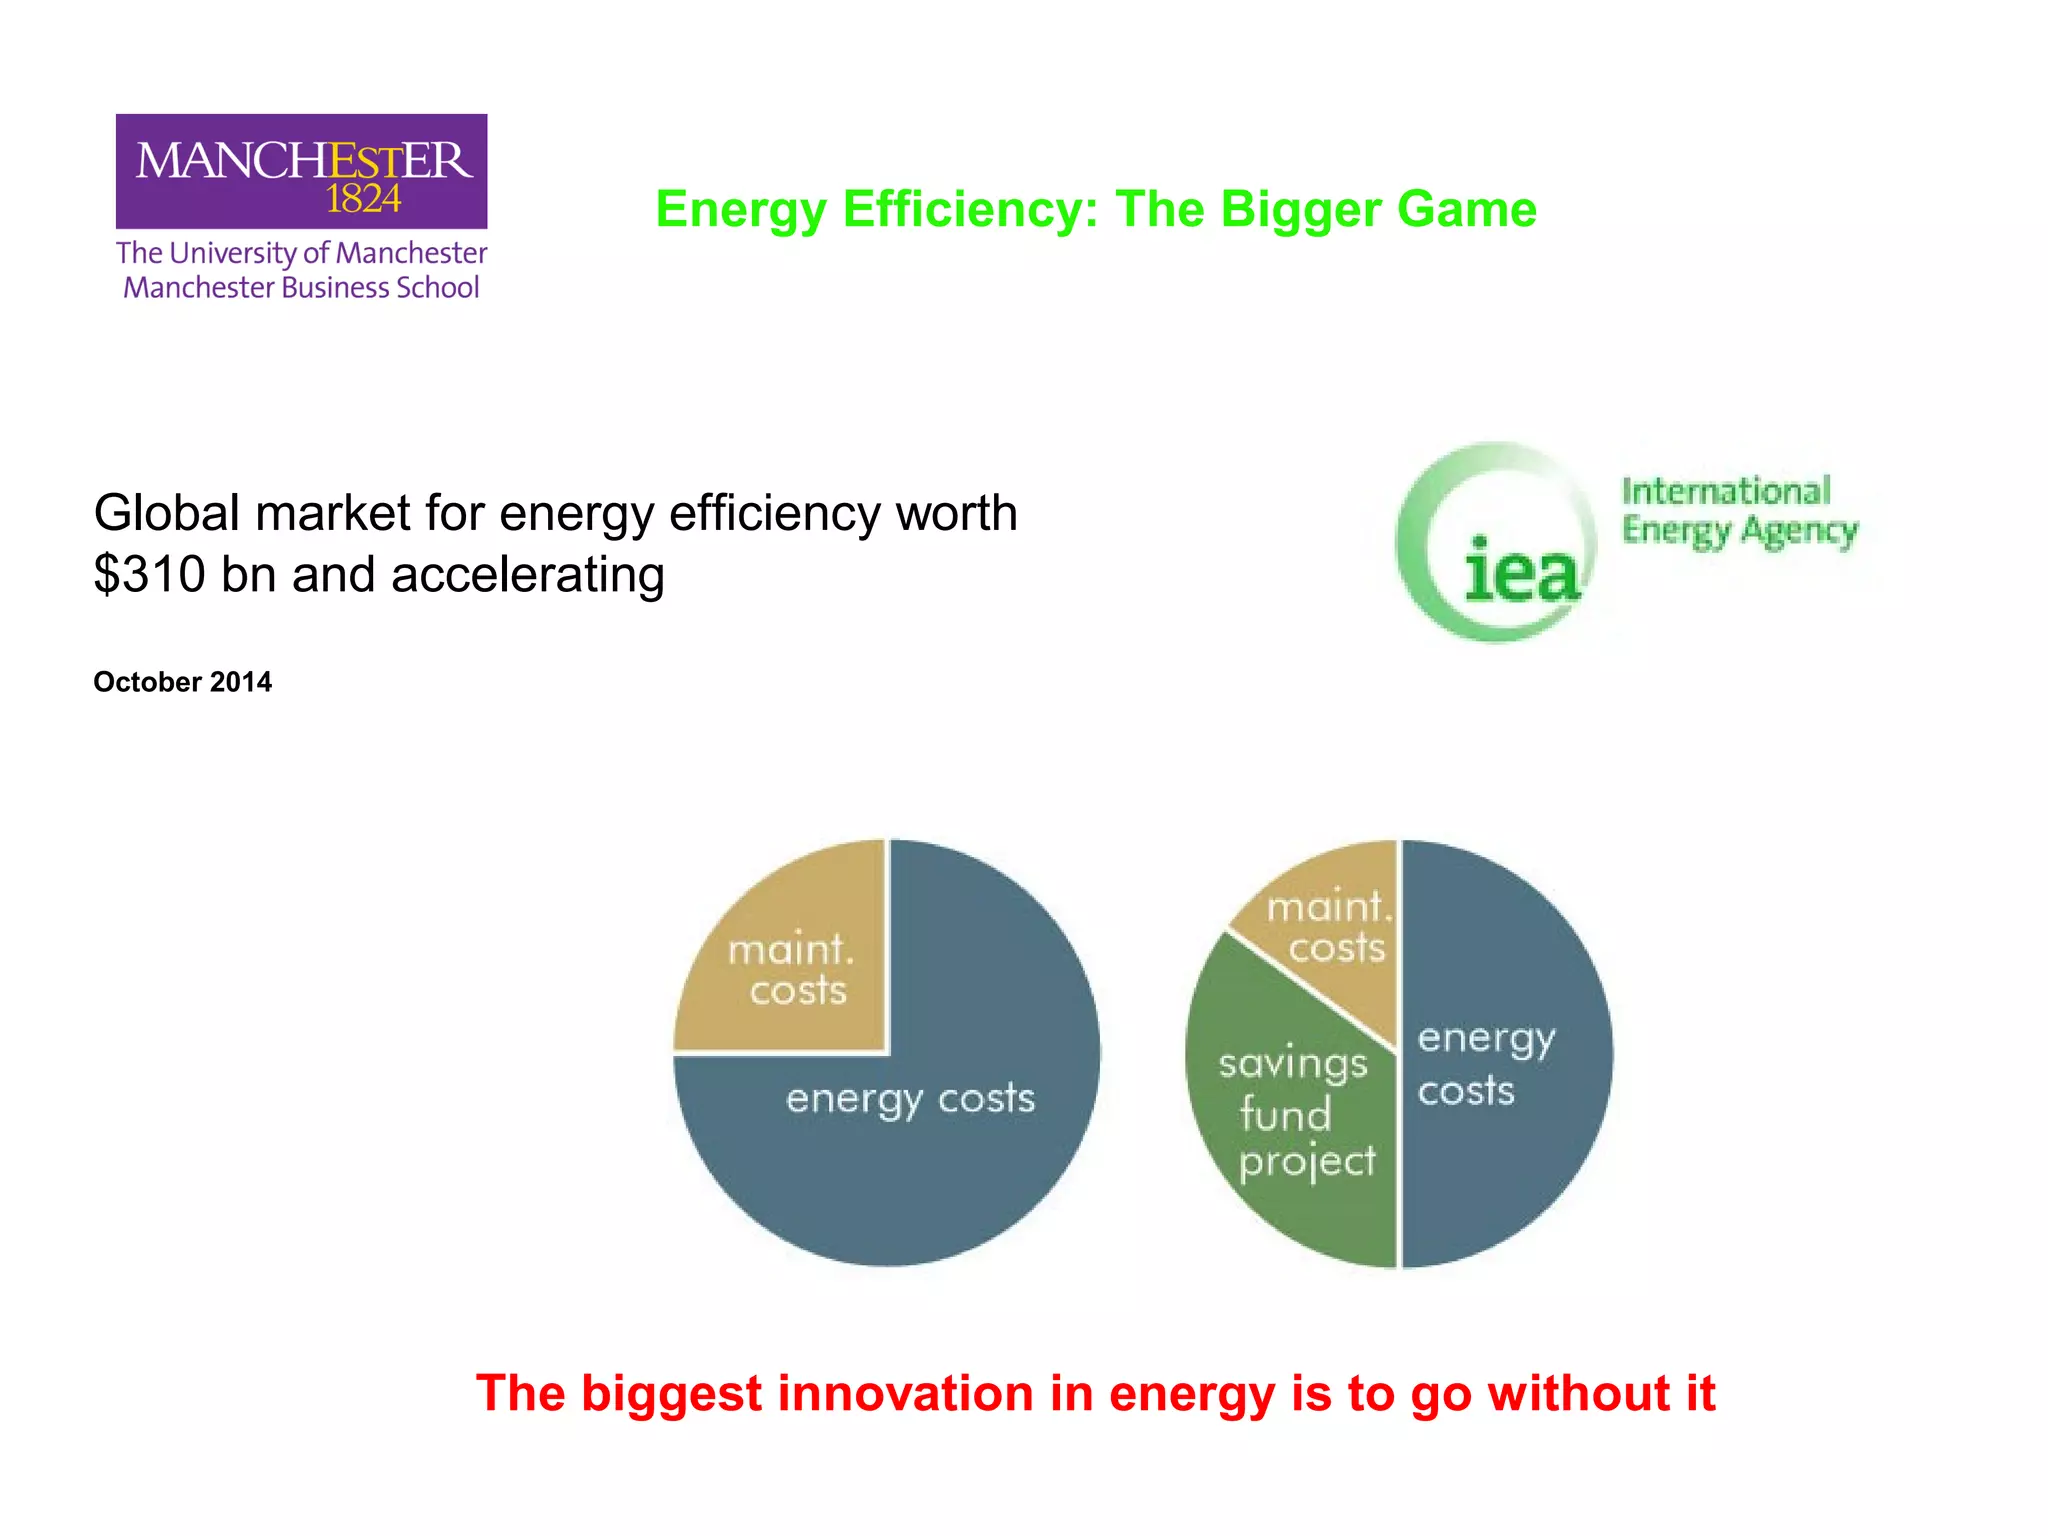


The document provides an overview of trends shaping the future of the energy industry, including shifts in oil, gas, power generation and renewables. It discusses major themes like climate change, the evolution of business models, and the power shift underway in the industry. The presentation covers topics such as global energy outlooks, the oil and gas value chain, the growth of renewable energy sources, climate change impacts on the energy sector, and European energy policies over time. It aims to describe the changing landscape in energy markets and the careers available in the evolving industry.


