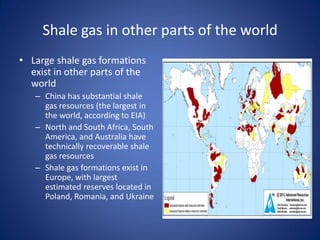
2016 Global economic outlook and socioeconomic imperatives For Nigeria
Shale gas_seminar_HKBU
1. US Petroleum Renaissance: Implications
for World Markets and Asia
Lorna Greening
Visiting Scholar
Hong Kong Baptist University
April 22, 2015
2. Today’s presentation
• Thesis: Renaissance of US domestic petroleum industry
has impacts internationally
– Impacts not restricted to potential exports of commodities,
but also exports of technology and know-how
– However, US experience cannot be directly transferred
• Outline:
– US energy policy and petroleum industry
– Some background on petroleum exploration and
production
– US tight oil and shale gas
– Shale gas in other parts of world
• Developing a shale gas industry
• Shale gas in China
3. US energy policy and petroleum industry
• US energy policy in the roughly two decades following the first OPEC crisis
was characterized by:
– Fears of running out of oil and high prices
– Conflicting objectives of keeping prices low but reducing demand in a chaotic policy formulation environment
– Projects of heroic proportions such as synfuels or nuclear fusion or solar
• Policy and economic conditions that led to decline of US petroleum
industry
– Passage of five pieces of major legislation including the National Energy Conservation and Policy Act, PURPA, the
Natural Gas Policy Act, the Powerplant and Industrial Fuel Use Act, and the Energy Tax Act
– Glut of oil appeared on world markets due to price-induced conservation and failure of cohesion within OPEC
– In 1980, the Crude Oil Windfall Profit Tax Act was enacted
• Act was intended to recoup revenue earned by oil producers as a result of sharp increase in oil prices brought
about by OPEC oil embargo
• Tax was actually an excise tax, and generated only 20% of the projected revenues
• Since the tax was only imposed on domestic production, crude imports actually increased and caused domestic
oil production to decline until 1986 when crude prices fell below the base price
• Tax distorted how resources were allocated in the industry between upstream and downstream operations
– In 1981, world economy went into one of worst recession since the 1930s
• Demand for crude fell sharply with corresponding decline in prices by 35% between 1981 and 1984
• Higher prices in 1980 resulted in stagflation, decline of heavy manufacturing capacity, and a loss in productivity
• This was accompanied by higher interest rates for capital
4. What Happened to Hubbard’s Peak?
• Hubbard’s peak is based on the premise that conventional oil
resources are finite in any geographic region
– US peak oil was achieved in the 1970 with production of 10.2 m B/D
– World peak oil was expected around half a century after the initial
publication of the theory in 1956 with OPEC extending the peak out by
about 10 years
• Unconventional oil and gas resources have disrupted this
relationship
– US proved reserves (conventional and unconventional) total 22.3
billion barrels and reserves of natural gas total 272.5 trillion cubic feet
– Undiscovered technically recoverable oil are estimated at 139.6 billion
barrels, and natural gas at 1445.3 trillion cubic feet
– Since 2008, US oil production has increased by approximately 25% and
imports have declined from 60% to 42%
– The US has now overtaken Russia as the world’s largest natural gas
producer
– Refined product exports are now averaging almost 3 m B/D
5. Conventional versus unconventional resources
• Conventional hydrocarbons: drilling into an accumulation
results in flow of fluids to the surface
• Unconventional hydrocarbons: requires stimulation for
flow to occur, e.g., hydraulic fracturing
• For both, the interplay between technology and economics
determines whether an accumulation will be produced
6. Shale reservoirs
• Typically function as both reservoir and source rock, i.e., self-
contained source-reservoir system
• Extremely tight with pores in the range of nanometres and
permeabilities in range of nanodarcies
• Require two technologies for exploitation: horizontal drilling and
hydraulic fracturing
7. Tapping the Riches: Tight Crudes and Shale Gas
• According to the USGS, whose numbers are generally more
conservative than industry estimates which are more than twice to
three times those of USGS, the US has as a resource base:
– 46 different potential shale gas targets with an estimated 95% confidence interval
of 318.4 to 935.8 TCF of natural gas and 12541 million barrels of natural gas liquids
– 23 different potential tight oil targets with an estimated 95% confidence interval of
5048.9 to 12497.2 million barrels of crude
– Some of these potential targets are stacked as in the Eagle Ford making the
economics more attractive
• Large shale gas reserves have major economic and other
implications
• Efficiency gains are reducing finding costs as experience is gained.
– Costs for a Bakken well declined by about 29% during 2012 and a well now costs
approximately $6.5 million to drill
– Efficiency gains result from increased pad drilling, determination of the optimal
number of frack stages and lateral lengths, and a reduction in cycle times
• However, wells in tight oil plays have steep decline rates, averaging
between 65-75% during their first year of production
9. Economics of US tight oil
Even with a decline in world oil prices over six months to
below $60/bbl ($55-$56, April, 2015), US tight oil is economic
0
10
20
30
40
50
60
70
80
90
100
Bakken-Sanish
Bakken-Moutrel
Bakken-Messach
Perm.-BoneSpr
Bakken-WestNesson
Perm.-Wolfcamp
Perm.-DelawareSands
Perm.-Wolfberry
ThreeForks-Nesson
Bakken-DunCo
EagleFord
ThreeForks-Sanish
Bakken-S.McKenzie
Bakken-N.Nesson
Bakken-Dun&BurkeCo
Bakken-Montana
ThreeForks-McKenzieCo
US$/Barrelofoil
10. Impacts of US Abundance on World Oil Markets?
• World oil prices are determined by global supply and demand
• For the first time since the 1960s, the US may achieve energy
independence and may become the world’s leading oil producer by 2020
– The IEA in November, 2012 predicted that North America would become “a
net oil exporter around 2030”
– Implications for security and trade:
• Incremental oil production would be large enough to more than moderately diminish
exposure to Middle East politics
• Expanding US production will reduce the trade deficit and reduce costs to consumers
• OPEC controls on oil prices are diminishing; and, Russia’s power over
European gas supplies is declining as a result of shifting LNG to those
markets
• Disruption of US tight oil development by OPEC is unlikely
– In the mid-1980s and again in the late 1990s, OPEC boosted their production
triggering low prices that killed development of more expensive sources of oil
– Social and political turmoil in the Middle East requires OPEC to maintain
revenues
– Saudi Arabia needs oil prices on average at $70-$85 per barrel; and, tight oil
producers need prices of $50 to $80 to achieve returns on capital
11. Can US Crude be Exported?
• New sources of crude have been hailed as a means of
reducing the trade deficit through exports
• Crude oil exports are prohibited from the US by statute which
list crude as a commodity in ‘short supply’
– Energy Policy and Conservation Act (1975)
– Mineral Leasing Act (1920)
– Outer Continental Shelf Lands Act Amendments (1978)
– Navel Petroleum Reserves Production Act
• Crude exports, even to Canada, require a ‘swap arrangement’
whereby
– US crude is exchanged for more or better crude and products
– Contracts can be interrupted if necessary
– Swap is needed for refining or marketing reasons which are beyond the exporter’s
control
• US international trade commitments may limit the ability to
prohibit exports (Depends!)
• Exports of refined products are not under these restrictions
12. Economics for US shale gas
Even with US natural gases at an all time low down
by 42% in a year ($2.83/mmBtu in March, 2015),
some plays are still economically viable
$0.00
$1.00
$2.00
$3.00
$4.00
$5.00
$6.00
$7.00
SWVernonia,LAWest
Meca/Ls-NEPA,Tx
Haynesville-Core
Haynesville-Tier1
Fayetteville
BarnettCoreWet
BarnettCoreDry
BarnettTier2Dry
Haynesville,TXExtension
Vercelus-'C'Courilee
EagleFord-DryGas
MarcellusWVT2
$/Mcf
13. Can Excess Gas be Exported?
• Currently, the price differential between the US and other points in the
world promotes trade
• However, natural gas exports require the approval of US DOE
– Currently, there are fifteen export permit approvals pending
– Approval is basically automatic for countries that have free trade agreements
(FTA) with the US
– For non-FTA countries, DOE must do a thorough review of the “public interest”
(economic, energy security, and environment) before allowing export.
• Non-FTA countries include Japan, China and India.
– Maximum total volumes exported to non-FTA countries from the 15 pending
and one approved facility are estimated to be 23.71 Bcf per day
• In addition to DOE approval, LNG project developers must receive
approvals from the FERC
• Further, US energy-intensive industry and power generation oppose
exports as increasing volatility and hurting competitiveness
• In addition to the hurdles posed by regulation and public opinion, LNG
export projects face high capital costs, and significant commercial risks
from price volatility and competition
14. LNG markets
• LNG is not a new concept
– In 1964, U.K. became world’s first LNG importer and Algeria the
first LNG exporter
– In 1969, Alaskan LNG was sent to Japan
• By 2008, North America’s substantial unconventional gas
reserves and the rising Asian demand for natural gas
altered the economics of LNG
• Over the last several years, large scale tanker delivery has
become economically feasible
– U.S. is currently importing natural gas from Europe, the Middle
East, Latin America, and Africa
– U.S. is exporting to Canada and Mexico, Europe and Asia, and
Brazil and India
15. Future of Asian markets
• Asian consumption is much larger than Asian production
– China, Japan, and South Korea are currently major natural gas consumers
– Qatar has been exporting natural gas to the Asian
– U.S. has also started exporting LNG to Japan and some other Asian countries
– Gazprom, too, has been trying to improve its position in this market
16. Global LNG prices
• All large countries
producing natural gas (with
the exception of
Netherlands and Norway)
are interested in making
long-term contracts with
Asian buyers
• Price spreads between the
U.S. and Asia make Asian
markets particularly
attractive targets for US gas
production
17. Shale gas in other parts of the world
• Large shale gas formations
exist in other parts of the
world
– China has substantial shale
gas resources (the largest in
the world, according to EIA)
– North and South Africa, South
America, and Australia have
technically recoverable shale
gas resources
– Shale gas formations exist in
Europe, with largest
estimated reserves located in
Poland, Romania, and Ukraine
18. Shale gas technologies: US major export
• Major improvements to shale gas extraction technologies that have been
made between the last six to eight years are also impacting the global
natural gas market
• These technologies have been widely tested in the U.S. by international oil
and gas companies
• Involvement of these companies might potentially support fast and
successful shale gas development in Ukraine in particular
– At the end of January 2013, Ukraine signed a 50-year shale gas production sharing agreement
with Royal Dutch Shell; this agreement involves commercial shale gas extraction in the
Yuzivska gas field by 2017
– In November 2013 Chevron signed a 50-year agreement with the Ukrainian government to
develop oil and gas in Western Ukraine
– In the same month, the Ukrainian government signed another production-sharing agreement
with a consortium of investors led by Italian energy company Eni to develop unconventional
hydrocarbons in the Black Sea
– Various oil companies, including Chevron, Shell, ExxonMobil, Repsol, and PetroChina have
shown interest in developing their offshore energy assets in Crimea
19. Developing a shale gas industry
• To realize large scale shale gas development two aspects are crucial:
– Core technologies: horizontal drilling, hydraulic fracturing, micro-
seismic
– Effective management and achievement of development objectives at
reasonable cost through use of integrated and economic cost
management
• Fundamental economic problem for development of shale gas: How
to lower costs through investments in drilling and innovation?
• Two stages:
– First stage involves development of cost-effective extraction
technologies, which can only be achieved through learning by doing
and innovations
– Second stage occurs once technologies are proven cost-effective, and
includes scaling-up to increase production and further improve
technologies and techniques
20. Factors that led to development of US
shale gas
• Stage 1: Innovation
– US government policies promoting R&D and oil
industry R&D
– Incentive pricing and tax credits
– Private entrepreneurship
• Stage 2: Scaling up
– Presence of profit-seeking firms
– Two government policies
• Deregulation of wellhead natural gas prices
• Open access to interstate natural gas pipelines, i.e.,
interstate pipelines offer transportation services only, on a
nondiscriminatory basis
21. Shale gas geology in China
• Geology of shale gas resources in China is considerably less
favorable than it is in North America
– Considerable structural complexity, with extensive folding and
faulting, appears to be significant risk for shale development
– Significant innovations in fracturing technology will be needed
• However, preliminary surveys estimate exploitable shale
gas reserves to be 25.1 trillion cubic meters (886 trillion
cubic feet)
– Volume sufficient to satisfy China’s gas needs for potentially
next two centuries
– Technically recoverable reserves 67% greater than US
– Chinese shale gas production exceeded 200 million cubic meters
(7.1 billion cubic feet) in 2013 which is seven-fold increase over
2012
22. Fundamental differences between Chinese
and US petroleum industries
United States
• No single company dominates
domestic industry
– Three segments in the industry:
Majors, major independents,
and small independents
– All are private firms with no
government ownership
• Industry vertically separated
– Upstream exploration, service,
and midstream firms have
separate ownership
• No entry restrictions
• Private ownership of land and
mineral rights
China
• Most segments of the industry
dominated by three major national
oil companies (NOC):
• China National Petroleum
Corporation (CNPC)
• Sinopec
• China National Offshore Oil
Corporation (CNOOC)
• Industry vertically integrated with
NOC controlling upstream, service,
and midstream segments
• Mineral rights are state-owned and
severed from land ownership
• 80% of shale gas resources overlap
with conventional production and as
a result exploration rights have been
assigned to the NOCs.
23. Current Chinese policies on shale gas
In March 2012 12th Five-Year Plan for Shale Gas
• R&D policy
– Research program on critical technologies for shale gas exploration and development
established as major national science and technology project
– National shale gas R&D center was established in 2010
– Government encourages using most advanced technologies already developed outside of
China, developing advanced technologies domestically, and establishing shale gas
development demonstration areas
• Fiscal policy and incentive pricing
– Fiscal subsidy policy of $1.81/Mcf for shale gas to be effective from 2013 to 2015; adjusted in
future based on shale gas development
– Two types of mineral resource fees are reduced or waived for shale gas development
– Tariffs are waived for importing equipment for shale gas development that cannot be
domestically produced
• Opening shale gas development to new entrants
– Oligopoly structure of oil and gas industry viewed as one of major factors hindering
development of unconventional natural gas in China
• General natural gas pricing
– Prices controlled at lower than market (including imports) resulting in shortages
– Started moves for partial price reform
• Natural gas pipeline policies
– In February 2014, policy offering limited open access issued
24. How might China overcome the innovation problem?
• New entrants have little incentive to drill shale gas wells in the
short run
• NOCs are China's best hope for overcoming innovation
problem
– CNPC and Sinopec have significant experience in developing shale gas
– NOCs are drilling in and have the exploration rights to shale gas blocks with the most favorable
geology and infra- structure
– NOCs have right to sign production sharing agreements with international oil and gas firms
and have invested billions of dollars in acquiring shale gas blocks in North America
– NOCs are large enough to take on financial risks
– NOCs have control over vast majority of oil service firms and natural gas pipelines in China
• NOCs' incentive to invest in domestic shale gas exploration
and development may be limited by their better investment
opportunities elsewhere
• China has large reserves of tight gas and coalbed methane
and technologies for developing both are much more mature
25. Impacts of shale gas not limited to natural gas
markets: Gas-to-liquids
• Gas-to-liquid (GTL) fuels and methanol overcome the barriers that have
impeded the penetration of CNG and electric vehicles.
• Liquid GTL fuels contain no impurities and avoid refinery processes
required to remove crude impurities. However, the overall efficiency is
only 57-58%.
• Major investments have been announced for GTL facilities.
• Small modular GTL systems are being developed to take advantage of
more site-specific opportunities.
– Small plants cost about $100,000 for every b/d capacity.
– At $4.00/mmBtu a barrel of finished diesel product can be produced for $66.00
($1.57/gallon) as compared to approximately $124/barrel ($2.95/gallon) for diesel
refined from crude.
• New methods using bio-catalysts are being developed.
– Methanotrops are bacteria that can use methane as a sole carbon and energy source.
– These have been bio-engineered to use shale gas for the production of fuels and
petrochemical feed-stocks.
– Advantages include lower costs than cellulosic feed-stocks, greater efficiency at lower
temperatures (greater efficiency), scalability, and smaller environmental impacts.
26. Conclusions
• US petroleum industry has undergone an
amazing revival
– Imports of crude oil declined from approximately 60%
in 2008 to roughly 40% in 2014
– Increases in production of both oil and natural gas
have implications for world markets
• Shale gas resources found in other parts of the
world
– More important than exports of commodities, US
major source of technologies and know-how
– However, US model is not directly transferable to
other countries, e.g., China