SlideShare a Scribd company logo
1 of 10
Download to read offline
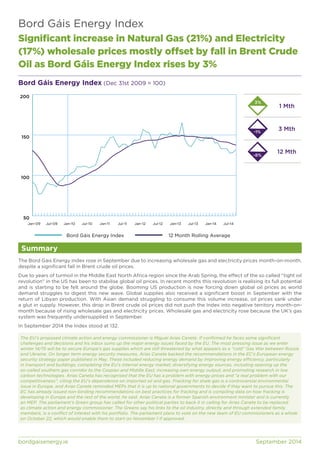
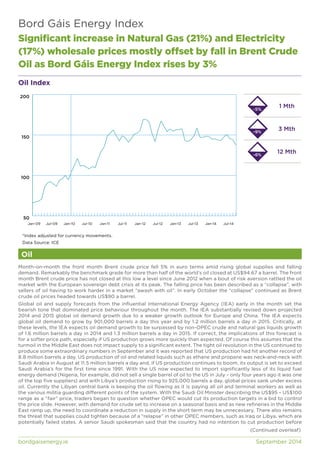
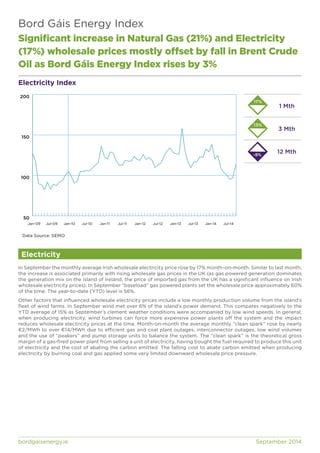
SEPTEMBER 2014 
Bord Gáis 
Energy Index 
Understanding energy 
BGE/EI/UE/1014
Bord Gáis Energy Index 
Significant increase in Natural Gas (21%) and Electricity 
(17%) wholesale prices mostly offset by fall in Brent Crude 
Oil as Bord Gáis Energy Index rises by 3% 
Bord Gáis Energy Index (Dec 31st 2009 = 100) 
200 
150 
100 
50 
Jan-09 Jul-09 Jan-10 Jul-10 Jan-11 Jul-11 Jan-12 Jul-12 Jan-13 Jul-13 Jan-14 Jul-14 
Summary 
1 Mth 
3 Mth 
12 Mth 
3% 
Bord Gáis Energy Index 12 Month Rolling Average 
-1% 
-8% 
The Bord Gáis Energy Index rose in September due to increasing wholesale gas and electricity prices month-on-month, 
despite a significant fall in Brent crude oil prices. 
Due to years of turmoil in the Middle East North Africa region since the Arab Spring, the effect of the so called “tight oil 
revolution” in the US has been to stabilise global oil prices. In recent months this revolution is realising its full potential 
and is starting to be felt around the globe. Booming US production is now forcing down global oil prices as world 
demand struggles to digest this new wave. Global supplies also received a significant boost in September with the 
return of Libyan production. With Asian demand struggling to consume this volume increase, oil prices sank under 
a glut in supply. However, this drop in Brent crude oil prices did not push the Index into negative territory month-on-month 
because of rising wholesale gas and electricity prices. Wholesale gas and electricity rose because the UK’s gas 
system was frequently undersupplied in September. 
In September 2014 the Index stood at 132. 
The EU’s proposed climate action and energy commissioner is Miguel Arias Canete. If confirmed he faces some significant 
challenges and decisions and his inbox sums up the major energy issues faced by the EU. The most pressing issue as we enter 
winter 14/15 will be to secure Europe’s gas supplies which are still threatened by what appears as a “cold” Gas War between Russia 
and Ukraine. On longer term energy security measures, Arias Canete backed the recommendations in the EC’s European energy 
security strategy paper published in May. These included reducing energy demand by improving energy efficiency, particularly 
in transport and buildings; completing the EU’s internal energy market; diversifying energy sources, including opening up the 
so-called southern gas corridor to the Caspian and Middle East; increasing own energy output; and promoting research in low 
carbon technologies. Arias Caneta has recognised that the EU has a problem with energy prices and “a real problem with our 
competitiveness”, citing the EU’s dependence on imported oil and gas. Fracking for shale gas is a controversial environmental 
issue in Europe, and Arias Canete reminded MEPs that it is up to national governments to decide if they want to pursue this. The 
EC has already issued non-binding recommendations on best practices for fracking and is compiling data on how fracking is 
developing in Europe and the rest of the world, he said. Arias Caneta is a former Spanish environment minister and is currently 
an MEP. The parliament’s Green group has called for other political parties to back it in calling for Arias Canete to be replaced 
as climate action and energy commissioner. The Greens say his links to the oil industry, directly and through extended family 
members, is a conflict of interest with his portfolio. The parliament plans to vote on the new team of EU commissioners as a whole 
on October 22, which would enable them to start on November 1 if approved. 
bordgaisenergy.ie September 2014
Bord Gáis Energy Index 
Significant increase in Natural Gas (21%) and Electricity 
(17%) wholesale prices mostly offset by fall in Brent Crude 
Oil as Bord Gáis Energy Index rises by 3% 
Oil Index 
200 
150 
100 
50 
Jan-09 Jul-09 Jan-10 Jul-10 Jan-11 Jul-11 Jan-12 Jul-12 Jan-13 Jul-13 Jan-14 Jul-14 
*Index adjusted for currency movements. 
Data Source: ICE 
Oil 
1 Mth 
3 Mth 
12 Mth 
-5% 
-9% 
-6% 
Month-on-month the front month Brent crude price fell 5% in euro terms amid rising global supplies and falling 
demand. Remarkably the benchmark grade for more than half of the world’s oil closed at US$94.67 a barrel. The front 
month Brent crude price has not closed at this low a level since June 2012 when a bout of risk aversion rattled the oil 
market with the European sovereign debt crisis at its peak. The falling price has been described as a “collapse”, with 
sellers of oil having to work harder in a market “awash with oil”. In early October the “collapse” continued as Brent 
crude oil prices headed towards US$90 a barrel. 
Global oil and supply forecasts from the influential International Energy Agency (IEA) early in the month set the 
bearish tone that dominated price behaviour throughout the month. The IEA substantially revised down projected 
2014 and 2015 global oil demand growth due to a weaker growth outlook for Europe and China. The IEA expects 
global oil demand to grow by 901,000 barrels a day this year and by 1.2 million barrels a day in 2015. Critically, at 
these levels, the IEA expects oil demand growth to be surpassed by non-OPEC crude and natural gas liquids growth 
of 1.6 million barrels a day in 2014 and 1.3 million barrels a day in 2015. If correct, the implications of this forecast is 
for a softer price path, especially if US production grows more quickly than expected. Of course this assumes that the 
turmoil in the Middle East does not impact supply to a significant extent. The tight oil revolution in the US continued to 
produce some extraordinary numbers in September and it was reported that US production had hit another record of 
8.8 million barrels a day. US production of oil and related liquids such as ethane and propane was neck-and-neck with 
Saudi Arabia in August at 11.5 million barrels a day and, if US production continues to boom, its output is set to exceed 
Saudi Arabia’s for the first time since 1991. With the US now expected to import significantly less of its liquid fuel 
energy demand (Nigeria, for example, did not sell a single barrel of oil to the US in July – only four years ago it was one 
of the top five suppliers) and with Libya’s production rising to 925,000 barrels a day, global prices sank under excess 
oil. Currently the Libyan central bank is keeping the oil flowing as it is paying all oil and terminal workers as well as 
the various militia guarding different points of the system. With the Saudi Oil Minister describing the US$95 – US$100 
range as a “fair” price, traders began to question whether OPEC would cut its production targets in a bid to control 
the price slide. However, with demand for crude set to increase on a seasonal basis and as new refineries in the Middle 
East ramp up, the need to coordinate a reduction in supply in the short term may be unnecessary. There also remains 
the threat that supplies could tighten because of a “relapse” in other OPEC members, such as Iraq or Libya, which are 
potentially failed states. A senior Saudi spokesman said that the country had no intention to cut production before 
(Continued overleaf) 
bordgaisenergy.ie September 2014
Bord Gáis Energy Index 
Significant increase in Natural Gas (21%) and Electricity 
(17%) wholesale prices mostly offset by fall in Brent Crude 
Oil as Bord Gáis Energy Index rises by 3% 
Oil Index (continued) 
the next OPEC meeting on November 27 and this could keep market sentiments bearish. Some analysts suggest that 
prices in the short-term could get as low as UD$80 a barrel. 
On the demand side the global oil market was jolted by weaker Chinese oil demand. In recent years China has emerged 
as a larger oil importer than the US, helped in part by the tight oil revolution which is curbing US demand for non-US 
oil. However, this year it is expected that China’s oil demand is likely to grow by less than 300,000 barrels a day. This 
is much lower than the average of 560,000 barrels a day of growth since the recession due to signs of third quarter 
deceleration. The recent drop in oil demand is linked to a huge contraction in diesel demand with the slowdown in 
industrial production impacting freight transport and industrial consumption. An early summer harvest and a fishing 
ban off the coast of China through July also weighed on demand. Despite this recent weakness, Asia (China, Japan, 
India and South Korea) is the only growth market for oil and is key to soaking up growing OPEC and non-OPEC supply. 
The US and its allies continued to bomb targets in Syria and Iraq to repel Islamic State militants in September. As the 
conflict has largely spared southern Iraq, which is home to about three-quarters of the country’s oil output, market 
prices failed to react. The US dollar rally also weighed on Brent crude prices and analysts say that the dollar rally 
shows little signs of ending as we get closer to the Fed beginning to tighten policy. The Fed confirmed that it would 
end its massive bond-buying programme which will massively reduce the volume of newly printed dollars entering 
the financial system. 
bordgaisenergy.ie September 2014
Bord Gáis Energy Index 
Significant increase in Natural Gas (21%) and Electricity 
(17%) wholesale prices mostly offset by fall in Brent Crude 
Oil as Bord Gáis Energy Index rises by 3% 
Natural Gas Index 
300 
250 
200 
150 
100 
50 
Jan-09 Jul-09 Jan-10 Jul-10 Jan-11 Jul-11 Jan-12 Jul-12 Jan-13 Jul-13 Jan-14 Jul-14 
*Index adjusted for currency movements. 
Data Source: Spectron Group 
Natural Gas 
1 Mth 
3 Mth 
21% 
25% 
12 Mth -21% 
In euro terms the average Day-ahead gas price for September was 21% higher month-on-month as the price rose 
from a monthly average of 40.51p a therm to 48.15p a therm. Despite the month-on-month rise, at 48.15p a therm 
the September 2014 average price was the lowest average Day-ahead September price since 2010 and compares 
favourably to the 65.64p a therm September 2013 price. Twelve months ago wholesale prices reflected significant 
trader anxiety due to low stock levels heading into winter 13. With stocks now at record highs, the market is comfortable 
in advance of winter 14 and this is being reflected in prices. 
During the month a frequently undersupplied system supported prompt prices. Numerous minor supply disruptions 
due to maintenance, cooler temperatures towards the end of the month, news that EDF’s three nuclear plants would 
not return to the grid until after winter and a reduction in flows from the UK’s LNG terminals combined to push prompt 
prices higher month-on-month. 
It was reported in September that, since the end of the month, the European Commission has been asking European 
gas shippers, via national regulators, to check if contracted flows of natural gas are being met by physical flows from 
Russia. This suggests that some worry exists among EU leaders of a disruption in the supply of Russian gas to Europe 
via Ukraine. However, there has been no sign of any disruption so far. Gazprom supplied one third of European gas 
consumption in 2013. Since June 2014 Ukraine has been without Russian gas supplies due to a dispute over gas prices. 
Ukraine is now relying on domestic gas extraction, imports of European gas and underground storage facilities to 
offset increasing demand this winter. Ukraine plans to store up to 17.2bcm of natural gas by October 2014, when the 
six-month-long high demand season begins, to ensure steady Russian gas supplies to Europe in the winter. However, 
according to Russia’s energy minister, the Ukraine may need an additional 11bcm of supply this winter. In September 
Ukraine’s imports of natural gas from Europe increased from 384mcm to 986mcm due to a massive increase in gas 
imports from Slovakia. Other sources included Poland and Hungary. With the third Gas War rumbling on ominously, 
the EU did propose an interim solution to the gas dispute in late September in the hope that it would guarantee stable 
gas deliveries and avoid price shocks this winter. The new agreement was proposed at an EU-Russia-Ukraine tripartite 
meeting in Berlin. Under the proposed plan Ukraine would pay Russia US$3.1billion by the end of the year. In turn, 
Russia would guarantee delivery of at least 5bcm of gas to Ukraine at a price of US$385 per 1,000 cu m. The interim 
solution would be valid through the winter season. By early October both sides had failed to reach an agreement. 
(Continued overleaf) 
bordgaisenergy.ie September 2014
Bord Gáis Energy Index 
Significant increase in Natural Gas (21%) and Electricity 
(17%) wholesale prices mostly offset by fall in Brent Crude 
Oil as Bord Gáis Energy Index rises by 3% 
Natural Gas Index (continued) 
A key stumbling block is Ukraine’s requirement that the agreed gas price is based on market-setting mechanisms 
rather than being dependant on Russian discounts that rest on political consideration which could be easily cancelled. 
The Ukraine views Russia’s offer of US$385 per 1,000 cu m as unacceptable. At the beginning of October it is being 
reported that no date has yet been set for the next trilateral meeting. 
Downward pressure on curve prices emerged, in particular towards the end of September, as contracts shed geopolitical 
risk premium in anticipation of a positive outcome from the trilateral negotiations between Russia, Ukraine and the 
EC on the gas dispute. In addition, forecasts that point to a milder start to the winter period added further pressure. 
Forecaster WSI said in September that it “expects widespread above-normal temperatures across the UK for the 
October-December period”. Bumper stocks, easing geopolitical pressures and clement weather forecasts meant that 
both the October 2014 and winter 2014 contracts expired at the end of September at four-year lows. 
bordgaisenergy.ie September 2014
Bord Gáis Energy Index 
Significant increase in Natural Gas (21%) and Electricity 
(17%) wholesale prices mostly offset by fall in Brent Crude 
Oil as Bord Gáis Energy Index rises by 3% 
Coal Index 
200 
150 
100 
50 
Jan-09 Jul-09 Jan-10 Jul-10 Jan-11 Jul-11 Jan-12 Jul-12 Jan-13 Jul-13 Jan-14 Jul-14 
*Index adjusted for currency movements. 
Data Source: ICE 
Coal 
1 Mth 
3 Mth 
12 Mth 
-2% 
7% 
-6% 
The front month European wholesale coal futures contract fell 2% month-on-month to close at US$72.20/mt compared 
to the August close of US$76.95/mt. At US$72.20/mt it was the lowest closing monthly front month European 
wholesale coal futures price since September 2009. Market sources cited thin demand from European buyers amid 
ample supply (there are reports of a lot of coal being offered from Colombia and Russia currently) and a weak euro. 
Uncertainty concerning the European economy is adding an additional bearish element. 
Some analysts are commenting that the market is likely to remain depressed, and might fall further, but it is believed 
that US$76.95 will be very hard to break through more than temporarily. Others are of the view that there was 
probably room for spot prices to fall “several more dollars” and that the downtrend could continue as long as there 
are miners that are still cash positive. This is being supported by the strength of the US Dollar. According to some, the 
stronger dollar may have removed the floor of the market, leaving producers with the same unit costs. In September 
Standard Bank provided its view on the short-term future of the Atlantic coal market. According to it, a lower pricing 
outlook has been generated from Colombia’s higher export rate (with the potential to reach 80 million-85 million 
mt next year) and the availability of further spill over tons resulting from China’s import cuts. Recently the Chinese 
National Development and Reform Commission moved to restrict coastal power plant import levels by 5million mt/ 
month from September to December. With coal a dirty word not only for the Europeans, but now also for the Chinese, 
Standard Bank fail to envisage any significant price rallies, barring short-term Black Swan events or typical seasonal 
squeezes. 
bordgaisenergy.ie September 2014
Bord Gáis Energy Index 
Significant increase in Natural Gas (21%) and Electricity 
(17%) wholesale prices mostly offset by fall in Brent Crude 
Oil as Bord Gáis Energy Index rises by 3% 
Electricity Index 
200 
150 
100 
50 
Jan-09 Jul-09 Jan-10 Jul-10 Jan-11 Jul-11 Jan-12 Jul-12 Jan-13 Jul-13 Jan-14 Jul-14 
Data Source: SEMO 
Electricity 
1 Mth 
3 Mth 
17% 
13% 
12 Mth -8% 
In September the monthly average Irish wholesale electricity price rose by 17% month-on-month. Similar to last month, 
the increase is associated primarily with rising wholesale gas prices in the UK (as gas powered generation dominates 
the generation mix on the island of Ireland, the price of imported gas from the UK has a significant influence on Irish 
wholesale electricity prices). In September “baseload” gas powered plants set the wholesale price approximately 60% 
of the time. The year-to-date (YTD) level is 56%. 
Other factors that influenced wholesale electricity prices include a low monthly production volume from the island’s 
fleet of wind farms. In September wind met over 6% of the island’s power demand. This compares negatively to the 
YTD average of 15% as September’s clement weather conditions were accompanied by low wind speeds. In general, 
when producing electricity, wind turbines can force more expensive power plants off the system and the impact 
reduces wholesale electricity prices at the time. Month-on-month the average monthly “clean spark” rose by nearly 
€2/MWh to over €14/MWh due to efficient gas and coal plant outages, interconnector outages, low wind volumes 
and the use of “peakers” and pump storage units to balance the system. The “clean spark” is the theoretical gross 
margin of a gas-fired power plant from selling a unit of electricity, having bought the fuel required to produce this unit 
of electricity and the cost of abating the carbon emitted. The falling cost to abate carbon emitted when producing 
electricity by burning coal and gas applied some very limited downward wholesale price pressure. 
bordgaisenergy.ie September 2014
Bord Gáis Energy Index 
Significant increase in Natural Gas (21%) and Electricity 
(17%) wholesale prices mostly offset by fall in Brent Crude 
Oil as Bord Gáis Energy Index rises by 3% 
FX Rates 
2.0 
1.5 
1.0 
0.5 
Jan-09 Jul-09 Jan-10 Jul-10 Jan-11 Jul-11 Jan-12 Jul-12 Jan-13 Jul-13 Jan-14 Jul-14 
FX Rates 
EURUSD 
-4% 
-8% 
-7% 
EURGBP 
1 Mth 
3 Mth 
12 Mth 
1 Mth 
3 Mth 
12 Mth 
-2% 
-3% 
EURUSD EURGBP -7% 
A major economic issue has been emerging in recent months and it is that of wage stagnation throughout the rich 
world. Stagnant wages and the risk of deflation are coupled and the world’s major central banks, particularly the 
ECB, are concerned that deflation may take hold. Rising productivity and in turn rising real wages would alleviate 
deflationary concerns but these forces have been absent in recent years as labour costs have come under pressure to 
reverse lost competitiveness, particularly in the crisis-hit countries of the euro area. 
As rising real wages are inflationary, the central banks of the US and Britain will be searching for evidence of rising 
wages and this will provide the market with some clues as to when these banks will be ready to push interest rates 
higher. In September it was again evident that real wage growth in the UK remains a distant memory with pay only 
rising 0.7% year-on-year. As a consequence most of the Bank of England’s Monetary Policy Committee members think 
that the economy can continue to grow without sparking inflation. But the key question is for how long? With UK 
inflation falling in August, the pressure on the Bank of England to introduce a rate increase is being reduced despite 
forecasts that the UK is expected to be the fastest growing advanced economy this year. This scenario is also being 
played out in the US with labour market slack and dormant inflation explaining why the stimulus of low interest rates 
will remain for some time yet. Unlike the Fed or the Bank of England, who are searching for inflationary pressures, the 
ECB is almost primed to tackle deflation and is debating to adopt full-blown Quantitative Easing. 
With the Bank of England and the US Fed monitoring inflationary pressures and wage growth to help determine when 
they should act to raise interest rates, the ECB faces deflationary concerns and has pushed interest rates to record 
lows. The prospect of rising rates and economic performance in the UK and US is in sharp contrast to the euro zone 
and this explains the euro’s on-going weakness. 
bordgaisenergy.ie September 2014
Bord Gáis Energy Index 
Significant increase in Natural Gas (21%) and Electricity 
(17%) wholesale prices mostly offset by fall in Brent Crude 
Oil as Bord Gáis Energy Index rises by 3% 
Market Outlook 
In recent times the cause of tumbling oil prices has been linked to a slowing world economy as forecasted global 
demand growth is expected to be incapable of shocking up a new wave of growing supplies. Despite the concerns 
associated with the cause of weaker prices (a weakening world economy and decelerating global trade), at first glance 
weaker Brent crude prices offer benefits to most developed economies in the west. For countries that are fuel importers, 
falling commodity prices have the potential to increase disposable incomes and boost economic growth. However, low 
prices act as an economic drag on producing countries and could ultimately threaten stability in countries where high 
oil prices have supported generous spending. Assuming supply risks are minimised, China’s demand for commodities 
in particular will determine prices in the near term. However, with authorities trying to rebalance growth away from 
commodity intensive investment in housing and other infrastructure, commodity prices could fall further. Right now 
parts of the world are benefiting from a wave of new oil supplies which were stimulated by prices as high as US$144 
a barrel in the summer of 2008. Despite the promise of lower prices being carried on this wave, it has the potential to 
weaken global economic growth as commodity producing emerging economies (who have emerged as big drivers of 
global GDP growth in recent years) suffer. A weaker oil promise may also nudge the global growth pendulum back to 
the west if it transpires that the unprecedented Central Bank interventions of recent years have fostered an environment 
that can benefit from the gift of lower oil prices. 
On gas, the impact of full stores could help to keep prices for delivery over the first half of the winter relatively weak. The 
current lull in developments over the supply of gas into Ukraine from Russia has removed a little of the risk premium. 
However, as the situation remains unresolved and the backdrop grows increasingly precarious with the beginning of 
winter and Ukraine essentially “short” of gas, it has the potential in certain scenarios to be explosive. 
Re-weighting of Bord Gáis Energy Index 
Following the SEAI’s 2011 review of energy consumption in 
Ireland, there was a 6.4% drop in overall energy consumption. 
Oil continues to be the dominant energy source with most of the 
oil used in transport and the remainder being used for thermal 
energy. For the purposes of the Bord Gáis Energy Index, the total 
final energy consumption in Ireland fell 1,089 ktoe (toe: a tonne of 
oil equivalent is a unit of energy, roughly equivalent to the energy 
content of one tonne of crude oil) between 2009 and 2011. This 
fall was made up of a 1,022 ktoe drop in oil consumption (down 
13.5%), a 20 ktoe drop in natural gas (down 12.6%), a 7 ktoe drop 
in electricity (down 0.3%) and a 40 ktoe drop in coal (down 
10.98%). The Bord Gáis Energy Index has been re-weighted in 
January 2013 to reflect the latest consumption data. The impact 
has been minimal and has resulted in slight reductions in the share 
of oil and gas and a slight increase in the weighting of electricity 
in the overall Index. 
Oil 
61.96% 
Electricity 3.1% 
20.22% 
For more information please contact: 
Bord Gáis Energy John Heffernan (Gas & Power Trader) 
023 8895123/087 2407566 
Gas 
14.72% 
Coal 
The contents of this report are provided solely as an information guide. The report is presented to you “as is” and may or may not be correct, current, 
accurate or complete. While every effort is made in preparing material for publication no responsibility is accepted by or on behalf of Bord Gáis 
Energy Limited, the SEMO, ICE Futures Europe, the Sustainable Energy Authority of Ireland or Spectron Group Limited (together, the “Parties”) for 
any errors, omissions or misleading statements within this report. No representation or warranty, express or implied, is made or liability accepted by 
any of the Parties or any of their respective directors, employees or agents in relation to the accuracy or completeness of the information contained 
in this report. Each of the Parties and their respective directors, employees or agents does not and will not accept any liability in relation to the 
information contained in this report. Bord Gáis Energy Limited reserves the right at any time to revise, amend, alter or delete the information provided 
in this report. 
bordgaisenergy.ie September 2014

More Related Content

What's hot

Bord Gáis Energy Index December 2015
Bord Gáis Energy Index December 2015Bord Gáis Energy Index December 2015
Bord Gáis Energy Index December 2015Bord Gáis Energy
 
Bord gáis energy index june 2014
Bord gáis energy index june 2014Bord gáis energy index june 2014
Bord gáis energy index june 2014Bord Gáis Energy
 
Bord Gáis Energy Index February 2015
Bord Gáis Energy Index February 2015Bord Gáis Energy Index February 2015
Bord Gáis Energy Index February 2015Bord Gáis Energy
 
Bord Gáis Energy Index November 2014
Bord Gáis Energy Index November 2014Bord Gáis Energy Index November 2014
Bord Gáis Energy Index November 2014Bord Gáis Energy
 
US EIA's December 2016 Short-Term Energy Outlook
US EIA's December 2016 Short-Term Energy OutlookUS EIA's December 2016 Short-Term Energy Outlook
US EIA's December 2016 Short-Term Energy OutlookMarcellus Drilling News
 
Energy markets in flux – Infographic
Energy markets in flux – InfographicEnergy markets in flux – Infographic
Energy markets in flux – InfographicAndy Varoshiotis
 
New base energy news 28 may 2020 issue no. 1342 senior editor eng. khaled ...
New base energy news 28 may  2020   issue no. 1342 senior editor eng. khaled ...New base energy news 28 may  2020   issue no. 1342 senior editor eng. khaled ...
New base energy news 28 may 2020 issue no. 1342 senior editor eng. khaled ...Khaled Al Awadi
 
Federal Reserve Bank: Trends in Energy Production and Prices
Federal Reserve Bank: Trends in Energy Production and PricesFederal Reserve Bank: Trends in Energy Production and Prices
Federal Reserve Bank: Trends in Energy Production and PricesMarcellus Drilling News
 
Bord Gáis Energy Index July 2014
Bord Gáis Energy Index July 2014Bord Gáis Energy Index July 2014
Bord Gáis Energy Index July 2014Bord Gáis Energy
 
The Bord Gáis Energy Index - August 2013
The Bord Gáis Energy Index - August 2013 The Bord Gáis Energy Index - August 2013
The Bord Gáis Energy Index - August 2013 Bord Gáis Energy
 
Bord Gáis Energy Index July 2015
Bord Gáis Energy Index July 2015Bord Gáis Energy Index July 2015
Bord Gáis Energy Index July 2015Bord Gáis Energy
 
Bord Gáis Energy Index September 2015
Bord Gáis Energy Index September 2015Bord Gáis Energy Index September 2015
Bord Gáis Energy Index September 2015Bord Gáis Energy
 
Bord Gáis Energy Index October 2015
Bord Gáis Energy Index October 2015Bord Gáis Energy Index October 2015
Bord Gáis Energy Index October 2015Bord Gáis Energy
 
EY Price Point: global oil and gas market outlook
EY Price Point: global oil and gas market outlookEY Price Point: global oil and gas market outlook
EY Price Point: global oil and gas market outlookEY
 
EY Price Point: global oil and gas market outlook
EY Price Point: global oil and gas market outlookEY Price Point: global oil and gas market outlook
EY Price Point: global oil and gas market outlookEY
 
April 2013 Energy Index - Bord Gáis Energy
April 2013 Energy Index - Bord Gáis EnergyApril 2013 Energy Index - Bord Gáis Energy
April 2013 Energy Index - Bord Gáis EnergyBord Gáis Energy
 

What's hot (20)

Bord Gáis Energy Index December 2015
Bord Gáis Energy Index December 2015Bord Gáis Energy Index December 2015
Bord Gáis Energy Index December 2015
 
Bord gáis energy index june 2014
Bord gáis energy index june 2014Bord gáis energy index june 2014
Bord gáis energy index june 2014
 
Bord Gáis Energy Index February 2015
Bord Gáis Energy Index February 2015Bord Gáis Energy Index February 2015
Bord Gáis Energy Index February 2015
 
Bord Gáis Energy Index November 2014
Bord Gáis Energy Index November 2014Bord Gáis Energy Index November 2014
Bord Gáis Energy Index November 2014
 
US EIA's December 2016 Short-Term Energy Outlook
US EIA's December 2016 Short-Term Energy OutlookUS EIA's December 2016 Short-Term Energy Outlook
US EIA's December 2016 Short-Term Energy Outlook
 
Energy markets in flux – Infographic
Energy markets in flux – InfographicEnergy markets in flux – Infographic
Energy markets in flux – Infographic
 
New base energy news 28 may 2020 issue no. 1342 senior editor eng. khaled ...
New base energy news 28 may  2020   issue no. 1342 senior editor eng. khaled ...New base energy news 28 may  2020   issue no. 1342 senior editor eng. khaled ...
New base energy news 28 may 2020 issue no. 1342 senior editor eng. khaled ...
 
Federal Reserve Bank: Trends in Energy Production and Prices
Federal Reserve Bank: Trends in Energy Production and PricesFederal Reserve Bank: Trends in Energy Production and Prices
Federal Reserve Bank: Trends in Energy Production and Prices
 
Bord Gáis Energy Index July 2014
Bord Gáis Energy Index July 2014Bord Gáis Energy Index July 2014
Bord Gáis Energy Index July 2014
 
February 2014 energy index
February 2014 energy indexFebruary 2014 energy index
February 2014 energy index
 
The Bord Gáis Energy Index - August 2013
The Bord Gáis Energy Index - August 2013 The Bord Gáis Energy Index - August 2013
The Bord Gáis Energy Index - August 2013
 
Bord Gáis Energy Index July 2015
Bord Gáis Energy Index July 2015Bord Gáis Energy Index July 2015
Bord Gáis Energy Index July 2015
 
Bord Gáis Energy Index September 2015
Bord Gáis Energy Index September 2015Bord Gáis Energy Index September 2015
Bord Gáis Energy Index September 2015
 
Bord Gáis Energy Index October 2015
Bord Gáis Energy Index October 2015Bord Gáis Energy Index October 2015
Bord Gáis Energy Index October 2015
 
Shale gas
Shale gasShale gas
Shale gas
 
EY Price Point: global oil and gas market outlook
EY Price Point: global oil and gas market outlookEY Price Point: global oil and gas market outlook
EY Price Point: global oil and gas market outlook
 
US OIL & GAS OUTLOOK
US OIL & GAS OUTLOOKUS OIL & GAS OUTLOOK
US OIL & GAS OUTLOOK
 
Guinness global energy report
Guinness global energy reportGuinness global energy report
Guinness global energy report
 
EY Price Point: global oil and gas market outlook
EY Price Point: global oil and gas market outlookEY Price Point: global oil and gas market outlook
EY Price Point: global oil and gas market outlook
 
April 2013 Energy Index - Bord Gáis Energy
April 2013 Energy Index - Bord Gáis EnergyApril 2013 Energy Index - Bord Gáis Energy
April 2013 Energy Index - Bord Gáis Energy
 

Viewers also liked

March 2013 Energy Index - Bord Gáis Energy
March 2013 Energy Index - Bord Gáis EnergyMarch 2013 Energy Index - Bord Gáis Energy
March 2013 Energy Index - Bord Gáis EnergyBord Gáis Energy
 
Bord Gáis Energy Index March 2014
Bord Gáis Energy Index March 2014Bord Gáis Energy Index March 2014
Bord Gáis Energy Index March 2014Bord Gáis Energy
 
Bord Gáis Energy Index June 2013
Bord Gáis Energy Index June 2013Bord Gáis Energy Index June 2013
Bord Gáis Energy Index June 2013Bord Gáis Energy
 
January 2012 Energy Index - Bord Gáis Energy
January 2012 Energy Index - Bord Gáis EnergyJanuary 2012 Energy Index - Bord Gáis Energy
January 2012 Energy Index - Bord Gáis EnergyBord Gáis Energy
 
July 2012 Energy Index - Bord Gáis Energy
July 2012 Energy Index - Bord Gáis EnergyJuly 2012 Energy Index - Bord Gáis Energy
July 2012 Energy Index - Bord Gáis EnergyBord Gáis Energy
 
May 2012 Energy Index - Bord Gáis Energy
May 2012 Energy Index - Bord Gáis EnergyMay 2012 Energy Index - Bord Gáis Energy
May 2012 Energy Index - Bord Gáis EnergyBord Gáis Energy
 
April 2012 Energy Index - Bord Gáis Energy
April 2012 Energy Index - Bord Gáis EnergyApril 2012 Energy Index - Bord Gáis Energy
April 2012 Energy Index - Bord Gáis EnergyBord Gáis Energy
 

Viewers also liked (8)

March 2013 Energy Index - Bord Gáis Energy
March 2013 Energy Index - Bord Gáis EnergyMarch 2013 Energy Index - Bord Gáis Energy
March 2013 Energy Index - Bord Gáis Energy
 
Bord Gáis Energy Index March 2014
Bord Gáis Energy Index March 2014Bord Gáis Energy Index March 2014
Bord Gáis Energy Index March 2014
 
December 2013 energy index
December 2013 energy indexDecember 2013 energy index
December 2013 energy index
 
Bord Gáis Energy Index June 2013
Bord Gáis Energy Index June 2013Bord Gáis Energy Index June 2013
Bord Gáis Energy Index June 2013
 
January 2012 Energy Index - Bord Gáis Energy
January 2012 Energy Index - Bord Gáis EnergyJanuary 2012 Energy Index - Bord Gáis Energy
January 2012 Energy Index - Bord Gáis Energy
 
July 2012 Energy Index - Bord Gáis Energy
July 2012 Energy Index - Bord Gáis EnergyJuly 2012 Energy Index - Bord Gáis Energy
July 2012 Energy Index - Bord Gáis Energy
 
May 2012 Energy Index - Bord Gáis Energy
May 2012 Energy Index - Bord Gáis EnergyMay 2012 Energy Index - Bord Gáis Energy
May 2012 Energy Index - Bord Gáis Energy
 
April 2012 Energy Index - Bord Gáis Energy
April 2012 Energy Index - Bord Gáis EnergyApril 2012 Energy Index - Bord Gáis Energy
April 2012 Energy Index - Bord Gáis Energy
 

Similar to Bord Gáis Energy Index - September 2014

May 2013 Energy Index - Bord Gáis Energy
May 2013 Energy Index - Bord Gáis EnergyMay 2013 Energy Index - Bord Gáis Energy
May 2013 Energy Index - Bord Gáis EnergyBord Gáis Energy
 
July 2013 Energy Index - Bord Gáis Energy
July 2013 Energy Index - Bord Gáis EnergyJuly 2013 Energy Index - Bord Gáis Energy
July 2013 Energy Index - Bord Gáis EnergyBord Gáis Energy
 
Bord Gáis Energy Index December 2014
Bord Gáis Energy Index December 2014Bord Gáis Energy Index December 2014
Bord Gáis Energy Index December 2014Bord Gáis Energy
 
EY Price Point: global oil and gas market outlook, Q2 | April 2022
EY Price Point: global oil and gas market outlook, Q2 | April 2022EY Price Point: global oil and gas market outlook, Q2 | April 2022
EY Price Point: global oil and gas market outlook, Q2 | April 2022EY
 
EY Price Point: Global oil and gas market outlook Q4 2018
EY Price Point: Global oil and gas market outlook Q4 2018EY Price Point: Global oil and gas market outlook Q4 2018
EY Price Point: Global oil and gas market outlook Q4 2018EY
 
Bord Gáis Energy Index March 2016
Bord Gáis Energy Index March 2016Bord Gáis Energy Index March 2016
Bord Gáis Energy Index March 2016Bord Gáis Energy
 
Bord Gáis Energy Index March 2015
Bord Gáis Energy Index March 2015Bord Gáis Energy Index March 2015
Bord Gáis Energy Index March 2015Bord Gáis Energy
 
EY Price Point Q3 2022
EY Price Point Q3 2022EY Price Point Q3 2022
EY Price Point Q3 2022EY
 
EY Price Point: Global Oil and Gas Market Outlook - Q3
EY Price Point: Global Oil and Gas Market Outlook - Q3EY Price Point: Global Oil and Gas Market Outlook - Q3
EY Price Point: Global Oil and Gas Market Outlook - Q3EY
 
Bord Gáis Energy Index April 2015
Bord Gáis Energy Index April 2015Bord Gáis Energy Index April 2015
Bord Gáis Energy Index April 2015Bord Gáis Energy
 
Energy monthly 30th aug'16
Energy monthly   30th aug'16Energy monthly   30th aug'16
Energy monthly 30th aug'16choice broking
 
Bord Gáis Energy Index May 2015
Bord Gáis Energy Index May 2015Bord Gáis Energy Index May 2015
Bord Gáis Energy Index May 2015Bord Gáis Energy
 
EY Price Point Q4 2022.pdf
EY Price Point Q4 2022.pdfEY Price Point Q4 2022.pdf
EY Price Point Q4 2022.pdfPaulBogenrieder1
 
Exxon Initiating Coverage Report
Exxon Initiating Coverage ReportExxon Initiating Coverage Report
Exxon Initiating Coverage ReportMichael Butkerait
 

Similar to Bord Gáis Energy Index - September 2014 (16)

May 2013 Energy Index - Bord Gáis Energy
May 2013 Energy Index - Bord Gáis EnergyMay 2013 Energy Index - Bord Gáis Energy
May 2013 Energy Index - Bord Gáis Energy
 
July 2013 Energy Index - Bord Gáis Energy
July 2013 Energy Index - Bord Gáis EnergyJuly 2013 Energy Index - Bord Gáis Energy
July 2013 Energy Index - Bord Gáis Energy
 
Bord Gáis Energy Index December 2014
Bord Gáis Energy Index December 2014Bord Gáis Energy Index December 2014
Bord Gáis Energy Index December 2014
 
April 2014 Energy Index
April 2014 Energy IndexApril 2014 Energy Index
April 2014 Energy Index
 
EY Price Point: global oil and gas market outlook, Q2 | April 2022
EY Price Point: global oil and gas market outlook, Q2 | April 2022EY Price Point: global oil and gas market outlook, Q2 | April 2022
EY Price Point: global oil and gas market outlook, Q2 | April 2022
 
EY Price Point: Global oil and gas market outlook Q4 2018
EY Price Point: Global oil and gas market outlook Q4 2018EY Price Point: Global oil and gas market outlook Q4 2018
EY Price Point: Global oil and gas market outlook Q4 2018
 
Bord Gáis Energy Index March 2016
Bord Gáis Energy Index March 2016Bord Gáis Energy Index March 2016
Bord Gáis Energy Index March 2016
 
Bord Gáis Energy Index March 2015
Bord Gáis Energy Index March 2015Bord Gáis Energy Index March 2015
Bord Gáis Energy Index March 2015
 
EY Price Point Q3 2022
EY Price Point Q3 2022EY Price Point Q3 2022
EY Price Point Q3 2022
 
EY Price Point: Global Oil and Gas Market Outlook - Q3
EY Price Point: Global Oil and Gas Market Outlook - Q3EY Price Point: Global Oil and Gas Market Outlook - Q3
EY Price Point: Global Oil and Gas Market Outlook - Q3
 
Bord Gáis Energy Index April 2015
Bord Gáis Energy Index April 2015Bord Gáis Energy Index April 2015
Bord Gáis Energy Index April 2015
 
FERC 2015 State of the Markets Report
FERC 2015 State of the Markets ReportFERC 2015 State of the Markets Report
FERC 2015 State of the Markets Report
 
Energy monthly 30th aug'16
Energy monthly   30th aug'16Energy monthly   30th aug'16
Energy monthly 30th aug'16
 
Bord Gáis Energy Index May 2015
Bord Gáis Energy Index May 2015Bord Gáis Energy Index May 2015
Bord Gáis Energy Index May 2015
 
EY Price Point Q4 2022.pdf
EY Price Point Q4 2022.pdfEY Price Point Q4 2022.pdf
EY Price Point Q4 2022.pdf
 
Exxon Initiating Coverage Report
Exxon Initiating Coverage ReportExxon Initiating Coverage Report
Exxon Initiating Coverage Report
 

More from Bord Gáis Energy

Bord Gáis Energy Index February 2016
Bord Gáis Energy Index February 2016Bord Gáis Energy Index February 2016
Bord Gáis Energy Index February 2016Bord Gáis Energy
 
Bord Gáis Energy Index January 2016
Bord Gáis Energy Index January 2016Bord Gáis Energy Index January 2016
Bord Gáis Energy Index January 2016Bord Gáis Energy
 
Bord Gáis Energy Index November 2015
Bord Gáis Energy Index November 2015Bord Gáis Energy Index November 2015
Bord Gáis Energy Index November 2015Bord Gáis Energy
 
Bord Gáis Energy Index August 2015
Bord Gáis Energy Index August 2015Bord Gáis Energy Index August 2015
Bord Gáis Energy Index August 2015Bord Gáis Energy
 
Bord Gáis Energy Index June 2015
Bord Gáis Energy Index June 2015Bord Gáis Energy Index June 2015
Bord Gáis Energy Index June 2015Bord Gáis Energy
 
Bord Gáis Energy Index January 2015
Bord Gáis Energy Index January 2015Bord Gáis Energy Index January 2015
Bord Gáis Energy Index January 2015Bord Gáis Energy
 

More from Bord Gáis Energy (6)

Bord Gáis Energy Index February 2016
Bord Gáis Energy Index February 2016Bord Gáis Energy Index February 2016
Bord Gáis Energy Index February 2016
 
Bord Gáis Energy Index January 2016
Bord Gáis Energy Index January 2016Bord Gáis Energy Index January 2016
Bord Gáis Energy Index January 2016
 
Bord Gáis Energy Index November 2015
Bord Gáis Energy Index November 2015Bord Gáis Energy Index November 2015
Bord Gáis Energy Index November 2015
 
Bord Gáis Energy Index August 2015
Bord Gáis Energy Index August 2015Bord Gáis Energy Index August 2015
Bord Gáis Energy Index August 2015
 
Bord Gáis Energy Index June 2015
Bord Gáis Energy Index June 2015Bord Gáis Energy Index June 2015
Bord Gáis Energy Index June 2015
 
Bord Gáis Energy Index January 2015
Bord Gáis Energy Index January 2015Bord Gáis Energy Index January 2015
Bord Gáis Energy Index January 2015
 

Recently uploaded

Investment in The Coconut Industry by Nancy Cheruiyot
Investment in The Coconut Industry by Nancy CheruiyotInvestment in The Coconut Industry by Nancy Cheruiyot
Investment in The Coconut Industry by Nancy Cheruiyotictsugar
 
Contemporary Economic Issues Facing the Filipino Entrepreneur (1).pptx
Contemporary Economic Issues Facing the Filipino Entrepreneur (1).pptxContemporary Economic Issues Facing the Filipino Entrepreneur (1).pptx
Contemporary Economic Issues Facing the Filipino Entrepreneur (1).pptxMarkAnthonyAurellano
 
Global Scenario On Sustainable and Resilient Coconut Industry by Dr. Jelfina...
Global Scenario On Sustainable  and Resilient Coconut Industry by Dr. Jelfina...Global Scenario On Sustainable  and Resilient Coconut Industry by Dr. Jelfina...
Global Scenario On Sustainable and Resilient Coconut Industry by Dr. Jelfina...ictsugar
 
Keppel Ltd. 1Q 2024 Business Update Presentation Slides
Keppel Ltd. 1Q 2024 Business Update  Presentation SlidesKeppel Ltd. 1Q 2024 Business Update  Presentation Slides
Keppel Ltd. 1Q 2024 Business Update Presentation SlidesKeppelCorporation
 
NewBase 19 April 2024 Energy News issue - 1717 by Khaled Al Awadi.pdf
NewBase  19 April  2024  Energy News issue - 1717 by Khaled Al Awadi.pdfNewBase  19 April  2024  Energy News issue - 1717 by Khaled Al Awadi.pdf
NewBase 19 April 2024 Energy News issue - 1717 by Khaled Al Awadi.pdfKhaled Al Awadi
 
MAHA Global and IPR: Do Actions Speak Louder Than Words?
MAHA Global and IPR: Do Actions Speak Louder Than Words?MAHA Global and IPR: Do Actions Speak Louder Than Words?
MAHA Global and IPR: Do Actions Speak Louder Than Words?Olivia Kresic
 
Kenya’s Coconut Value Chain by Gatsby Africa
Kenya’s Coconut Value Chain by Gatsby AfricaKenya’s Coconut Value Chain by Gatsby Africa
Kenya’s Coconut Value Chain by Gatsby Africaictsugar
 
8447779800, Low rate Call girls in Tughlakabad Delhi NCR
8447779800, Low rate Call girls in Tughlakabad Delhi NCR8447779800, Low rate Call girls in Tughlakabad Delhi NCR
8447779800, Low rate Call girls in Tughlakabad Delhi NCRashishs7044
 
Case study on tata clothing brand zudio in detail
Case study on tata clothing brand zudio in detailCase study on tata clothing brand zudio in detail
Case study on tata clothing brand zudio in detailAriel592675
 
Islamabad Escorts | Call 03070433345 | Escort Service in Islamabad
Islamabad Escorts | Call 03070433345 | Escort Service in IslamabadIslamabad Escorts | Call 03070433345 | Escort Service in Islamabad
Islamabad Escorts | Call 03070433345 | Escort Service in IslamabadAyesha Khan
 
Marketing Management Business Plan_My Sweet Creations
Marketing Management Business Plan_My Sweet CreationsMarketing Management Business Plan_My Sweet Creations
Marketing Management Business Plan_My Sweet Creationsnakalysalcedo61
 
Lean: From Theory to Practice — One City’s (and Library’s) Lean Story… Abridged
Lean: From Theory to Practice — One City’s (and Library’s) Lean Story… AbridgedLean: From Theory to Practice — One City’s (and Library’s) Lean Story… Abridged
Lean: From Theory to Practice — One City’s (and Library’s) Lean Story… AbridgedKaiNexus
 
(Best) ENJOY Call Girls in Faridabad Ex | 8377087607
(Best) ENJOY Call Girls in Faridabad Ex | 8377087607(Best) ENJOY Call Girls in Faridabad Ex | 8377087607
(Best) ENJOY Call Girls in Faridabad Ex | 8377087607dollysharma2066
 
Future Of Sample Report 2024 | Redacted Version
Future Of Sample Report 2024 | Redacted VersionFuture Of Sample Report 2024 | Redacted Version
Future Of Sample Report 2024 | Redacted VersionMintel Group
 
The CMO Survey - Highlights and Insights Report - Spring 2024
The CMO Survey - Highlights and Insights Report - Spring 2024The CMO Survey - Highlights and Insights Report - Spring 2024
The CMO Survey - Highlights and Insights Report - Spring 2024christinemoorman
 
BEST Call Girls In Greater Noida ✨ 9773824855 ✨ Escorts Service In Delhi Ncr,
BEST Call Girls In Greater Noida ✨ 9773824855 ✨ Escorts Service In Delhi Ncr,BEST Call Girls In Greater Noida ✨ 9773824855 ✨ Escorts Service In Delhi Ncr,
BEST Call Girls In Greater Noida ✨ 9773824855 ✨ Escorts Service In Delhi Ncr,noida100girls
 
Digital Transformation in the PLM domain - distrib.pdf
Digital Transformation in the PLM domain - distrib.pdfDigital Transformation in the PLM domain - distrib.pdf
Digital Transformation in the PLM domain - distrib.pdfJos Voskuil
 
Call Girls In Sikandarpur Gurgaon ❤️8860477959_Russian 100% Genuine Escorts I...
Call Girls In Sikandarpur Gurgaon ❤️8860477959_Russian 100% Genuine Escorts I...Call Girls In Sikandarpur Gurgaon ❤️8860477959_Russian 100% Genuine Escorts I...
Call Girls In Sikandarpur Gurgaon ❤️8860477959_Russian 100% Genuine Escorts I...lizamodels9
 
Organizational Structure Running A Successful Business
Organizational Structure Running A Successful BusinessOrganizational Structure Running A Successful Business
Organizational Structure Running A Successful BusinessSeta Wicaksana
 

Recently uploaded (20)

Corporate Profile 47Billion Information Technology
Corporate Profile 47Billion Information TechnologyCorporate Profile 47Billion Information Technology
Corporate Profile 47Billion Information Technology
 
Investment in The Coconut Industry by Nancy Cheruiyot
Investment in The Coconut Industry by Nancy CheruiyotInvestment in The Coconut Industry by Nancy Cheruiyot
Investment in The Coconut Industry by Nancy Cheruiyot
 
Contemporary Economic Issues Facing the Filipino Entrepreneur (1).pptx
Contemporary Economic Issues Facing the Filipino Entrepreneur (1).pptxContemporary Economic Issues Facing the Filipino Entrepreneur (1).pptx
Contemporary Economic Issues Facing the Filipino Entrepreneur (1).pptx
 
Global Scenario On Sustainable and Resilient Coconut Industry by Dr. Jelfina...
Global Scenario On Sustainable  and Resilient Coconut Industry by Dr. Jelfina...Global Scenario On Sustainable  and Resilient Coconut Industry by Dr. Jelfina...
Global Scenario On Sustainable and Resilient Coconut Industry by Dr. Jelfina...
 
Keppel Ltd. 1Q 2024 Business Update Presentation Slides
Keppel Ltd. 1Q 2024 Business Update  Presentation SlidesKeppel Ltd. 1Q 2024 Business Update  Presentation Slides
Keppel Ltd. 1Q 2024 Business Update Presentation Slides
 
NewBase 19 April 2024 Energy News issue - 1717 by Khaled Al Awadi.pdf
NewBase  19 April  2024  Energy News issue - 1717 by Khaled Al Awadi.pdfNewBase  19 April  2024  Energy News issue - 1717 by Khaled Al Awadi.pdf
NewBase 19 April 2024 Energy News issue - 1717 by Khaled Al Awadi.pdf
 
MAHA Global and IPR: Do Actions Speak Louder Than Words?
MAHA Global and IPR: Do Actions Speak Louder Than Words?MAHA Global and IPR: Do Actions Speak Louder Than Words?
MAHA Global and IPR: Do Actions Speak Louder Than Words?
 
Kenya’s Coconut Value Chain by Gatsby Africa
Kenya’s Coconut Value Chain by Gatsby AfricaKenya’s Coconut Value Chain by Gatsby Africa
Kenya’s Coconut Value Chain by Gatsby Africa
 
8447779800, Low rate Call girls in Tughlakabad Delhi NCR
8447779800, Low rate Call girls in Tughlakabad Delhi NCR8447779800, Low rate Call girls in Tughlakabad Delhi NCR
8447779800, Low rate Call girls in Tughlakabad Delhi NCR
 
Case study on tata clothing brand zudio in detail
Case study on tata clothing brand zudio in detailCase study on tata clothing brand zudio in detail
Case study on tata clothing brand zudio in detail
 
Islamabad Escorts | Call 03070433345 | Escort Service in Islamabad
Islamabad Escorts | Call 03070433345 | Escort Service in IslamabadIslamabad Escorts | Call 03070433345 | Escort Service in Islamabad
Islamabad Escorts | Call 03070433345 | Escort Service in Islamabad
 
Marketing Management Business Plan_My Sweet Creations
Marketing Management Business Plan_My Sweet CreationsMarketing Management Business Plan_My Sweet Creations
Marketing Management Business Plan_My Sweet Creations
 
Lean: From Theory to Practice — One City’s (and Library’s) Lean Story… Abridged
Lean: From Theory to Practice — One City’s (and Library’s) Lean Story… AbridgedLean: From Theory to Practice — One City’s (and Library’s) Lean Story… Abridged
Lean: From Theory to Practice — One City’s (and Library’s) Lean Story… Abridged
 
(Best) ENJOY Call Girls in Faridabad Ex | 8377087607
(Best) ENJOY Call Girls in Faridabad Ex | 8377087607(Best) ENJOY Call Girls in Faridabad Ex | 8377087607
(Best) ENJOY Call Girls in Faridabad Ex | 8377087607
 
Future Of Sample Report 2024 | Redacted Version
Future Of Sample Report 2024 | Redacted VersionFuture Of Sample Report 2024 | Redacted Version
Future Of Sample Report 2024 | Redacted Version
 
The CMO Survey - Highlights and Insights Report - Spring 2024
The CMO Survey - Highlights and Insights Report - Spring 2024The CMO Survey - Highlights and Insights Report - Spring 2024
The CMO Survey - Highlights and Insights Report - Spring 2024
 
BEST Call Girls In Greater Noida ✨ 9773824855 ✨ Escorts Service In Delhi Ncr,
BEST Call Girls In Greater Noida ✨ 9773824855 ✨ Escorts Service In Delhi Ncr,BEST Call Girls In Greater Noida ✨ 9773824855 ✨ Escorts Service In Delhi Ncr,
BEST Call Girls In Greater Noida ✨ 9773824855 ✨ Escorts Service In Delhi Ncr,
 
Digital Transformation in the PLM domain - distrib.pdf
Digital Transformation in the PLM domain - distrib.pdfDigital Transformation in the PLM domain - distrib.pdf
Digital Transformation in the PLM domain - distrib.pdf
 
Call Girls In Sikandarpur Gurgaon ❤️8860477959_Russian 100% Genuine Escorts I...
Call Girls In Sikandarpur Gurgaon ❤️8860477959_Russian 100% Genuine Escorts I...Call Girls In Sikandarpur Gurgaon ❤️8860477959_Russian 100% Genuine Escorts I...
Call Girls In Sikandarpur Gurgaon ❤️8860477959_Russian 100% Genuine Escorts I...
 
Organizational Structure Running A Successful Business
Organizational Structure Running A Successful BusinessOrganizational Structure Running A Successful Business
Organizational Structure Running A Successful Business
 

Bord Gáis Energy Index - September 2014

  • 1. SEPTEMBER 2014 Bord Gáis Energy Index Understanding energy BGE/EI/UE/1014
  • 2. Bord Gáis Energy Index Significant increase in Natural Gas (21%) and Electricity (17%) wholesale prices mostly offset by fall in Brent Crude Oil as Bord Gáis Energy Index rises by 3% Bord Gáis Energy Index (Dec 31st 2009 = 100) 200 150 100 50 Jan-09 Jul-09 Jan-10 Jul-10 Jan-11 Jul-11 Jan-12 Jul-12 Jan-13 Jul-13 Jan-14 Jul-14 Summary 1 Mth 3 Mth 12 Mth 3% Bord Gáis Energy Index 12 Month Rolling Average -1% -8% The Bord Gáis Energy Index rose in September due to increasing wholesale gas and electricity prices month-on-month, despite a significant fall in Brent crude oil prices. Due to years of turmoil in the Middle East North Africa region since the Arab Spring, the effect of the so called “tight oil revolution” in the US has been to stabilise global oil prices. In recent months this revolution is realising its full potential and is starting to be felt around the globe. Booming US production is now forcing down global oil prices as world demand struggles to digest this new wave. Global supplies also received a significant boost in September with the return of Libyan production. With Asian demand struggling to consume this volume increase, oil prices sank under a glut in supply. However, this drop in Brent crude oil prices did not push the Index into negative territory month-on-month because of rising wholesale gas and electricity prices. Wholesale gas and electricity rose because the UK’s gas system was frequently undersupplied in September. In September 2014 the Index stood at 132. The EU’s proposed climate action and energy commissioner is Miguel Arias Canete. If confirmed he faces some significant challenges and decisions and his inbox sums up the major energy issues faced by the EU. The most pressing issue as we enter winter 14/15 will be to secure Europe’s gas supplies which are still threatened by what appears as a “cold” Gas War between Russia and Ukraine. On longer term energy security measures, Arias Canete backed the recommendations in the EC’s European energy security strategy paper published in May. These included reducing energy demand by improving energy efficiency, particularly in transport and buildings; completing the EU’s internal energy market; diversifying energy sources, including opening up the so-called southern gas corridor to the Caspian and Middle East; increasing own energy output; and promoting research in low carbon technologies. Arias Caneta has recognised that the EU has a problem with energy prices and “a real problem with our competitiveness”, citing the EU’s dependence on imported oil and gas. Fracking for shale gas is a controversial environmental issue in Europe, and Arias Canete reminded MEPs that it is up to national governments to decide if they want to pursue this. The EC has already issued non-binding recommendations on best practices for fracking and is compiling data on how fracking is developing in Europe and the rest of the world, he said. Arias Caneta is a former Spanish environment minister and is currently an MEP. The parliament’s Green group has called for other political parties to back it in calling for Arias Canete to be replaced as climate action and energy commissioner. The Greens say his links to the oil industry, directly and through extended family members, is a conflict of interest with his portfolio. The parliament plans to vote on the new team of EU commissioners as a whole on October 22, which would enable them to start on November 1 if approved. bordgaisenergy.ie September 2014
  • 3. Bord Gáis Energy Index Significant increase in Natural Gas (21%) and Electricity (17%) wholesale prices mostly offset by fall in Brent Crude Oil as Bord Gáis Energy Index rises by 3% Oil Index 200 150 100 50 Jan-09 Jul-09 Jan-10 Jul-10 Jan-11 Jul-11 Jan-12 Jul-12 Jan-13 Jul-13 Jan-14 Jul-14 *Index adjusted for currency movements. Data Source: ICE Oil 1 Mth 3 Mth 12 Mth -5% -9% -6% Month-on-month the front month Brent crude price fell 5% in euro terms amid rising global supplies and falling demand. Remarkably the benchmark grade for more than half of the world’s oil closed at US$94.67 a barrel. The front month Brent crude price has not closed at this low a level since June 2012 when a bout of risk aversion rattled the oil market with the European sovereign debt crisis at its peak. The falling price has been described as a “collapse”, with sellers of oil having to work harder in a market “awash with oil”. In early October the “collapse” continued as Brent crude oil prices headed towards US$90 a barrel. Global oil and supply forecasts from the influential International Energy Agency (IEA) early in the month set the bearish tone that dominated price behaviour throughout the month. The IEA substantially revised down projected 2014 and 2015 global oil demand growth due to a weaker growth outlook for Europe and China. The IEA expects global oil demand to grow by 901,000 barrels a day this year and by 1.2 million barrels a day in 2015. Critically, at these levels, the IEA expects oil demand growth to be surpassed by non-OPEC crude and natural gas liquids growth of 1.6 million barrels a day in 2014 and 1.3 million barrels a day in 2015. If correct, the implications of this forecast is for a softer price path, especially if US production grows more quickly than expected. Of course this assumes that the turmoil in the Middle East does not impact supply to a significant extent. The tight oil revolution in the US continued to produce some extraordinary numbers in September and it was reported that US production had hit another record of 8.8 million barrels a day. US production of oil and related liquids such as ethane and propane was neck-and-neck with Saudi Arabia in August at 11.5 million barrels a day and, if US production continues to boom, its output is set to exceed Saudi Arabia’s for the first time since 1991. With the US now expected to import significantly less of its liquid fuel energy demand (Nigeria, for example, did not sell a single barrel of oil to the US in July – only four years ago it was one of the top five suppliers) and with Libya’s production rising to 925,000 barrels a day, global prices sank under excess oil. Currently the Libyan central bank is keeping the oil flowing as it is paying all oil and terminal workers as well as the various militia guarding different points of the system. With the Saudi Oil Minister describing the US$95 – US$100 range as a “fair” price, traders began to question whether OPEC would cut its production targets in a bid to control the price slide. However, with demand for crude set to increase on a seasonal basis and as new refineries in the Middle East ramp up, the need to coordinate a reduction in supply in the short term may be unnecessary. There also remains the threat that supplies could tighten because of a “relapse” in other OPEC members, such as Iraq or Libya, which are potentially failed states. A senior Saudi spokesman said that the country had no intention to cut production before (Continued overleaf) bordgaisenergy.ie September 2014
  • 4. Bord Gáis Energy Index Significant increase in Natural Gas (21%) and Electricity (17%) wholesale prices mostly offset by fall in Brent Crude Oil as Bord Gáis Energy Index rises by 3% Oil Index (continued) the next OPEC meeting on November 27 and this could keep market sentiments bearish. Some analysts suggest that prices in the short-term could get as low as UD$80 a barrel. On the demand side the global oil market was jolted by weaker Chinese oil demand. In recent years China has emerged as a larger oil importer than the US, helped in part by the tight oil revolution which is curbing US demand for non-US oil. However, this year it is expected that China’s oil demand is likely to grow by less than 300,000 barrels a day. This is much lower than the average of 560,000 barrels a day of growth since the recession due to signs of third quarter deceleration. The recent drop in oil demand is linked to a huge contraction in diesel demand with the slowdown in industrial production impacting freight transport and industrial consumption. An early summer harvest and a fishing ban off the coast of China through July also weighed on demand. Despite this recent weakness, Asia (China, Japan, India and South Korea) is the only growth market for oil and is key to soaking up growing OPEC and non-OPEC supply. The US and its allies continued to bomb targets in Syria and Iraq to repel Islamic State militants in September. As the conflict has largely spared southern Iraq, which is home to about three-quarters of the country’s oil output, market prices failed to react. The US dollar rally also weighed on Brent crude prices and analysts say that the dollar rally shows little signs of ending as we get closer to the Fed beginning to tighten policy. The Fed confirmed that it would end its massive bond-buying programme which will massively reduce the volume of newly printed dollars entering the financial system. bordgaisenergy.ie September 2014
  • 5. Bord Gáis Energy Index Significant increase in Natural Gas (21%) and Electricity (17%) wholesale prices mostly offset by fall in Brent Crude Oil as Bord Gáis Energy Index rises by 3% Natural Gas Index 300 250 200 150 100 50 Jan-09 Jul-09 Jan-10 Jul-10 Jan-11 Jul-11 Jan-12 Jul-12 Jan-13 Jul-13 Jan-14 Jul-14 *Index adjusted for currency movements. Data Source: Spectron Group Natural Gas 1 Mth 3 Mth 21% 25% 12 Mth -21% In euro terms the average Day-ahead gas price for September was 21% higher month-on-month as the price rose from a monthly average of 40.51p a therm to 48.15p a therm. Despite the month-on-month rise, at 48.15p a therm the September 2014 average price was the lowest average Day-ahead September price since 2010 and compares favourably to the 65.64p a therm September 2013 price. Twelve months ago wholesale prices reflected significant trader anxiety due to low stock levels heading into winter 13. With stocks now at record highs, the market is comfortable in advance of winter 14 and this is being reflected in prices. During the month a frequently undersupplied system supported prompt prices. Numerous minor supply disruptions due to maintenance, cooler temperatures towards the end of the month, news that EDF’s three nuclear plants would not return to the grid until after winter and a reduction in flows from the UK’s LNG terminals combined to push prompt prices higher month-on-month. It was reported in September that, since the end of the month, the European Commission has been asking European gas shippers, via national regulators, to check if contracted flows of natural gas are being met by physical flows from Russia. This suggests that some worry exists among EU leaders of a disruption in the supply of Russian gas to Europe via Ukraine. However, there has been no sign of any disruption so far. Gazprom supplied one third of European gas consumption in 2013. Since June 2014 Ukraine has been without Russian gas supplies due to a dispute over gas prices. Ukraine is now relying on domestic gas extraction, imports of European gas and underground storage facilities to offset increasing demand this winter. Ukraine plans to store up to 17.2bcm of natural gas by October 2014, when the six-month-long high demand season begins, to ensure steady Russian gas supplies to Europe in the winter. However, according to Russia’s energy minister, the Ukraine may need an additional 11bcm of supply this winter. In September Ukraine’s imports of natural gas from Europe increased from 384mcm to 986mcm due to a massive increase in gas imports from Slovakia. Other sources included Poland and Hungary. With the third Gas War rumbling on ominously, the EU did propose an interim solution to the gas dispute in late September in the hope that it would guarantee stable gas deliveries and avoid price shocks this winter. The new agreement was proposed at an EU-Russia-Ukraine tripartite meeting in Berlin. Under the proposed plan Ukraine would pay Russia US$3.1billion by the end of the year. In turn, Russia would guarantee delivery of at least 5bcm of gas to Ukraine at a price of US$385 per 1,000 cu m. The interim solution would be valid through the winter season. By early October both sides had failed to reach an agreement. (Continued overleaf) bordgaisenergy.ie September 2014
  • 6. Bord Gáis Energy Index Significant increase in Natural Gas (21%) and Electricity (17%) wholesale prices mostly offset by fall in Brent Crude Oil as Bord Gáis Energy Index rises by 3% Natural Gas Index (continued) A key stumbling block is Ukraine’s requirement that the agreed gas price is based on market-setting mechanisms rather than being dependant on Russian discounts that rest on political consideration which could be easily cancelled. The Ukraine views Russia’s offer of US$385 per 1,000 cu m as unacceptable. At the beginning of October it is being reported that no date has yet been set for the next trilateral meeting. Downward pressure on curve prices emerged, in particular towards the end of September, as contracts shed geopolitical risk premium in anticipation of a positive outcome from the trilateral negotiations between Russia, Ukraine and the EC on the gas dispute. In addition, forecasts that point to a milder start to the winter period added further pressure. Forecaster WSI said in September that it “expects widespread above-normal temperatures across the UK for the October-December period”. Bumper stocks, easing geopolitical pressures and clement weather forecasts meant that both the October 2014 and winter 2014 contracts expired at the end of September at four-year lows. bordgaisenergy.ie September 2014
  • 7. Bord Gáis Energy Index Significant increase in Natural Gas (21%) and Electricity (17%) wholesale prices mostly offset by fall in Brent Crude Oil as Bord Gáis Energy Index rises by 3% Coal Index 200 150 100 50 Jan-09 Jul-09 Jan-10 Jul-10 Jan-11 Jul-11 Jan-12 Jul-12 Jan-13 Jul-13 Jan-14 Jul-14 *Index adjusted for currency movements. Data Source: ICE Coal 1 Mth 3 Mth 12 Mth -2% 7% -6% The front month European wholesale coal futures contract fell 2% month-on-month to close at US$72.20/mt compared to the August close of US$76.95/mt. At US$72.20/mt it was the lowest closing monthly front month European wholesale coal futures price since September 2009. Market sources cited thin demand from European buyers amid ample supply (there are reports of a lot of coal being offered from Colombia and Russia currently) and a weak euro. Uncertainty concerning the European economy is adding an additional bearish element. Some analysts are commenting that the market is likely to remain depressed, and might fall further, but it is believed that US$76.95 will be very hard to break through more than temporarily. Others are of the view that there was probably room for spot prices to fall “several more dollars” and that the downtrend could continue as long as there are miners that are still cash positive. This is being supported by the strength of the US Dollar. According to some, the stronger dollar may have removed the floor of the market, leaving producers with the same unit costs. In September Standard Bank provided its view on the short-term future of the Atlantic coal market. According to it, a lower pricing outlook has been generated from Colombia’s higher export rate (with the potential to reach 80 million-85 million mt next year) and the availability of further spill over tons resulting from China’s import cuts. Recently the Chinese National Development and Reform Commission moved to restrict coastal power plant import levels by 5million mt/ month from September to December. With coal a dirty word not only for the Europeans, but now also for the Chinese, Standard Bank fail to envisage any significant price rallies, barring short-term Black Swan events or typical seasonal squeezes. bordgaisenergy.ie September 2014
  • 8. Bord Gáis Energy Index Significant increase in Natural Gas (21%) and Electricity (17%) wholesale prices mostly offset by fall in Brent Crude Oil as Bord Gáis Energy Index rises by 3% Electricity Index 200 150 100 50 Jan-09 Jul-09 Jan-10 Jul-10 Jan-11 Jul-11 Jan-12 Jul-12 Jan-13 Jul-13 Jan-14 Jul-14 Data Source: SEMO Electricity 1 Mth 3 Mth 17% 13% 12 Mth -8% In September the monthly average Irish wholesale electricity price rose by 17% month-on-month. Similar to last month, the increase is associated primarily with rising wholesale gas prices in the UK (as gas powered generation dominates the generation mix on the island of Ireland, the price of imported gas from the UK has a significant influence on Irish wholesale electricity prices). In September “baseload” gas powered plants set the wholesale price approximately 60% of the time. The year-to-date (YTD) level is 56%. Other factors that influenced wholesale electricity prices include a low monthly production volume from the island’s fleet of wind farms. In September wind met over 6% of the island’s power demand. This compares negatively to the YTD average of 15% as September’s clement weather conditions were accompanied by low wind speeds. In general, when producing electricity, wind turbines can force more expensive power plants off the system and the impact reduces wholesale electricity prices at the time. Month-on-month the average monthly “clean spark” rose by nearly €2/MWh to over €14/MWh due to efficient gas and coal plant outages, interconnector outages, low wind volumes and the use of “peakers” and pump storage units to balance the system. The “clean spark” is the theoretical gross margin of a gas-fired power plant from selling a unit of electricity, having bought the fuel required to produce this unit of electricity and the cost of abating the carbon emitted. The falling cost to abate carbon emitted when producing electricity by burning coal and gas applied some very limited downward wholesale price pressure. bordgaisenergy.ie September 2014
  • 9. Bord Gáis Energy Index Significant increase in Natural Gas (21%) and Electricity (17%) wholesale prices mostly offset by fall in Brent Crude Oil as Bord Gáis Energy Index rises by 3% FX Rates 2.0 1.5 1.0 0.5 Jan-09 Jul-09 Jan-10 Jul-10 Jan-11 Jul-11 Jan-12 Jul-12 Jan-13 Jul-13 Jan-14 Jul-14 FX Rates EURUSD -4% -8% -7% EURGBP 1 Mth 3 Mth 12 Mth 1 Mth 3 Mth 12 Mth -2% -3% EURUSD EURGBP -7% A major economic issue has been emerging in recent months and it is that of wage stagnation throughout the rich world. Stagnant wages and the risk of deflation are coupled and the world’s major central banks, particularly the ECB, are concerned that deflation may take hold. Rising productivity and in turn rising real wages would alleviate deflationary concerns but these forces have been absent in recent years as labour costs have come under pressure to reverse lost competitiveness, particularly in the crisis-hit countries of the euro area. As rising real wages are inflationary, the central banks of the US and Britain will be searching for evidence of rising wages and this will provide the market with some clues as to when these banks will be ready to push interest rates higher. In September it was again evident that real wage growth in the UK remains a distant memory with pay only rising 0.7% year-on-year. As a consequence most of the Bank of England’s Monetary Policy Committee members think that the economy can continue to grow without sparking inflation. But the key question is for how long? With UK inflation falling in August, the pressure on the Bank of England to introduce a rate increase is being reduced despite forecasts that the UK is expected to be the fastest growing advanced economy this year. This scenario is also being played out in the US with labour market slack and dormant inflation explaining why the stimulus of low interest rates will remain for some time yet. Unlike the Fed or the Bank of England, who are searching for inflationary pressures, the ECB is almost primed to tackle deflation and is debating to adopt full-blown Quantitative Easing. With the Bank of England and the US Fed monitoring inflationary pressures and wage growth to help determine when they should act to raise interest rates, the ECB faces deflationary concerns and has pushed interest rates to record lows. The prospect of rising rates and economic performance in the UK and US is in sharp contrast to the euro zone and this explains the euro’s on-going weakness. bordgaisenergy.ie September 2014
  • 10. Bord Gáis Energy Index Significant increase in Natural Gas (21%) and Electricity (17%) wholesale prices mostly offset by fall in Brent Crude Oil as Bord Gáis Energy Index rises by 3% Market Outlook In recent times the cause of tumbling oil prices has been linked to a slowing world economy as forecasted global demand growth is expected to be incapable of shocking up a new wave of growing supplies. Despite the concerns associated with the cause of weaker prices (a weakening world economy and decelerating global trade), at first glance weaker Brent crude prices offer benefits to most developed economies in the west. For countries that are fuel importers, falling commodity prices have the potential to increase disposable incomes and boost economic growth. However, low prices act as an economic drag on producing countries and could ultimately threaten stability in countries where high oil prices have supported generous spending. Assuming supply risks are minimised, China’s demand for commodities in particular will determine prices in the near term. However, with authorities trying to rebalance growth away from commodity intensive investment in housing and other infrastructure, commodity prices could fall further. Right now parts of the world are benefiting from a wave of new oil supplies which were stimulated by prices as high as US$144 a barrel in the summer of 2008. Despite the promise of lower prices being carried on this wave, it has the potential to weaken global economic growth as commodity producing emerging economies (who have emerged as big drivers of global GDP growth in recent years) suffer. A weaker oil promise may also nudge the global growth pendulum back to the west if it transpires that the unprecedented Central Bank interventions of recent years have fostered an environment that can benefit from the gift of lower oil prices. On gas, the impact of full stores could help to keep prices for delivery over the first half of the winter relatively weak. The current lull in developments over the supply of gas into Ukraine from Russia has removed a little of the risk premium. However, as the situation remains unresolved and the backdrop grows increasingly precarious with the beginning of winter and Ukraine essentially “short” of gas, it has the potential in certain scenarios to be explosive. Re-weighting of Bord Gáis Energy Index Following the SEAI’s 2011 review of energy consumption in Ireland, there was a 6.4% drop in overall energy consumption. Oil continues to be the dominant energy source with most of the oil used in transport and the remainder being used for thermal energy. For the purposes of the Bord Gáis Energy Index, the total final energy consumption in Ireland fell 1,089 ktoe (toe: a tonne of oil equivalent is a unit of energy, roughly equivalent to the energy content of one tonne of crude oil) between 2009 and 2011. This fall was made up of a 1,022 ktoe drop in oil consumption (down 13.5%), a 20 ktoe drop in natural gas (down 12.6%), a 7 ktoe drop in electricity (down 0.3%) and a 40 ktoe drop in coal (down 10.98%). The Bord Gáis Energy Index has been re-weighted in January 2013 to reflect the latest consumption data. The impact has been minimal and has resulted in slight reductions in the share of oil and gas and a slight increase in the weighting of electricity in the overall Index. Oil 61.96% Electricity 3.1% 20.22% For more information please contact: Bord Gáis Energy John Heffernan (Gas & Power Trader) 023 8895123/087 2407566 Gas 14.72% Coal The contents of this report are provided solely as an information guide. The report is presented to you “as is” and may or may not be correct, current, accurate or complete. While every effort is made in preparing material for publication no responsibility is accepted by or on behalf of Bord Gáis Energy Limited, the SEMO, ICE Futures Europe, the Sustainable Energy Authority of Ireland or Spectron Group Limited (together, the “Parties”) for any errors, omissions or misleading statements within this report. No representation or warranty, express or implied, is made or liability accepted by any of the Parties or any of their respective directors, employees or agents in relation to the accuracy or completeness of the information contained in this report. Each of the Parties and their respective directors, employees or agents does not and will not accept any liability in relation to the information contained in this report. Bord Gáis Energy Limited reserves the right at any time to revise, amend, alter or delete the information provided in this report. bordgaisenergy.ie September 2014