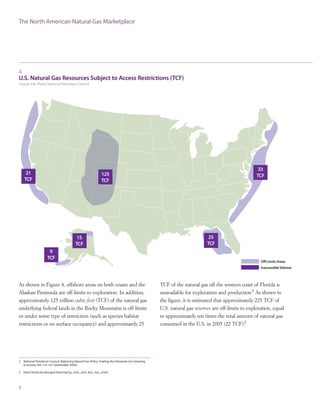
SlideShare a Scribd company logo
1 of 32
Understanding
Natural Gas Markets
Overview 1
The North American Natural Gas Marketplace 3
Table of Contents
Natural Gas Demand 9
Natural Gas Supply 12
Summary 25
Glossary 26
Understanding
Natural Gas Markets
Addressing these questions requires an understanding of three
important points:
N North American prices for natural gas are driven by the
interaction of natural gas supply available from North
American natural gas and oil fields and demand. Demand
depends, in large part, on the relative prices of other fuels,
economic growth, and weather, which drives heating
demand in the winter and demand for gas-fired generation
for cooling in the summer.
N The U.S. natural gas market is highly competitive.
Natural gas market prices are determined competitively
on spot and futures* markets reflecting current and
expected supply and demand conditions. The market
price is determined through the actions of thousands
of well-informed buyers and sellers.
N Natural gas consumed in the United States is primarily
produced domestically or imported from Canada. Planned
increases in U.S. imports of liquefied natural gas (LNG)
would, if realized, begin to integrate the United States
into a growing world market for natural gas.
Its importance has grown since the mid-1990s. Natural gas
is an attractive fuel because it is clean burning and efficient,
and because ample supplies of natural gas have been available
from domestic resources and from Canada. Throughout the
1990s, these factors and the low cost of natural gas helped
lead to increased investment in facilities using natural gas.
For example, the vast majority of new electricity generation
capacity built in the United States in the past decade has been
natural gas-fired. However, for the last five to seven years,
the price of natural gas has been trending upward (Figure 1).
Of course, the result of increasing natural gas prices has
been increased residential heating bills, increased fuel costs
to electric generators using natural gas, and decreased
competitiveness of U.S. industries that rely on natural gas.
Given the effect of higher natural gas prices on consumers’
budgets and on firms’ competitiveness, consumers, business
people, and policymakers are asking what has led to the
increase in North American natural gas prices.
Overview
1
Natural gasis an important source
of energy for the United States.
* Italicized words appear in the glossary.
1
Average Natural Gas Spot Prices at Henry Hub, July 1996 - August 2006
Source: Platts
2
As described in this brochure, North America’s demand for
natural gas is strong as a result of continued economic growth
and other factors. In addition, high oil prices have made
natural gas a relatively more attractive fuel because fewer
industrial natural gas users can profitably switch from natural
gas to oil products for their energy needs. However, on
the supply side, despite increased drilling activity, North
American natural gas supply has leveled off due to the mature
age of existing natural gas fields. Furthermore, significant
natural gas resources are currently off-limits to development.
Political and market responses to high prices can include
increased conservation of natural gas, increased access
to currently restricted resources, improved extraction
technology, expansion of infrastructure to bring Alaskan
natural gas to the lower 48 states, and importation of natural
gas, both via pipeline from Canada and LNG from overseas.
Natural gas provides 23 percent of the marketable energy
consumed in the United States.1
Oil products and coal
are the other two major sources of energy. Natural gas is
a valued source of energy because it is versatile and burns
cleanly. As a result, natural gas use is commonplace in
applications including cooking, residential and commercial
heating, industrial process feed stocks, and electric generation.
Physical Structure of the U.S. Natural Gas Industry
Figure 2 is a schematic illustration of the physical structure
of the natural gas industry and illustrates the principal
activities required to bring gas to consumers. The primary
activities are:
Exploration and Production
Exploration and production include finding and producing
natural gas from natural gas fields or associated gas that is
produced with crude oil.
Processing
Natural gas processing removes impurities and the higher-
valued products and prepares a dry gas stream that meets
industry standards for transportation in high-pressure
pipelines.
1 Energy Information Administration,“Energy Basics 101,”
www.eia.doe.gov/basics/energybasics101.html.
The North American Natural Gas Marketplace
3
counts natural gas as an
important part of its portfolio.
U.S. energy
Transportation
Natural gas is transported in high-pressure pipelines from
producing areas to industrial end users, storage areas, and
local distribution companies.
Storage
The natural gas production and delivery system is not
designed to produce and transport the full amount of
natural gas consumers want during periods of peak demand.
In order to meet peak demand, large customers and
distribution companies put gas into underground storage,
mostly near final consumers. The stored gas is withdrawn
to meet consumers’ needs during times of peak demand,
such as a cold winter day.
Local Distribution
Local distribution companies own and operate the network
of pipes that carry natural gas from high-pressure trunk lines
to final consumers. These consumers include residential,
commercial, and industrial customers.
Liquefied Natural Gas
The United States currently imports about three percent
of its natural gas from overseas producers in the form of
liquefied natural gas. LNG can also be stored and used
to meet peak demand.
4
2
Physical Flow of Natural Gas
Figure 3 shows some of the primary areas where natural
gas is produced in the United States. As the figure shows,
natural gas is found in a large number of states. Major
onshore production areas include the Rocky Mountains,
Texas, and Louisiana. In addition, significant natural gas
comes from offshore production in the Gulf of Mexico.
The North American Natural Gas Marketplace
5
3
Selected U.S. Natural Gas Producing Regions and Pipeline Flows
Source: EIA, Platts, State of Alaska Department of Natural Resources
6
4
U.S. Natural Gas Resources Subject to Access Restrictions (TCF)
Source: EIA, Platts, National Petroleum Council
As shown in Figure 4, offshore areas on both coasts and the
Alaskan Peninsula are off-limits to exploration. In addition,
approximately 125 trillion cubic feet (TCF) of the natural gas
underlying federal lands in the Rocky Mountains is off-limits
or under some type of restriction (such as species habitat
restrictions or no surface occupancy) and approximately 25
7
TCF of the natural gas off the western coast of Florida is
unavailable for exploration and production.2
As shown in
the figure, it is estimated that approximately 225 TCF of
U.S. natural gas reserves are off-limits to exploration, equal
to approximately ten times the total amount of natural gas
consumed in the U.S. in 2005 (22 TCF).3
The North American Natural Gas Marketplace
2 National Petroleum Council, Balancing Natural Gas Policy: Fueling the Demands of a Growing
Economy, Vol. 2 at 127 (September 2003).
3 http://tonto.eia.doe.gov/dnav/ng/ng_cons_sum_dcu_nus_a.htm.
5
Breakdown of Natural Gas Price Paid by Residential Consumers During the Heating Season, 2001-2006
Source: EIA
Once natural gas is produced and processed, it is injected
into pipelines for transmission to customers and local
distribution companies. Transportation and delivery costs
are a significant portion of the cost of delivered natural gas.
The rates charged by both the natural gas pipelines and
the local distribution companies are regulated by federal
or state regulators.
In recent years, transportation and delivery charges have
declined from 62 percent to 42 percent of the final natural
gas price paid by residential consumers during the heating
season (November through March), while the cost of the
natural gas itself has increased from 38 percent to 58
percent of the consumer’s average heating season price
(See Figure 5).
8
In the late 1980s and early 1990s, demand for natural gas
grew rapidly in the United States, from around 17 TCF in
1983 to around 22 TCF in 1995, a 30 percent increase.
During most of this period, natural gas was a less expensive
source of energy than the oil products that it primarily
competed against. As a result, the low natural gas prices
9
Natural Gas Demand
Demand
More than 60 million U.S. households use natural gas for
water heating, space heating, or cooking. In total, natural gas
accounts for more than 50 percent of the fuel used to heat
U.S. homes.4
Residential and commercial heating demand for
natural gas is highly weather-sensitive, making weather the
biggest driver of natural gas demand in the short term. As
a result, natural gas demand is highly “seasonal” in nature,
with significant “peaks” in the winter heating season, as
illustrated in Figure 7. Natural gas pipelines and distribution
companies must plan to meet customers’ needs during the
peak demand periods. The seasonal nature of heating
demand can cause the price of natural gas to vary widely
at different times of the year.
for natural gas has grown rapidly.
of the 1990s and the expectation that prices would stay low
contributed to large investments in facilities, particularly
electric generation, that use natural gas. In addition,
increasingly strict environmental regulations and the
clean-burning qualities of natural gas have encouraged
many energy consumers to choose natural gas.
Figure 6 shows the consumption of natural gas by sector of
the economy. As the figure shows, the industrial sector is the
largest user of natural gas, typically consuming more than
35 percent of total use. Historically, the residential sector
has been the next largest user of natural gas, consuming
approximately 22 percent of the total. However, the use of
natural gas by electric generators has increased markedly
since the late 1990s, driven in part by the ease of getting
permits to build gas-fired generation relative to other types
of generation and by the low cost of natural gas. In fact, the
capacity of natural gas-fired generation has tripled since
1999, and the quantity of natural gas used by the electric
power sector grew by more than 50 percent between 1996
and 2005. Commercial use of natural gas for heating office
buildings and retail space has remained relatively constant.
4 http://www.eia.doe.gov/kids/energyfacts/sources/non
renewable/naturalgas.html#WHAT%20IT%20IS%20USED%20FOR.
6
U.S. Natural Gas
Consumption by Sector,
January 1990 -
December 2005
Source: EIA
10
7
Natural Gas
Consumption,
Production and
Storage Activity,
January 2001 -
June 2006
Source: EIA
As described on the previous page, the natural gas
production and transmission system is not designed
to move the full amount of peak demand from producing
areas to consumers. In order to meet high seasonal winter
demand for natural gas, a significant amount (ten percent or
more of our annual consumption) is put into storage during
periods of warm weather and lower demand. Figure 7
shows the pattern of natural gas production and storage.
The relatively flat purple line shows natural gas production
and imports into the United States. The figure shows
production remains
essentially flat throughout
the year, but, as the lighter
purple line shows,
consumption rises
dramatically in the winter
and falls in the spring
through the early fall.
Heating demand for natural
gas puts upward pressure
on natural gas prices during
winter, contributing to the
tighter market that exists
for natural gas in the winter
months, and serving to
compensate those who place gas in storage during lower-price,
off-peak periods. Regulated local distribution companies,
however, will place gas in storage for peak demand
independent of prices because of their regulator mandate
to be able to serve their customers’ peak demands. Thus,
natural gas inventory levels are driven, in part, by regulatory
factors in addition to market factors.
Despite the storage of natural gas and the industry’s
recognition that demand will rise in the winter months,
winter natural gas prices can fluctuate quite dramatically
11
Natural Gas Demand
with changes in weather and the amount of natural gas
in storage. The reasons for this price volatility are straight-
forward. For example, if storage levels appear to be low
in autumn, there will be concern that it will be difficult
to meet peak demands throughout the winter, and traders
may be willing to pay more to secure natural gas volumes
for winter month deliveries. This results in upward pressure
on market prices. In contrast, warmer than expected
weather during the winter of 2005-2006 led to storage being
quite full as the winter progressed and natural gas prices
dropped in response to
these ample supplies.
Available supply and
demand are tightly
balanced today. This
means, for example, that
an interruption of supply,
such as what happened
when hurricane damage
shut down substantial gas
production in the Gulf of
Mexico in 2005, can lead
to rapid and dramatic spikes
in prices. Investments are
intended to bring on new
supply, but new supplies require months or years to bring
online. And the short-term demand response to high prices
is constrained by the fact that many natural gas consumers
(especially residential and commercial consumers) do not
have the ability to switch to alternate fuels or to significantly
reduce their energy use in the short-term. In the longer run,
high prices do reduce demand. For example, some U.S.
industrial gas users like chemical and fertilizer plants have
shut down permanently.5
Weather and storage levels also
continue to influence natural gas markets on a seasonal basis.
5 National Petroleum Council, Balancing Natural Gas Policy: Fueling the Demands
of a Growing Economy, Vol. 2 at 292 (September 2003).
12
97%of theU.S. gas
supply comes from
domestic sources
and Canada.
Figure 8 shows the total domestic production of natural
gas in the United States. As the figure shows, domestic
production of natural gas peaked in 2001 and has declined
slowly since that time. In 2005, production was seven percent
lower than in the peak year 2001. This decline is, in part,
the result of the fact that some of the key natural gas fields
have matured and are less productive than earlier in their
lives, whereas new developments of unconventional resources
often have lower productivity. In addition, significant
undeveloped natural gas resources remain off-limits to
exploration. Moreover, the reduced level of U.S. production
in 2005 is partly attributable to interruptions to offshore
production as a result of hurricanes.
8
U.S. Natural Gas Marketed Production, 1990 -2005
Source: EIA
Natural Gas Supply
13
Natural Gas Supply
Figure 9 shows the sources of natural gas supply to U.S.
consumers. In recent years about 82 percent has come from
domestic sources.
9
Historical and Projected Natural Gas Supply by Source, 1990-2025
Source: EIA
Approximately 15 percent of U.S. natural gas consumption
is imported from Canada. The remaining three percent comes
from LNG imports.
14
The production of natural gas from the Gulf of Mexico shows
the impact of the maturation of the gas fields in a producing
area on total production. Figure 10 depicts natural gas
production from the Gulf of Mexico and the share of that
production that comes from deepwater wells drilled in more
than 200 meters of water.
10
Natural Gas Production of the Gulf of Mexico Federal Offshore, 1992-2005
Source: Minerals Management Service
Total Gulf production peaked in 1997, but the decline in Gulf
production was slowed by the increased drilling of deepwater
wells. Today, approximately 38 percent of Gulf production
comes from deepwater wells. Thus, the industry has had to
move to more expensive resources and improved technology
to stem the decline of production.
Natural Gas Supply
15
Figure 11 shows the U.S. production of conventional
natural gas, offshore natural gas (primarily from the
Gulf of Mexico), and unconventional natural gas, which
includes natural gas from deep wells, coalbed methane,
tight sands, and other sources that are more difficult and
costly to develop than conventional resources. The amount
of natural gas produced from unconventional resources
is increasing while production from conventional and
offshore resources is declining. Developing these
unconventional resources would be further facilitated
by advances in drilling and other technology and by
increased access to resource areas that are off-limits.
11
Natural Gas Production by Source, 1990-2025
Source: EIA
Clearly, the tightening supply and demand balance in
North America helps explain the upward trend in natural
gas prices over the last five to seven years. Conventional
resources that are currently accessible to natural gas
producers are beginning to mature. As a result, producers
have had to shift their efforts to resources that are more
difficult and more expensive to develop.
16
12
New Producing Natural Gas Wells and Wellhead Price, 1990-2005
Source: EIA
The natural gas industry has responded to higher natural
gas prices by increasing its efforts to find and develop
natural gas resources. Producers have sought out and
developed unconventional resources such as coalbed
methane, tight sands, and deepwater resources.
In addition, as shown in Figure 12, natural gas producers
have increased the number of wells drilled in the United
States from approximately 11,000 in 1999 to approximately
27,000 in 2005. Improvements in technology have also led
to increased success in drilling exploration and development
wells. As shown in Figure 13 (next page), the percentage
of dry wells fell steadily over the last decade.
As production from traditional U.S. supply basins including
the shallow portions of the Gulf of Mexico is flat or declining,
the United States will have to look to new sources and new
technologies in order to maintain its natural gas supply.
Increased Domestic Supply
In the continental United States there is potential for
increased supplies from the Rocky Mountain region,
deepwater sections of the Gulf of Mexico, and new areas.
Increases in natural gas supply in both the Rocky Mountains
and the eastern Gulf of Mexico are limited by drilling
restrictions, however.6
Canadian Imports
As in the United States, the Canadian supply situation is
characterized by declining production from mature supply
resources and increasing production from unconventional
resources as well as increased supplies from the Arctic region.
Thus, overall Canadian production is projected to remain
relatively flat and exports to the United States, after factoring
17
Natural Gas Supply
13
Dry Rate for
Exploratory and
Development
Wells Drilled,
1990-2005
Source: EIA
in expanding Canadian use, are expected to decline. Canada
is expected to use more natural gas to heat buildings and to
produce unconventional oil from tar sands, which uses heat
from natural gas. According to the Energy Information
Administration’s (EIA) most recent forecast, pipeline imports
from Canada to the United States reached their peak between
2000 and 2005, and will decline slowly but steadily for the
next two decades (see Figure 9). Expanded production in
developed areas in Canada and in the lower 48 states is
attractive because there is an extensive pipeline network
available in most areas that makes it possible to bring this
gas to market quickly. There are other potentially large
sources of natural gas available to U.S. consumers, but some
will require substantial investments for these supplies to be
brought to market.
U.S. Arctic Gas Supplies
Currently, the United States has large natural gas resources in
the Arctic regions of Alaska (e.g., Prudhoe Bay). Proved gas
6 National Petroleum Council, Balancing Natural Gas Policy: Fueling the Demands of a Growing
Economy, Vol. 2 at 127 (September 2003).
18
14
U.S. LNG Imports by
Month and Monthly
Average Natural Gas
Spot Prices,
July 1996-June 2006
Source: EIA, Platts
developers have announced plans to build more than 40
additional LNG import terminals.9
However, LNG terminals
can be difficult to permit and build, and it is uncertain
how many of these planned terminals will eventually be
constructed.
While most analysts agree with the forecast of the EIA that
the contribution of LNG to overall North American natural
gas supply will grow, the ultimate contribution of LNG to
supply remains somewhat uncertain. Even accounting for the
increases in natural gas prices in the United States in recent
years, natural gas prices at times have been still higher in
other parts of the world, such as Japan and parts of Europe,
that depend on LNG for a significant share of their natural
gas supply.10
The growing role of LNG in North America
will increasingly connect what has been a regional market
to the global market for LNG. As a result, U.S. natural gas
prices will, over time (should this trend continue), increasingly
follow global demand and supply trends, as do U.S. oil prices.
reserves on the North Slope of Alaska total approximately 45
TCF and potential reserves have been estimated to be more
than 250 TCF.7
These natural gas resources are currently not
connected to pipelines that can bring this gas to markets in
the lower 48 states, though there are plans to build such a
pipeline. This pipeline could carry as much as 4 billion cubic
feet (BCF) per day,8
or approximately seven percent of
average daily U.S. consumption in 2005.
LNG Imports
The United States currently imports a small amount of natural
gas from overseas in the form of LNG. In response to high
natural gas prices in the United States, LNG imports rose
rapidly beginning in 2002, as shown in Figure 14. In recent
years, the United States has increased its capacity for
importing LNG by reopening old LNG terminals that were
built during the natural gas shortages of the 1970s and 1980s
but were then mothballed when natural gas prices were low,
and by constructing new LNG import capacity. Moreover,
7 National Petroleum Council, Balancing Natural Gas Policy: Fueling the Demands of a Growing Economy, Vol. 2 at 110 (September 2003).
8 National Petroleum Council, Balancing Natural Gas Policy: Fueling the Demands of a Growing Economy, Vol. 2 at 202 (September 2003).
9 http://www.ferc.gov/industries/lng.asp#skipnavsub.
10 Natural Gas Week,“U.S. LNG Import Activity Picks Up with Softening of Global Market,”May 15, 2006, at 7.
Most residential and commercial customers purchase natural
gas from a local distribution company. In contrast, many
industrial customers have the option to purchase natural gas
from a marketer or producer instead of from the distribution
company.
There are many different types of buyers and sellers who
are motivated to buy and sell gas under different types of
commercial arrangements. As a result, gas is sold on a spot
market basis, under longer-term contracts with fixed pricing
or terms that track market prices, and under contracts with
other types of pricing provisions. Marketers are able to
meet customers’ differing needs by bringing together a large
number of buyers and sellers. In addition, marketers and
other buyers and sellers of natural gas are able to use
financial instruments traded on exchanges to hedge the
risks associated with price volatility.
How Natural Gas Is Traded
Figure 15 shows schematically some of the types of natural gas
transactions that take place as gas makes its way from the
fields where it is produced to end users’ burner tips. The
natural gas industry in the United States is highly competitive,
with literally thousands of producers.11
Some producers have
the ability to market their natural gas and may sell it directly
to local distribution companies or to large industrial buyers
of natural gas. (Some of these large industrial buyers are “on-
system” end users, meaning that they receive physical natural
gas deliveries from a local distribution company. Others are
“off-system end users,” meaning they are directly connected
to an interstate pipeline.) Other producers sell their gas to
marketers who have the ability to aggregate natural gas into
quantities that fit the needs of different types of buyers and
to transport gas to their buyers. Marketers may be large or
small and sell to local distribution companies or to
commercial or industrial customers connected directly to
pipelines or served by local distribution companies.
Natural Gas Supply
19
15
Commercial and Financial Arrangements
11 As noted previously, federal and state regulators regulate the prices charged by most natural
gas pipelines and local distribution companies for the transportation and distribution services
they provide. Natural gas prices themselves are not regulated today.
20
16
Natural Gas Market Centers Serving as Major Trading and Transshipment Points
Source: EIA
Note that pipelines do not buy and sell natural gas. Most
of the major natural gas pipelines are federally regulated
interstate pipelines. These pipelines are limited to providing
transportation services, including storage.12
Thus, pipelines
move gas at government-regulated rates on behalf of buyers
and sellers, but do not participate in the buying and selling
of natural gas.
The domestic natural gas marketplace has a highly
competitive spot market where brokers and others buy and
sell natural gas. Figure 16 shows some of the points where
natural gas for physical delivery is actively traded in the
continental United States. These points are market centers
where brokers actively trade and prices are established.
In addition to these market centers, natural gas is actively
traded at many other locations, including segments of
individual pipelines and locations where pipelines
interconnect with local distribution companies.
12 Prior to the federal restructuring of regulation of the interstate natural gas pipeline system,
natural gas pipelines purchased gas from producers and sold it to the customers connected
to the pipeline. This system was inefficient because it severely limited the number of buyers
for natural gas and kept the market from operating competitively. These regulations were part
of the overall regulation of the natural gas industry that was dramatically altered beginning
in the late 1970s through the mid 1980s.
The most important market center in the United States is
the Henry Hub, located in southern Louisiana, because it
is the most active and highest-volume trading point. The
Henry Hub is interconnected with 16 different intra- and
interstate pipelines and, thus, effectively interconnects to
all producing and consuming regions throughout North
America. Because of its central location and its high degree
of interconnectedness, the Henry Hub is used as the delivery
point for the New York Mercantile Exchange’s (NYMEX)
natural gas futures contract and a pricing reference point for
virtually the entire North American natural gas market.
Market participants buy and sell natural gas on a “spot” basis
every day at the trading points shown in Figure 16, as well
as at dozens of other points. Spot market transactions are
normally conducted over the internet or by telephone, with
the buyer agreeing to pay a negotiated price for the natural
gas to be delivered by the seller at a specified delivery point.
Natural gas spot prices reflect daily supply and demand
balances and can be volatile.
In addition to daily spot transactions, monthly spot
transactions are often entered during “bid week,” the last
five business days of a month. During bid week, buyers and
sellers arrange for the purchase and sale of physical natural
gas to be delivered throughout the coming month, including
making delivery arrangements with pipelines.
21
Natural Gas Supply
Many customers purchase natural gas under longer-term
contracts that provide for delivery of gas for a specified
period of time. The length of time can vary. Frequently the
prices in longer-term contracts are not fixed, but are instead
indexed to prices that are regularly published in the trade
press. A number of trade publications publish index prices
based on their surveys of natural gas buyers and sellers to
determine the prices they pay (or receive) for natural gas
(at market locations such as those shown in Figure 16) in
daily or monthly transactions.
Futures and Other Financial Contracts
In addition to the contracts for physical supply described
previously, natural gas derivatives are traded on the New
York Mercantile Exchange. A NYMEX natural gas futures
contract requires the seller to deliver (and the buyer to take
delivery of) natural gas at the contractually agreed price, in
a specified future month, at the Henry Hub.13
The price
to be paid for delivery in the future month when the futures
contract matures is determined at the time the contract is
sold. As expectations about the value of natural gas at the
time of delivery change, the value of the futures contract
will change as well.14
13 The NYMEX natural gas futures contract stipulates the purchase and sale of 10,000 MMBtu
of natural gas at the Henry Hub trading point in Louisiana in the delivery month. As noted,
the Henry Hub is the nexus of 16 intra- and interstate natural gas pipeline systems that
draw supplies from the region's gas supplies and serve markets throughout the United States.
14 Other NYMEX-traded natural gas derivatives include options contracts, calendar spread options,
and basis swap futures contracts. In addition to the derivatives available on NYMEX, market
participants trade other derivatives in over-the-counter (OTC) markets.
22
17
Natural Gas Futures Contracts Traded by Year, 1990*-2005
*Annual volume for 1990 begins in April | Source: NYMEX
The futures market for natural gas has grown rapidly from its
inception in 1990. Figure 17 shows the number of natural gas
contracts traded on the NYMEX each year between 1990
and 2005. This market is made up of a large number of
buyers and sellers, as well as different types of buyers and
sellers. Parties with commercial interests frequently use
futures contracts to reduce their exposure to price risk by
locking in the price they will pay (or receive) for natural gas
to be delivered in some future month. For example, a natural
gas producer who expects to produce and sell natural gas
each month for the next several years can use the NYMEX
futures contract to lock in the price that the producer will
receive for that gas.
Derivatives such as the NYMEX futures contract make it
possible for market participants to avoid the risk that results
from highly volatile natural gas prices in the physical market.
For example, a manufacturing facility that uses natural gas
may face highly volatile cash flows as a result of dramatic
fluctuations in natural gas prices from month to month and
day to day. To reduce these risks, the facility can purchase
physical natural gas using contracts with indexed prices and,
in addition, purchase financial derivatives that rise in value
when gas prices rise and fall in value when gas prices fall. The
result is that when prices are high, the value of the derivatives
will rise to offset the additional cost of gas, and vice versa.
Natural Gas Supply
23
non-commercial traders have increased dramatically since
early 2002. The market benefits from the trading activity
of all types of traders because to trade effectively over a
sustained period, these parties must be well-informed, and
their participation in the market ensures that market prices
reflect all of the information available about current and
future supply and demand conditions.
In addition, the market includes a growing number of parties
who do not have a commercial interest in the natural gas
industry. Non-commercial parties buy and sell futures
contracts in response to contract prices (rather than to hedge
natural market positions) and in doing so they provide
insurance to commercial parties and liquidity to the futures
market. As shown in Figure 18, open contracts held by these
18
Weekly Open Contracts by Trader Type, January 2000 - September 2006
Source: The Commodity Futures Trading Commission (CFTC)
24
Futures markets also provide valuable information about
expectations for supply and demand conditions in the
physical market that will determine the price for gas
scheduled for delivery on a specified future date. For
example, if in 2005 the price of a futures contract for the
delivery of gas in April 2006 is $8 per MMBtu, this
represents thousands of buyers’ and sellers’ best estimate
of what the price (in this case, increase) of gas will be for
physical delivery in April 2006.15
This price discovery
function is beneficial because it provides market information
to those who can best respond by, for example, putting
additional gas in storage or taking steps to switch to a
different fuel.
19
Natural Gas Futures Settlement Price as of April 14, 2003
Source: Platts
Figure 19 provides a snapshot of futures contract prices on
a day in April 2003. The figure shows prices for natural gas
to be delivered in each of the next 36 months. The futures
contract prices reflect buyers’ and sellers’ expectations as
of April 2003 that spot natural gas prices would be higher in
future heating seasons (October through March) and lower
in non-heating seasons (April through September).
15 Markets rely in part on the number of buyers and sellers involved for credibility of pricing.
The result – a reported price that reflects what multiple parties are willing to pay or receive –
provides efficiency and reduces costs.
Thousands of U.S. companies produce natural gas and
thousands of consumers purchase it, every hour of every day.
The steep rise in natural gas prices in recent years reflects a
natural market response to the tight supply and demand
balance. Demand for natural gas has been strong, especially
from the power sector where gas-using capacity tripled after
1999. On the supply side, most natural gas consumed in the
United States is produced from relatively mature fields in
the United States or Canada, where more intensive (and
costly) effort is now required to maintain production levels.
Continued improvements in technology will be required to
maintain production from existing fields. Other supplies
from new sources, such as Alaska’s North Slope, and some
increase in LNG imports are anticipated to offset declines
in domestic production. Moreover, allowing access to
additional resources that are currently off-limits would
enhance the domestic supply of natural gas.
Summary
25
Market
DrivenThe U.S. natural gas market
is highly competitive.
26
Glossary
British Thermal Unit (Btu)
A British Thermal Unit (Btu) is the amount of energy
required to raise the temperature of one pound of water
by one degree Fahrenheit. This is the most common unit
used for buying and selling natural gas. A typical home
in the U.S. Midwest using natural gas for heating will
use approximately 14 MMBtu during a typical month
in the heating season.
Coalbed Methane
Coalbed methane is natural gas contained in coal deposits.
Typical recovery entails pumping water out of the coal to
allow the gas to escape.
Cubic Foot (cf)
A cubic foot (cf) is a standard measure of natural gas, equal
to the amount of natural gas contained at standard
temperature and pressure (60 degrees Fahrenheit and 14.73
pounds standard per square inch) in a cube whose edges are
one foot long. There are 1,031 Btu in a cubic foot of natural
gas. BCF (billion cubic feet) and TCF (trillion cubic feet)
are common abbreviations used in the natural gas industry.
Deep Gas
Deep gas is natural gas found at depths greater than the
average for a particular area; for FERC purposes, it is gas
found at depths of more than 15,000 feet.
Deepwater
Deepwater natural gas is natural gas located in the Gulf
of Mexico in waters at least 200 meters (656 feet) deep.
Dry Gas
Dry gas is natural gas which remains after: 1) the
liquefiable hydrocarbon portion has been removed from
the gas stream (i.e., gas after lease, field, and/or plant
separation); and 2) any volumes of nonhydrocarbon gases
have been removed where they occur in sufficient quantity
to render the gas unmarketable. Note: Dry natural gas is
also known as consumer-grade natural gas. The parameters
for measurement are cubic feet at 60 degrees Fahrenheit
and 14.73 pounds per square inch absolute.
Dry Wells
Dry wells are exploratory or development wells found
to be incapable of producing either oil or gas in sufficient
quantities to justify completion as an oil or gas well.
Futures Contract
A futures contract is a binding, legal agreement between
a buyer and a seller for delivery of a particular quantity
of a commodity at a specified time, place, and price.
These contracts are traded on regulated exchanges and
are settled daily based on their current value in the
marketplace. Most natural gas futures contracts traded
on the New York Mercantile Exchange (NYMEX) end
without actual physical delivery of the commodity.
Futures contracts most often are liquidated or cancelled
out by purchasing a covering position prior to the delivery
date and are generally used as a financial risk management
and investment tool rather than for supply purposes.
Liquefied Natural Gas (LNG)
Liquefied natural gas (LNG) is natural gas that has been
liquefied by reducing its temperature to -260 degrees
Fahrenheit at atmospheric pressure. This liquefaction
process reduces the volume of the gas by approximately
600 times from its original size.
Maturity
Maturity refers to the relative state of development of
natural gas resources in a field, reserve, basin, or other area.
In common usage, a “mature field” is one whose natural gas
production has begun to decline. A “mature basin” is one
that has undergone extensive exploration and production
activity such that it is assumed relatively few large fields
remain undiscovered.
Continued on next page
Glossary
27
Over-the-Counter (OTC)
Over-the-counter (OTC) transactions are not done on an
organized exchange.
Reserves
Reserves are estimated quantities of natural gas that analysis
of geologic and engineering data demonstrates with some
probability are recoverable under existing economic and
operating conditions.
Spot Market
The natural gas spot market is a market in which natural
gas is bought and sold for immediate or very near-term
delivery, usually for a period of 30 days or less. The
transaction does not imply a continuing arrangement
between the buyer and the seller. A spot market is more
likely to develop at a location with numerous pipeline
interconnections, thus allowing for a large number of
buyers and sellers. The Henry Hub in southern Louisiana
is the best-known spot market for natural gas.
Tight Sands Gas
Tight sands gas is a form of unconventional gas located in
low-permeability sandstone.
Unconventional Gas
Unconventional gas refers to natural gas extracted from
coalbeds (coalbed methane) and from low-permeability
sandstone and shale formations (respectively, tight sands
and gas shales). Unconventional gas has become an
increasingly important component of total U.S. domestic
production over the past decade. Although unconventional
gas resources are abundant, they are generally more costly
to produce.
Source:
Energy Information Administration (http://www.eia.doe.gov/).
Principal Authors
Charles Augustine
Bob Broxson
Steven Peterson
Research Assistance
Siko Sikochi
Undertaken for API
Copyright 2006 - API, all rights reserved.
A Policy Analysis Study by Lexecon, an FTI Company
2006-064 | 11.06 | 2M

More Related Content

What's hot

Introduction into Oil and Gas Industry. OIL: Part 1
Introduction into Oil and Gas Industry. OIL: Part 1Introduction into Oil and Gas Industry. OIL: Part 1
Introduction into Oil and Gas Industry. OIL: Part 1Fidan Aliyeva
 
Start Your Own Private Label Lubricant Distribution Business by Wilfredo Rances
Start Your Own Private Label Lubricant Distribution Business by Wilfredo RancesStart Your Own Private Label Lubricant Distribution Business by Wilfredo Rances
Start Your Own Private Label Lubricant Distribution Business by Wilfredo RancesJanette Toral
 
Brief Introduction into Oil & Gas Industry by Fidan Aliyeva
Brief Introduction into Oil & Gas Industry by Fidan AliyevaBrief Introduction into Oil & Gas Industry by Fidan Aliyeva
Brief Introduction into Oil & Gas Industry by Fidan AliyevaFidan Aliyeva
 
Oil prices and global economy
Oil prices and global economyOil prices and global economy
Oil prices and global economysharusharief94
 
Why oil prices failing
Why oil prices failingWhy oil prices failing
Why oil prices failingHasnain Baber
 
Oil 101 - Introduction to Supply and Trading
Oil 101 - Introduction to Supply and TradingOil 101 - Introduction to Supply and Trading
Oil 101 - Introduction to Supply and TradingEKT Interactive
 
Petroleum industry final
Petroleum industry finalPetroleum industry final
Petroleum industry finalMickey Otterlei
 
Working capital ak
Working capital akWorking capital ak
Working capital akAkhilesh Kumar
 
Power plant project finance overview
Power plant project finance overviewPower plant project finance overview
Power plant project finance overviewJohn Coletti
 
CRUDE OIL PRICES:WHY ARE THEY FALLING AND ITS IMPACT ON WORLD ECONOMY AND INDIA
CRUDE OIL PRICES:WHY ARE THEY FALLING AND ITS IMPACT ON WORLD ECONOMY AND INDIACRUDE OIL PRICES:WHY ARE THEY FALLING AND ITS IMPACT ON WORLD ECONOMY AND INDIA
CRUDE OIL PRICES:WHY ARE THEY FALLING AND ITS IMPACT ON WORLD ECONOMY AND INDIASudan Wargantiwar
 
What is Gross refining margin GRM?
What is Gross refining margin GRM?What is Gross refining margin GRM?
What is Gross refining margin GRM?Metro Cash & Carry
 
Fundamentals of Oil and Gas Accounting by Dayana Mastura
Fundamentals of Oil and Gas Accounting by Dayana MasturaFundamentals of Oil and Gas Accounting by Dayana Mastura
Fundamentals of Oil and Gas Accounting by Dayana MasturaDayana Mastura FCCA CA
 
Oil Accounting
Oil AccountingOil Accounting
Oil AccountingAnupam Basu
 
Contracts and psc
Contracts and pscContracts and psc
Contracts and pscPrashant Patel
 

What's hot (20)

Oil Crisis
Oil CrisisOil Crisis
Oil Crisis
 
Introduction into Oil and Gas Industry. OIL: Part 1
Introduction into Oil and Gas Industry. OIL: Part 1Introduction into Oil and Gas Industry. OIL: Part 1
Introduction into Oil and Gas Industry. OIL: Part 1
 
Start Your Own Private Label Lubricant Distribution Business by Wilfredo Rances
Start Your Own Private Label Lubricant Distribution Business by Wilfredo RancesStart Your Own Private Label Lubricant Distribution Business by Wilfredo Rances
Start Your Own Private Label Lubricant Distribution Business by Wilfredo Rances
 
Fiscal rita jolly (formatted)
Fiscal   rita jolly (formatted)Fiscal   rita jolly (formatted)
Fiscal rita jolly (formatted)
 
Introduction to petroleum Economics
Introduction to petroleum EconomicsIntroduction to petroleum Economics
Introduction to petroleum Economics
 
Brief Introduction into Oil & Gas Industry by Fidan Aliyeva
Brief Introduction into Oil & Gas Industry by Fidan AliyevaBrief Introduction into Oil & Gas Industry by Fidan Aliyeva
Brief Introduction into Oil & Gas Industry by Fidan Aliyeva
 
Oil prices and global economy
Oil prices and global economyOil prices and global economy
Oil prices and global economy
 
Why oil prices failing
Why oil prices failingWhy oil prices failing
Why oil prices failing
 
Oil 101 - Introduction to Supply and Trading
Oil 101 - Introduction to Supply and TradingOil 101 - Introduction to Supply and Trading
Oil 101 - Introduction to Supply and Trading
 
Petroleum industry final
Petroleum industry finalPetroleum industry final
Petroleum industry final
 
Working capital ak
Working capital akWorking capital ak
Working capital ak
 
Oil and gas industry overview
Oil and gas industry overviewOil and gas industry overview
Oil and gas industry overview
 
Power plant project finance overview
Power plant project finance overviewPower plant project finance overview
Power plant project finance overview
 
Gas Market
Gas MarketGas Market
Gas Market
 
CRUDE OIL PRICES:WHY ARE THEY FALLING AND ITS IMPACT ON WORLD ECONOMY AND INDIA
CRUDE OIL PRICES:WHY ARE THEY FALLING AND ITS IMPACT ON WORLD ECONOMY AND INDIACRUDE OIL PRICES:WHY ARE THEY FALLING AND ITS IMPACT ON WORLD ECONOMY AND INDIA
CRUDE OIL PRICES:WHY ARE THEY FALLING AND ITS IMPACT ON WORLD ECONOMY AND INDIA
 
What is Gross refining margin GRM?
What is Gross refining margin GRM?What is Gross refining margin GRM?
What is Gross refining margin GRM?
 
Fundamentals of Oil and Gas Accounting by Dayana Mastura
Fundamentals of Oil and Gas Accounting by Dayana MasturaFundamentals of Oil and Gas Accounting by Dayana Mastura
Fundamentals of Oil and Gas Accounting by Dayana Mastura
 
Oil Accounting
Oil AccountingOil Accounting
Oil Accounting
 
Crude oil
Crude oilCrude oil
Crude oil
 
Contracts and psc
Contracts and pscContracts and psc
Contracts and psc
 

Similar to Understanding natural gas markets

Dr Dev Kambhampati | DOE- LNG PRIMER
Dr Dev Kambhampati | DOE- LNG PRIMERDr Dev Kambhampati | DOE- LNG PRIMER
Dr Dev Kambhampati | DOE- LNG PRIMERDr Dev Kambhampati
 
FERC 2015 State of the Markets Report
FERC 2015 State of the Markets ReportFERC 2015 State of the Markets Report
FERC 2015 State of the Markets ReportMarcellus Drilling News
 
Research: Welfare and Distributional Implications of Shale Gas
Research: Welfare and Distributional Implications of Shale GasResearch: Welfare and Distributional Implications of Shale Gas
Research: Welfare and Distributional Implications of Shale GasMarcellus Drilling News
 
Deloitte: Oil and Gas Reality Check 2014
Deloitte: Oil and Gas Reality Check 2014Deloitte: Oil and Gas Reality Check 2014
Deloitte: Oil and Gas Reality Check 2014Marcellus Drilling News
 
IHS Study: Fueling the Future with Natural Gas - Executive Summary
IHS Study: Fueling the Future with Natural Gas - Executive SummaryIHS Study: Fueling the Future with Natural Gas - Executive Summary
IHS Study: Fueling the Future with Natural Gas - Executive SummaryMarcellus Drilling News
 
Step on the Gas! How to Extend America's Energy Advantage
Step on the Gas! How to Extend America's Energy AdvantageStep on the Gas! How to Extend America's Energy Advantage
Step on the Gas! How to Extend America's Energy AdvantageMarcellus Drilling News
 
LSE Study: Fracking is Revitalizing U.S. Manufacturing
LSE Study: Fracking is Revitalizing U.S. ManufacturingLSE Study: Fracking is Revitalizing U.S. Manufacturing
LSE Study: Fracking is Revitalizing U.S. ManufacturingMarcellus Drilling News
 
Report: LNG Exports are America's Once-in-a-Generation Opportunity
Report: LNG Exports are America's Once-in-a-Generation OpportunityReport: LNG Exports are America's Once-in-a-Generation Opportunity
Report: LNG Exports are America's Once-in-a-Generation OpportunityMarcellus Drilling News
 
FinalDissertation
FinalDissertationFinalDissertation
FinalDissertationMyles Walsh
 
Gas bulls should pray cause da' bears may own the day
Gas bulls should pray cause da' bears may own the dayGas bulls should pray cause da' bears may own the day
Gas bulls should pray cause da' bears may own the dayBloomberg LP
 
Building An Earnings Accretive Energy Company
Building An Earnings Accretive Energy CompanyBuilding An Earnings Accretive Energy Company
Building An Earnings Accretive Energy CompanyKW Miller
 
Fueling The Future
Fueling The FutureFueling The Future
Fueling The FutureADHenderson
 
Navigant: North American Natural Gas Market Outlook - Year-End 2014: A View t...
Navigant: North American Natural Gas Market Outlook - Year-End 2014: A View t...Navigant: North American Natural Gas Market Outlook - Year-End 2014: A View t...
Navigant: North American Natural Gas Market Outlook - Year-End 2014: A View t...Marcellus Drilling News
 
ACCF Letter to DOE Sec. Ernest Moniz Requesting Expedited Approval of LNG Exp...
ACCF Letter to DOE Sec. Ernest Moniz Requesting Expedited Approval of LNG Exp...ACCF Letter to DOE Sec. Ernest Moniz Requesting Expedited Approval of LNG Exp...
ACCF Letter to DOE Sec. Ernest Moniz Requesting Expedited Approval of LNG Exp...Marcellus Drilling News
 
Bord Gáis Energy Index October 2015
Bord Gáis Energy Index October 2015Bord Gáis Energy Index October 2015
Bord Gáis Energy Index October 2015Bord Gáis Energy
 
Natural gas outlook ppt
Natural gas outlook pptNatural gas outlook ppt
Natural gas outlook pptGabriella Sollis
 
US Petrochemical Industry Future - Upstream - Natural Gas - Logic Verus Fait...
US Petrochemical Industry Future -  Upstream - Natural Gas - Logic Verus Fait...US Petrochemical Industry Future -  Upstream - Natural Gas - Logic Verus Fait...
US Petrochemical Industry Future - Upstream - Natural Gas - Logic Verus Fait...Bruce LaCour
 

Similar to Understanding natural gas markets (20)

Dr Dev Kambhampati | DOE- LNG PRIMER
Dr Dev Kambhampati | DOE- LNG PRIMERDr Dev Kambhampati | DOE- LNG PRIMER
Dr Dev Kambhampati | DOE- LNG PRIMER
 
Gas presentation
Gas presentationGas presentation
Gas presentation
 
FERC 2015 State of the Markets Report
FERC 2015 State of the Markets ReportFERC 2015 State of the Markets Report
FERC 2015 State of the Markets Report
 
Pickens Plan
Pickens PlanPickens Plan
Pickens Plan
 
Research: Welfare and Distributional Implications of Shale Gas
Research: Welfare and Distributional Implications of Shale GasResearch: Welfare and Distributional Implications of Shale Gas
Research: Welfare and Distributional Implications of Shale Gas
 
Shale gas
Shale gasShale gas
Shale gas
 
Deloitte: Oil and Gas Reality Check 2014
Deloitte: Oil and Gas Reality Check 2014Deloitte: Oil and Gas Reality Check 2014
Deloitte: Oil and Gas Reality Check 2014
 
IHS Study: Fueling the Future with Natural Gas - Executive Summary
IHS Study: Fueling the Future with Natural Gas - Executive SummaryIHS Study: Fueling the Future with Natural Gas - Executive Summary
IHS Study: Fueling the Future with Natural Gas - Executive Summary
 
Step on the Gas! How to Extend America's Energy Advantage
Step on the Gas! How to Extend America's Energy AdvantageStep on the Gas! How to Extend America's Energy Advantage
Step on the Gas! How to Extend America's Energy Advantage
 
LSE Study: Fracking is Revitalizing U.S. Manufacturing
LSE Study: Fracking is Revitalizing U.S. ManufacturingLSE Study: Fracking is Revitalizing U.S. Manufacturing
LSE Study: Fracking is Revitalizing U.S. Manufacturing
 
Report: LNG Exports are America's Once-in-a-Generation Opportunity
Report: LNG Exports are America's Once-in-a-Generation OpportunityReport: LNG Exports are America's Once-in-a-Generation Opportunity
Report: LNG Exports are America's Once-in-a-Generation Opportunity
 
FinalDissertation
FinalDissertationFinalDissertation
FinalDissertation
 
Gas bulls should pray cause da' bears may own the day
Gas bulls should pray cause da' bears may own the dayGas bulls should pray cause da' bears may own the day
Gas bulls should pray cause da' bears may own the day
 
Building An Earnings Accretive Energy Company
Building An Earnings Accretive Energy CompanyBuilding An Earnings Accretive Energy Company
Building An Earnings Accretive Energy Company
 
Fueling The Future
Fueling The FutureFueling The Future
Fueling The Future
 
Navigant: North American Natural Gas Market Outlook - Year-End 2014: A View t...
Navigant: North American Natural Gas Market Outlook - Year-End 2014: A View t...Navigant: North American Natural Gas Market Outlook - Year-End 2014: A View t...
Navigant: North American Natural Gas Market Outlook - Year-End 2014: A View t...
 
ACCF Letter to DOE Sec. Ernest Moniz Requesting Expedited Approval of LNG Exp...
ACCF Letter to DOE Sec. Ernest Moniz Requesting Expedited Approval of LNG Exp...ACCF Letter to DOE Sec. Ernest Moniz Requesting Expedited Approval of LNG Exp...
ACCF Letter to DOE Sec. Ernest Moniz Requesting Expedited Approval of LNG Exp...
 
Bord Gáis Energy Index October 2015
Bord Gáis Energy Index October 2015Bord Gáis Energy Index October 2015
Bord Gáis Energy Index October 2015
 
Natural gas outlook ppt
Natural gas outlook pptNatural gas outlook ppt
Natural gas outlook ppt
 
US Petrochemical Industry Future - Upstream - Natural Gas - Logic Verus Fait...
US Petrochemical Industry Future -  Upstream - Natural Gas - Logic Verus Fait...US Petrochemical Industry Future -  Upstream - Natural Gas - Logic Verus Fait...
US Petrochemical Industry Future - Upstream - Natural Gas - Logic Verus Fait...
 

More from GE 94

SDGSN-07112022.
SDGSN-07112022.SDGSN-07112022.
SDGSN-07112022.GE 94
 
gunvor.pdf
gunvor.pdfgunvor.pdf
gunvor.pdfGE 94
 
2022 Annual Threat Assessment
2022 Annual Threat Assessment 2022 Annual Threat Assessment
2022 Annual Threat Assessment GE 94
 
Platts LNG Derivatives Market-on-Close
Platts LNG Derivatives Market-on-ClosePlatts LNG Derivatives Market-on-Close
Platts LNG Derivatives Market-on-CloseGE 94
 
57076
5707657076
57076GE 94
 
Adm aot memo in opposition
Adm aot memo in oppositionAdm aot memo in opposition
Adm aot memo in oppositionGE 94
 
John Broyles v. J.P. Morgan
John Broyles v. J.P. MorganJohn Broyles v. J.P. Morgan
John Broyles v. J.P. MorganGE 94
 
Zenrock Counterfeit Commodity Credit
Zenrock Counterfeit Commodity CreditZenrock Counterfeit Commodity Credit
Zenrock Counterfeit Commodity CreditGE 94
 
European Banks lose appetite for commodity trade financing | Financial times
European Banks lose appetite for commodity trade financing | Financial timesEuropean Banks lose appetite for commodity trade financing | Financial times
European Banks lose appetite for commodity trade financing | Financial timesGE 94
 
Gunvor boss attacks loose lending practices in singapore (1)
 Gunvor boss attacks loose lending practices in singapore (1) Gunvor boss attacks loose lending practices in singapore (1)
Gunvor boss attacks loose lending practices in singapore (1)GE 94
 
CEMP USD Trade Flow Fund SP Tradeflow capital management pte risk report (2)
CEMP USD Trade Flow Fund SP Tradeflow capital management pte  risk report (2)CEMP USD Trade Flow Fund SP Tradeflow capital management pte  risk report (2)
CEMP USD Trade Flow Fund SP Tradeflow capital management pte risk report (2)GE 94
 
Trade finance funds loaded up commodity sector transactional financing in the...
Trade finance funds loaded up commodity sector transactional financing in the...Trade finance funds loaded up commodity sector transactional financing in the...
Trade finance funds loaded up commodity sector transactional financing in the...GE 94
 
Bao versus WTI: Shifting positions in the WTI and market manipulation
Bao versus WTI: Shifting positions in the WTI and market manipulationBao versus WTI: Shifting positions in the WTI and market manipulation
Bao versus WTI: Shifting positions in the WTI and market manipulationGE 94
 
Hin leong trading financial statements (unaudited) (1)
Hin leong trading financial statements (unaudited) (1)Hin leong trading financial statements (unaudited) (1)
Hin leong trading financial statements (unaudited) (1)GE 94
 
International Cotton Trading
International Cotton Trading International Cotton Trading
International Cotton Trading GE 94
 
Banque Cantonale Vaudoise Pamplet Sat Swiss Agri Trading S.A
Banque Cantonale Vaudoise Pamplet Sat Swiss Agri Trading S.A Banque Cantonale Vaudoise Pamplet Sat Swiss Agri Trading S.A
Banque Cantonale Vaudoise Pamplet Sat Swiss Agri Trading S.A GE 94
 
Covered interest parity a law of nature in currency markets
Covered interest parity a law of nature in currency marketsCovered interest parity a law of nature in currency markets
Covered interest parity a law of nature in currency marketsGE 94
 
ZUG CH AOT holdings
ZUG CH AOT holdings ZUG CH AOT holdings
ZUG CH AOT holdings GE 94
 
Les moteurs economiques discret du lac leman
Les moteurs economiques discret du lac lemanLes moteurs economiques discret du lac leman
Les moteurs economiques discret du lac lemanGE 94
 
Federal Council Report The Swiss Commodities Sector
 Federal Council Report The Swiss Commodities Sector Federal Council Report The Swiss Commodities Sector
Federal Council Report The Swiss Commodities SectorGE 94
 

More from GE 94 (20)

SDGSN-07112022.
SDGSN-07112022.SDGSN-07112022.
SDGSN-07112022.
 
gunvor.pdf
gunvor.pdfgunvor.pdf
gunvor.pdf
 
2022 Annual Threat Assessment
2022 Annual Threat Assessment 2022 Annual Threat Assessment
2022 Annual Threat Assessment
 
Platts LNG Derivatives Market-on-Close
Platts LNG Derivatives Market-on-ClosePlatts LNG Derivatives Market-on-Close
Platts LNG Derivatives Market-on-Close
 
57076
5707657076
57076
 
Adm aot memo in opposition
Adm aot memo in oppositionAdm aot memo in opposition
Adm aot memo in opposition
 
John Broyles v. J.P. Morgan
John Broyles v. J.P. MorganJohn Broyles v. J.P. Morgan
John Broyles v. J.P. Morgan
 
Zenrock Counterfeit Commodity Credit
Zenrock Counterfeit Commodity CreditZenrock Counterfeit Commodity Credit
Zenrock Counterfeit Commodity Credit
 
European Banks lose appetite for commodity trade financing | Financial times
European Banks lose appetite for commodity trade financing | Financial timesEuropean Banks lose appetite for commodity trade financing | Financial times
European Banks lose appetite for commodity trade financing | Financial times
 
Gunvor boss attacks loose lending practices in singapore (1)
 Gunvor boss attacks loose lending practices in singapore (1) Gunvor boss attacks loose lending practices in singapore (1)
Gunvor boss attacks loose lending practices in singapore (1)
 
CEMP USD Trade Flow Fund SP Tradeflow capital management pte risk report (2)
CEMP USD Trade Flow Fund SP Tradeflow capital management pte  risk report (2)CEMP USD Trade Flow Fund SP Tradeflow capital management pte  risk report (2)
CEMP USD Trade Flow Fund SP Tradeflow capital management pte risk report (2)
 
Trade finance funds loaded up commodity sector transactional financing in the...
Trade finance funds loaded up commodity sector transactional financing in the...Trade finance funds loaded up commodity sector transactional financing in the...
Trade finance funds loaded up commodity sector transactional financing in the...
 
Bao versus WTI: Shifting positions in the WTI and market manipulation
Bao versus WTI: Shifting positions in the WTI and market manipulationBao versus WTI: Shifting positions in the WTI and market manipulation
Bao versus WTI: Shifting positions in the WTI and market manipulation
 
Hin leong trading financial statements (unaudited) (1)
Hin leong trading financial statements (unaudited) (1)Hin leong trading financial statements (unaudited) (1)
Hin leong trading financial statements (unaudited) (1)
 
International Cotton Trading
International Cotton Trading International Cotton Trading
International Cotton Trading
 
Banque Cantonale Vaudoise Pamplet Sat Swiss Agri Trading S.A
Banque Cantonale Vaudoise Pamplet Sat Swiss Agri Trading S.A Banque Cantonale Vaudoise Pamplet Sat Swiss Agri Trading S.A
Banque Cantonale Vaudoise Pamplet Sat Swiss Agri Trading S.A
 
Covered interest parity a law of nature in currency markets
Covered interest parity a law of nature in currency marketsCovered interest parity a law of nature in currency markets
Covered interest parity a law of nature in currency markets
 
ZUG CH AOT holdings
ZUG CH AOT holdings ZUG CH AOT holdings
ZUG CH AOT holdings
 
Les moteurs economiques discret du lac leman
Les moteurs economiques discret du lac lemanLes moteurs economiques discret du lac leman
Les moteurs economiques discret du lac leman
 
Federal Council Report The Swiss Commodities Sector
 Federal Council Report The Swiss Commodities Sector Federal Council Report The Swiss Commodities Sector
Federal Council Report The Swiss Commodities Sector
 

Recently uploaded

03_Emmanuel Ndiaye_Degroof Petercam.pptx
03_Emmanuel Ndiaye_Degroof Petercam.pptx03_Emmanuel Ndiaye_Degroof Petercam.pptx
03_Emmanuel Ndiaye_Degroof Petercam.pptxFinTech Belgium
 
The Economic History of the U.S. Lecture 18.pdf
The Economic History of the U.S. Lecture 18.pdfThe Economic History of the U.S. Lecture 18.pdf
The Economic History of the U.S. Lecture 18.pdfGale Pooley
 
Booking open Available Pune Call Girls Shivane 6297143586 Call Hot Indian Gi...
Booking open Available Pune Call Girls Shivane  6297143586 Call Hot Indian Gi...Booking open Available Pune Call Girls Shivane  6297143586 Call Hot Indian Gi...
Booking open Available Pune Call Girls Shivane 6297143586 Call Hot Indian Gi...Call Girls in Nagpur High Profile
 
Interimreport1 January–31 March2024 Elo Mutual Pension Insurance Company
Interimreport1 January–31 March2024 Elo Mutual Pension Insurance CompanyInterimreport1 January–31 March2024 Elo Mutual Pension Insurance Company
Interimreport1 January–31 March2024 Elo Mutual Pension Insurance CompanyTyöeläkeyhtiö Elo
 
VIP Kolkata Call Girl Serampore 👉 8250192130 Available With Room
VIP Kolkata Call Girl Serampore 👉 8250192130  Available With RoomVIP Kolkata Call Girl Serampore 👉 8250192130  Available With Room
VIP Kolkata Call Girl Serampore 👉 8250192130 Available With Roomdivyansh0kumar0
 
VVIP Pune Call Girls Katraj (7001035870) Pune Escorts Nearby with Complete Sa...
VVIP Pune Call Girls Katraj (7001035870) Pune Escorts Nearby with Complete Sa...VVIP Pune Call Girls Katraj (7001035870) Pune Escorts Nearby with Complete Sa...
VVIP Pune Call Girls Katraj (7001035870) Pune Escorts Nearby with Complete Sa...Call Girls in Nagpur High Profile
 
Andheri Call Girls In 9825968104 Mumbai Hot Models
Andheri Call Girls In 9825968104 Mumbai Hot ModelsAndheri Call Girls In 9825968104 Mumbai Hot Models
Andheri Call Girls In 9825968104 Mumbai Hot Modelshematsharma006
 
fca-bsps-decision-letter-redacted (1).pdf
fca-bsps-decision-letter-redacted (1).pdffca-bsps-decision-letter-redacted (1).pdf
fca-bsps-decision-letter-redacted (1).pdfHenry Tapper
 
OAT_RI_Ep19 WeighingTheRisks_Apr24_TheYellowMetal.pptx
OAT_RI_Ep19 WeighingTheRisks_Apr24_TheYellowMetal.pptxOAT_RI_Ep19 WeighingTheRisks_Apr24_TheYellowMetal.pptx
OAT_RI_Ep19 WeighingTheRisks_Apr24_TheYellowMetal.pptxhiddenlevers
 
call girls in Nand Nagri (DELHI) 🔝 >༒9953330565🔝 genuine Escort Service 🔝✔️✔️
call girls in  Nand Nagri (DELHI) 🔝 >༒9953330565🔝 genuine Escort Service 🔝✔️✔️call girls in  Nand Nagri (DELHI) 🔝 >༒9953330565🔝 genuine Escort Service 🔝✔️✔️
call girls in Nand Nagri (DELHI) 🔝 >༒9953330565🔝 genuine Escort Service 🔝✔️✔️9953056974 Low Rate Call Girls In Saket, Delhi NCR
 
VIP Call Girls LB Nagar ( Hyderabad ) Phone 8250192130 | â‚ą5k To 25k With Room...
VIP Call Girls LB Nagar ( Hyderabad ) Phone 8250192130 | â‚ą5k To 25k With Room...VIP Call Girls LB Nagar ( Hyderabad ) Phone 8250192130 | â‚ą5k To 25k With Room...
VIP Call Girls LB Nagar ( Hyderabad ) Phone 8250192130 | â‚ą5k To 25k With Room...Suhani Kapoor
 
05_Annelore Lenoir_Docbyte_MeetupDora&Cybersecurity.pptx
05_Annelore Lenoir_Docbyte_MeetupDora&Cybersecurity.pptx05_Annelore Lenoir_Docbyte_MeetupDora&Cybersecurity.pptx
05_Annelore Lenoir_Docbyte_MeetupDora&Cybersecurity.pptxFinTech Belgium
 
The Economic History of the U.S. Lecture 17.pdf
The Economic History of the U.S. Lecture 17.pdfThe Economic History of the U.S. Lecture 17.pdf
The Economic History of the U.S. Lecture 17.pdfGale Pooley
 
Instant Issue Debit Cards - High School Spirit
Instant Issue Debit Cards - High School SpiritInstant Issue Debit Cards - High School Spirit
Instant Issue Debit Cards - High School Spiritegoetzinger
 
Log your LOA pain with Pension Lab's brilliant campaign
Log your LOA pain with Pension Lab's brilliant campaignLog your LOA pain with Pension Lab's brilliant campaign
Log your LOA pain with Pension Lab's brilliant campaignHenry Tapper
 
Malad Call Girl in Services 9892124323 | â‚ą,4500 With Room Free Delivery
Malad Call Girl in Services  9892124323 | â‚ą,4500 With Room Free DeliveryMalad Call Girl in Services  9892124323 | â‚ą,4500 With Room Free Delivery
Malad Call Girl in Services 9892124323 | â‚ą,4500 With Room Free DeliveryPooja Nehwal
 
Independent Call Girl Number in Kurla Mumbai📲 Pooja Nehwal 9892124323 💞 Full ...
Independent Call Girl Number in Kurla Mumbai📲 Pooja Nehwal 9892124323 💞 Full ...Independent Call Girl Number in Kurla Mumbai📲 Pooja Nehwal 9892124323 💞 Full ...
Independent Call Girl Number in Kurla Mumbai📲 Pooja Nehwal 9892124323 💞 Full ...Pooja Nehwal
 
Call Girls Service Nagpur Maya Call 7001035870 Meet With Nagpur Escorts
Call Girls Service Nagpur Maya Call 7001035870 Meet With Nagpur EscortsCall Girls Service Nagpur Maya Call 7001035870 Meet With Nagpur Escorts
Call Girls Service Nagpur Maya Call 7001035870 Meet With Nagpur Escortsranjana rawat
 

Recently uploaded (20)

03_Emmanuel Ndiaye_Degroof Petercam.pptx
03_Emmanuel Ndiaye_Degroof Petercam.pptx03_Emmanuel Ndiaye_Degroof Petercam.pptx
03_Emmanuel Ndiaye_Degroof Petercam.pptx
 
The Economic History of the U.S. Lecture 18.pdf
The Economic History of the U.S. Lecture 18.pdfThe Economic History of the U.S. Lecture 18.pdf
The Economic History of the U.S. Lecture 18.pdf
 
Booking open Available Pune Call Girls Shivane 6297143586 Call Hot Indian Gi...
Booking open Available Pune Call Girls Shivane  6297143586 Call Hot Indian Gi...Booking open Available Pune Call Girls Shivane  6297143586 Call Hot Indian Gi...
Booking open Available Pune Call Girls Shivane 6297143586 Call Hot Indian Gi...
 
Interimreport1 January–31 March2024 Elo Mutual Pension Insurance Company
Interimreport1 January–31 March2024 Elo Mutual Pension Insurance CompanyInterimreport1 January–31 March2024 Elo Mutual Pension Insurance Company
Interimreport1 January–31 March2024 Elo Mutual Pension Insurance Company
 
VIP Kolkata Call Girl Serampore 👉 8250192130 Available With Room
VIP Kolkata Call Girl Serampore 👉 8250192130  Available With RoomVIP Kolkata Call Girl Serampore 👉 8250192130  Available With Room
VIP Kolkata Call Girl Serampore 👉 8250192130 Available With Room
 
VVIP Pune Call Girls Katraj (7001035870) Pune Escorts Nearby with Complete Sa...
VVIP Pune Call Girls Katraj (7001035870) Pune Escorts Nearby with Complete Sa...VVIP Pune Call Girls Katraj (7001035870) Pune Escorts Nearby with Complete Sa...
VVIP Pune Call Girls Katraj (7001035870) Pune Escorts Nearby with Complete Sa...
 
Andheri Call Girls In 9825968104 Mumbai Hot Models
Andheri Call Girls In 9825968104 Mumbai Hot ModelsAndheri Call Girls In 9825968104 Mumbai Hot Models
Andheri Call Girls In 9825968104 Mumbai Hot Models
 
fca-bsps-decision-letter-redacted (1).pdf
fca-bsps-decision-letter-redacted (1).pdffca-bsps-decision-letter-redacted (1).pdf
fca-bsps-decision-letter-redacted (1).pdf
 
OAT_RI_Ep19 WeighingTheRisks_Apr24_TheYellowMetal.pptx
OAT_RI_Ep19 WeighingTheRisks_Apr24_TheYellowMetal.pptxOAT_RI_Ep19 WeighingTheRisks_Apr24_TheYellowMetal.pptx
OAT_RI_Ep19 WeighingTheRisks_Apr24_TheYellowMetal.pptx
 
call girls in Nand Nagri (DELHI) 🔝 >༒9953330565🔝 genuine Escort Service 🔝✔️✔️
call girls in  Nand Nagri (DELHI) 🔝 >༒9953330565🔝 genuine Escort Service 🔝✔️✔️call girls in  Nand Nagri (DELHI) 🔝 >༒9953330565🔝 genuine Escort Service 🔝✔️✔️
call girls in Nand Nagri (DELHI) 🔝 >༒9953330565🔝 genuine Escort Service 🔝✔️✔️
 
Veritas Interim Report 1 January–31 March 2024
Veritas Interim Report 1 January–31 March 2024Veritas Interim Report 1 January–31 March 2024
Veritas Interim Report 1 January–31 March 2024
 
VIP Call Girls LB Nagar ( Hyderabad ) Phone 8250192130 | â‚ą5k To 25k With Room...
VIP Call Girls LB Nagar ( Hyderabad ) Phone 8250192130 | â‚ą5k To 25k With Room...VIP Call Girls LB Nagar ( Hyderabad ) Phone 8250192130 | â‚ą5k To 25k With Room...
VIP Call Girls LB Nagar ( Hyderabad ) Phone 8250192130 | â‚ą5k To 25k With Room...
 
05_Annelore Lenoir_Docbyte_MeetupDora&Cybersecurity.pptx
05_Annelore Lenoir_Docbyte_MeetupDora&Cybersecurity.pptx05_Annelore Lenoir_Docbyte_MeetupDora&Cybersecurity.pptx
05_Annelore Lenoir_Docbyte_MeetupDora&Cybersecurity.pptx
 
The Economic History of the U.S. Lecture 17.pdf
The Economic History of the U.S. Lecture 17.pdfThe Economic History of the U.S. Lecture 17.pdf
The Economic History of the U.S. Lecture 17.pdf
 
Instant Issue Debit Cards - High School Spirit
Instant Issue Debit Cards - High School SpiritInstant Issue Debit Cards - High School Spirit
Instant Issue Debit Cards - High School Spirit
 
Commercial Bank Economic Capsule - April 2024
Commercial Bank Economic Capsule - April 2024Commercial Bank Economic Capsule - April 2024
Commercial Bank Economic Capsule - April 2024
 
Log your LOA pain with Pension Lab's brilliant campaign
Log your LOA pain with Pension Lab's brilliant campaignLog your LOA pain with Pension Lab's brilliant campaign
Log your LOA pain with Pension Lab's brilliant campaign
 
Malad Call Girl in Services 9892124323 | â‚ą,4500 With Room Free Delivery
Malad Call Girl in Services  9892124323 | â‚ą,4500 With Room Free DeliveryMalad Call Girl in Services  9892124323 | â‚ą,4500 With Room Free Delivery
Malad Call Girl in Services 9892124323 | â‚ą,4500 With Room Free Delivery
 
Independent Call Girl Number in Kurla Mumbai📲 Pooja Nehwal 9892124323 💞 Full ...
Independent Call Girl Number in Kurla Mumbai📲 Pooja Nehwal 9892124323 💞 Full ...Independent Call Girl Number in Kurla Mumbai📲 Pooja Nehwal 9892124323 💞 Full ...
Independent Call Girl Number in Kurla Mumbai📲 Pooja Nehwal 9892124323 💞 Full ...
 
Call Girls Service Nagpur Maya Call 7001035870 Meet With Nagpur Escorts
Call Girls Service Nagpur Maya Call 7001035870 Meet With Nagpur EscortsCall Girls Service Nagpur Maya Call 7001035870 Meet With Nagpur Escorts
Call Girls Service Nagpur Maya Call 7001035870 Meet With Nagpur Escorts
 

Understanding natural gas markets

  • 2.
  • 3. Overview 1 The North American Natural Gas Marketplace 3 Table of Contents Natural Gas Demand 9 Natural Gas Supply 12 Summary 25 Glossary 26 Understanding Natural Gas Markets
  • 4. Addressing these questions requires an understanding of three important points: N North American prices for natural gas are driven by the interaction of natural gas supply available from North American natural gas and oil fields and demand. Demand depends, in large part, on the relative prices of other fuels, economic growth, and weather, which drives heating demand in the winter and demand for gas-fired generation for cooling in the summer. N The U.S. natural gas market is highly competitive. Natural gas market prices are determined competitively on spot and futures* markets reflecting current and expected supply and demand conditions. The market price is determined through the actions of thousands of well-informed buyers and sellers. N Natural gas consumed in the United States is primarily produced domestically or imported from Canada. Planned increases in U.S. imports of liquefied natural gas (LNG) would, if realized, begin to integrate the United States into a growing world market for natural gas. Its importance has grown since the mid-1990s. Natural gas is an attractive fuel because it is clean burning and efficient, and because ample supplies of natural gas have been available from domestic resources and from Canada. Throughout the 1990s, these factors and the low cost of natural gas helped lead to increased investment in facilities using natural gas. For example, the vast majority of new electricity generation capacity built in the United States in the past decade has been natural gas-fired. However, for the last five to seven years, the price of natural gas has been trending upward (Figure 1). Of course, the result of increasing natural gas prices has been increased residential heating bills, increased fuel costs to electric generators using natural gas, and decreased competitiveness of U.S. industries that rely on natural gas. Given the effect of higher natural gas prices on consumers’ budgets and on firms’ competitiveness, consumers, business people, and policymakers are asking what has led to the increase in North American natural gas prices. Overview 1 Natural gasis an important source of energy for the United States. * Italicized words appear in the glossary.
  • 5. 1 Average Natural Gas Spot Prices at Henry Hub, July 1996 - August 2006 Source: Platts 2 As described in this brochure, North America’s demand for natural gas is strong as a result of continued economic growth and other factors. In addition, high oil prices have made natural gas a relatively more attractive fuel because fewer industrial natural gas users can profitably switch from natural gas to oil products for their energy needs. However, on the supply side, despite increased drilling activity, North American natural gas supply has leveled off due to the mature age of existing natural gas fields. Furthermore, significant natural gas resources are currently off-limits to development. Political and market responses to high prices can include increased conservation of natural gas, increased access to currently restricted resources, improved extraction technology, expansion of infrastructure to bring Alaskan natural gas to the lower 48 states, and importation of natural gas, both via pipeline from Canada and LNG from overseas.
  • 6. Natural gas provides 23 percent of the marketable energy consumed in the United States.1 Oil products and coal are the other two major sources of energy. Natural gas is a valued source of energy because it is versatile and burns cleanly. As a result, natural gas use is commonplace in applications including cooking, residential and commercial heating, industrial process feed stocks, and electric generation. Physical Structure of the U.S. Natural Gas Industry Figure 2 is a schematic illustration of the physical structure of the natural gas industry and illustrates the principal activities required to bring gas to consumers. The primary activities are: Exploration and Production Exploration and production include finding and producing natural gas from natural gas fields or associated gas that is produced with crude oil. Processing Natural gas processing removes impurities and the higher- valued products and prepares a dry gas stream that meets industry standards for transportation in high-pressure pipelines. 1 Energy Information Administration,“Energy Basics 101,” www.eia.doe.gov/basics/energybasics101.html. The North American Natural Gas Marketplace 3 counts natural gas as an important part of its portfolio. U.S. energy Transportation Natural gas is transported in high-pressure pipelines from producing areas to industrial end users, storage areas, and local distribution companies. Storage The natural gas production and delivery system is not designed to produce and transport the full amount of natural gas consumers want during periods of peak demand. In order to meet peak demand, large customers and distribution companies put gas into underground storage, mostly near final consumers. The stored gas is withdrawn to meet consumers’ needs during times of peak demand, such as a cold winter day. Local Distribution Local distribution companies own and operate the network of pipes that carry natural gas from high-pressure trunk lines to final consumers. These consumers include residential, commercial, and industrial customers. Liquefied Natural Gas The United States currently imports about three percent of its natural gas from overseas producers in the form of liquefied natural gas. LNG can also be stored and used to meet peak demand.
  • 7. 4 2 Physical Flow of Natural Gas
  • 8. Figure 3 shows some of the primary areas where natural gas is produced in the United States. As the figure shows, natural gas is found in a large number of states. Major onshore production areas include the Rocky Mountains, Texas, and Louisiana. In addition, significant natural gas comes from offshore production in the Gulf of Mexico. The North American Natural Gas Marketplace 5 3 Selected U.S. Natural Gas Producing Regions and Pipeline Flows Source: EIA, Platts, State of Alaska Department of Natural Resources
  • 9. 6
  • 10. 4 U.S. Natural Gas Resources Subject to Access Restrictions (TCF) Source: EIA, Platts, National Petroleum Council As shown in Figure 4, offshore areas on both coasts and the Alaskan Peninsula are off-limits to exploration. In addition, approximately 125 trillion cubic feet (TCF) of the natural gas underlying federal lands in the Rocky Mountains is off-limits or under some type of restriction (such as species habitat restrictions or no surface occupancy) and approximately 25 7 TCF of the natural gas off the western coast of Florida is unavailable for exploration and production.2 As shown in the figure, it is estimated that approximately 225 TCF of U.S. natural gas reserves are off-limits to exploration, equal to approximately ten times the total amount of natural gas consumed in the U.S. in 2005 (22 TCF).3 The North American Natural Gas Marketplace 2 National Petroleum Council, Balancing Natural Gas Policy: Fueling the Demands of a Growing Economy, Vol. 2 at 127 (September 2003). 3 http://tonto.eia.doe.gov/dnav/ng/ng_cons_sum_dcu_nus_a.htm.
  • 11. 5 Breakdown of Natural Gas Price Paid by Residential Consumers During the Heating Season, 2001-2006 Source: EIA Once natural gas is produced and processed, it is injected into pipelines for transmission to customers and local distribution companies. Transportation and delivery costs are a significant portion of the cost of delivered natural gas. The rates charged by both the natural gas pipelines and the local distribution companies are regulated by federal or state regulators. In recent years, transportation and delivery charges have declined from 62 percent to 42 percent of the final natural gas price paid by residential consumers during the heating season (November through March), while the cost of the natural gas itself has increased from 38 percent to 58 percent of the consumer’s average heating season price (See Figure 5). 8
  • 12. In the late 1980s and early 1990s, demand for natural gas grew rapidly in the United States, from around 17 TCF in 1983 to around 22 TCF in 1995, a 30 percent increase. During most of this period, natural gas was a less expensive source of energy than the oil products that it primarily competed against. As a result, the low natural gas prices 9 Natural Gas Demand Demand More than 60 million U.S. households use natural gas for water heating, space heating, or cooking. In total, natural gas accounts for more than 50 percent of the fuel used to heat U.S. homes.4 Residential and commercial heating demand for natural gas is highly weather-sensitive, making weather the biggest driver of natural gas demand in the short term. As a result, natural gas demand is highly “seasonal” in nature, with significant “peaks” in the winter heating season, as illustrated in Figure 7. Natural gas pipelines and distribution companies must plan to meet customers’ needs during the peak demand periods. The seasonal nature of heating demand can cause the price of natural gas to vary widely at different times of the year. for natural gas has grown rapidly. of the 1990s and the expectation that prices would stay low contributed to large investments in facilities, particularly electric generation, that use natural gas. In addition, increasingly strict environmental regulations and the clean-burning qualities of natural gas have encouraged many energy consumers to choose natural gas. Figure 6 shows the consumption of natural gas by sector of the economy. As the figure shows, the industrial sector is the largest user of natural gas, typically consuming more than 35 percent of total use. Historically, the residential sector has been the next largest user of natural gas, consuming approximately 22 percent of the total. However, the use of natural gas by electric generators has increased markedly since the late 1990s, driven in part by the ease of getting permits to build gas-fired generation relative to other types of generation and by the low cost of natural gas. In fact, the capacity of natural gas-fired generation has tripled since 1999, and the quantity of natural gas used by the electric power sector grew by more than 50 percent between 1996 and 2005. Commercial use of natural gas for heating office buildings and retail space has remained relatively constant. 4 http://www.eia.doe.gov/kids/energyfacts/sources/non renewable/naturalgas.html#WHAT%20IT%20IS%20USED%20FOR.
  • 13. 6 U.S. Natural Gas Consumption by Sector, January 1990 - December 2005 Source: EIA 10 7 Natural Gas Consumption, Production and Storage Activity, January 2001 - June 2006 Source: EIA
  • 14. As described on the previous page, the natural gas production and transmission system is not designed to move the full amount of peak demand from producing areas to consumers. In order to meet high seasonal winter demand for natural gas, a significant amount (ten percent or more of our annual consumption) is put into storage during periods of warm weather and lower demand. Figure 7 shows the pattern of natural gas production and storage. The relatively flat purple line shows natural gas production and imports into the United States. The figure shows production remains essentially flat throughout the year, but, as the lighter purple line shows, consumption rises dramatically in the winter and falls in the spring through the early fall. Heating demand for natural gas puts upward pressure on natural gas prices during winter, contributing to the tighter market that exists for natural gas in the winter months, and serving to compensate those who place gas in storage during lower-price, off-peak periods. Regulated local distribution companies, however, will place gas in storage for peak demand independent of prices because of their regulator mandate to be able to serve their customers’ peak demands. Thus, natural gas inventory levels are driven, in part, by regulatory factors in addition to market factors. Despite the storage of natural gas and the industry’s recognition that demand will rise in the winter months, winter natural gas prices can fluctuate quite dramatically 11 Natural Gas Demand with changes in weather and the amount of natural gas in storage. The reasons for this price volatility are straight- forward. For example, if storage levels appear to be low in autumn, there will be concern that it will be difficult to meet peak demands throughout the winter, and traders may be willing to pay more to secure natural gas volumes for winter month deliveries. This results in upward pressure on market prices. In contrast, warmer than expected weather during the winter of 2005-2006 led to storage being quite full as the winter progressed and natural gas prices dropped in response to these ample supplies. Available supply and demand are tightly balanced today. This means, for example, that an interruption of supply, such as what happened when hurricane damage shut down substantial gas production in the Gulf of Mexico in 2005, can lead to rapid and dramatic spikes in prices. Investments are intended to bring on new supply, but new supplies require months or years to bring online. And the short-term demand response to high prices is constrained by the fact that many natural gas consumers (especially residential and commercial consumers) do not have the ability to switch to alternate fuels or to significantly reduce their energy use in the short-term. In the longer run, high prices do reduce demand. For example, some U.S. industrial gas users like chemical and fertilizer plants have shut down permanently.5 Weather and storage levels also continue to influence natural gas markets on a seasonal basis. 5 National Petroleum Council, Balancing Natural Gas Policy: Fueling the Demands of a Growing Economy, Vol. 2 at 292 (September 2003).
  • 15. 12 97%of theU.S. gas supply comes from domestic sources and Canada. Figure 8 shows the total domestic production of natural gas in the United States. As the figure shows, domestic production of natural gas peaked in 2001 and has declined slowly since that time. In 2005, production was seven percent lower than in the peak year 2001. This decline is, in part, the result of the fact that some of the key natural gas fields have matured and are less productive than earlier in their lives, whereas new developments of unconventional resources often have lower productivity. In addition, significant undeveloped natural gas resources remain off-limits to exploration. Moreover, the reduced level of U.S. production in 2005 is partly attributable to interruptions to offshore production as a result of hurricanes. 8 U.S. Natural Gas Marketed Production, 1990 -2005 Source: EIA Natural Gas Supply
  • 16. 13 Natural Gas Supply Figure 9 shows the sources of natural gas supply to U.S. consumers. In recent years about 82 percent has come from domestic sources. 9 Historical and Projected Natural Gas Supply by Source, 1990-2025 Source: EIA Approximately 15 percent of U.S. natural gas consumption is imported from Canada. The remaining three percent comes from LNG imports.
  • 17. 14 The production of natural gas from the Gulf of Mexico shows the impact of the maturation of the gas fields in a producing area on total production. Figure 10 depicts natural gas production from the Gulf of Mexico and the share of that production that comes from deepwater wells drilled in more than 200 meters of water. 10 Natural Gas Production of the Gulf of Mexico Federal Offshore, 1992-2005 Source: Minerals Management Service Total Gulf production peaked in 1997, but the decline in Gulf production was slowed by the increased drilling of deepwater wells. Today, approximately 38 percent of Gulf production comes from deepwater wells. Thus, the industry has had to move to more expensive resources and improved technology to stem the decline of production.
  • 18. Natural Gas Supply 15 Figure 11 shows the U.S. production of conventional natural gas, offshore natural gas (primarily from the Gulf of Mexico), and unconventional natural gas, which includes natural gas from deep wells, coalbed methane, tight sands, and other sources that are more difficult and costly to develop than conventional resources. The amount of natural gas produced from unconventional resources is increasing while production from conventional and offshore resources is declining. Developing these unconventional resources would be further facilitated by advances in drilling and other technology and by increased access to resource areas that are off-limits. 11 Natural Gas Production by Source, 1990-2025 Source: EIA Clearly, the tightening supply and demand balance in North America helps explain the upward trend in natural gas prices over the last five to seven years. Conventional resources that are currently accessible to natural gas producers are beginning to mature. As a result, producers have had to shift their efforts to resources that are more difficult and more expensive to develop.
  • 19. 16 12 New Producing Natural Gas Wells and Wellhead Price, 1990-2005 Source: EIA The natural gas industry has responded to higher natural gas prices by increasing its efforts to find and develop natural gas resources. Producers have sought out and developed unconventional resources such as coalbed methane, tight sands, and deepwater resources. In addition, as shown in Figure 12, natural gas producers have increased the number of wells drilled in the United States from approximately 11,000 in 1999 to approximately 27,000 in 2005. Improvements in technology have also led to increased success in drilling exploration and development wells. As shown in Figure 13 (next page), the percentage of dry wells fell steadily over the last decade.
  • 20. As production from traditional U.S. supply basins including the shallow portions of the Gulf of Mexico is flat or declining, the United States will have to look to new sources and new technologies in order to maintain its natural gas supply. Increased Domestic Supply In the continental United States there is potential for increased supplies from the Rocky Mountain region, deepwater sections of the Gulf of Mexico, and new areas. Increases in natural gas supply in both the Rocky Mountains and the eastern Gulf of Mexico are limited by drilling restrictions, however.6 Canadian Imports As in the United States, the Canadian supply situation is characterized by declining production from mature supply resources and increasing production from unconventional resources as well as increased supplies from the Arctic region. Thus, overall Canadian production is projected to remain relatively flat and exports to the United States, after factoring 17 Natural Gas Supply 13 Dry Rate for Exploratory and Development Wells Drilled, 1990-2005 Source: EIA in expanding Canadian use, are expected to decline. Canada is expected to use more natural gas to heat buildings and to produce unconventional oil from tar sands, which uses heat from natural gas. According to the Energy Information Administration’s (EIA) most recent forecast, pipeline imports from Canada to the United States reached their peak between 2000 and 2005, and will decline slowly but steadily for the next two decades (see Figure 9). Expanded production in developed areas in Canada and in the lower 48 states is attractive because there is an extensive pipeline network available in most areas that makes it possible to bring this gas to market quickly. There are other potentially large sources of natural gas available to U.S. consumers, but some will require substantial investments for these supplies to be brought to market. U.S. Arctic Gas Supplies Currently, the United States has large natural gas resources in the Arctic regions of Alaska (e.g., Prudhoe Bay). Proved gas 6 National Petroleum Council, Balancing Natural Gas Policy: Fueling the Demands of a Growing Economy, Vol. 2 at 127 (September 2003).
  • 21. 18 14 U.S. LNG Imports by Month and Monthly Average Natural Gas Spot Prices, July 1996-June 2006 Source: EIA, Platts developers have announced plans to build more than 40 additional LNG import terminals.9 However, LNG terminals can be difficult to permit and build, and it is uncertain how many of these planned terminals will eventually be constructed. While most analysts agree with the forecast of the EIA that the contribution of LNG to overall North American natural gas supply will grow, the ultimate contribution of LNG to supply remains somewhat uncertain. Even accounting for the increases in natural gas prices in the United States in recent years, natural gas prices at times have been still higher in other parts of the world, such as Japan and parts of Europe, that depend on LNG for a significant share of their natural gas supply.10 The growing role of LNG in North America will increasingly connect what has been a regional market to the global market for LNG. As a result, U.S. natural gas prices will, over time (should this trend continue), increasingly follow global demand and supply trends, as do U.S. oil prices. reserves on the North Slope of Alaska total approximately 45 TCF and potential reserves have been estimated to be more than 250 TCF.7 These natural gas resources are currently not connected to pipelines that can bring this gas to markets in the lower 48 states, though there are plans to build such a pipeline. This pipeline could carry as much as 4 billion cubic feet (BCF) per day,8 or approximately seven percent of average daily U.S. consumption in 2005. LNG Imports The United States currently imports a small amount of natural gas from overseas in the form of LNG. In response to high natural gas prices in the United States, LNG imports rose rapidly beginning in 2002, as shown in Figure 14. In recent years, the United States has increased its capacity for importing LNG by reopening old LNG terminals that were built during the natural gas shortages of the 1970s and 1980s but were then mothballed when natural gas prices were low, and by constructing new LNG import capacity. Moreover, 7 National Petroleum Council, Balancing Natural Gas Policy: Fueling the Demands of a Growing Economy, Vol. 2 at 110 (September 2003). 8 National Petroleum Council, Balancing Natural Gas Policy: Fueling the Demands of a Growing Economy, Vol. 2 at 202 (September 2003). 9 http://www.ferc.gov/industries/lng.asp#skipnavsub. 10 Natural Gas Week,“U.S. LNG Import Activity Picks Up with Softening of Global Market,”May 15, 2006, at 7.
  • 22. Most residential and commercial customers purchase natural gas from a local distribution company. In contrast, many industrial customers have the option to purchase natural gas from a marketer or producer instead of from the distribution company. There are many different types of buyers and sellers who are motivated to buy and sell gas under different types of commercial arrangements. As a result, gas is sold on a spot market basis, under longer-term contracts with fixed pricing or terms that track market prices, and under contracts with other types of pricing provisions. Marketers are able to meet customers’ differing needs by bringing together a large number of buyers and sellers. In addition, marketers and other buyers and sellers of natural gas are able to use financial instruments traded on exchanges to hedge the risks associated with price volatility. How Natural Gas Is Traded Figure 15 shows schematically some of the types of natural gas transactions that take place as gas makes its way from the fields where it is produced to end users’ burner tips. The natural gas industry in the United States is highly competitive, with literally thousands of producers.11 Some producers have the ability to market their natural gas and may sell it directly to local distribution companies or to large industrial buyers of natural gas. (Some of these large industrial buyers are “on- system” end users, meaning that they receive physical natural gas deliveries from a local distribution company. Others are “off-system end users,” meaning they are directly connected to an interstate pipeline.) Other producers sell their gas to marketers who have the ability to aggregate natural gas into quantities that fit the needs of different types of buyers and to transport gas to their buyers. Marketers may be large or small and sell to local distribution companies or to commercial or industrial customers connected directly to pipelines or served by local distribution companies. Natural Gas Supply 19 15 Commercial and Financial Arrangements 11 As noted previously, federal and state regulators regulate the prices charged by most natural gas pipelines and local distribution companies for the transportation and distribution services they provide. Natural gas prices themselves are not regulated today.
  • 23. 20 16 Natural Gas Market Centers Serving as Major Trading and Transshipment Points Source: EIA Note that pipelines do not buy and sell natural gas. Most of the major natural gas pipelines are federally regulated interstate pipelines. These pipelines are limited to providing transportation services, including storage.12 Thus, pipelines move gas at government-regulated rates on behalf of buyers and sellers, but do not participate in the buying and selling of natural gas. The domestic natural gas marketplace has a highly competitive spot market where brokers and others buy and sell natural gas. Figure 16 shows some of the points where natural gas for physical delivery is actively traded in the continental United States. These points are market centers where brokers actively trade and prices are established. In addition to these market centers, natural gas is actively traded at many other locations, including segments of individual pipelines and locations where pipelines interconnect with local distribution companies. 12 Prior to the federal restructuring of regulation of the interstate natural gas pipeline system, natural gas pipelines purchased gas from producers and sold it to the customers connected to the pipeline. This system was inefficient because it severely limited the number of buyers for natural gas and kept the market from operating competitively. These regulations were part of the overall regulation of the natural gas industry that was dramatically altered beginning in the late 1970s through the mid 1980s.
  • 24. The most important market center in the United States is the Henry Hub, located in southern Louisiana, because it is the most active and highest-volume trading point. The Henry Hub is interconnected with 16 different intra- and interstate pipelines and, thus, effectively interconnects to all producing and consuming regions throughout North America. Because of its central location and its high degree of interconnectedness, the Henry Hub is used as the delivery point for the New York Mercantile Exchange’s (NYMEX) natural gas futures contract and a pricing reference point for virtually the entire North American natural gas market. Market participants buy and sell natural gas on a “spot” basis every day at the trading points shown in Figure 16, as well as at dozens of other points. Spot market transactions are normally conducted over the internet or by telephone, with the buyer agreeing to pay a negotiated price for the natural gas to be delivered by the seller at a specified delivery point. Natural gas spot prices reflect daily supply and demand balances and can be volatile. In addition to daily spot transactions, monthly spot transactions are often entered during “bid week,” the last five business days of a month. During bid week, buyers and sellers arrange for the purchase and sale of physical natural gas to be delivered throughout the coming month, including making delivery arrangements with pipelines. 21 Natural Gas Supply Many customers purchase natural gas under longer-term contracts that provide for delivery of gas for a specified period of time. The length of time can vary. Frequently the prices in longer-term contracts are not fixed, but are instead indexed to prices that are regularly published in the trade press. A number of trade publications publish index prices based on their surveys of natural gas buyers and sellers to determine the prices they pay (or receive) for natural gas (at market locations such as those shown in Figure 16) in daily or monthly transactions. Futures and Other Financial Contracts In addition to the contracts for physical supply described previously, natural gas derivatives are traded on the New York Mercantile Exchange. A NYMEX natural gas futures contract requires the seller to deliver (and the buyer to take delivery of) natural gas at the contractually agreed price, in a specified future month, at the Henry Hub.13 The price to be paid for delivery in the future month when the futures contract matures is determined at the time the contract is sold. As expectations about the value of natural gas at the time of delivery change, the value of the futures contract will change as well.14 13 The NYMEX natural gas futures contract stipulates the purchase and sale of 10,000 MMBtu of natural gas at the Henry Hub trading point in Louisiana in the delivery month. As noted, the Henry Hub is the nexus of 16 intra- and interstate natural gas pipeline systems that draw supplies from the region's gas supplies and serve markets throughout the United States. 14 Other NYMEX-traded natural gas derivatives include options contracts, calendar spread options, and basis swap futures contracts. In addition to the derivatives available on NYMEX, market participants trade other derivatives in over-the-counter (OTC) markets.
  • 25. 22 17 Natural Gas Futures Contracts Traded by Year, 1990*-2005 *Annual volume for 1990 begins in April | Source: NYMEX The futures market for natural gas has grown rapidly from its inception in 1990. Figure 17 shows the number of natural gas contracts traded on the NYMEX each year between 1990 and 2005. This market is made up of a large number of buyers and sellers, as well as different types of buyers and sellers. Parties with commercial interests frequently use futures contracts to reduce their exposure to price risk by locking in the price they will pay (or receive) for natural gas to be delivered in some future month. For example, a natural gas producer who expects to produce and sell natural gas each month for the next several years can use the NYMEX futures contract to lock in the price that the producer will receive for that gas. Derivatives such as the NYMEX futures contract make it possible for market participants to avoid the risk that results from highly volatile natural gas prices in the physical market. For example, a manufacturing facility that uses natural gas may face highly volatile cash flows as a result of dramatic fluctuations in natural gas prices from month to month and day to day. To reduce these risks, the facility can purchase physical natural gas using contracts with indexed prices and, in addition, purchase financial derivatives that rise in value when gas prices rise and fall in value when gas prices fall. The result is that when prices are high, the value of the derivatives will rise to offset the additional cost of gas, and vice versa.
  • 26. Natural Gas Supply 23 non-commercial traders have increased dramatically since early 2002. The market benefits from the trading activity of all types of traders because to trade effectively over a sustained period, these parties must be well-informed, and their participation in the market ensures that market prices reflect all of the information available about current and future supply and demand conditions. In addition, the market includes a growing number of parties who do not have a commercial interest in the natural gas industry. Non-commercial parties buy and sell futures contracts in response to contract prices (rather than to hedge natural market positions) and in doing so they provide insurance to commercial parties and liquidity to the futures market. As shown in Figure 18, open contracts held by these 18 Weekly Open Contracts by Trader Type, January 2000 - September 2006 Source: The Commodity Futures Trading Commission (CFTC)
  • 27. 24 Futures markets also provide valuable information about expectations for supply and demand conditions in the physical market that will determine the price for gas scheduled for delivery on a specified future date. For example, if in 2005 the price of a futures contract for the delivery of gas in April 2006 is $8 per MMBtu, this represents thousands of buyers’ and sellers’ best estimate of what the price (in this case, increase) of gas will be for physical delivery in April 2006.15 This price discovery function is beneficial because it provides market information to those who can best respond by, for example, putting additional gas in storage or taking steps to switch to a different fuel. 19 Natural Gas Futures Settlement Price as of April 14, 2003 Source: Platts Figure 19 provides a snapshot of futures contract prices on a day in April 2003. The figure shows prices for natural gas to be delivered in each of the next 36 months. The futures contract prices reflect buyers’ and sellers’ expectations as of April 2003 that spot natural gas prices would be higher in future heating seasons (October through March) and lower in non-heating seasons (April through September). 15 Markets rely in part on the number of buyers and sellers involved for credibility of pricing. The result – a reported price that reflects what multiple parties are willing to pay or receive – provides efficiency and reduces costs.
  • 28. Thousands of U.S. companies produce natural gas and thousands of consumers purchase it, every hour of every day. The steep rise in natural gas prices in recent years reflects a natural market response to the tight supply and demand balance. Demand for natural gas has been strong, especially from the power sector where gas-using capacity tripled after 1999. On the supply side, most natural gas consumed in the United States is produced from relatively mature fields in the United States or Canada, where more intensive (and costly) effort is now required to maintain production levels. Continued improvements in technology will be required to maintain production from existing fields. Other supplies from new sources, such as Alaska’s North Slope, and some increase in LNG imports are anticipated to offset declines in domestic production. Moreover, allowing access to additional resources that are currently off-limits would enhance the domestic supply of natural gas. Summary 25 Market DrivenThe U.S. natural gas market is highly competitive.
  • 29. 26 Glossary British Thermal Unit (Btu) A British Thermal Unit (Btu) is the amount of energy required to raise the temperature of one pound of water by one degree Fahrenheit. This is the most common unit used for buying and selling natural gas. A typical home in the U.S. Midwest using natural gas for heating will use approximately 14 MMBtu during a typical month in the heating season. Coalbed Methane Coalbed methane is natural gas contained in coal deposits. Typical recovery entails pumping water out of the coal to allow the gas to escape. Cubic Foot (cf) A cubic foot (cf) is a standard measure of natural gas, equal to the amount of natural gas contained at standard temperature and pressure (60 degrees Fahrenheit and 14.73 pounds standard per square inch) in a cube whose edges are one foot long. There are 1,031 Btu in a cubic foot of natural gas. BCF (billion cubic feet) and TCF (trillion cubic feet) are common abbreviations used in the natural gas industry. Deep Gas Deep gas is natural gas found at depths greater than the average for a particular area; for FERC purposes, it is gas found at depths of more than 15,000 feet. Deepwater Deepwater natural gas is natural gas located in the Gulf of Mexico in waters at least 200 meters (656 feet) deep. Dry Gas Dry gas is natural gas which remains after: 1) the liquefiable hydrocarbon portion has been removed from the gas stream (i.e., gas after lease, field, and/or plant separation); and 2) any volumes of nonhydrocarbon gases have been removed where they occur in sufficient quantity to render the gas unmarketable. Note: Dry natural gas is also known as consumer-grade natural gas. The parameters for measurement are cubic feet at 60 degrees Fahrenheit and 14.73 pounds per square inch absolute. Dry Wells Dry wells are exploratory or development wells found to be incapable of producing either oil or gas in sufficient quantities to justify completion as an oil or gas well. Futures Contract A futures contract is a binding, legal agreement between a buyer and a seller for delivery of a particular quantity of a commodity at a specified time, place, and price. These contracts are traded on regulated exchanges and are settled daily based on their current value in the marketplace. Most natural gas futures contracts traded on the New York Mercantile Exchange (NYMEX) end without actual physical delivery of the commodity. Futures contracts most often are liquidated or cancelled out by purchasing a covering position prior to the delivery date and are generally used as a financial risk management and investment tool rather than for supply purposes. Liquefied Natural Gas (LNG) Liquefied natural gas (LNG) is natural gas that has been liquefied by reducing its temperature to -260 degrees Fahrenheit at atmospheric pressure. This liquefaction process reduces the volume of the gas by approximately 600 times from its original size. Maturity Maturity refers to the relative state of development of natural gas resources in a field, reserve, basin, or other area. In common usage, a “mature field” is one whose natural gas production has begun to decline. A “mature basin” is one that has undergone extensive exploration and production activity such that it is assumed relatively few large fields remain undiscovered. Continued on next page
  • 30. Glossary 27 Over-the-Counter (OTC) Over-the-counter (OTC) transactions are not done on an organized exchange. Reserves Reserves are estimated quantities of natural gas that analysis of geologic and engineering data demonstrates with some probability are recoverable under existing economic and operating conditions. Spot Market The natural gas spot market is a market in which natural gas is bought and sold for immediate or very near-term delivery, usually for a period of 30 days or less. The transaction does not imply a continuing arrangement between the buyer and the seller. A spot market is more likely to develop at a location with numerous pipeline interconnections, thus allowing for a large number of buyers and sellers. The Henry Hub in southern Louisiana is the best-known spot market for natural gas. Tight Sands Gas Tight sands gas is a form of unconventional gas located in low-permeability sandstone. Unconventional Gas Unconventional gas refers to natural gas extracted from coalbeds (coalbed methane) and from low-permeability sandstone and shale formations (respectively, tight sands and gas shales). Unconventional gas has become an increasingly important component of total U.S. domestic production over the past decade. Although unconventional gas resources are abundant, they are generally more costly to produce. Source: Energy Information Administration (http://www.eia.doe.gov/).
  • 31. Principal Authors Charles Augustine Bob Broxson Steven Peterson Research Assistance Siko Sikochi Undertaken for API Copyright 2006 - API, all rights reserved. A Policy Analysis Study by Lexecon, an FTI Company