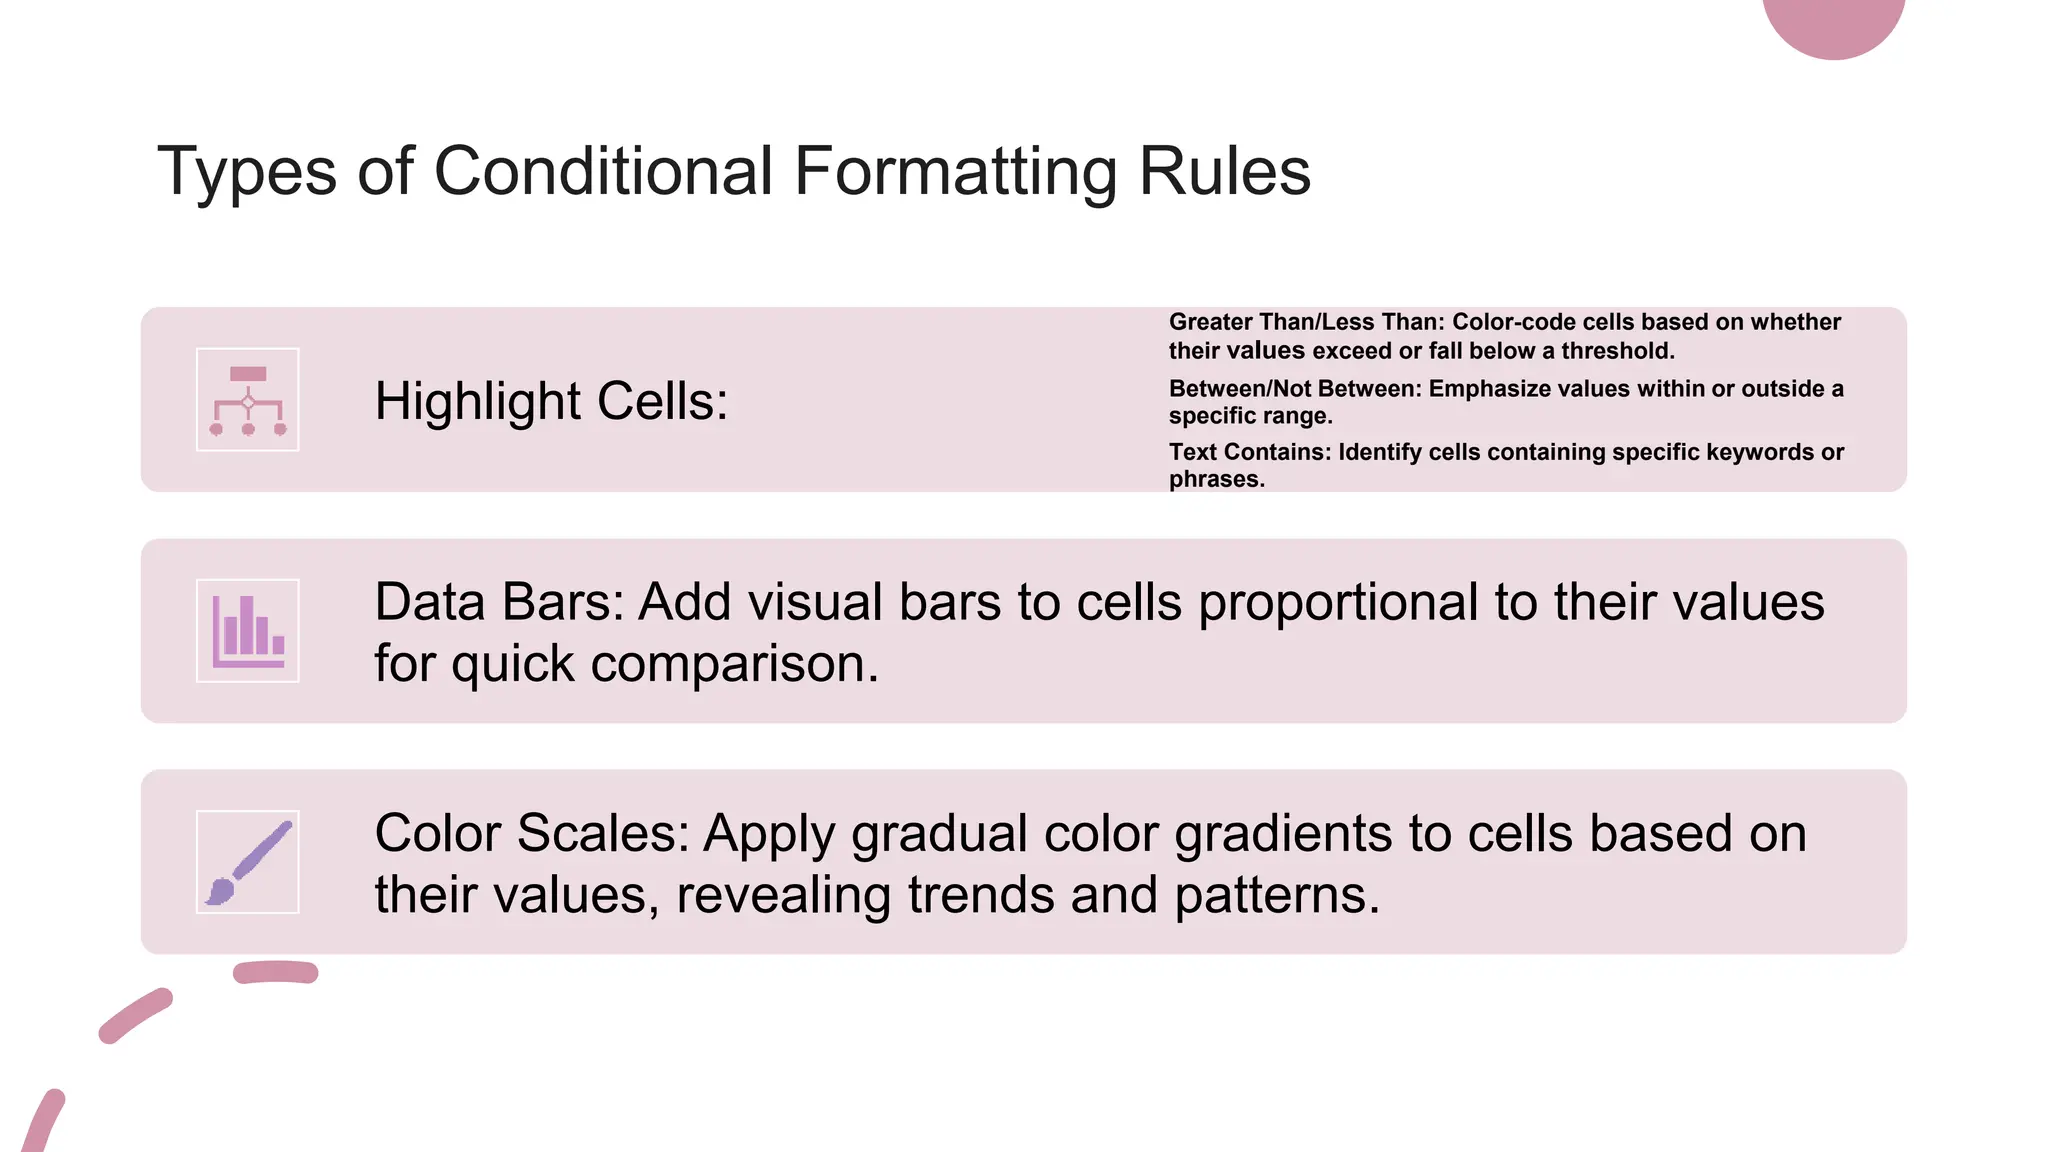
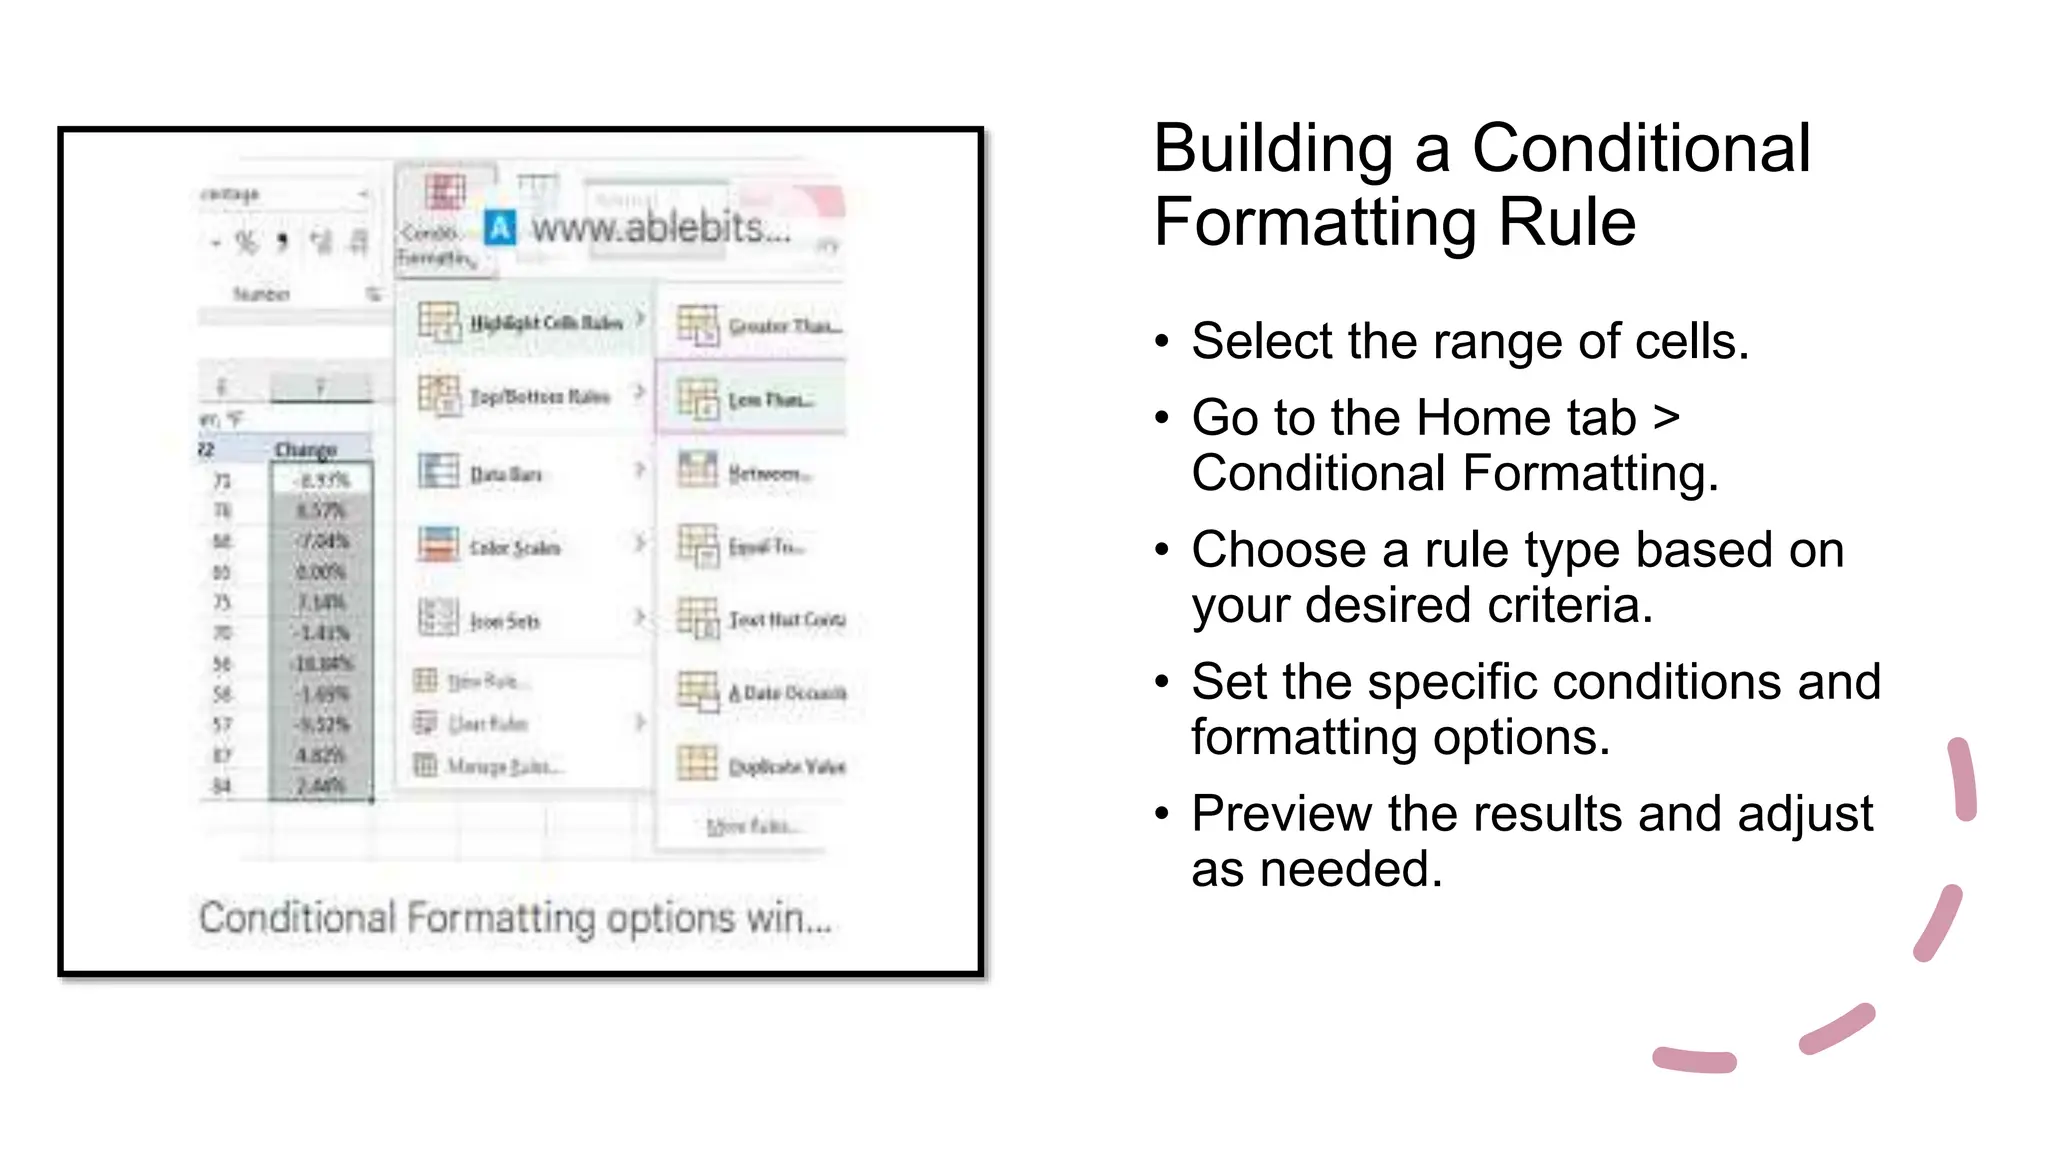
Unleashing
Insights: A Guide
to Conditional
Formatting in
Excel
Turn your data into a visual
masterpiece with powerful formatting
rules.
What is Conditional Formatting
Highlight trends, outliers, and key
information within your
spreadsheet by applying formatting
rules based on specific conditions.
• Benefits:
• Enhanced readability: Identify important
data points at a glance.
• Improved analysis: Gain deeper
insights by visually comparing values.
• Effective communication: Present
complex data in a clear and concise
way.
Types of Conditional Formatting Rules
Highlight Cells:
Greater Than/Less Than: Color-code cells based on whether
their values exceed or fall below a threshold.
Between/Not Between: Emphasize values within or outside a
specific range.
Text Contains: Identify cells containing specific keywords or
phrases.
Data Bars: Add visual bars to cells proportional to their values
for quick comparison.
Color Scales: Apply gradual color gradients to cells based on
their values, revealing trends and patterns.
Building a Conditional
Formatting Rule
• Select the range of cells.
• Go to the Home tab >
Conditional Formatting.
• Choose a rule type based on
your desired criteria.
• Set the specific conditions and
formatting options.
• Preview the results and adjust
as needed.
Advanced Techniques
• Using formulas: Create custom
conditions based on complex
calculations.
• Formatting icon sets: Apply unique
symbols and icons to cells for
additional visual cues.
• Gradient bars and data bars: Utilize
different styles and colors for
enhanced data representation.
Applications & Examples
• Financial Reports: Highlight
profitability, expenses exceeding
budget, and investment performance.
• Sales Data: Identify top-selling
products, regions with high customer
churn, and sales trends.
• Inventory Management: Track low
stock levels, identify slow-moving
items, and optimize ordering needs.
Conclusion
• Conditional formatting is a powerful
tool to unlock insights and tell a
compelling story with your data.
• Experiment with different rule types
and formatting options to find the
perfect blend for your needs.
• Practice and refine your skills to
become a data visualization master
and impress your audience.

Unleashing Insights: A Guide to Conditional Formatting in Excel

  • 1.
    Unleashing Insights: A Guide toConditional Formatting in Excel Turn your data into a visual masterpiece with powerful formatting rules.
  • 2.
    What is ConditionalFormatting Highlight trends, outliers, and key information within your spreadsheet by applying formatting rules based on specific conditions. • Benefits: • Enhanced readability: Identify important data points at a glance. • Improved analysis: Gain deeper insights by visually comparing values. • Effective communication: Present complex data in a clear and concise way.
  • 3.
    Types of ConditionalFormatting Rules Highlight Cells: Greater Than/Less Than: Color-code cells based on whether their values exceed or fall below a threshold. Between/Not Between: Emphasize values within or outside a specific range. Text Contains: Identify cells containing specific keywords or phrases. Data Bars: Add visual bars to cells proportional to their values for quick comparison. Color Scales: Apply gradual color gradients to cells based on their values, revealing trends and patterns.
  • 4.
    Building a Conditional FormattingRule • Select the range of cells. • Go to the Home tab > Conditional Formatting. • Choose a rule type based on your desired criteria. • Set the specific conditions and formatting options. • Preview the results and adjust as needed.
  • 5.
    Advanced Techniques • Usingformulas: Create custom conditions based on complex calculations. • Formatting icon sets: Apply unique symbols and icons to cells for additional visual cues. • Gradient bars and data bars: Utilize different styles and colors for enhanced data representation.
  • 6.
    Applications & Examples •Financial Reports: Highlight profitability, expenses exceeding budget, and investment performance. • Sales Data: Identify top-selling products, regions with high customer churn, and sales trends. • Inventory Management: Track low stock levels, identify slow-moving items, and optimize ordering needs.
  • 7.
    Conclusion • Conditional formattingis a powerful tool to unlock insights and tell a compelling story with your data. • Experiment with different rule types and formatting options to find the perfect blend for your needs. • Practice and refine your skills to become a data visualization master and impress your audience.