Download as PDF, PPTX
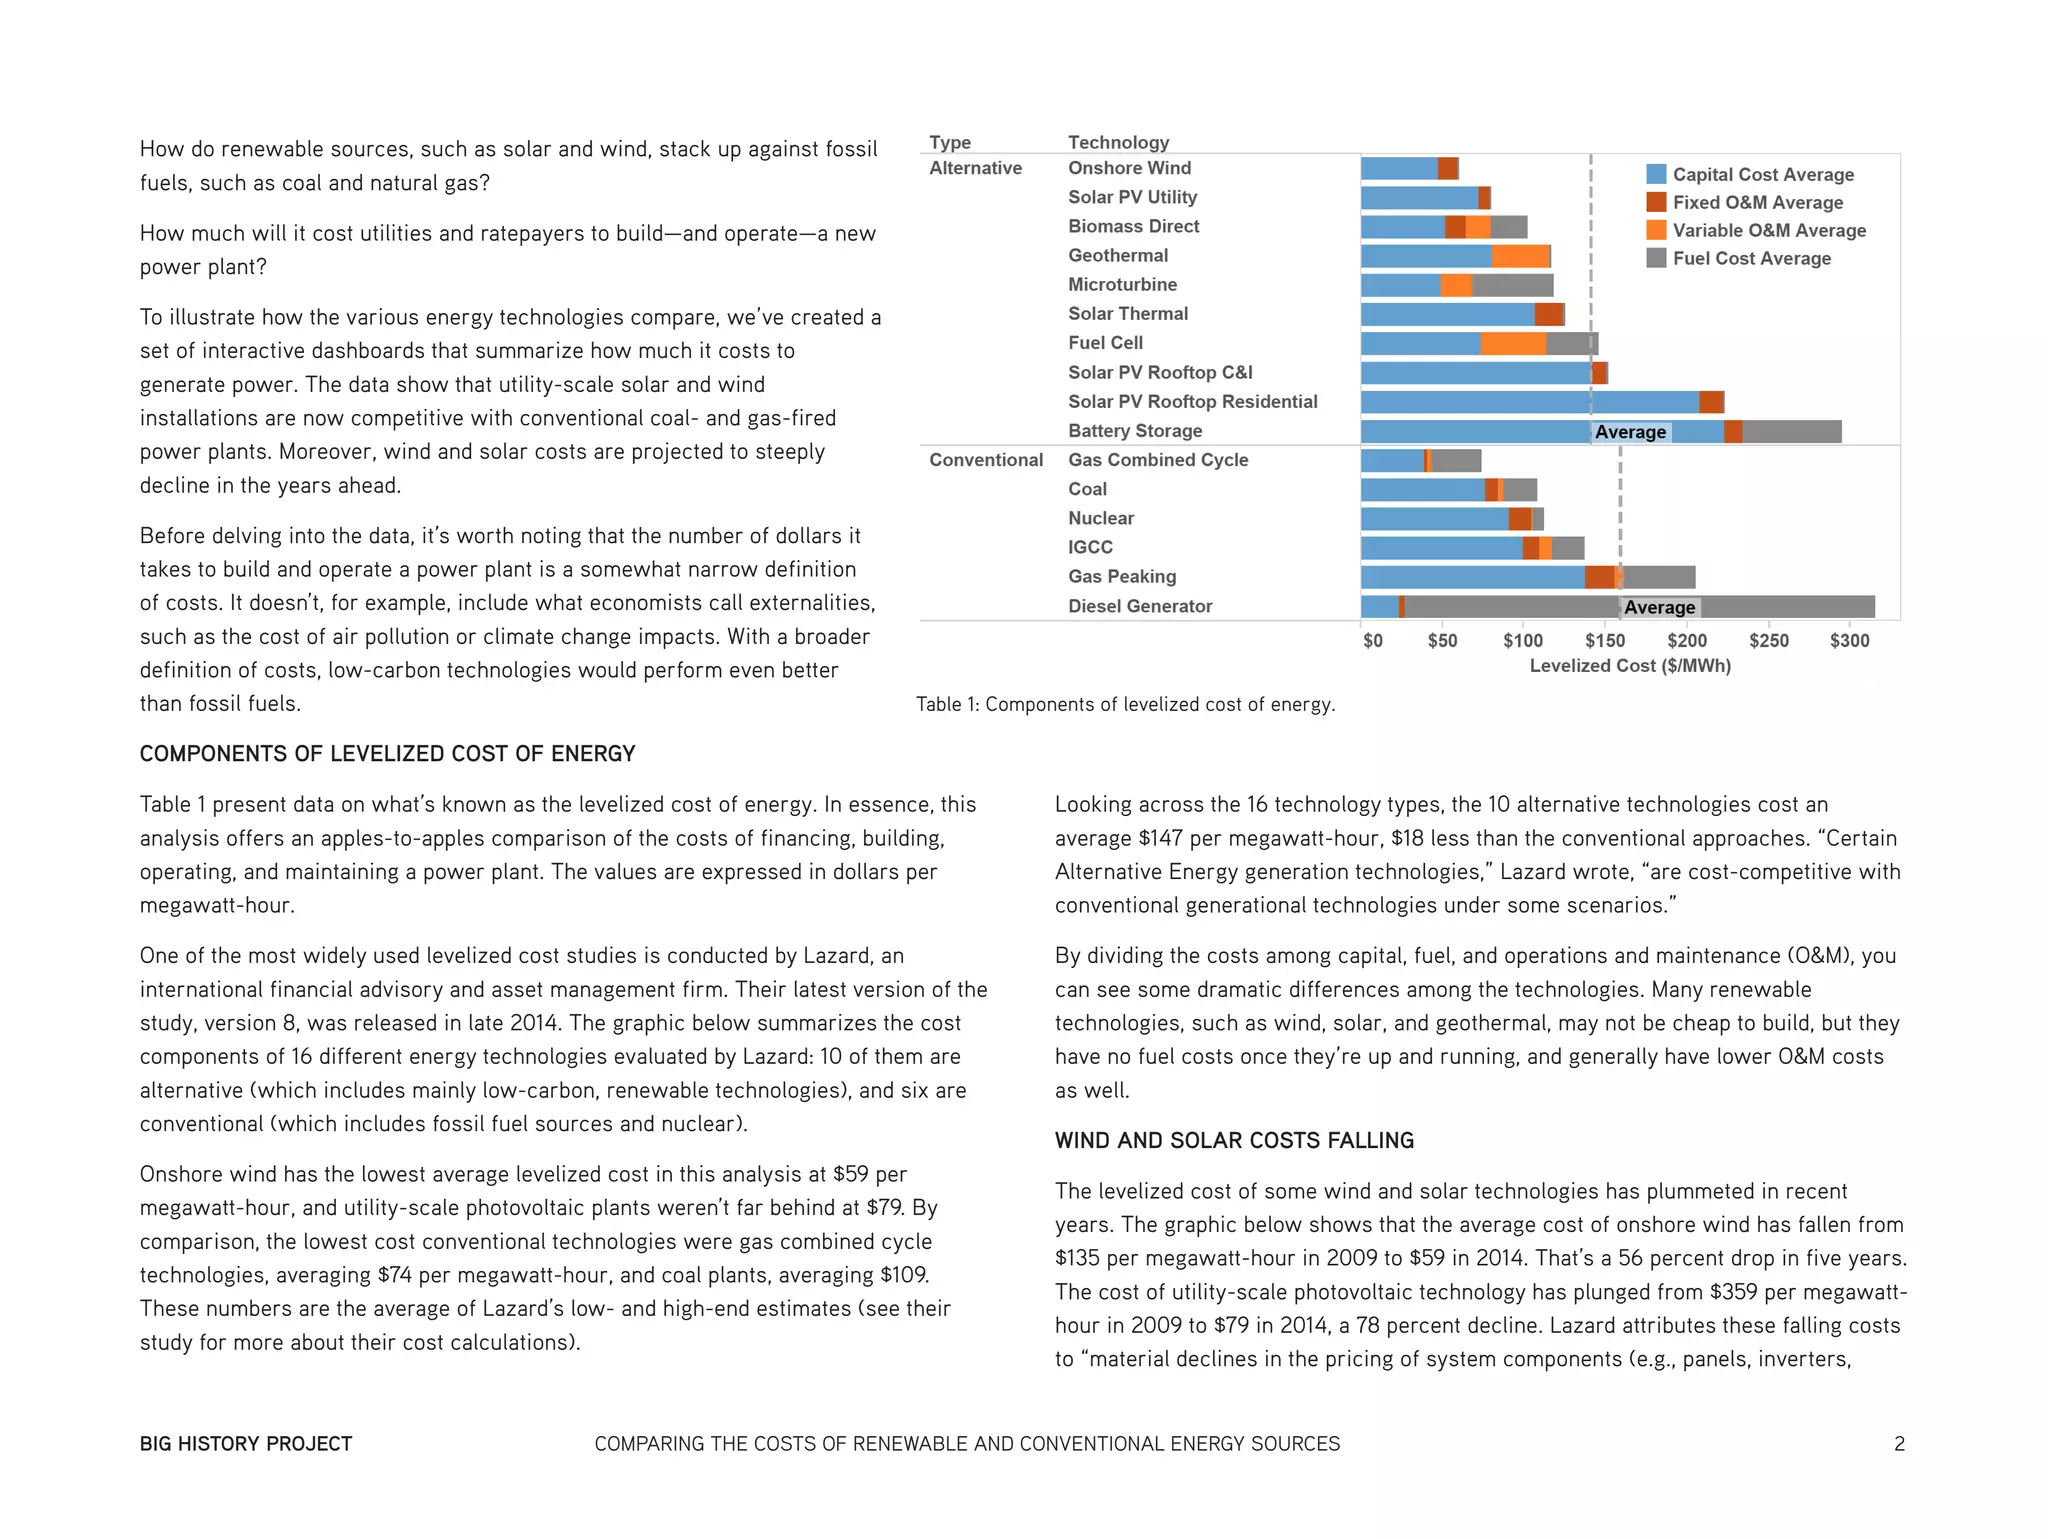
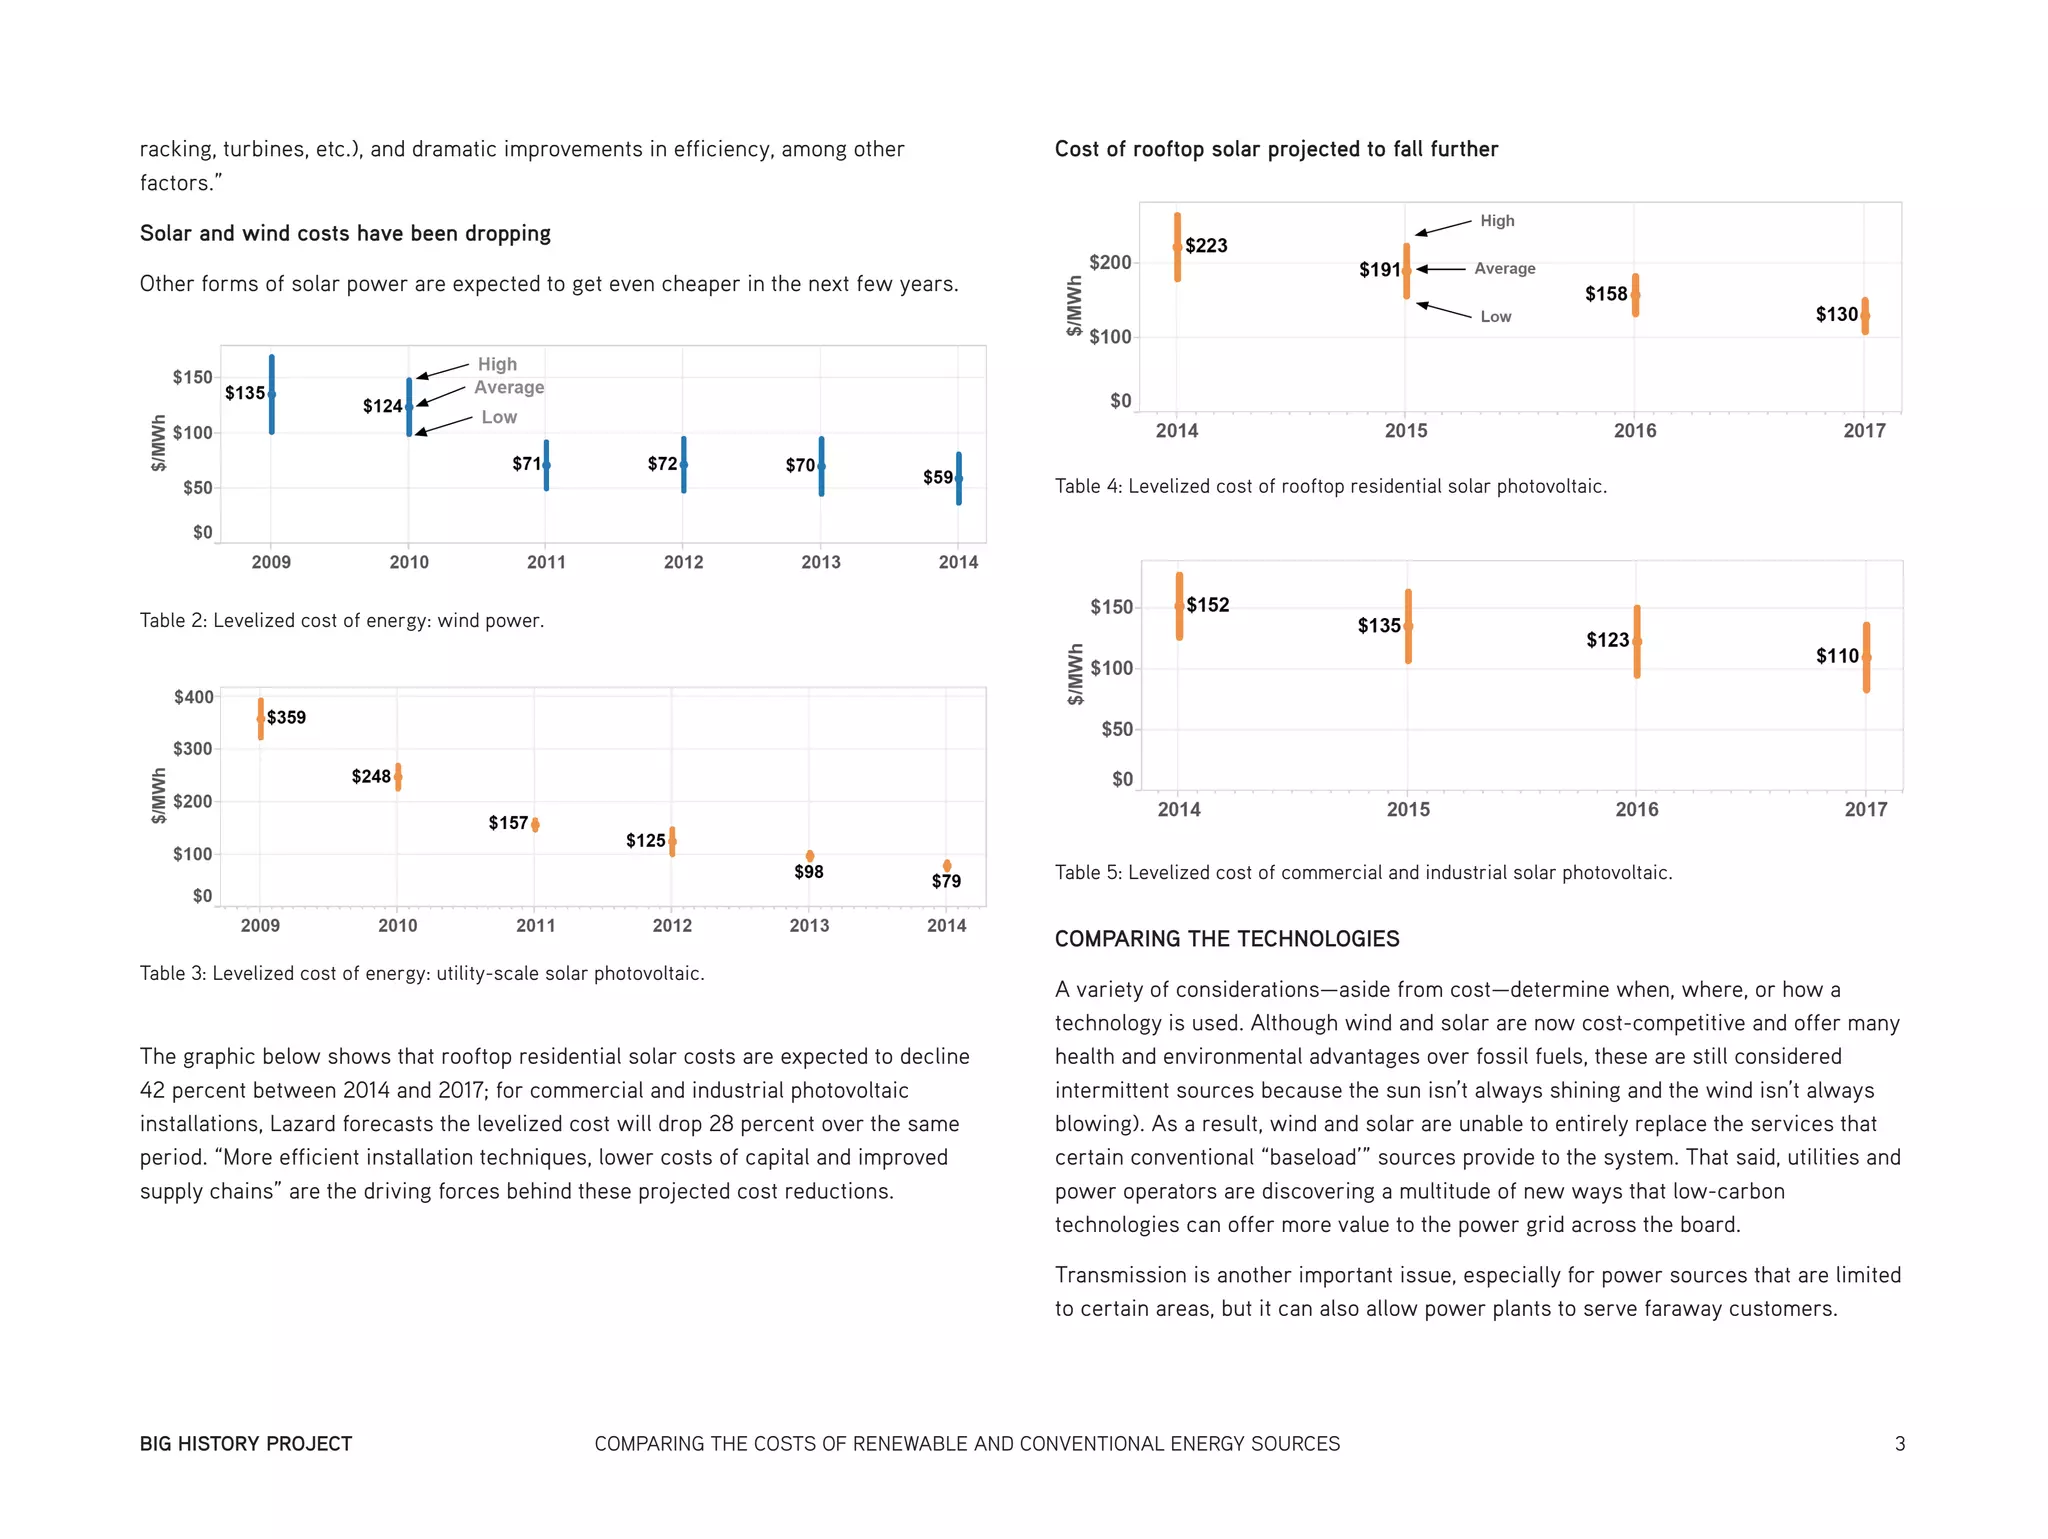


The document discusses the cost comparison between renewable energy sources, like solar and wind, and conventional fossil fuels, revealing that utility-scale solar and wind have become competitive with coal and natural gas. It highlights that the levelized cost of wind has fallen significantly and is projected to continue decreasing, while the costs of various technologies are affected by factors such as construction, fuel, and operational expenses. Additionally, the analysis emphasizes the potential long-term advantages of low-carbon technologies when considering external costs such as pollution and climate change.