Use www.gapminder.org/data to fill out the data in each of the tables below. To find the data you need, make sure that you have the name of the category. On the gapminder.org/data page, you’ll see a table called “List of indicators in “Gapminder World.” Beneath that title, on the right side of the table, find the
Search box. Type the name of the category into that search area. Once you find the category, click on the magnifying glass on the right. That link will have the data you need to fill out each of the tables below.
Register to explore the whole course here: https://school.bighistoryproject.com/bhplive?WT.mc_id=Slideshare12202017
This collection of biographies provides students with detailed information about the voyages of these explorers including information about their motivation and how they inspired future generations of explorers. These men opened the door to a more interconnected world as the contacts they made helped to create connections between distant peoples and stimulate the growth of exchange networks and long-distance trade.
Register to explore the whole course here: https://school.bighistoryproject.com/bhplive?WT.mc_id=Slideshare12202017
Primera presentación para el Bloque II de Historia de España de 2º de Bachillerato. En ella se explica la conquista musulmana de la Península ibérica, su evolución política, económica y social, así como una breve repaso a su arte.
Mesoamérica y el Libro de Mormón - ¿Es este el lugar correcto? Usted se sorprenderá con la cantidad de paralelos científicos entre Mesoamérica y el Libro de Mormón.
Presentación que afronta un periodo crucial del siglo XX que va desde 1945 hasta la década de los 90. Abarca cuatro puntos fundamentales: la creación de la ONU, la Guerra Fría, la Descolonización y el fin del mundo socialista.
Prepare for your interview with these top SAP ABAP Practice Exam questions. For more IT Profiles, Sample Resumes, Practice exams, Interview Questions, Live Training and more…visit ITLearnMore – Most Trusted Website for all Learning Needs by Students, Graduates and Working Professionals.
Looking to add weight to your resume? Check out for ITLearnmore for varied online IT courses at affordable prices intended for career boost. There is so much in store for both fresh graduates and professionals here. Hurry up..! Get updated with the current IT job market requirements and related courses.More information visit www.ITLearnMore.com
SAP MATERIAL MANAGEMENT(MM) ONLINE TRAINING IN USA|AUSTRALIASAP Training
www.sapbuzztraining.co.in is providing SAP MM("MATERIAL AND MANAGEMENT") Online Training contact us:info@sapbuzztraining.com or +91-9052734398, By Real Time Experts from Hyderabad, Bangalore,India,USA,Canada,South Africa,Australia,Uk,Dubai,Malaysia,Japan,Russia,London.
A comprehensive presentation about population, for the AS level, using all the important definitions necessary for the exam: distribution and density, population changes, population structure, models, trends in population growth, optimum, over and under population, theories relating to world population and food supply and the demographic transition model. Case studies: Kenya, USA, Denmark, China.
Essay on The Growing Population
Over Population Solution
Essay On Overpopulation
Causes of Overpopulation Essay
Essay on World Population
Essay On Overpopulation
Speech On Overpopulation
Population Dynamics Lab ReportUse the following formula to c.docxharrisonhoward80223
Population Dynamics
Lab Report
Use the following formula to complete the charts below: pf = pi * ert
Where:
pf = final population
pi = initial population
e = a physical constant whose value is 2.7183
r = rate of growth
t = time (doubling time)
Change the rate of growth into a decimal by dividing by 100.
Use either your calculator that has an ex function or the calculator found on the following website: http://www.math.com/students/calculators/source/scientific.htm
Example:
pi = 5.2 X 10⁹ (initial population of 5.2 billion people in developing countries)
t = 39 years (from table 1)
r = 1.8% (from table 1)
r = 1.8% = 0.018
Multiply r and t 0.018 * 39 = 0.702
Pf = 5.2 * (e0.702)
On calculator, enter 0.702, then INV, then ex
Pf = 5.2 * (2.02)
Pf = 10.49 or 10.5 X 10⁹
Or 10.5 billion people
Table 1: Growth Rates and Doubling Times for Various Countries
Region
Growth Rate (%)
Doubling Time (years)
World
1.4
50
Developed Countries
0.4
175
Developing Countries
1.8
39
Africa
2.5
28
Asia
1.6
44
United States
1.0
70
Mexico
1.7
41
Europe
0.2
350
Russia
0.3
233
Oceania
1.5
47
Exercise One:
Part A: Using information from table 1, fill in the chart below and then calculate the final population for each.
Part B: Using information from table 1, fill in Part B of the chart but use the developed countries’ doubling time.
Region
r (%)
dt (years)
Pi (X 109)
Pf (X 109)
A
Developing
4.7
Developed
1.2
United States
0.303
Mexico
0.107
Africa
0.048
B
Developing
**
4.7
**Use doubling time of developed countries
Exercise Two:
Calculate the final population for developed nations where (r) starts at 0.6 and decreases by 0.1 percent every ten years until (r) = 0.0 percent (ZPG). The final population becomes the initial population for the next ten year period.
r (%)
t (years)
Pi (X 109)
Pf (X 109)
0.6
10
1.2
0.5
10
0.4
10
0.3
10
0.2
10
0.1
10
0.0
10
Calculate the final population for developing nations where (r) starts at 2.0 percent and decreases by 0.4 percent every ten years until (r) = 0.0 percent (ZPG). Remember, the final population becomes the initial population for the next ten years.
r (%)
t (years)
Pi (X 109)
Pf (X 109)
2.0
10
4.7
1.6
10
1.2
10
0.8
10
0.4
10
0.2
10
0.0
10
Using information from exercise one, answer the following questions.
1. Which country/region (do not consider the first three lines of information) has the highest growth rate? The lowest? How do you account for this difference?
2. Why do some countries/regions have a shorter or lower doubling time?
3. What would happen to the final population of developing countries if their growth rate is maintained over a developed countries doubling time?
Using information from exercise two, answer the following questions:
1. How do the final populations of developed regions and developing regions compare when zero population growth is reached?
2. Why were the growth rates used in this exercise differen.
Country Report RubricCategoryDescription of Criteria.docxmercylittle80626
Country Report Rubric
Category
Description of Criteria
0 = no info
1 = not yet meeting
2 = minimally meeting
3= fully meeting
4 = exceeding
Following directions (8 marks possible X 2 = 16)
Required info presented in the report
First section of the assignment: all statistics and data from #1-12
All questions answered for #13-19
Required information presented in writing
Format: use of report template, full sentences, full paragraphs, images, graphs
Works Cited: using MLA8
Content knowledge and Critical Thinking (12 marks possible X 3 = 36)
Required Information #13-19 is Reasonable and Demonstrates Understanding
Report demonstrates a clear understanding of environmental and at least 1 of social, political, or economic problems. Clearly outlines attempted/possible solutions and probably future concerns/issues.
Content Knowledge
Demonstrates full knowledge of required information and their larger implications for problems and future predictions.
Persuasiveness: required information for #19
Report makes a clearly articulated and convincing argument as to why its country should receive aid money. Arguments supported by details and facts.
Total mark out of 52 will then be X 2 for a grand total of 104.
Country Report
You have been commissioned by Population Probe, an international organization concerned with global population and challenges with living standards. They would like your perspective on the population pressures and resulting environmental, social, political, and economic issues in different countries around the world and would like you to present these issues in a Persuasive Report. Your goal is convince Mrs. Brine to award Population Probe’s five billion dollars of aid money to your country (without skewing, distorting or omitting any facts!)
Your Persuasive Report must present the following information for your chosen country:
Required Information; try to be as current as possible. These are mostly statistics so you need to describe this information in full sentences and can put it all together in paragraph form. It can all be explained in one paragraph if you choose:
1. current population
2. population density
3. birth and death rates
4. stage in the Demographic Transition Model (give evidence as to how you know this)
5. infant mortality rates
6. life expectancy at birth
7. population growth rate
8. recent population pyramid (insert picture) and explain it
9. dependency ratio
10. emigration/immigration rates: you will likely only find the net migration rate so use that
11. literacy rate
12. GDP or GNP (Gross Domestic Product or Gross National Product)
The following topics need to be written in paragraph form; one paragraph per question. Please write about these topics as if you are there, visiting and researching in the actual country. Create sub headings in your report for each of these topics:
13. Discussion of national living standards: availability/access of food and water, overpopulation, employment opportunities.
1. Using our interactive population graphics, match each of the ag.docxjackiewalcutt
1. Using our interactive population graphics, match each of the age-sex population pyramids (labeled A through F) with the appropriate description.
(Points : 1)
Potential Matches:
1 : a country at close to zero population growth (Norway 1992)
2 : a country with many temporary immigrant workers (Qatar 1986)
3 : a country that shows the demographic effects of World War II (Russia 1992)
4 : a country that has undergone a recent shift from high to low fertility (China 1990)
5 : a country with declining population (Italy 1991)
6 : a country with rapid population growth (Tanzania 1985)
Answer
: A (top left)
: B (top center)
: C (top right)
: D (bottom left)
: E (bottom center)
: F (bottom right)
Question 2. 2. This is the first of four questions based on the interactive India-demographics tool. These graphs allow you to visualize the future population of India, as it changes throughout the 21st Century, under a variety of scenarios regarding changing fertility rates. All the scenarios start in 2000 with the following conditions:
· a total population of 1.014 billion
· a total fertility rate of 3.4
· a crude birth rate of 26.4 per thousand
· a crude death rate of 8.9 per thousand
Based on these numbers, what was India's rate of natural increase (i.e., annual population growth excluding net migration) in 2005? Note that you don't need to actually use the linked website to answer this question, since all of the numbers you need to calculate an answer are included above. (Points : 1)
0.55%
0.95%
1.75%
2.40%
3.10%
Question 3. 3. This is the second question based on the interactive India-demographics tool. One way we might establish a baseline for comparing alternative scenarios is to assume that the starting conditions persist indefinitely into the future. To do this using our tool, set the "Final Total Fertility Rate" to 3.4.
You'll see from the graphs, that this effectively freezes India in the middle of its demographic transition--longer life expectancies and lower death rates than in the pre-modern era, but birth rates hovering at a relatively high 24 or 25 per thousand. If this were actually to happen, the model shows us that India would end the century with a population of more than 3.6 billion! In what year would India's population first eclipse the two billion mark, double its turn-of-the-century size? (Points : 1)
2020
2030
2040
2050
2060
Question 4. 4. This is the third question based on the interactive India-demographics tool. In the previous question we tested one extreme scenario: fixing India's fertility rate at present levels. The opposite extreme would involve a sudden drop in fertility to well below the modern replacement rate, as actually has happened in much of Europe and East Asia. To view this scenario, set the "Final Total Fertility Rate" to 1.5, and leave the "Years to Achieve Final TFR" at zero.
You'll see from ...
Unit 9: A Bird's Eye View: Acceleration and Global Chaos in the Twentieth Cen...Big History Project
What can population and economic data tell us about this era of war and instability? Read about what the numbers can tell us.
Register to explore the whole course here: https://school.bighistoryproject.com/bhplive?WT.mc_id=Slideshare12202017
“To what extent has the Modern Revolution been a positive or a negative force?” is the driving question for Unit 9. The purpose of this activity is to apply Unit 9’s driving question
to a modern-day infrastructure development: the Interoceanic Highway (La Carretera). Construction on La Carretera, which connects the east and west coasts of South America, began in the early twenty-first century. By studying the scenes depicted in a photojournalist’s photographic essay, students will come to their own conclusions about the extent to which this road has been a positive or negative force as related to certain trends and topics (economic development and natural environment, for example). This activity will also help prepare students for Investigation 9, in which they’re asked to identify good and bad outcomes of trends referenced in the Investigation texts.
This activity will give students a chance to review some of what they learned in this lesson, and use it to think more deeply about what and how they would communicate with an alien species.
Register to explore the whole course here: https://school.bighistoryproject.com/bhplive?WT.mc_id=Slideshare12202017
Circling one star among hundreds of billions, in one galaxy among a hundred billion more, in a Universe that is vast and expanding ever faster – perhaps toward infinity. It’s easy to forget that we live in a place of astonishing grandeur and mystery.
Register to explore the whole course here: https://school.bighistoryproject.com/bhplive?WT.mc_id=Slideshare12202017
Unit 9: Comparing the Costs of Renewable and Conventional Energy SourcesBig History Project
You can’t get too far in a discussion about the nation’s electric power sector without running into the question of costs.
Register to explore the whole course here: https://school.bighistoryproject.com/bhplive?WT.mc_id=Slideshare12202017
This quick activity will get students brainstorming about life on Mars and what they would need to survive there.
Register to explore the whole course here: https://school.bighistoryproject.com/bhplive?WT.mc_id=Slideshare12202017
Spanning three centuries of history, from the dawn of the industrial age to modern times, three diverse
thinkers developed their own landmark theories on commerce, labor, and the global economy.
Register to explore the whole course here: https://school.bighistoryproject.com/bhplive?WT.mc_id=Slideshare12202017
In the final essay of a four-part series, David Christian explains
how advances in communication and transportation accelerated
collective learning.
Register to explore the whole course here: https://school.bighistoryproject.com/bhplive?WT.mc_id=Slideshare12202017
Lesson 9.2 Activity: The Impact of Population Growth EssayBig History Project
For this closing activity, students will construct an essay in which they discuss what they think are the three biggest impacts of human population growth in the modern era. By looking more closely at population growth, they will deepen their understanding of the impact of acceleration and will think about themselves in relation to population growth and the effect it might have on their own futures.
Register to explore the whole course here: https://school.bighistoryproject.com/bhplive?WT.mc_id=Slideshare12202017
Unit 8: Guns, Germs, and Steel: The Fates of Human SocietiesBig History Project
Jared Mason Diamond (1937 — ) is an American scientist and author whose work draws from a variety of fields. He is currently a professor of geography and of physiology at UCLA. His 1997 book, Guns, Germs, and Steel: The Fates of Human
Societies, from which the following passages are excerpted, won the 1998 Pulitzer Prize for general nonfiction and the Aventis Prize for Best Science Book. The basic premise of the book is to explain why Eurasian civilizations have survived
and conquered others, while refuting the idea that Eurasian hegemony is due to intellectual, moral, or genetic superiority.
Register to explore the whole course here: https://school.bighistoryproject.com/bhplive?WT.mc_id=Slideshare12202017
Making comparisons is an important intellectual tool for all people and especially for historians and scientists. Historians, in particular, make comparisons across time to understand what
has changed and what has remained constant. This question looks at the spread of plague and our collective reaction to plague at two different times in human history—the fourteenth century and the nineteenth century. Such a comparison enables us to see clearly how we have changed.
Register to explore the whole course here: https://school.bighistoryproject.com/bhplive?WT.mc_id=Slideshare12202017
Lesson 8.3 Activity: Revising Investigation Writing - Sentence Starters Part 2Big History Project
Students have examined and revised an Investigation writing sample based on Criteria A, B, and C of the rubric. Now, they’ll undergo the same process with a peer essay. In addition, they’ll do this alone instead of in groups. So, although the process is the same as in the last Investigation writing activity, this one might be more difficult since students will move away from group work and will complete this worksheet on their own. However, it’s important for students to be able to accomplish this exercise on their own since in the next lesson, they’ll apply this same process to their own writing. Again, while the categories in the rubric are a useful tool for initially understanding the different elements of writing, they need to be looked at as a whole since the areas of focus are interrelated.
Register to explore the whole course here: https://school.bighistoryproject.com/bhplive?WT.mc_id=Slideshare12202017
Unit 8: When Humans Became Inhumane: The Atlantic Slave TradeBig History Project
Once Europeans had figured out how to be effective middlemen — buying and selling silver, tea, and fur, they turned to figuring out how to also become producers of the commodities they were trading.
Register to explore the whole course here: https://school.bighistoryproject.com/bhplive?WT.mc_id=Slideshare12202017
Unit 8: Investigating the Consequences of the Columbian ExchangeBig History Project
A new era in human history began in 1492 as the four world zones became connected. For the first time, humans created truly global networks.
Register to explore the whole course here: https://school.bighistoryproject.com/bhplive?WT.mc_id=Slideshare12202017
The account of the travels of the Muslim legal scholar Ibn Battuta in the first half of the fourteenth century reveals the wide scope of the Muslim world at that time.
Register to explore the whole course here: https://school.bighistoryproject.com/bhplive?WT.mc_id=Slideshare12202017
Lesson 7.2 Activity: Essay - Were They Pushed or Did They Jump?Big History Project
You’re going to pick a civilization you’ve already researched, and then use the information from your Early Civilizations Museum Project, your Comparing More Civilizations Worksheet, and your Rise, Fall, and Collapse of Civilizations Worksheet to write a five-paragraph essay about whether that civilization was pushed (external forces were the main cause of its downfall) or it jumped (something internal was responsible—they were their own worst enemy). A “pushed” example: Two empires went to war. You might say the winning empire “pushed” the losing empire into collapse. An example of a civilization having “jumped” can be found in the Easter Island Activity earlier in the course: One of the theories for the collapse of Easter Island is that the inhabitants depleted the natural resources they needed to survive. The people were, in a sense, the cause of their own destruction—they “jumped.”
Register to explore the whole course here: https://school.bighistoryproject.com/bhplive?WT.mc_id=Slideshare12202017
Lesson 7.2 Activity: Social Status, Power, and Human BurialsBig History Project
This activity provides students with an opportunity to start thinking about the impact that farming can have on the way humans live and relate to each other. It will also allow them to think about the kinds of questions archaeologists and historians might ask when they must rely upon artifacts rather than written evidence to learn about the past.
Register to explore the whole course here: https://school.bighistoryproject.com/bhplive?WT.mc_id=Slideshare12202017
Unit 7: Greco-Roman: Early Experiments in Participatory GovernmentBig History Project
Instead of rule by a single person, Athens and Rome developed governments with widespread participation by male elites, which lasted about 170 years in Athens and 480 years in Rome.
Register to explore the whole course here: https://school.bighistoryproject.com/bhplive?WT.mc_id=Slideshare12202017
During the same narrow sliver of cosmic time, cities, states, and civilizations emerged independentlyin several places around the world.
Register to explore the whole course here: https://school.bighistoryproject.com/bhplive?WT.mc_id=Slideshare12202017
As a paleontologist and a Catholic priest, Pierre Teilhard de Chardin formulated his own unique vision for a synthesis of science and religion.
Register to explore the whole course here: https://school.bighistoryproject.com/bhplive?WT.mc_id=Slideshare12202017
Many scholars have argued that our capacity to develop, use, and pass on symbolic systems has enabled humans to collect learning and develop increasingly complicated cultures. Indeed,
some argue that it is language that makes us human and thus differentiates us from other animals. Other researchers call into question these assumptions, particularly those working on nonhuman animals’ natural systems of communication and those who teach primates to use symbolic language. A wide range of scholars have been engaged in studying the role that human language has played and continues to play in Big History.
Register to explore the whole course here: https://school.bighistoryproject.com/bhplive?WT.mc_id=Slideshare12202017
Welcome to TechSoup New Member Orientation and Q&A (May 2024).pdfTechSoup
In this webinar you will learn how your organization can access TechSoup's wide variety of product discount and donation programs. From hardware to software, we'll give you a tour of the tools available to help your nonprofit with productivity, collaboration, financial management, donor tracking, security, and more.
Palestine last event orientationfvgnh .pptxRaedMohamed3
An EFL lesson about the current events in Palestine. It is intended to be for intermediate students who wish to increase their listening skills through a short lesson in power point.
Operation “Blue Star” is the only event in the history of Independent India where the state went into war with its own people. Even after about 40 years it is not clear if it was culmination of states anger over people of the region, a political game of power or start of dictatorial chapter in the democratic setup.
The people of Punjab felt alienated from main stream due to denial of their just demands during a long democratic struggle since independence. As it happen all over the word, it led to militant struggle with great loss of lives of military, police and civilian personnel. Killing of Indira Gandhi and massacre of innocent Sikhs in Delhi and other India cities was also associated with this movement.
Embracing GenAI - A Strategic ImperativePeter Windle
Artificial Intelligence (AI) technologies such as Generative AI, Image Generators and Large Language Models have had a dramatic impact on teaching, learning and assessment over the past 18 months. The most immediate threat AI posed was to Academic Integrity with Higher Education Institutes (HEIs) focusing their efforts on combating the use of GenAI in assessment. Guidelines were developed for staff and students, policies put in place too. Innovative educators have forged paths in the use of Generative AI for teaching, learning and assessments leading to pockets of transformation springing up across HEIs, often with little or no top-down guidance, support or direction.
This Gasta posits a strategic approach to integrating AI into HEIs to prepare staff, students and the curriculum for an evolving world and workplace. We will highlight the advantages of working with these technologies beyond the realm of teaching, learning and assessment by considering prompt engineering skills, industry impact, curriculum changes, and the need for staff upskilling. In contrast, not engaging strategically with Generative AI poses risks, including falling behind peers, missed opportunities and failing to ensure our graduates remain employable. The rapid evolution of AI technologies necessitates a proactive and strategic approach if we are to remain relevant.
Macroeconomics- Movie Location
This will be used as part of your Personal Professional Portfolio once graded.
Objective:
Prepare a presentation or a paper using research, basic comparative analysis, data organization and application of economic information. You will make an informed assessment of an economic climate outside of the United States to accomplish an entertainment industry objective.
June 3, 2024 Anti-Semitism Letter Sent to MIT President Kornbluth and MIT Cor...Levi Shapiro
Letter from the Congress of the United States regarding Anti-Semitism sent June 3rd to MIT President Sally Kornbluth, MIT Corp Chair, Mark Gorenberg
Dear Dr. Kornbluth and Mr. Gorenberg,
The US House of Representatives is deeply concerned by ongoing and pervasive acts of antisemitic
harassment and intimidation at the Massachusetts Institute of Technology (MIT). Failing to act decisively to ensure a safe learning environment for all students would be a grave dereliction of your responsibilities as President of MIT and Chair of the MIT Corporation.
This Congress will not stand idly by and allow an environment hostile to Jewish students to persist. The House believes that your institution is in violation of Title VI of the Civil Rights Act, and the inability or
unwillingness to rectify this violation through action requires accountability.
Postsecondary education is a unique opportunity for students to learn and have their ideas and beliefs challenged. However, universities receiving hundreds of millions of federal funds annually have denied
students that opportunity and have been hijacked to become venues for the promotion of terrorism, antisemitic harassment and intimidation, unlawful encampments, and in some cases, assaults and riots.
The House of Representatives will not countenance the use of federal funds to indoctrinate students into hateful, antisemitic, anti-American supporters of terrorism. Investigations into campus antisemitism by the Committee on Education and the Workforce and the Committee on Ways and Means have been expanded into a Congress-wide probe across all relevant jurisdictions to address this national crisis. The undersigned Committees will conduct oversight into the use of federal funds at MIT and its learning environment under authorities granted to each Committee.
• The Committee on Education and the Workforce has been investigating your institution since December 7, 2023. The Committee has broad jurisdiction over postsecondary education, including its compliance with Title VI of the Civil Rights Act, campus safety concerns over disruptions to the learning environment, and the awarding of federal student aid under the Higher Education Act.
• The Committee on Oversight and Accountability is investigating the sources of funding and other support flowing to groups espousing pro-Hamas propaganda and engaged in antisemitic harassment and intimidation of students. The Committee on Oversight and Accountability is the principal oversight committee of the US House of Representatives and has broad authority to investigate “any matter” at “any time” under House Rule X.
• The Committee on Ways and Means has been investigating several universities since November 15, 2023, when the Committee held a hearing entitled From Ivory Towers to Dark Corners: Investigating the Nexus Between Antisemitism, Tax-Exempt Universities, and Terror Financing. The Committee followed the hearing with letters to those institutions on January 10, 202
Instructions for Submissions thorugh G- Classroom.pptxJheel Barad
This presentation provides a briefing on how to upload submissions and documents in Google Classroom. It was prepared as part of an orientation for new Sainik School in-service teacher trainees. As a training officer, my goal is to ensure that you are comfortable and proficient with this essential tool for managing assignments and fostering student engagement.
Acetabularia Information For Class 9 .docxvaibhavrinwa19
Acetabularia acetabulum is a single-celled green alga that in its vegetative state is morphologically differentiated into a basal rhizoid and an axially elongated stalk, which bears whorls of branching hairs. The single diploid nucleus resides in the rhizoid.
Francesca Gottschalk - How can education support child empowerment.pptxEduSkills OECD
Francesca Gottschalk from the OECD’s Centre for Educational Research and Innovation presents at the Ask an Expert Webinar: How can education support child empowerment?
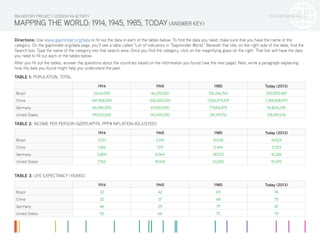
1. TEACHER MATERIALS
MAPPING THE WORLD: 1914, 1945, 1985, TODAY(ANSWER KEY)
Directions: Use www.gapminder.org/data to fill out the data in each of the tables below. To find the data you need, make sure that you have the name of the
category. On the gapminder.org/data page, you’ll see a table called “List of indicators in “Gapminder World.” Beneath that title, on the right side of the table, find the
Search box. Type the name of the category into that search area. Once you find the category, click on the magnifying glass on the right. That link will have the data
you need to fill out each of the tables below.
After you fill out the tables, answer the questions about the countries based on the information you found (see the next page). Next, write a paragraph explaining
how the data you found might help you understand the past.
TABLE 1: POPULATION, TOTAL
1914 1945 1985 Today (2013)
Brazil 24,161,000 46,215,000 136,246,764 200,050,487
China 441,958,000 532,607,000 1,056,579,219 1,359,368,470
Germany 66,096,000 67,000,000 77,684,875 81,804,228
United States 99,505,000 140,474,000 241,119,752 318,497,630
TABLE 2: INCOME PER PERSON (GDP/CAPITA, PPP$ INFLATION-ADJUSTED)
1914 1945 1985 Today (2013)
Brazil 1,033 2,140 10,036 14,529
China 1,062 729 2,494 11,523
Germany 5,804 8,564 28,723 41,326
United States 7,760 18,934 33,500 51,470
TABLE 3: LIFE EXPECTANCY (YEARS)
1914 1945 1985 Today (2013)
Brazil 32 42 65 74
China 32 37 68 75
Germany 46 29 79 81
United States 55 66 75 79
BIG HISTORY PROJECT / LESSON 9.6 ACTIVITY
2. TEACHER MATERIALS
MAPPING THE WORLD: 1914, 1945, 1985, TODAY (ANSWER KEY)
TABLE 1: POPULATION
1. What can population tell us about a country?
Sample answer: On a very basic level, population
tells you how many people are in a place. However,
changes in population imply certain things. For
example, a place with a high population may be in
a good location or have a lot of job opportunities. A
place with a low population may not be developed, it
could be uninhabitable, or not have enough sources
of food.
2. When looking at the population data, which
country’s population has grown the least?
Sample answer: Germany’s population increased
the least.
3. Based on what you’ve learned about the past,
why might that be?
Sample answer: This might be due to all the people
who died in the World Wars I and II.
TABLE 2: INCOME PER PERSON
1. Which country’s GDP dropped from 1914 to 1945?
Sample answer: China’s.
2. What might explain this drop?
Sample answer: World War II was ending around
that time and drained China financially.
3. GDP and population are related in that the faster
a country’s population grows, the harder it is for
that country to be economically successful. So,
the higher the population growth, the slower the
economy growth. Or, the lower the population
growth, the faster the economy growth. Which of
those is reflected in this data? Provide evidence.
Sample answer: Population growth did not seem to
slow the growth of the GDP, but in those countries
where the population wasn’t growing as much,
their economies certainly strengthened. From 1914
to 1945, Germany’s population only increased by
one million people, but their GDP in income per
person grew from 5,804 to 8,565 showing that the
economy strengthened while population stayed
fairly steady.
TABLE 3: LIFE EXPECTANCY
1. What can life expectancy tell you about a country?
Sample answer: It can indicate the level of health and
wellness in that country, as well as people’s access to
food and healthcare. The higher the life expectancy,
the better the health of a nation.
2. The life expectancy increased in all countries for
all of the years except for one. Which country had
a decrease in life expectancy and when did that
happen? What is a reasonable explanation for the
drop?
Sample answer: Germany had a drop in life
expectancy from 46 years to 29 years between 1914
and 1945. This drop can be attributed to all of the
war-related deaths during those years.
3. Life expectancy has risen dramatically since 1914.
What are some explanations for this?
Sample answer: Better healthcare, more sanitary
living conditions, lower infant mortality rates, more
access to food and shelter.
BIG HISTORY PROJECT / LESSON 9.6 ACTIVITY
Now, write a few sentences on the back of this page about how looking at these three kinds of data rather than separately can tell us more about a country and the past.
3. Name: Date:
STUDENT MATERIALS
MAPPING THE WORLD: 1914, 1945, 1985, TODAY
Use www.gapminder.org/data to fill out the data in each of the tables below. To find the data you need, make sure that you have the name of the category. On the
gapminder.org/data page, you’ll see a table called “List of indicators in “Gapminder World.” Beneath that title, on the right side of the table, find the Search box. Type
the name of the category into that search area. Once you find the category, click on the magnifying glass on the right. That link will have the data you need to fill out
each of the tables below.
After you fill out the tables, answer the questions about the countries based on the information you found (see the next page). Next, write a paragraph explaining
how the data you found might help you understand the past.
TABLE 1: POPULATION, TOTAL
1914 1945 1985 Today (2013)
Brazil
China
Germany
United States
TABLE 2: INCOME PER PERSON (GDP/CAPITA, PPP$ INFLATION-ADJUSTED)
1914 1945 1985 Today (2013)
Brazil
China
Germany
United States
TABLE 3: LIFE EXPECTANCY (YEARS)
1914 1945 1985 Today (2013)
Brazil
China
Germany
United States
BIG HISTORY PROJECT / LESSON 9.6 ACTIVITY
4. Name: Date:
STUDENT MATERIALS
MAPPING THE WORLD: 1914, 1945, 1985, TODAY
TABLE 1: POPULATION, TOTAL
1. What can population tell us about a country?
2. When looking at the population data, which
country’s population has grown the least?
3. Based on what you’ve learned about the past,
why might that be?
TABLE 2: INCOME PER PERSON
1. Which country’s GDP dropped from 1914 to 1945?
2. What might have explain this drop?
3. GDP and population are related in that the faster
a country’s population grows, the harder it is for
that country to be economically successful. So,
the higher the population growth, the slower the
economy growth. Or, the lower the population
growth, the faster the economy growth. Which of
those is reflected in this data? Provide evidence.
TABLE 3: LIFE EXPECTANCY
1. What can life expectancy tell you about a country?
2. The life expectancy increased in all countries for
all of the years except for one. Which country had
a decrease in life expectancy and when did that
happen? What is a reasonable explanation for the
drop?
3. Life expectancy has risen dramatically since 1914.
What are some explanations for this?
BIG HISTORY PROJECT / LESSON 9.6 ACTIVITY
Now, write a few sentences on the back of this page about how looking at these three kinds of data together and not just alone can tell us more about a country and the past.