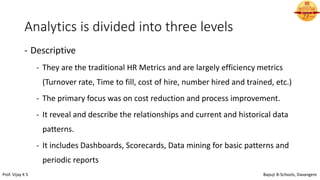
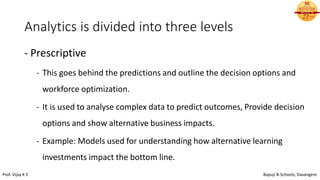
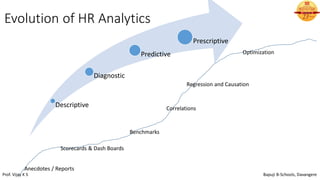
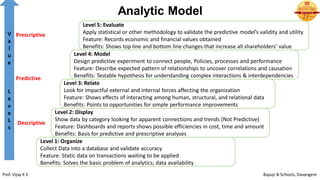
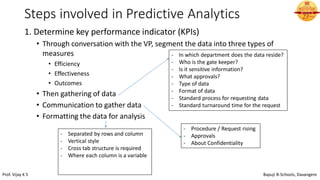
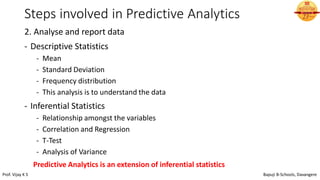
HR Analytics
Unit - 3
Prof. Vijay K S Bapuji B-Schools, Davangere
Basics of HR Analytics
Prof. Vijay K S Bapuji B-Schools, Davangere
Nature of Analytics?
Analytics
Arts Science
Logic Design Statistics Procedure
Evaluation
Strategic
Operational
Futures
Prof. Vijay K S Bapuji B-Schools, Davangere
ANALYTICS?
“Analytics is first a mental framework, a logical progression
and second a set of statistical operations”
Prof. Vijay K S Bapuji B-Schools, Davangere
HR Analytics / Human Capital Analytics
- Basically communicative device
- It brings together data from disparate sources, such as
Surveys, records, and Operations, to paint a cohesive,
actionable picture of current conditions and likely future.
Prof. Vijay K S Bapuji B-Schools, Davangere
Analytics is divided into three levels
- Descriptive
- Predictive
- Prescriptive
Prof. Vijay K S Bapuji B-Schools, Davangere
Analytics is divided into three levels
- Descriptive
- They are the traditional HR Metrics and are largely efficiency metrics
(Turnover rate, Time to fill, cost of hire, number hired and trained, etc.)
- The primary focus was on cost reduction and process improvement.
- It reveal and describe the relationships and current and historical data
patterns.
- It includes Dashboards, Scorecards, Data mining for basic patterns and
periodic reports
Prof. Vijay K S Bapuji B-Schools, Davangere
Analytics is divided into three levels
- Predictive
- It covers variety of techniques viz. Statistics, modelling, data mining that
use current and historical facts to make predictions about the future.
- Its about the probabilities and potential impact.
- Examples: Models used for increasing the probability of selecting the right
people to hire, train and promote.
Prof. Vijay K S Bapuji B-Schools, Davangere
Analytics is divided into three levels
- Prescriptive
- This goes behind the predictions and outline the decision options and
workforce optimization.
- It is used to analyse complex data to predict outcomes, Provide decision
options and show alternative business impacts.
- Example: Models used for understanding how alternative learning
investments impact the bottom line.
Prof. Vijay K S Bapuji B-Schools, Davangere
Evolution of HR Analytics
Anecdotes / Reports
Scorecards & Dash Boards
Benchmarks
Correlations
Regression and Causation
Optimization
Descriptive
Diagnostic
Predictive
Prescriptive
Prof. Vijay K S Bapuji B-Schools, Davangere
Two Values – HR Analytics
Financial Economic
Structured Unstructured
Descriptive Predictive Prescriptive
Prof. Vijay K S Bapuji B-Schools, Davangere
Analytic Value Chain
Strategic Business
Plan
Innovate
Produce, Sell
Service
Customer: Analysed
Needs
Price
Quality
Service
Operations:
Planning targets:
Process Times
Product Quality
Output volume
Talent Management:
Workforce Planning – Hiring
– Deploying-compensating-
developing-engaging-
sustaining
HR Services:
Workforce and succession plan-
hire cost-time to fill – quality pay
ad benefits cost
L&D Spend-engagement program
Operational Outputs:
Unit cost – Cycle time
Quantity: Output/input
Quality: Error rates, shrink,
rework
Customer responses:
Number contacted and
number responding
Conversion Rate and Spend
Satisfaction level
Return Rate
Financial Outcomes:
Income Statement
- Revenue
- Expenses
Balance Sheet
- Assets and Liabilities
Strategy Execution
Prof. Vijay K S Bapuji B-Schools, Davangere
Analytic Model
Level 2: Display
Show data by category looking for apparent connections and trends (Not Predictive)
Feature: Dashboards and reports shows possible efficiencies in cost, time and amount
Benefits: Basis for predictive and prescriptive analyses
Level 1: Organize
Collect Data into a database and validate accuracy
Feature: Static data on transactions waiting to be applied
Benefits: Solves the basic problem of analytics; data availability
Level 5: Evaluate
Apply statistical or other methodology to validate the predictive model’s validity and utility
Feature: Records economic and financial values obtained
Benefits: Shows top line and bottom line changes that increase all shareholders’ value
Level 4: Model
Design predictive experiment to connect people, Policies, processes and performance
Feature: Describe expected pattern of relationships to uncover correlations and causation
Benefits: Testable hypothesis for understanding complex interactions & interdependencies
Level 3: Relate
Look for impactful external and internal forces affecting the organization
Feature: Shows effects of interacting among human, structural, and relational data
Benefits: Points to opportunities for simple performance improvements
V
a
l
u
e
L
e
v
e
L
s
Descriptive
Predictive
Prescriptive
Prof. Vijay K S Bapuji B-Schools, Davangere
Typical Application
• Turnover or Attrition – Very common – But few attempts on to
connect turnover or retention changes with business outcomes.
• Assess the patterns within the job groups
• Assessing the disengagement – When the four fundamental human
needs have not met –
• TRUST
• HOPE
• SENSE OF WORTH and
• FEELING COMPETENT.
(Leigh Branham on retention research)
Prof. Vijay K S Bapuji B-Schools, Davangere
Typical Application
• Preventable Reasons Why Employee Disengage
• Job and workplace was not what was expected
• Mismatch between job and person
• Too tittle coaching or feedback
• Not feeling valued or recognised
• Stress from overwork and work/life balance
• Loss of trust and confidence in senior leaders
• Exit interviews can give lots of insight on Tenure, Reason and Position
• The organizations are highly complex, So one should
• Truly know what is happening (descriptive analytics)
• Why it is happening and where it is likely to lead (Predictive analytics)
• What to do about it (Prescriptive Analytics)
Prof. Vijay K S Bapuji B-Schools, Davangere
Predictive Analytics
Link different data sets and apply predictive analytics to create information for stakeholders
Prof. Vijay K S Bapuji B-Schools, Davangere
Steps involved in Predictive Analytics
• Determine key performance indicator,
• Analyse and report data,
• Interpreting the results and
• Predicting the future
Prof. Vijay K S Bapuji B-Schools, Davangere
Steps involved in Predictive Analytics
1. Determine key performance indicator (KPIs)
• Through conversation with the VP, segment the data into three types of
measures
• Efficiency
• Effectiveness
• Outcomes
• Then gathering of data
• Communication to gather data
• Formatting the data for analysis
- In which department does the data reside?
- Who is the gate keeper?
- Is it sensitive information?
- What approvals?
- Type of data
- Format of data
- Standard process for requesting data
- Standard turnaround time for the request
- Procedure / Request rising
- Approvals
- About Confidentiality
- Separated by rows and column
- Vertical style
- Cross tab structure is required
- Where each column is a variable
Prof. Vijay K S Bapuji B-Schools, Davangere
Steps involved in Predictive Analytics
2. Analyse and report data
- Descriptive Statistics
- Mean
- Standard Deviation
- Frequency distribution
- This analysis is to understand the data
- Inferential Statistics
- Relationship amongst the variables
- Correlation and Regression
- T-Test
- Analysis of Variance
Predictive Analytics is an extension of inferential statistics
Prof. Vijay K S Bapuji B-Schools, Davangere
Ask some questions?
April May June
A 15 18 12
B 10 15 13
C 5 5 7
0
2
4
6
8
10
12
14
16
18
20
Open positions by Business Unit in Quarter
A B CProf. Vijay K S Bapuji B-Schools, Davangere
Ask some questions?
April May June
A 40 43 48
B 18 22 23
C 12 16 15
40 43
48
18
22 23
12
16 15
0
10
20
30
40
50
60
Average Number of Days to fill a position
A B C
Prof. Vijay K S Bapuji B-Schools, Davangere
Thank you
Prof. Vijay K S Bapuji B-Schools, Davangere

Unit 3 hr analytics

  • 1.
    HR Analytics Unit -3 Prof. Vijay K S Bapuji B-Schools, Davangere
  • 2.
    Basics of HRAnalytics Prof. Vijay K S Bapuji B-Schools, Davangere
  • 3.
    Nature of Analytics? Analytics ArtsScience Logic Design Statistics Procedure Evaluation Strategic Operational Futures Prof. Vijay K S Bapuji B-Schools, Davangere
  • 4.
    ANALYTICS? “Analytics is firsta mental framework, a logical progression and second a set of statistical operations” Prof. Vijay K S Bapuji B-Schools, Davangere
  • 5.
    HR Analytics /Human Capital Analytics - Basically communicative device - It brings together data from disparate sources, such as Surveys, records, and Operations, to paint a cohesive, actionable picture of current conditions and likely future. Prof. Vijay K S Bapuji B-Schools, Davangere
  • 6.
    Analytics is dividedinto three levels - Descriptive - Predictive - Prescriptive Prof. Vijay K S Bapuji B-Schools, Davangere
  • 7.
    Analytics is dividedinto three levels - Descriptive - They are the traditional HR Metrics and are largely efficiency metrics (Turnover rate, Time to fill, cost of hire, number hired and trained, etc.) - The primary focus was on cost reduction and process improvement. - It reveal and describe the relationships and current and historical data patterns. - It includes Dashboards, Scorecards, Data mining for basic patterns and periodic reports Prof. Vijay K S Bapuji B-Schools, Davangere
  • 8.
    Analytics is dividedinto three levels - Predictive - It covers variety of techniques viz. Statistics, modelling, data mining that use current and historical facts to make predictions about the future. - Its about the probabilities and potential impact. - Examples: Models used for increasing the probability of selecting the right people to hire, train and promote. Prof. Vijay K S Bapuji B-Schools, Davangere
  • 9.
    Analytics is dividedinto three levels - Prescriptive - This goes behind the predictions and outline the decision options and workforce optimization. - It is used to analyse complex data to predict outcomes, Provide decision options and show alternative business impacts. - Example: Models used for understanding how alternative learning investments impact the bottom line. Prof. Vijay K S Bapuji B-Schools, Davangere
  • 10.
    Evolution of HRAnalytics Anecdotes / Reports Scorecards & Dash Boards Benchmarks Correlations Regression and Causation Optimization Descriptive Diagnostic Predictive Prescriptive Prof. Vijay K S Bapuji B-Schools, Davangere
  • 11.
    Two Values –HR Analytics Financial Economic Structured Unstructured Descriptive Predictive Prescriptive Prof. Vijay K S Bapuji B-Schools, Davangere
  • 12.
    Analytic Value Chain StrategicBusiness Plan Innovate Produce, Sell Service Customer: Analysed Needs Price Quality Service Operations: Planning targets: Process Times Product Quality Output volume Talent Management: Workforce Planning – Hiring – Deploying-compensating- developing-engaging- sustaining HR Services: Workforce and succession plan- hire cost-time to fill – quality pay ad benefits cost L&D Spend-engagement program Operational Outputs: Unit cost – Cycle time Quantity: Output/input Quality: Error rates, shrink, rework Customer responses: Number contacted and number responding Conversion Rate and Spend Satisfaction level Return Rate Financial Outcomes: Income Statement - Revenue - Expenses Balance Sheet - Assets and Liabilities Strategy Execution Prof. Vijay K S Bapuji B-Schools, Davangere
  • 13.
    Analytic Model Level 2:Display Show data by category looking for apparent connections and trends (Not Predictive) Feature: Dashboards and reports shows possible efficiencies in cost, time and amount Benefits: Basis for predictive and prescriptive analyses Level 1: Organize Collect Data into a database and validate accuracy Feature: Static data on transactions waiting to be applied Benefits: Solves the basic problem of analytics; data availability Level 5: Evaluate Apply statistical or other methodology to validate the predictive model’s validity and utility Feature: Records economic and financial values obtained Benefits: Shows top line and bottom line changes that increase all shareholders’ value Level 4: Model Design predictive experiment to connect people, Policies, processes and performance Feature: Describe expected pattern of relationships to uncover correlations and causation Benefits: Testable hypothesis for understanding complex interactions & interdependencies Level 3: Relate Look for impactful external and internal forces affecting the organization Feature: Shows effects of interacting among human, structural, and relational data Benefits: Points to opportunities for simple performance improvements V a l u e L e v e L s Descriptive Predictive Prescriptive Prof. Vijay K S Bapuji B-Schools, Davangere
  • 14.
    Typical Application • Turnoveror Attrition – Very common – But few attempts on to connect turnover or retention changes with business outcomes. • Assess the patterns within the job groups • Assessing the disengagement – When the four fundamental human needs have not met – • TRUST • HOPE • SENSE OF WORTH and • FEELING COMPETENT. (Leigh Branham on retention research) Prof. Vijay K S Bapuji B-Schools, Davangere
  • 15.
    Typical Application • PreventableReasons Why Employee Disengage • Job and workplace was not what was expected • Mismatch between job and person • Too tittle coaching or feedback • Not feeling valued or recognised • Stress from overwork and work/life balance • Loss of trust and confidence in senior leaders • Exit interviews can give lots of insight on Tenure, Reason and Position • The organizations are highly complex, So one should • Truly know what is happening (descriptive analytics) • Why it is happening and where it is likely to lead (Predictive analytics) • What to do about it (Prescriptive Analytics) Prof. Vijay K S Bapuji B-Schools, Davangere
  • 16.
    Predictive Analytics Link differentdata sets and apply predictive analytics to create information for stakeholders Prof. Vijay K S Bapuji B-Schools, Davangere
  • 17.
    Steps involved inPredictive Analytics • Determine key performance indicator, • Analyse and report data, • Interpreting the results and • Predicting the future Prof. Vijay K S Bapuji B-Schools, Davangere
  • 18.
    Steps involved inPredictive Analytics 1. Determine key performance indicator (KPIs) • Through conversation with the VP, segment the data into three types of measures • Efficiency • Effectiveness • Outcomes • Then gathering of data • Communication to gather data • Formatting the data for analysis - In which department does the data reside? - Who is the gate keeper? - Is it sensitive information? - What approvals? - Type of data - Format of data - Standard process for requesting data - Standard turnaround time for the request - Procedure / Request rising - Approvals - About Confidentiality - Separated by rows and column - Vertical style - Cross tab structure is required - Where each column is a variable Prof. Vijay K S Bapuji B-Schools, Davangere
  • 19.
    Steps involved inPredictive Analytics 2. Analyse and report data - Descriptive Statistics - Mean - Standard Deviation - Frequency distribution - This analysis is to understand the data - Inferential Statistics - Relationship amongst the variables - Correlation and Regression - T-Test - Analysis of Variance Predictive Analytics is an extension of inferential statistics Prof. Vijay K S Bapuji B-Schools, Davangere
  • 20.
    Ask some questions? AprilMay June A 15 18 12 B 10 15 13 C 5 5 7 0 2 4 6 8 10 12 14 16 18 20 Open positions by Business Unit in Quarter A B CProf. Vijay K S Bapuji B-Schools, Davangere
  • 21.
    Ask some questions? AprilMay June A 40 43 48 B 18 22 23 C 12 16 15 40 43 48 18 22 23 12 16 15 0 10 20 30 40 50 60 Average Number of Days to fill a position A B C Prof. Vijay K S Bapuji B-Schools, Davangere
  • 22.
    Thank you Prof. VijayK S Bapuji B-Schools, Davangere