
More Related Content
More from finance27
More from finance27 (20)
Recently uploaded
Recently uploaded (20)
alltel 4Q 04_Non-GAAPReconciliation
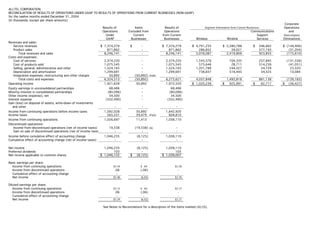
- 1. ALLTEL CORPORATION RECONCILIATION OF RESULTS OF OPERATIONS UNDER GAAP TO RESULTS OF OPERATIONS FROM CURRENT BUSINESSES (NON-GAAP) for the twelve months ended December 31, 2004 (In thousands, except per share amounts) Corporate Results of Items Results of Operations Segment Information from Current Businesses Operations Excluded from Operations Communications and Under Current from Current Support Intercompany GAAP Businesses Businesses Wireless Wireline Services Eliminations Revenues and sales: Service revenues $ 7,374,279 $ - $ 7,374,279 $ 4,791,235 $ 2,380,788 $ 346,662 $ (144,406) Product sales 871,862 - 871,862 286,852 39,021 577,193 (31,204) Total revenues and sales 8,246,141 - 8,246,141 5,078,087 2,419,809 923,855 (175,610) Costs and expenses: Cost of services 2,374,220 - 2,374,220 1,543,576 704,335 257,845 (131,536) Cost of products sold 1,075,545 - 1,075,545 573,646 28,711 514,239 (41,051) Selling, general, administrative and other 1,524,165 - 1,524,165 1,201,789 244,327 54,729 23,320 Depreciation and amortization 1,299,691 - 1,299,691 738,837 516,445 34,325 10,084 Integration expenses, restructuring and other charges 50,892 (50,892) (A)(B) - - - - - Total costs and expenses 6,324,513 (50,892) 6,273,621 4,057,848 1,493,818 861,138 (139,183) Operating income 1,921,628 50,892 1,972,520 $ 1,020,239 $ 925,991 $ 62,717 $ (36,427) Equity earnings in unconsolidated partnerships 68,486 - 68,486 Minority interest in consolidated partnerships (80,096) - (80,096) Other income (expense), net 34,500 - 34,500 Interest expense (352,490) - (352,490) Gain (loss) on disposal of assets, write-down of investments and other - - - Income from continuing operations before income taxes 1,592,028 50,892 1,642,920 Income taxes 565,331 39,479 (P)(Q) 604,810 Income from continuing operations 1,026,697 11,413 1,038,110 Discontinued operations: Income from discontinued operations (net of income taxes) 19,538 (19,538) (Q) - Gain on sale of discontinued operations (net of income taxes) - - - Income before cumulative effect of accounting change 1,046,235 (8,125) 1,038,110 Cumulative effect of accounting change (net of income taxes) - - - Net income 1,046,235 (8,125) 1,038,110 Preferred dividends 103 - 103 Net income applicable to common shares $ 1,046,132 $ (8,125) $ 1,038,007 Basic earnings per share: Income from continuing operations $3.34 $ .04 $3.38 Income from discontinued operations .06 (.06) - Cumulative effect of accounting change - - - Net income $3.40 $(.02) $3.38 Diluted earnings per share: Income from continuing operations $3.33 $ .04 $3.37 Income from discontinued operations .06 (.06) - Cumulative effect of accounting change - - - Net income $3.39 $(.02) $3.37 See Notes to Reconcilations for a description of the items marked (A)-(S).
- 2. ALLTEL CORPORATION RECONCILIATION OF RESULTS OF OPERATIONS UNDER GAAP TO RESULTS OF OPERATIONS FROM CURRENT BUSINESSES (NON-GAAP) for the three months ended December 31, 2004 (In thousands, except per share amounts) Corporate Results of Items Results of Operations Segment Information from Current Businesses Operations Excluded from Operations Communications and Under Current from Current Support Intercompany GAAP Businesses Businesses Wireless Wireline Services Eliminations Revenues and sales: Service revenues $ 1,897,402 $ - $ 1,897,402 $ 1,252,773 $ 597,315 $ 81,462 $ (34,148) Product sales 242,391 - 242,391 73,999 10,460 167,027 (9,095) Total revenues and sales 2,139,793 - 2,139,793 1,326,772 607,775 248,489 (43,243) Costs and expenses: Cost of services 604,818 - 604,818 399,114 173,146 64,297 (31,739) Cost of products sold 299,603 - 299,603 154,747 8,576 146,997 (10,717) Selling, general, administrative and other 402,489 - 402,489 318,968 62,466 14,856 6,199 Depreciation and amortization 332,520 - 332,520 193,789 127,921 8,454 2,356 Integration expenses, restructuring and other charges (873) 873 (A) - - - - - Total costs and expenses 1,638,557 873 1,639,430 1,066,618 372,109 234,604 (33,901) Operating income 501,236 (873) 500,363 $ 260,154 $ 235,666 $ 13,885 $ (9,342) Equity earnings in unconsolidated partnerships 14,970 - 14,970 Minority interest in consolidated partnerships (19,227) - (19,227) Other income (expense), net 11,360 - 11,360 Interest expense (87,512) - (87,512) Gain (loss) on disposal of assets, write-down of investments and other - - - Income from continuing operations before income taxes 420,827 (873) 419,954 Income taxes 150,182 (286) (P) 149,896 Income from continuing operations 270,645 (587) 270,058 Discontinued operations: Income from discontinued operations (net of income taxes) - - - Gain on sale of discontinued operations (net of income taxes) - - - Income before cumulative effect of accounting change 270,645 (587) 270,058 Cumulative effect of accounting change (net of income taxes) - - - Net income 270,645 (587) 270,058 Preferred dividends 25 - 25 Net income applicable to common shares $ 270,620 $ (587) $ 270,033 Basic earnings per share: Income from continuing operations $- $.89 $.89 Income from discontinued operations - - - Cumulative effect of accounting change - - - Net income $- $.89 $.89 Diluted earnings per share: Income from continuing operations $- $.89 $.89 Income from discontinued operations - - - Cumulative effect of accounting change - - - Net income $- $.89 $.89 See Notes to Reconcilations for a description of the items marked (A)-(S).
- 3. ALLTEL CORPORATION RECONCILIATION OF RESULTS OF OPERATIONS UNDER GAAP TO RESULTS OF OPERATIONS FROM CURRENT BUSINESSES (NON-GAAP) for the three months ended September 30, 2004 (In thousands, except per share amounts) Corporate Results of Items Results of Operations Segment Information from Current Businesses Operations Excluded from Operations Communications and Under Current from Current Support Intercompany GAAP Businesses Businesses Wireless Wireline Services Eliminations Revenues and sales: Service revenues $ 1,885,405 $ - $ 1,885,405 $ 1,239,409 $ 592,373 $ 86,862 $ (33,239) Product sales 217,707 - 217,707 74,338 10,563 140,275 (7,469) Total revenues and sales 2,103,112 - 2,103,112 1,313,747 602,936 227,137 (40,708) Costs and expenses: Cost of services 624,442 - 624,442 406,660 179,719 68,910 (30,847) Cost of products sold 262,604 - 262,604 139,301 7,822 124,575 (9,094) Selling, general, administrative and other 373,624 - 373,624 294,070 60,033 13,593 5,928 Depreciation and amortization 324,678 - 324,678 186,169 127,580 8,570 2,359 Integration expenses, restructuring and other charges - - - - - - - Total costs and expenses 1,585,348 - 1,585,348 1,026,200 375,154 215,648 (31,654) Operating income 517,764 - 517,764 $ 287,547 $ 227,782 $ 11,489 $ (9,054) Equity earnings in unconsolidated partnerships 24,338 - 24,338 Minority interest in consolidated partnerships (23,647) - (23,647) Other income (expense), net 15,652 - 15,652 Interest expense (86,699) - (86,699) Gain (loss) on disposal of assets, write-down of investments and other - - - Income from continuing operations before income taxes 447,408 - 447,408 Income taxes 143,727 19,656 (Q) 163,383 Income from continuing operations 303,681 (19,656) 284,025 Discontinued operations: Income from discontinued operations (net of income taxes) 19,538 (19,538) (Q) - Gain on sale of discontinued operations (net of income taxes) - - - Income before cumulative effect of accounting change 323,219 (39,194) 284,025 Cumulative effect of accounting change (net of income taxes) - - - Net income 323,219 (39,194) 284,025 Preferred dividends 25 - 25 Net income applicable to common shares $ 323,194 $ (39,194) $ 284,000 Basic earnings per share: Income from continuing operations $ .99 $(.06) $.93 Income from discontinued operations .06 (.06) - Cumulative effect of accounting change - - - Net income $(.12) $1.05 $.93 Diluted earnings per share: Income from continuing operations $ .99 $(.07) $.92 Income from discontinued operations .06 (.06) - Cumulative effect of accounting change - - - Net income $(.13) $1.05 $.92 See Notes to Reconcilations for a description of the items marked (A)-(S).
- 4. ALLTEL CORPORATION RECONCILIATION OF RESULTS OF OPERATIONS UNDER GAAP TO RESULTS OF OPERATIONS FROM CURRENT BUSINESSES (NON-GAAP) for the three months ended June 30, 2004 (In thousands, except per share amounts) Corporate Results of Items Results of Operations Segment Information from Current Businesses Operations Excluded from Operations Communications and Under Current from Current Support Intercompany GAAP Businesses Businesses Wireless Wireline Services Eliminations Revenues and sales: Service revenues $ 1,825,894 $ - $ 1,825,894 $ 1,183,549 $ 599,567 $ 84,583 $ (41,805) Product sales 216,170 - 216,170 69,533 10,065 144,596 (8,024) Total revenues and sales 2,042,064 - 2,042,064 1,253,082 609,632 229,179 (49,829) Costs and expenses: Cost of services 584,189 - 584,189 382,060 178,599 58,679 (35,149) Cost of products sold 256,055 - 256,055 135,048 7,158 127,799 (13,950) Selling, general, administrative and other 372,859 - 372,859 293,009 60,908 13,050 5,892 Depreciation and amortization 321,151 - 321,151 181,350 128,610 8,755 2,436 Integration expenses, restructuring and other charges - - - - - - - Total costs and expenses 1,534,254 - 1,534,254 991,467 375,275 208,283 (40,771) Operating income 507,810 - 507,810 $ 261,615 $ 234,357 $ 20,896 $ (9,058) Equity earnings in unconsolidated partnerships 15,926 - 15,926 Minority interest in consolidated partnerships (21,651) - (21,651) Other income (expense), net 2,875 - 2,875 Interest expense (86,543) - (86,543) Gain (loss) on disposal of assets, write-down of investments and other - - - Income from continuing operations before income taxes 418,417 - 418,417 Income taxes 155,889 - 155,889 Income from continuing operations 262,528 - 262,528 Discontinued operations: Income from discontinued operations (net of income taxes) - - - Gain on sale of discontinued operations (net of income taxes) - - - Income before cumulative effect of accounting change 262,528 - 262,528 Cumulative effect of accounting change (net of income taxes) - - - Net income 262,528 - 262,528 Preferred dividends 26 - 26 Net income applicable to common shares $ 262,502 $ - $ 262,502 Basic earnings per share: Income from continuing operations $- $.85 $.85 Income from discontinued operations - - - Cumulative effect of accounting change - - - Net income $- $.85 $.85 Diluted earnings per share: Income from continuing operations $- $.85 $.85 Income from discontinued operations - - - Cumulative effect of accounting change - - - Net income $- $.85 $.85 See Notes to Reconcilations for a description of the items marked (A)-(S).
- 5. ALLTEL CORPORATION RECONCILIATION OF RESULTS OF OPERATIONS UNDER GAAP TO RESULTS OF OPERATIONS FROM CURRENT BUSINESSES (NON-GAAP) for the three months ended March 31, 2004 (In thousands, except per share amounts) Corporate Results of Items Results of Operations Segment Information from Current Businesses Operations Excluded from Operations Communications and Under Current from Current Support Intercompany GAAP Businesses Businesses Wireless Wireline Services Eliminations Revenues and sales: Service revenues $ 1,765,578 $ - $ 1,765,578 $ 1,115,504 $ 591,533 $ 93,755 $ (35,214) Product sales 195,594 - 195,594 68,982 7,933 125,295 (6,616) Total revenues and sales 1,961,172 - 1,961,172 1,184,486 599,466 219,050 (41,830) Costs and expenses: Cost of services 560,771 - 560,771 355,742 172,871 65,959 (33,801) Cost of products sold 257,283 - 257,283 144,550 5,155 114,868 (7,290) Selling, general, administrative and other 375,193 - 375,193 295,742 60,920 13,230 5,301 Depreciation and amortization 321,342 - 321,342 177,529 132,334 8,546 2,933 Integration expenses, restructuring and other charges 51,765 (51,765) (B) - - - - - Total costs and expenses 1,566,354 (51,765) 1,514,589 973,563 371,280 202,603 (32,857) Operating income 394,818 51,765 446,583 $ 210,923 $ 228,186 $ 16,447 $ (8,973) Equity earnings in unconsolidated partnerships 13,252 - 13,252 Minority interest in consolidated partnerships (15,571) - (15,571) Other income (expense), net 4,613 - 4,613 Interest expense (91,736) - (91,736) Gain (loss) on disposal of assets, write-down of investments and other - - - Income from continuing operations before income taxes 305,376 51,765 357,141 Income taxes 115,533 20,109 (P) 135,642 Income from continuing operations 189,843 31,656 221,499 Discontinued operations: Income from discontinued operations (net of income taxes) - - - Gain on sale of discontinued operations (net of income taxes) - - - Income before cumulative effect of accounting change 189,843 31,656 221,499 Cumulative effect of accounting change (net of income taxes) - - - Net income 189,843 31,656 221,499 Preferred dividends 27 - 27 Net income applicable to common shares $ 189,816 $ 31,656 $ 221,472 Basic earnings per share: Income from continuing operations $.61 $.10 $.71 Income from discontinued operations - - - Cumulative effect of accounting change - - - Net income $.61 $.10 $.71 Diluted earnings per share: Income from continuing operations $.61 $.10 $.71 Income from discontinued operations - - - Cumulative effect of accounting change - - - Net income $.61 $.10 $.71 See Notes to Reconcilations for a description of the items marked (A)-(S).
- 6. ALLTEL CORPORATION RECONCILIATION OF RESULTS OF OPERATIONS UNDER GAAP TO RESULTS OF OPERATIONS FROM CURRENT BUSINESSES (NON-GAAP) for the twelve months ended December 31, 2003 (In thousands, except per share amounts) Corporate Results of Items Results of Operations Segment Information from Current Businesses Operations Excluded from Operations Communications and Under Current from Current Support Intercompany GAAP Businesses Businesses Wireless Wireline Services Eliminations Revenues and sales: Service revenues $ 7,156,067 $ - $ 7,156,067 $ 4,466,462 $ 2,395,625 $ 428,983 $ (135,003) Product sales 823,843 - 823,843 261,937 40,454 530,078 (8,626) Total revenues and sales 7,979,910 - 7,979,910 4,728,399 2,436,079 959,061 (143,629) Costs and expenses: Cost of services 2,273,598 - 2,273,598 1,367,812 737,161 299,006 (130,381) Cost of products sold 1,043,468 - 1,043,468 536,648 29,131 486,936 (9,247) Selling, general, administrative and other 1,498,122 - 1,498,122 1,154,961 259,406 60,511 23,244 Depreciation and amortization 1,247,748 - 1,247,748 670,978 526,508 36,191 14,071 Integration expenses, restructuring and other charges 18,979 (18,979) (D) - - - - - Total costs and expenses 6,081,915 (18,979) 6,062,936 3,730,399 1,552,206 882,644 (102,313) Operating income 1,897,995 18,979 1,916,974 $ 998,000 $ 883,873 $ 76,417 $ (41,316) Equity earnings in unconsolidated partnerships 64,373 - 64,373 Minority interest in consolidated partnerships (78,604) - (78,604) Other income (expense), net 11,068 - 11,068 Interest expense (378,627) - (378,627) Gain (loss) on disposal of assets, write-down of investments and other 17,933 (17,933) (C)(E) - Income from continuing operations before income taxes 1,534,138 1,046 1,535,184 Income taxes 580,609 180 (P) 580,789 Income from continuing operations 953,529 866 954,395 Discontinued operations: Income from discontinued operations (net of income taxes) 37,072 (37,072) (R) - Gain on sale of discontinued operations (net of income taxes) 323,927 (323,927) (R) - Income before cumulative effect of accounting change 1,314,528 (360,133) 954,395 Cumulative effect of accounting change (net of income taxes) 15,591 (15,591) (S) - Net income 1,330,119 (375,724) 954,395 Preferred dividends 111 - 111 Net income applicable to common shares $ 1,330,008 $ (375,724) $ 954,284 Basic earnings per share: Income from continuing operations $ - $3.06 $3.06 Income from discontinued operations 1.16 (1.16) - Cumulative effect of accounting change .05 (.05) - Net income $4.27 $(1.21) $3.06 Diluted earnings per share: Income from continuing operations $ - $3.05 $3.05 Income from discontinued operations 1.15 (1.15) - Cumulative effect of accounting change .05 (.05) - Net income $4.25 $(1.20) $3.05 See Notes to Reconcilations for a description of the items marked (A)-(S).
- 7. ALLTEL CORPORATION RECONCILIATION OF RESULTS OF OPERATIONS UNDER GAAP TO RESULTS OF OPERATIONS FROM CURRENT BUSINESSES (NON-GAAP) for the three months ended December 31, 2003 (In thousands, except per share amounts) Corporate Segment Information from Current Businesses Results of Items Results of Operations Operations Excluded from Operations Communications and Under Current from Current Support Intercompany GAAP Businesses Businesses Wireless Wireline Services Eliminations Revenues and sales: Service revenues $ 1,806,026 $ - $ 1,806,026 $ 1,128,024 $ 605,665 $ 105,910 $ (33,573) Product sales 207,650 - 207,650 63,908 10,119 141,229 (7,606) Total revenues and sales 2,013,676 - 2,013,676 1,191,932 615,784 247,139 (41,179) Costs and expenses: Cost of services 567,946 - 567,946 350,603 173,751 74,876 (31,284) Cost of products sold 262,058 - 262,058 131,243 7,495 131,568 (8,248) Selling, general, administrative and other 388,290 - 388,290 303,033 65,644 13,896 5,717 Depreciation and amortization 321,330 - 321,330 175,446 132,064 9,176 4,644 Integration expenses, restructuring and other charges - - - - - - - Total costs and expenses 1,539,624 - 1,539,624 960,325 378,954 229,516 (29,171) Operating income 474,052 - 474,052 $ 231,607 $ 236,830 $ 17,623 $ (12,008) Equity earnings in unconsolidated partnerships 16,401 - 16,401 Minority interest in consolidated partnerships (17,093) - (17,093) Other income (expense), net 3,596 - 3,596 Interest expense (90,881) - (90,881) Gain (loss) on disposal of assets, write-down of investments and other 30,999 (30,999) (C) - Income from continuing operations before income taxes 417,074 (30,999) 386,075 Income taxes 158,139 (12,058) (P) 146,081 Income from continuing operations 258,935 (18,941) 239,994 Discontinued operations: Income from discontinued operations (net of income taxes) - - - Gain on sale of discontinued operations (net of income taxes) - - - Income before cumulative effect of accounting change 258,935 (18,941) 239,994 Cumulative effect of accounting change (net of income taxes) - - - Net income 258,935 (18,941) 239,994 Preferred dividends 27 - 27 Net income applicable to common shares $ 258,908 $ (18,941) $ 239,967 Basic earnings per share: Income from continuing operations $.83 $(.06) $.77 Income from discontinued operations - - - Cumulative effect of accounting change - - - Net income $.83 $(.06) $.77 Diluted earnings per share: Income from continuing operations $.83 $(.06) $.77 Income from discontinued operations - - - Cumulative effect of accounting change - - - Net income $.83 $(.06) $.77 See Notes to Reconcilations for a description of the items marked (A)-(S).
- 8. ALLTEL CORPORATION RECONCILIATION OF RESULTS OF OPERATIONS UNDER GAAP TO RESULTS OF OPERATIONS FROM CURRENT BUSINESSES (NON-GAAP) for the three months ended September 30, 2003 (In thousands, except per share amounts) Corporate Results of Items Results of Operations Segment Information from Current Businesses Operations Excluded from Operations Communications and Under Current from Current Support Intercompany GAAP Businesses Businesses Wireless Wireline Services Eliminations Revenues and sales: Service revenues $ 1,836,059 $ - $ 1,836,059 $ 1,163,786 $ 595,319 $ 108,808 $ (31,854) Product sales 214,125 - 214,125 69,446 9,876 135,155 (352) Total revenues and sales 2,050,184 - 2,050,184 1,233,232 605,195 243,963 (32,206) Costs and expenses: Cost of services 602,609 - 602,609 361,107 195,747 76,820 (31,065) Cost of products sold 272,344 - 272,344 141,712 7,375 123,596 (339) Selling, general, administrative and other 376,285 - 376,285 292,999 63,410 14,361 5,515 Depreciation and amortization 312,183 - 312,183 168,999 131,234 8,843 3,107 Integration expenses, restructuring and other charges - - - - - - - Total costs and expenses 1,563,421 - 1,563,421 964,817 397,766 223,620 (22,782) Operating income 486,763 - 486,763 $ 268,415 $ 207,429 $ 20,343 $ (9,424) Equity earnings in unconsolidated partnerships 13,778 - 13,778 Minority interest in consolidated partnerships (22,287) - (22,287) Other income (expense), net 3,391 - 3,391 Interest expense (91,164) - (91,164) Gain (loss) on disposal of assets, write-down of investments and other - - - Income from continuing operations before income taxes 390,481 - 390,481 Income taxes 147,718 - 147,718 Income from continuing operations 242,763 - 242,763 Discontinued operations: Income from discontinued operations (net of income taxes) - - - Gain on sale of discontinued operations (net of income taxes) - - - Income before cumulative effect of accounting change 242,763 - 242,763 Cumulative effect of accounting change (net of income taxes) - - - Net income 242,763 - 242,763 Preferred dividends 28 - 28 Net income applicable to common shares $ 242,735 $ - $ 242,735 Basic earnings per share: Income from continuing operations $- $.78 $.78 Income from discontinued operations - - - Cumulative effect of accounting change - - - Net income $- $.78 $.78 Diluted earnings per share: Income from continuing operations $- $.78 $.78 Income from discontinued operations - - - Cumulative effect of accounting change - - - Net income $- $.78 $.78 See Notes to Reconcilations for a description of the items marked (A)-(S).
- 9. ALLTEL CORPORATION RECONCILIATION OF RESULTS OF OPERATIONS UNDER GAAP TO RESULTS OF OPERATIONS FROM CURRENT BUSINESSES (NON-GAAP) for the three months ended June 30, 2003 (In thousands, except per share amounts) Corporate Results of Items Results of Operations Segment Information from Current Businesses Operations Excluded from Operations Communications and Under Current from Current Support Intercompany GAAP Businesses Businesses Wireless Wireline Services Eliminations Revenues and sales: Service revenues $ 1,797,520 $ - $ 1,797,520 $ 1,127,642 $ 597,109 $ 106,708 $ (33,939) Product sales 212,732 - 212,732 67,774 9,135 136,127 (304) Total revenues and sales 2,010,252 - 2,010,252 1,195,416 606,244 242,835 (34,243) Costs and expenses: Cost of services 565,612 565,612 339,730 185,580 73,458 (33,156) - Cost of products sold 271,354 271,354 141,246 6,319 124,088 (299) - Selling, general, administrative and other 372,458 372,458 287,085 64,143 15,682 5,548 - Depreciation and amortization 310,712 310,712 165,364 133,376 8,806 3,166 - Integration expenses, restructuring and other charges 18,979 (18,979) (D) - - - - - Total costs and expenses 1,539,115 (18,979) 1,520,136 933,425 389,418 222,034 (24,741) Operating income 471,137 18,979 490,116 $ 261,991 $ 216,826 $ 20,801 $ (9,502) Equity earnings in unconsolidated partnerships 16,689 16,689 - Minority interest in consolidated partnerships (21,390) (21,390) - Other income (expense), net 3,634 3,634 - Interest expense (93,210) (93,210) - Gain (loss) on disposal of assets, write-down of investments and other (13,066) 13,066 (E) - Income from continuing operations before income taxes 363,794 32,045 395,839 Income taxes 139,585 12,238 (P) 151,823 Income from continuing operations 224,209 19,807 244,016 Discontinued operations: Income from discontinued operations (net of income taxes) - - - Gain on sale of discontinued operations (net of income taxes) 323,927 (323,927) (R) - Income before cumulative effect of accounting change 548,136 (304,120) 244,016 Cumulative effect of accounting change (net of income taxes) - - - Net income 548,136 (304,120) 244,016 Preferred dividends 28 28 - Net income applicable to common shares $ 548,108 $ (304,120) $ 243,988 Basic earnings per share: Income from continuing operations $ .72 $ .06 $.78 Income from discontinued operations 1.04 (1.04) - Cumulative effect of accounting change - - - Net income $1.76 $ (.98) $.78 Diluted earnings per share: Income from continuing operations $ .72 $ .06 $.78 Income from discontinued operations 1.03 (1.03) - Cumulative effect of accounting change - - - Net income $1.75 $ (.97) $.78 See Notes to Reconcilations for a description of the items marked (A)-(S).
- 10. ALLTEL CORPORATION RECONCILIATION OF RESULTS OF OPERATIONS UNDER GAAP TO RESULTS OF OPERATIONS FROM CURRENT BUSINESSES (NON-GAAP) for the three months ended March 31, 2003 (In thousands, except per share amounts) Corporate Results of Items Results of Operations Segment Information from Current Businesses Operations Excluded from Operations Communications and Under Current from Current Support Intercompany GAAP Businesses Businesses Wireless Wireline Services Eliminations Revenues and sales: Service revenues $ 1,716,462 $ - $ 1,716,462 $ 1,047,010 $ 597,532 $ 107,557 $ (35,637) Product sales 189,336 - 189,336 60,809 11,324 117,567 (364) Total revenues and sales 1,905,798 - 1,905,798 1,107,819 608,856 225,124 (36,001) Costs and expenses: Cost of services 537,431 537,431 316,372 182,083 73,852 (34,876) - Cost of products sold 237,712 237,712 122,447 7,942 107,684 (361) - Selling, general, administrative and other 361,089 361,089 271,844 66,209 16,572 6,464 - Depreciation and amortization 303,523 303,523 161,169 129,834 9,366 3,154 - Integration expenses, restructuring and other charges - - - - - - - Total costs and expenses 1,439,755 - 1,439,755 871,832 386,068 207,474 (25,619) Operating income 466,043 - 466,043 $ 235,987 $ 222,788 $ 17,650 $ (10,382) Equity earnings in unconsolidated partnerships 17,505 17,505 - Minority interest in consolidated partnerships (17,834) (17,834) - Other income (expense), net 447 447 - Interest expense (103,372) (103,372) - Gain (loss) on disposal of assets, write-down of investments and other - - - Income from continuing operations before income taxes 362,789 - 362,789 Income taxes 135,167 - 135,167 Income from continuing operations 227,622 - 227,622 Discontinued operations: Income from discontinued operations (net of income taxes) 37,072 (37,072) (R) - Gain on sale of discontinued operations (net of income taxes) - - - Income before cumulative effect of accounting change 264,694 (37,072) 227,622 Cumulative effect of accounting change (net of income taxes) 15,591 (15,591) (S) - Net income 280,285 (52,663) 227,622 Preferred dividends 28 28 - Net income applicable to common shares $ 280,257 $ (52,663) $ 227,594 Basic earnings per share: Income from continuing operations $.73 $- $.73 Income from discontinued operations .12 (.12) - Cumulative effect of accounting change .05 (.05) - Net income $.90 $(.17) $.73 Diluted earnings per share: Income from continuing operations $.73 $- $.73 Income from discontinued operations .12 (.12) - Cumulative effect of accounting change .05 (.05) - Net income $.90 $(.17) $.73 See Notes to Reconcilations for a description of the items marked (A)-(S).
- 11. ALLTEL CORPORATION RECONCILIATION OF RESULTS OF OPERATIONS UNDER GAAP TO RESULTS OF OPERATIONS FROM CURRENT BUSINESSES (NON-GAAP) for the twelve months ended December 31, 2002 (In thousands, except per share amounts) Corporate Results of Items Results of Operations Segment Information from Current Businesses Operations Excluded from Operations Communications and Under Current from Current Support Intercompany GAAP Businesses Businesses Wireless Wireline Services Eliminations Revenues and sales: Service revenues $ 6,428,942 $ - $ 6,428,942 $ 3,999,206 $ 2,145,315 $ 434,465 $ (150,044) Product sales 683,444 - 683,444 160,998 34,446 491,209 (3,209) Total revenues and sales 7,112,386 - 7,112,386 4,160,204 2,179,761 925,674 (153,253) Costs and expenses: Cost of services 2,039,014 (14,000) (L) 2,025,014 1,243,068 634,166 295,299 (147,519) Cost of products sold 891,306 - 891,306 430,550 24,843 439,219 (3,306) Selling, general, administrative and other 1,297,034 - 1,297,034 957,983 251,214 69,280 18,557 Depreciation and amortization 1,095,469 - 1,095,469 577,652 465,599 37,750 14,468 Integration expenses, restructuring and other charges 69,883 (69,883) (F,J,M,O) - - - - - Total costs and expenses 5,392,706 (83,883) 5,308,823 3,209,253 1,375,822 841,548 (117,800) Operating income 1,719,680 83,883 1,803,563 $ 950,951 $ 803,939 $ 84,126 $ (35,453) Equity earnings in unconsolidated partnerships 65,776 - 65,776 Minority interest in consolidated partnerships (73,339) - (73,339) Other income (expense), net 2,350 (8,200) (H) (5,850) Interest expense (355,129) 34,959 (I) (320,170) Gain (loss) on disposal of assets, write-down of investments and other 985 (985) (G,K,N) - Income from continuing operations before income taxes 1,360,323 109,657 1,469,980 Income taxes 510,163 42,861 (P) 553,024 Income from continuing operations 850,160 66,796 916,956 Discontinued operations: Income from discontinued operations (net of income taxes) 74,150 (74,150) (R) - Gain on sale of discontinued operations (net of income taxes) - - - Income before cumulative effect of accounting change 924,310 (7,354) 916,956 Cumulative effect of accounting change (net of income taxes) - - - Net income 924,310 (7,354) 916,956 Preferred dividends 125 - 125 Net income applicable to common shares $ 924,185 $ (7,354) $ 916,831 Basic earnings per share: Income from continuing operations $2.73 $ .22 $2.95 Income from discontinued operations .24 (.24) - Cumulative effect of accounting change - - - Net income $2.97 $(.02) $2.95 Diluted earnings per share: Income from continuing operations $2.72 $ .22 $2.94 Income from discontinued operations .24 (.24) - Cumulative effect of accounting change - - - Net income $2.96 $(.02) $2.94 See Notes to Reconcilations for a description of the items marked (A)-(S).
- 12. ALLTEL CORPORATION RECONCILIATION OF RESULTS OF OPERATIONS UNDER GAAP TO RESULTS OF OPERATIONS FROM CURRENT BUSINESSES (NON-GAAP) for the three months ended December 31, 2002 (In thousands, except per share amounts) Corporate Results of Items Results of Operations Segment Information from Current Businesses Operations Excluded from Operations Communications and Under Current from Current Support Intercompany GAAP Businesses Businesses Wireless Wireline Services Eliminations Revenues and sales: Service revenues $ 1,734,481 $ - $ 1,734,481 $ 1,065,747 $ 598,107 $ 109,224 $ (38,597) Product sales 188,294 - 188,294 53,635 9,708 125,694 (743) Total revenues and sales 1,922,775 - 1,922,775 1,119,382 607,815 234,918 (39,340) Costs and expenses: Cost of services 538,620 538,620 329,004 175,511 72,419 (38,314) - Cost of products sold 233,905 233,905 114,672 7,404 112,577 (748) - Selling, general, administrative and other 363,616 363,616 269,728 69,366 18,451 6,071 - Depreciation and amortization 304,298 304,298 159,483 131,798 9,639 3,378 - Integration expenses, restructuring and other charges (2,526) 2,526 (F) - - - - - Total costs and expenses 1,437,913 2,526 1,440,439 872,887 384,079 213,086 (29,613) Operating income 484,862 (2,526) 482,336 $ 246,495 $ 223,736 $ 21,832 $ (9,727) Equity earnings in unconsolidated partnerships 23,260 23,260 - Minority interest in consolidated partnerships (18,610) (18,610) - Other income (expense), net (3,581) (3,581) - Interest expense (109,220) (109,220) - Gain (loss) on disposal of assets, write-down of investments and other 19,516 (19,516) (G) - Income from continuing operations before income taxes 396,227 (22,042) 374,185 Income taxes 150,832 (8,549) (P) 142,283 Income from continuing operations 245,395 (13,493) 231,902 Discontinued operations: Income from discontinued operations (net of income taxes) 11,178 (11,178) (R) - Gain on sale of discontinued operations (net of income taxes) - - - Income before cumulative effect of accounting change 256,573 (24,671) 231,902 Cumulative effect of accounting change (net of income taxes) - - - Net income 256,573 (24,671) 231,902 Preferred dividends 29 29 - Net income applicable to common shares $ 256,544 $ (24,671) $ 231,873 Basic earnings per share: Income from continuing operations $.79 $(.04) $.75 Income from discontinued operations .03 (.03) - Cumulative effect of accounting change - - - Net income $.82 $(.07) $.75 Diluted earnings per share: Income from continuing operations $.79 $(.05) $.74 Income from discontinued operations .03 (.03) - Cumulative effect of accounting change - - - Net income $.82 $(.08) $.74 See Notes to Reconcilations for a description of the items marked (A)-(S).
- 13. ALLTEL CORPORATION RECONCILIATION OF RESULTS OF OPERATIONS UNDER GAAP TO RESULTS OF OPERATIONS FROM CURRENT BUSINESSES (NON-GAAP) for the three months ended September 30, 2002 (In thousands, except per share amounts) Corporate Results of Items Results of Operations Segment Information from Current Businesses Operations Excluded from Operations Communications and Under Current from Current Support Intercompany GAAP Businesses Businesses Wireless Wireline Services Eliminations Revenues and sales: Service revenues $ 1,691,248 $ - $ 1,691,248 $ 1,053,170 $ 566,536 $ 111,672 $ (40,130) Product sales 176,438 - 176,438 40,798 9,152 127,324 (836) Total revenues and sales 1,867,686 - 1,867,686 1,093,968 575,688 238,996 (40,966) Costs and expenses: Cost of services 541,402 541,402 335,667 171,224 73,893 (39,382) - Cost of products sold 224,305 224,305 102,499 6,458 116,237 (889) - Selling, general, administrative and other 336,633 336,633 249,578 65,855 16,769 4,431 - Depreciation and amortization 285,908 285,908 149,388 123,389 9,622 3,509 - Integration expenses, restructuring and other charges 20,539 (20,539) (J) - - - - - Total costs and expenses 1,408,787 (20,539) 1,388,248 837,132 366,926 216,521 (32,331) Operating income 458,899 20,539 479,438 $ 256,836 $ 208,762 $ 22,475 $ (8,635) Equity earnings in unconsolidated partnerships 20,131 20,131 - Minority interest in consolidated partnerships (21,027) (21,027) - Other income (expense), net (842) (4,751) (3,909) (H) Interest expense (107,529) (90,383) 17,146 (I) Gain (loss) on disposal of assets, write-down of investments and other (4,792) 4,792 (K) - Income from continuing operations before income taxes 344,840 38,568 383,408 Income taxes 127,024 15,165 (P) 142,189 Income from continuing operations 217,816 23,403 241,219 Discontinued operations: Income from discontinued operations (net of income taxes) 19,947 (19,947) (R) - Gain on sale of discontinued operations (net of income taxes) - - - Income before cumulative effect of accounting change 237,763 3,456 241,219 Cumulative effect of accounting change (net of income taxes) - - - Net income 237,763 3,456 241,219 Preferred dividends 31 31 - Net income applicable to common shares $ 237,732 $ 3,456 $ 241,188 Basic earnings per share: Income from continuing operations $.70 $ .08 $.78 Income from discontinued operations .06 (.06) - Cumulative effect of accounting change - - - Net income $.76 $ .02 $.78 Diluted earnings per share: Income from continuing operations $.70 $ .07 $.77 Income from discontinued operations .06 (.06) - Cumulative effect of accounting change - - - Net income $.76 $ .01 $.77 See Notes to Reconcilations for a description of the items marked (A)-(S).
- 14. ALLTEL CORPORATION RECONCILIATION OF RESULTS OF OPERATIONS UNDER GAAP TO RESULTS OF OPERATIONS FROM CURRENT BUSINESSES (NON-GAAP) for the three months ended June 30, 2002 (In thousands, except per share amounts) Corporate Results of Items Results of Operations Segment Information from Current Businesses Operations Excluded from Operations Communications and Under Current from Current Support Intercompany GAAP Businesses Businesses Wireless Wireline Services Eliminations Revenues and sales: Service revenues $ 1,524,322 $ - $ 1,524,322 $ 965,543 $ 489,265 $ 109,625 $ (40,111) Product sales 174,715 - 174,715 37,182 7,941 130,277 (685) Total revenues and sales 1,699,037 - 1,699,037 1,002,725 497,206 239,902 (40,796) Costs and expenses: Cost of services 499,426 (14,000) (L) 485,426 302,293 146,146 76,385 (39,398) Cost of products sold 224,360 224,360 103,624 5,695 115,717 (676) - Selling, general, administrative and other 310,425 310,425 231,851 56,906 17,342 4,326 - Depreciation and amortization 257,766 257,766 137,573 107,100 9,353 3,740 - Integration expenses, restructuring and other charges 9,022 (9,022) (M) - - - - - Total costs and expenses 1,300,999 (23,022) 1,277,977 775,341 315,847 218,797 (32,008) Operating income 398,038 23,022 421,060 $ 227,384 $ 181,359 $ 21,105 $ (8,788) Equity earnings in unconsolidated partnerships 13,741 13,741 - Minority interest in consolidated partnerships (18,677) (18,677) - Other income (expense), net 5,537 1,246 (4,291) (H) Interest expense (77,509) (59,696) 17,813 (I) Gain (loss) on disposal of assets, write-down of investments and other (13,739) 13,739 (N) - Income from continuing operations before income taxes 307,391 50,283 357,674 Income taxes 115,378 19,487 (P) 134,865 Income from continuing operations 192,013 30,796 222,809 Discontinued operations: Income from discontinued operations (net of income taxes) 24,155 (24,155) (R) - Gain on sale of discontinued operations (net of income taxes) - - - Income before cumulative effect of accounting change 216,168 6,641 222,809 Cumulative effect of accounting change (net of income taxes) - - - Net income 216,168 6,641 222,809 Preferred dividends 32 32 - Net income applicable to common shares $ 216,136 $ 6,641 $ 222,777 Basic earnings per share: Income from continuing operations $.62 $ .10 $.72 Income from discontinued operations .08 (.08) - Cumulative effect of accounting change - - - Net income $.70 $ .02 $.72 Diluted earnings per share: Income from continuing operations $.61 $ .10 $.71 Income from discontinued operations .08 (.08) - Cumulative effect of accounting change - - - Net income $.69 $ .02 $.71 See Notes to Reconcilations for a description of the items marked (A)-(S).