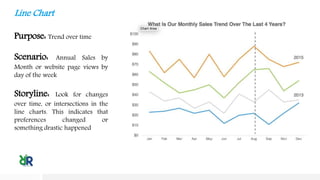
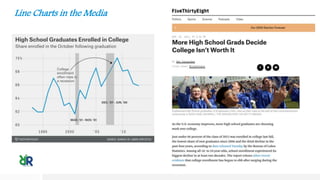
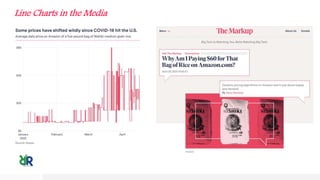
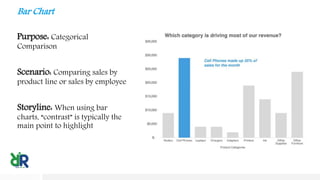
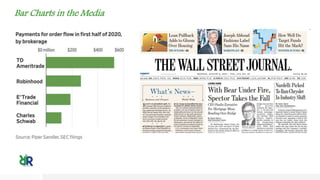
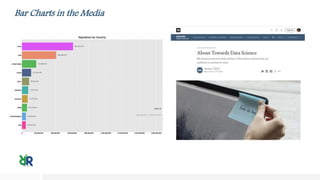
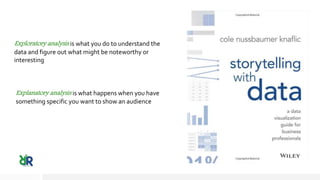
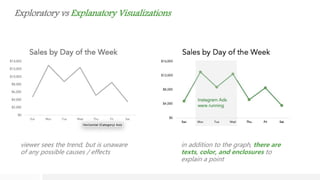
Line and Bar Chart Review
Presentation Agenda
Why Line Charts
Why Bar Charts
Line Charts in the Media
Bar Charts in the Media
Explanatory vs. Exploratory
Purpose: Trend over time
Scenario: Annual Sales by
Month or website page views by
day of the week
Storyline: Look for changes
over time, or intersections in the
line charts. This indicates that
preferences changed or
something drastic happened
Line Chart
Line Charts in the Media
Purpose: Categorical
Comparison
Scenario: Comparing sales by
product line or sales by employee
Storyline: When using bar
charts, “contrast” is typically the
main point to highlight
Bar Chart
Bar Charts in the Media
Exploratory analysis is what you do to understand the
data and figure out what might be noteworthy or
interesting
Explanatory analysis is what happens when you have
something specific you want to show an audience
$0
$2,000
$4,000
$6,000
$8,000
$10,000
$12,000
$14,000
Sun Mon Tue Wed Thu Fri Sat
Sales by Day of the Week
$0
$4,000
$8,000
$12,000
$16,000
Sun Mon Tue Wed Thu Fri Sat
Sales by Day of theWeek
InstagramAds
were running
Exploratory vs Explanatory Visualizations
viewer sees the trend, but is unaware
of any possible causes / effects
in addition to the graph, there are
texts, color, and enclosures to
explain a point

Understanding Line and Bar Charts

  • 1.
    Line and BarChart Review
  • 2.
    Presentation Agenda Why LineCharts Why Bar Charts Line Charts in the Media Bar Charts in the Media Explanatory vs. Exploratory
  • 3.
    Purpose: Trend overtime Scenario: Annual Sales by Month or website page views by day of the week Storyline: Look for changes over time, or intersections in the line charts. This indicates that preferences changed or something drastic happened Line Chart
  • 4.
    Line Charts inthe Media
  • 5.
    Line Charts inthe Media
  • 6.
    Purpose: Categorical Comparison Scenario: Comparingsales by product line or sales by employee Storyline: When using bar charts, “contrast” is typically the main point to highlight Bar Chart
  • 7.
    Bar Charts inthe Media
  • 8.
    Bar Charts inthe Media
  • 9.
    Exploratory analysis iswhat you do to understand the data and figure out what might be noteworthy or interesting Explanatory analysis is what happens when you have something specific you want to show an audience
  • 10.
    $0 $2,000 $4,000 $6,000 $8,000 $10,000 $12,000 $14,000 Sun Mon TueWed Thu Fri Sat Sales by Day of the Week $0 $4,000 $8,000 $12,000 $16,000 Sun Mon Tue Wed Thu Fri Sat Sales by Day of theWeek InstagramAds were running Exploratory vs Explanatory Visualizations viewer sees the trend, but is unaware of any possible causes / effects in addition to the graph, there are texts, color, and enclosures to explain a point