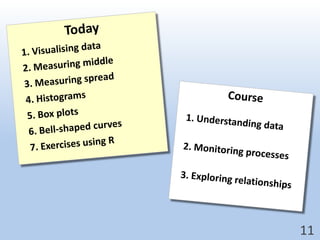
This document provides an overview of key concepts for understanding data, including:
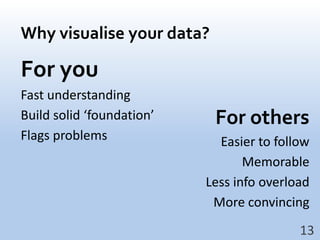
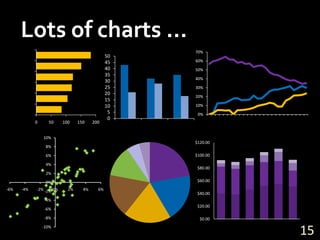
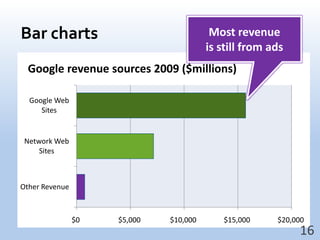
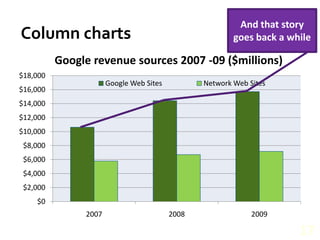
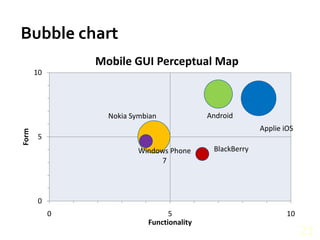
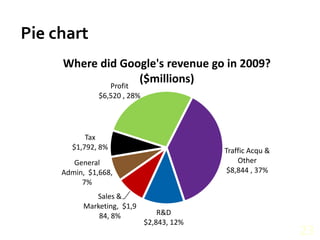
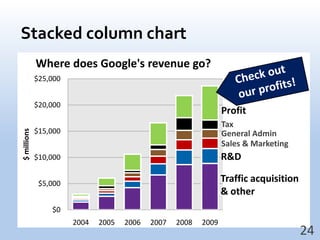
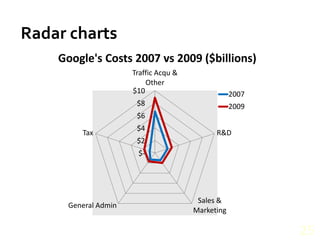
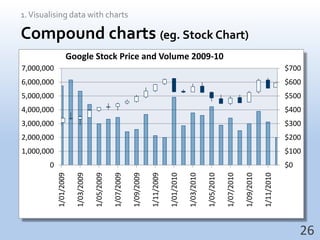
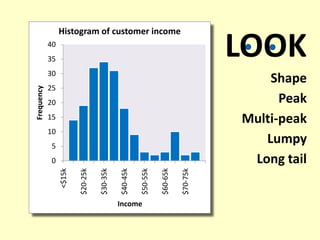
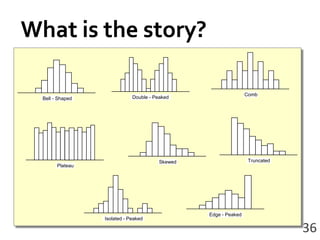
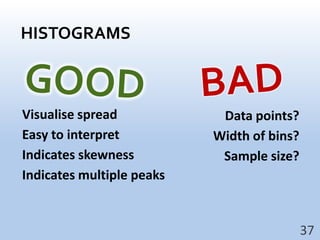
- Visualizing data through various chart types like bar charts, line charts, scatterplots, and histograms to build understanding and identify patterns.
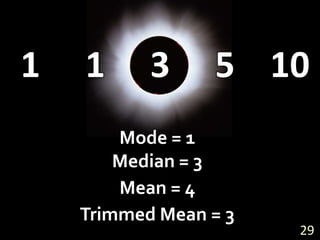
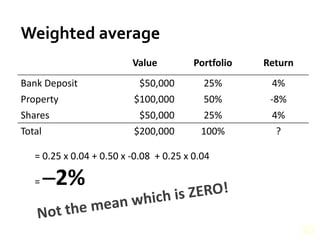
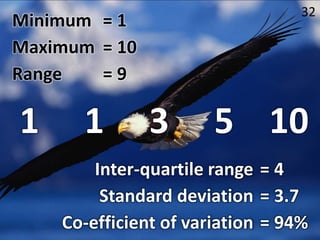
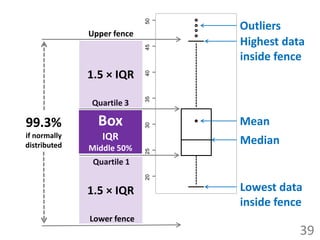
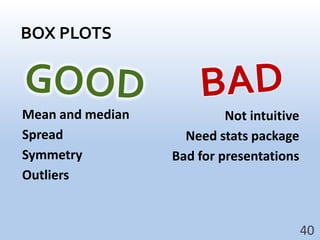
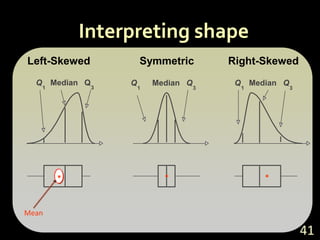
- Calculating and interpreting the mean, median, and spread of data using concepts like the interquartile range.
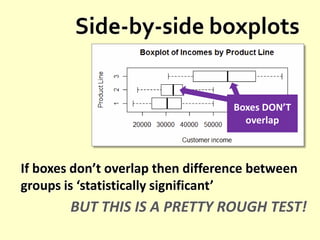
- Using histograms and box plots to visualize the distribution and spread of data.
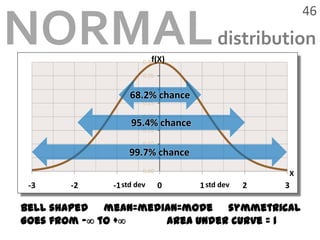
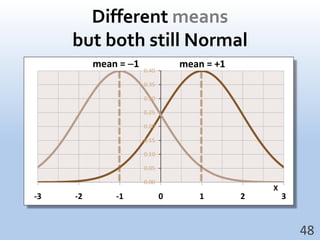
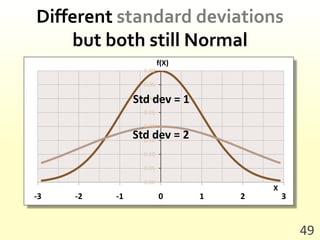
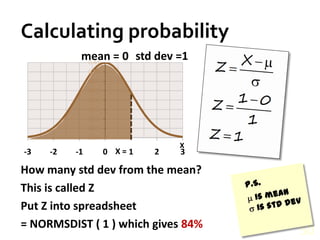
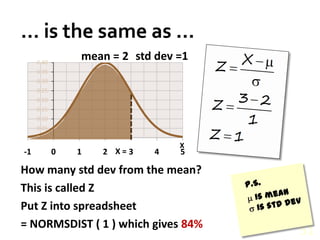
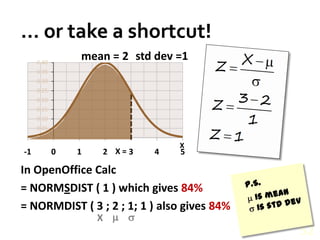
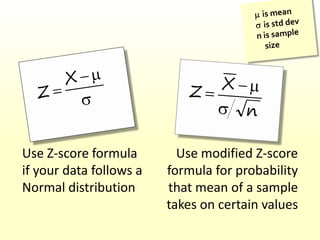
- The properties of the normal distribution and how to calculate probabilities based on the mean and standard deviation.
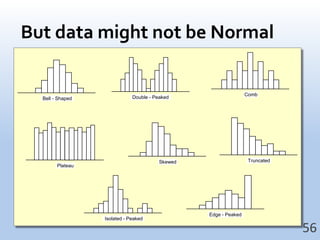
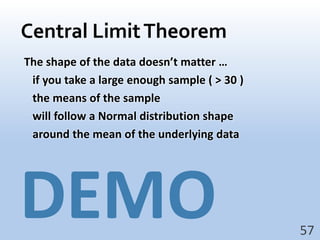
The document cautions that real-world data may not always conform to a normal distribution and introduces the central limit theorem. Exercises are provided in R to reinforce these concepts.