
Downloaded 177 times


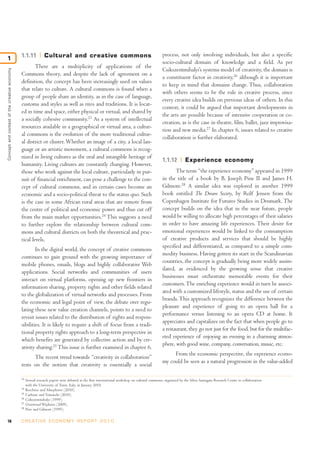
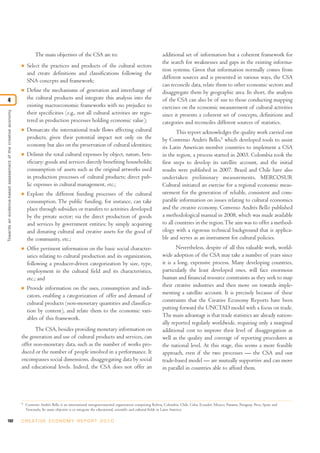
![growth of 6.7 per cent. The creation and production phas- American economy.59 In Canada, the cultural sector provid-
1
es represents 55 per cent of total cultural activities.54 ed 3.5 per cent of GDP and almost 6 per cent of the
growth in value added (GVA). In Australia, the growth in
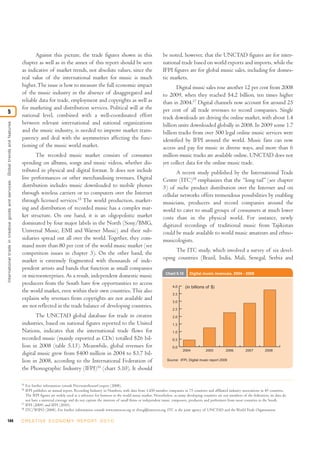
Concept and context of the creative economy
For Italy, as stated by the President of the Italian
Republic, “one of the strengths of our country [is] the cul- the creative economy has been strong for nearly two decades,
ture of creativity. And in this new expression of Italian cre- with an annual average growth of 5.8 per cent. In 2007-
ativity we find the resurgent vigour of a tradition, heritage 2008 the Australian creative economy was worth $31
and sensibility to which we must devote much more atten- billion (Australian dollars), making a real contribution to
tion”.55 The cultural and creative industries accounted for the nation’s economic performance and flexibility, employ-
over 9 per cent of the Italian GDP and employed over 2.5 ing about 5 per cent of the workforce, and generating about
million people in 2004.56 Denmark is another example 7 per cent of national earnings.60
where the creative economy accounted for 5.3 per cent of This chapter has been concerned primarily with the
GDP, providing 12 per cent of total jobs and 16 per cent of evolution of concepts involved in any consideration of the
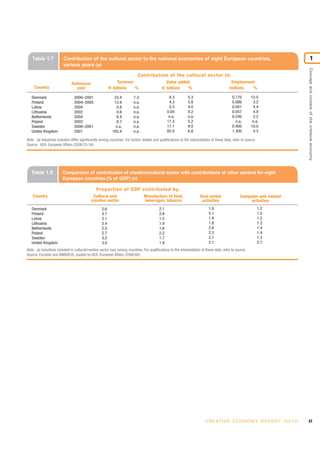
exports, and in Sweden, in the early 2000s the cultural sec- creative economy. This final section turns from concepts to
tor accounted for 9 per cent of value added and 10 per cent practice and considers some more detailed empirical evi-
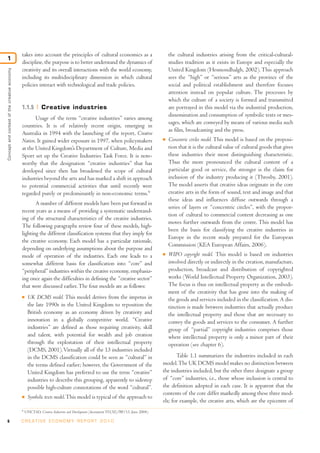
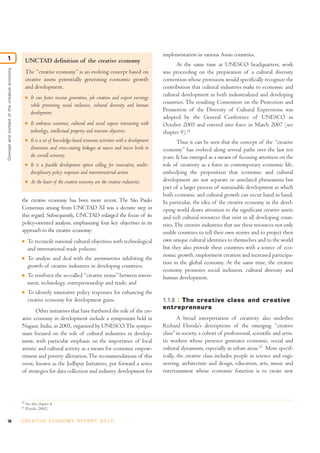
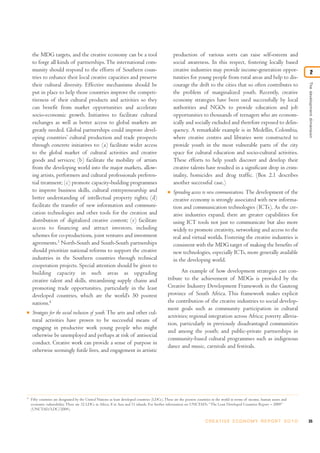
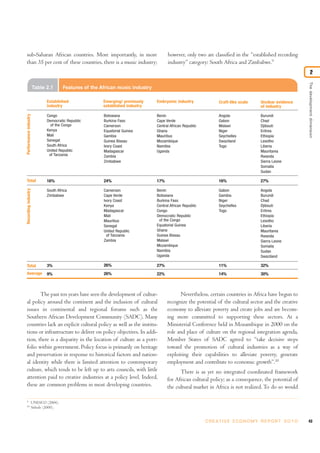
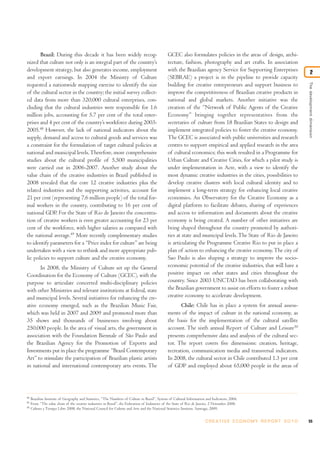
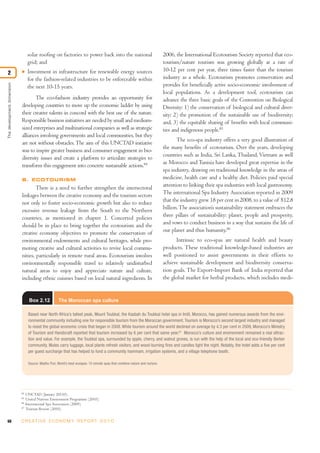
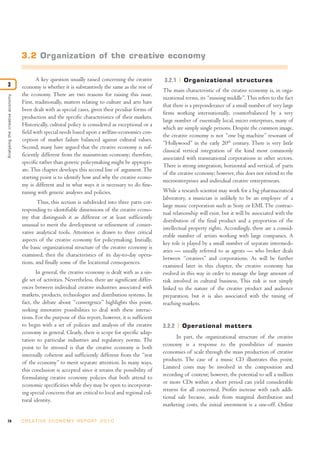
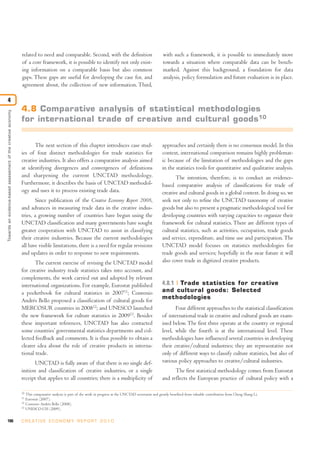
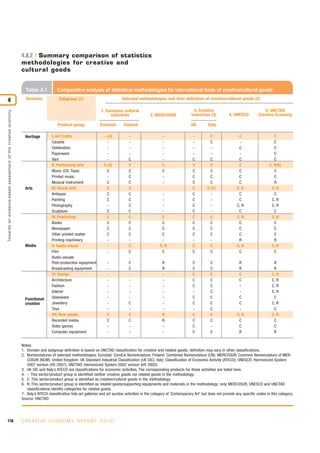
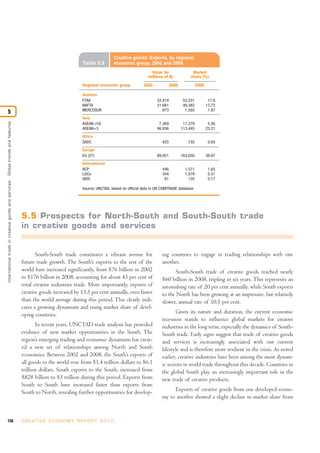
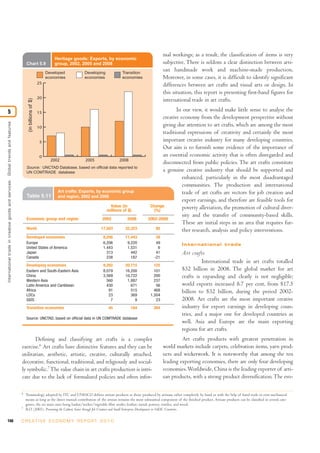
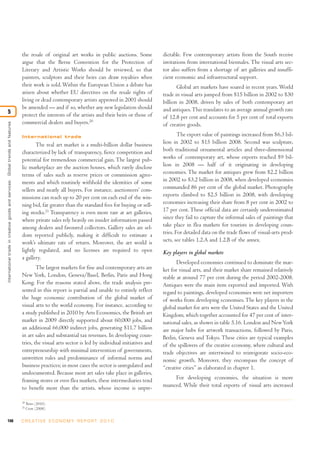
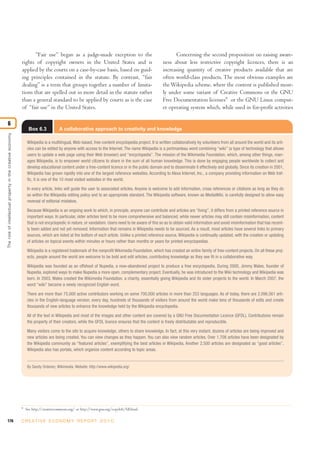
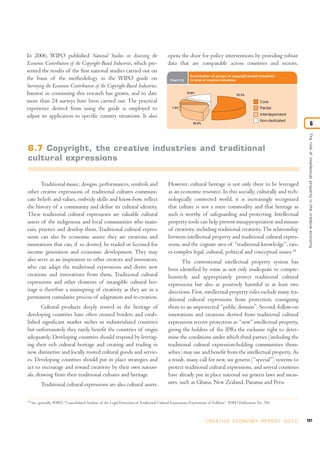
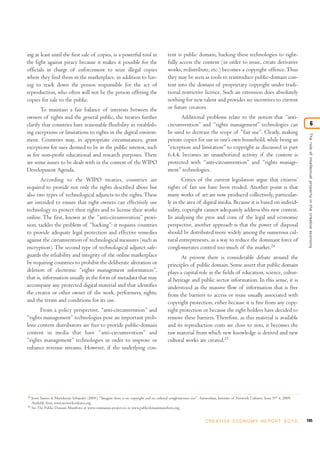
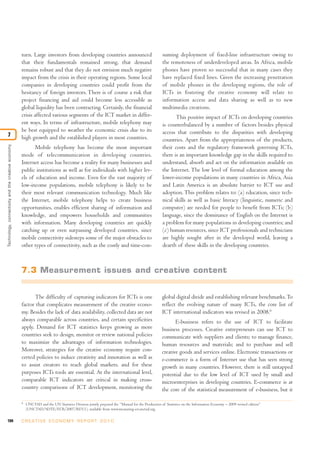
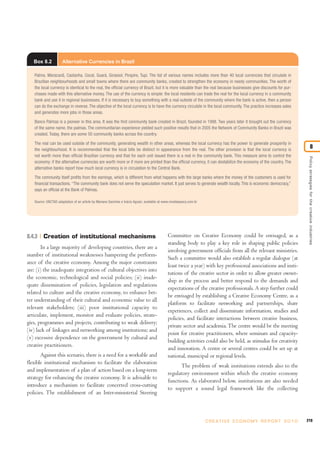
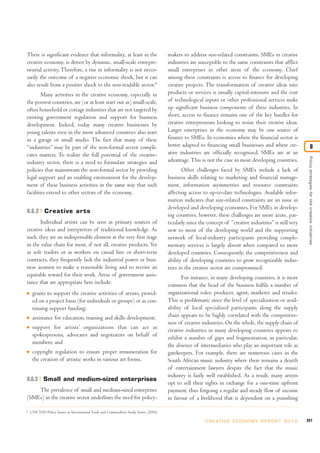
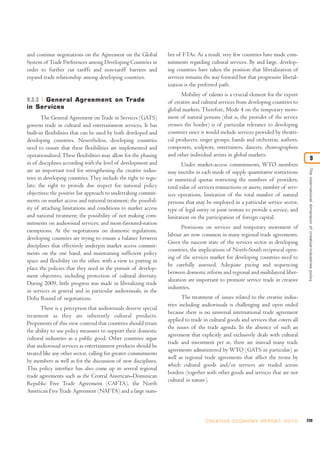
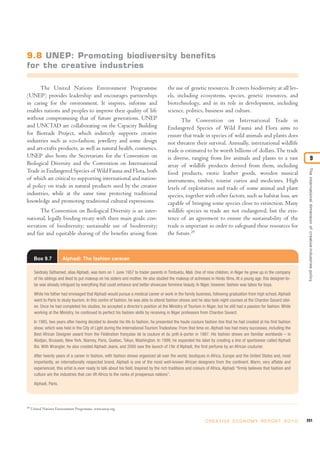
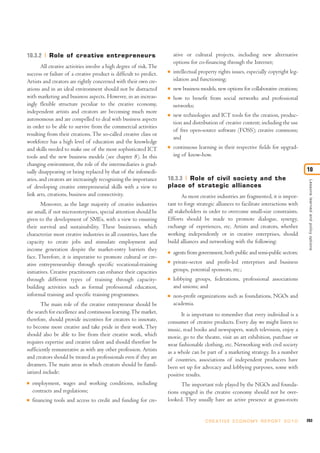
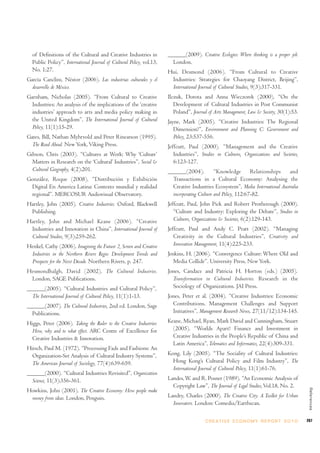
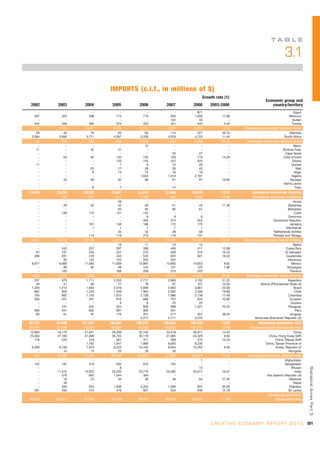
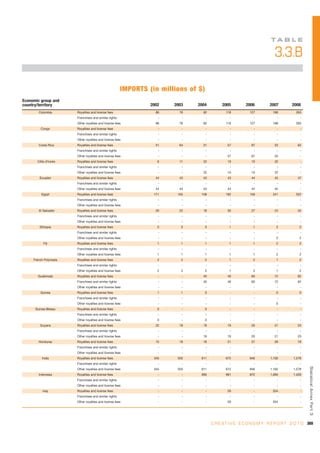
of total employment, as show in table 1.7.57 For the dence for some of the propositions discussed earlier.
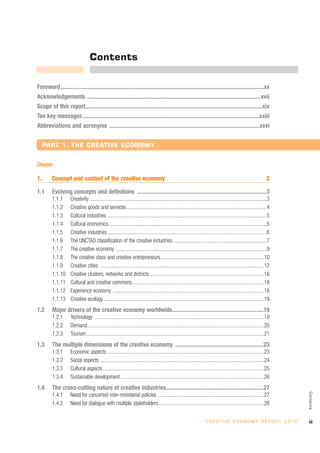
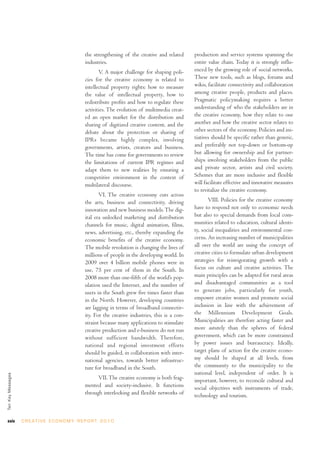
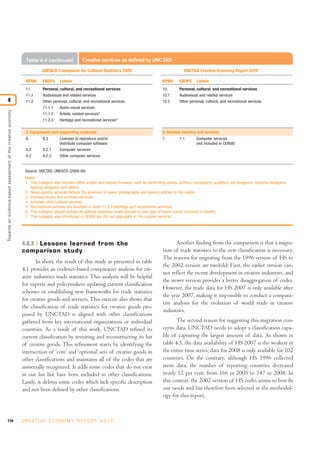
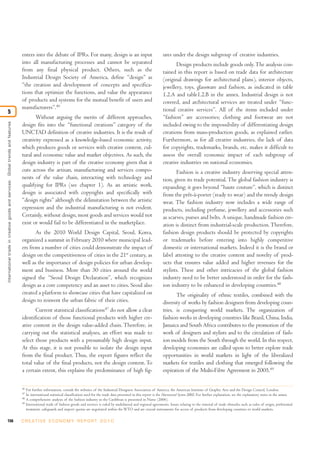
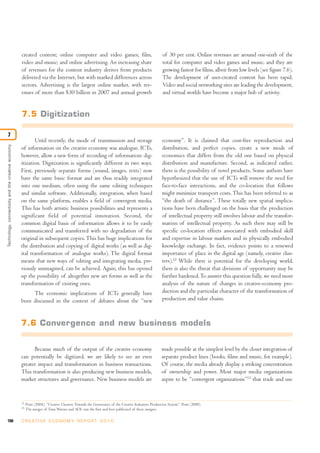
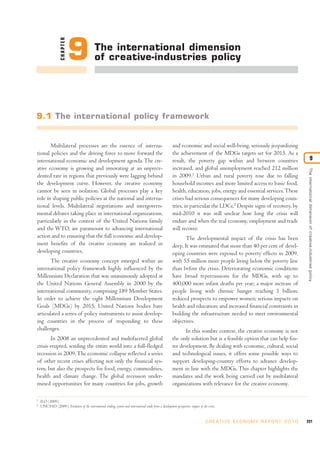
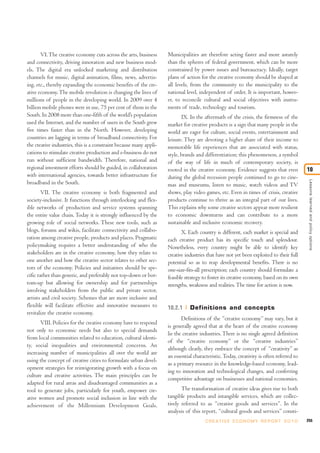
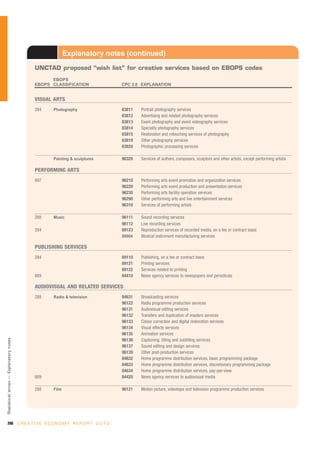
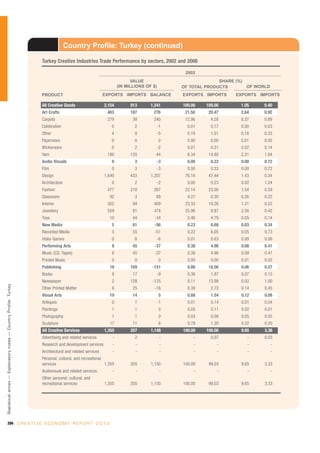
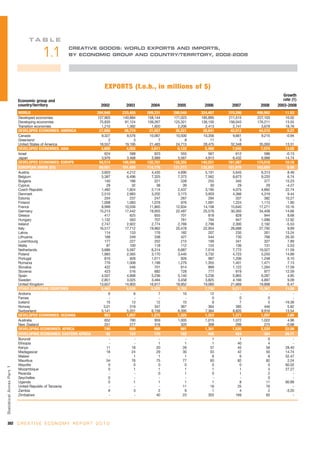
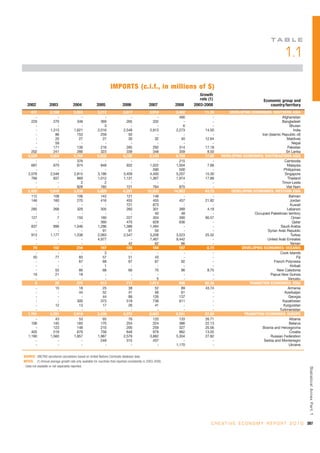
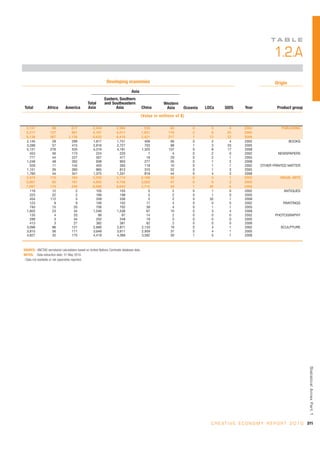
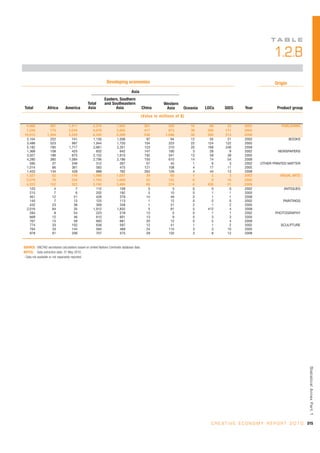
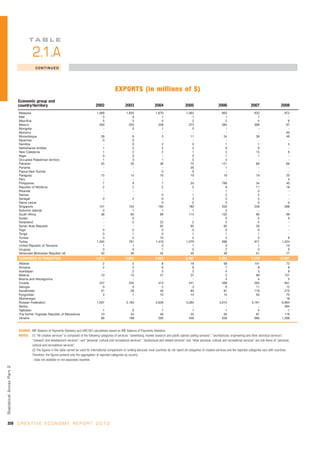
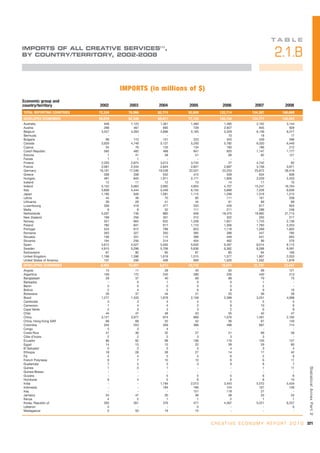
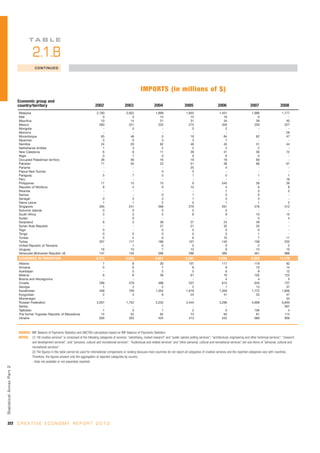
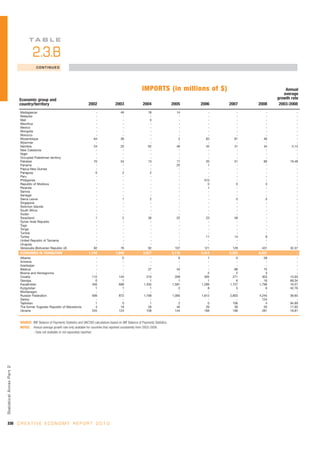
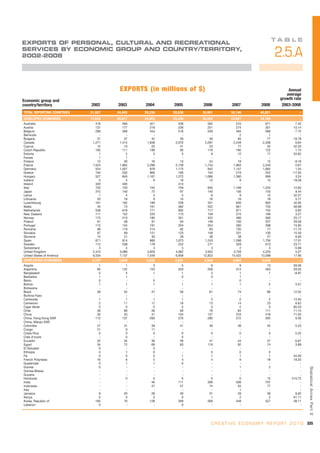
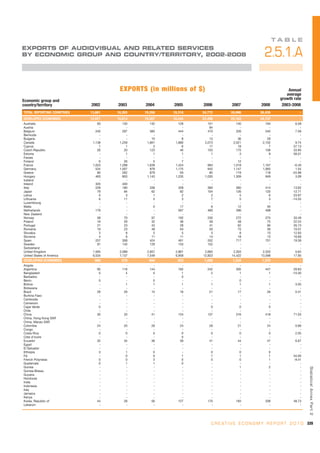
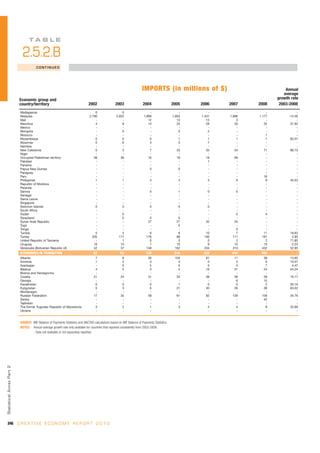
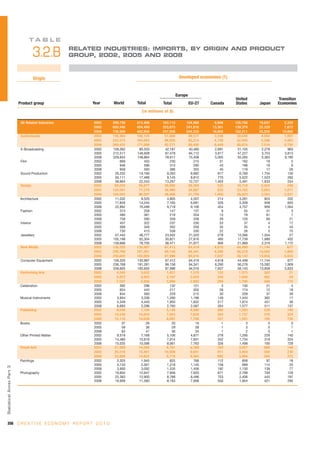
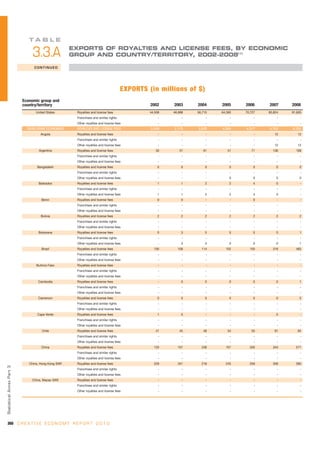
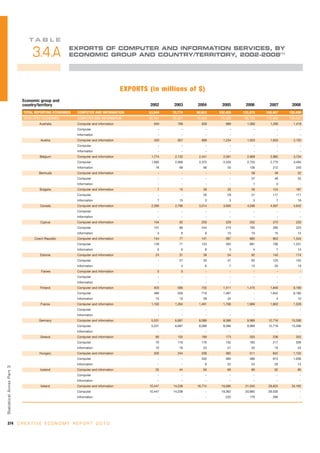
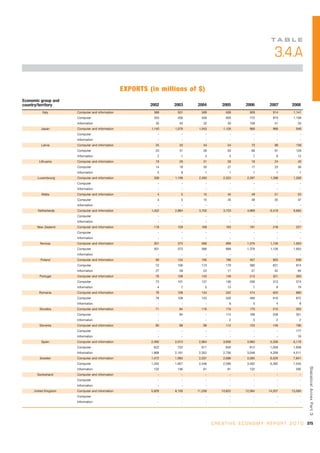
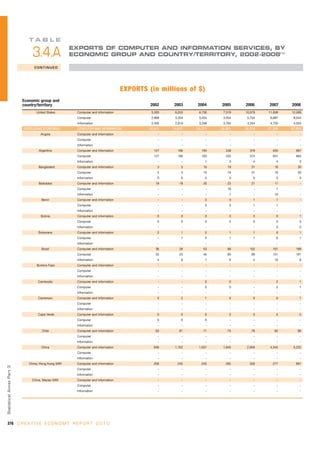
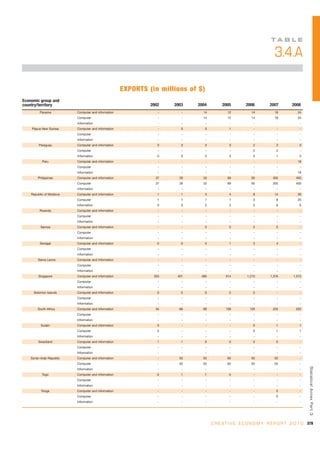
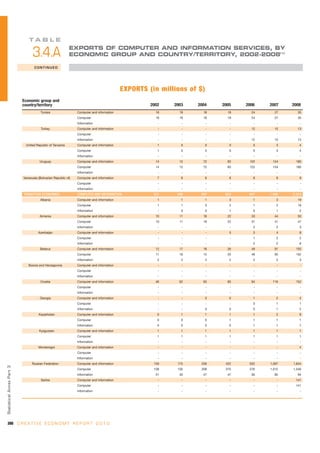
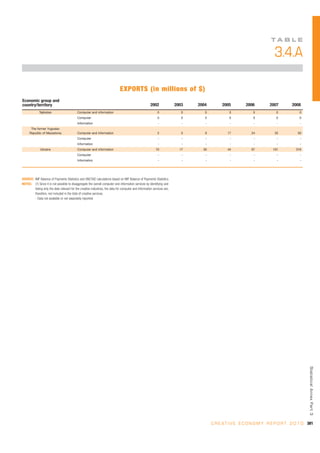
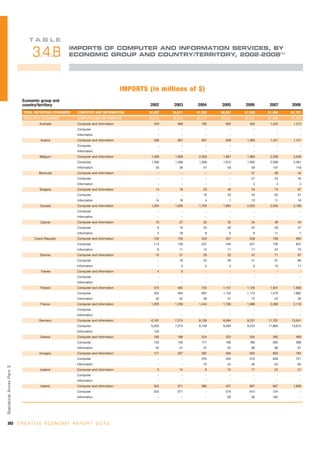
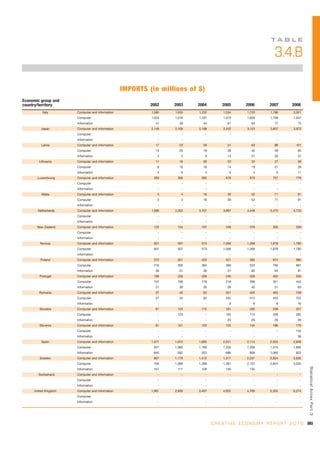
Netherlands, the creative sector is characterised by an Some representative data are shown in tables 1.6 to
increasing number of small enterprises and freelancers; in 1.8. Table 1.6 shows the contribution of the cultural indus-
the city of Amsterdam during the period 2006-2009, the tries to GDP or GVA for five countries in various years.
number of people working in the creative industries Table 1.7 indicates the contribution of the cultural sectors
increased 6.6 per cent.58 of eight European countries to the economy. It should be
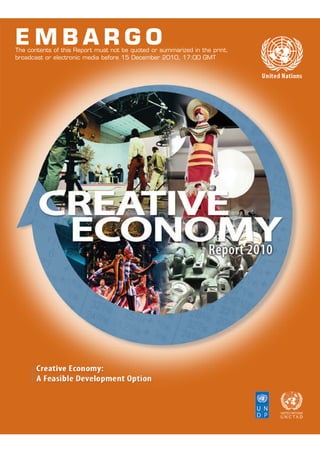
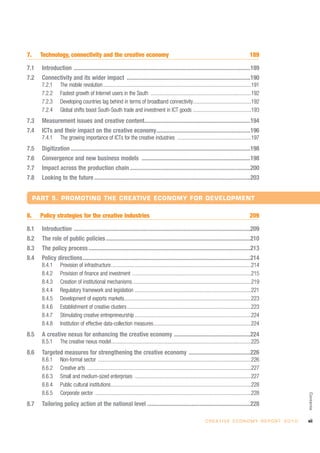
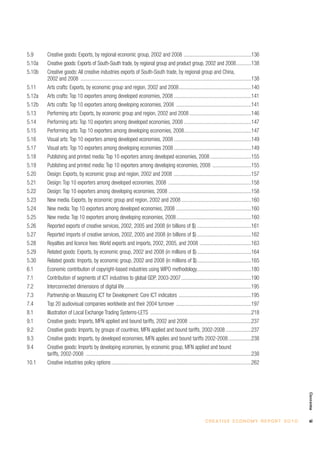
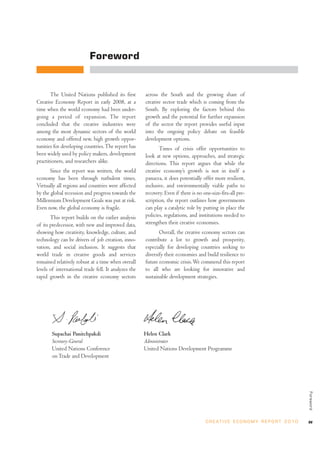
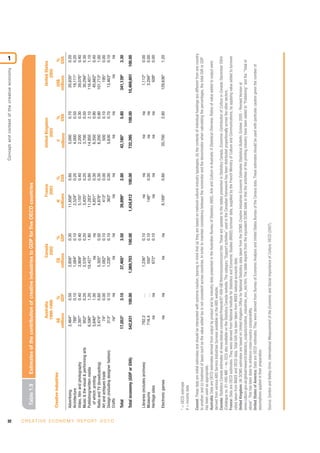
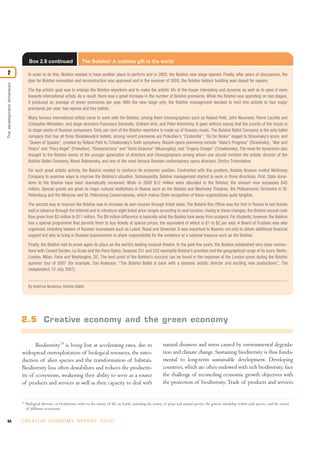
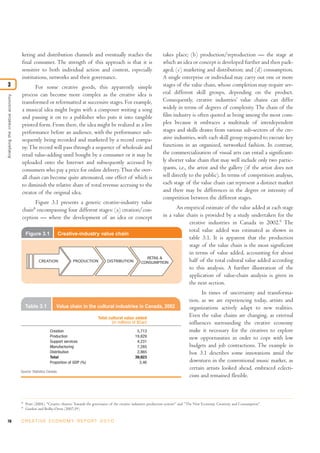
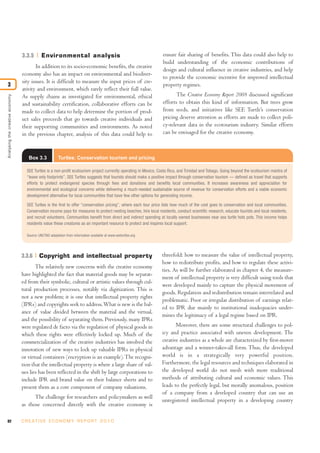
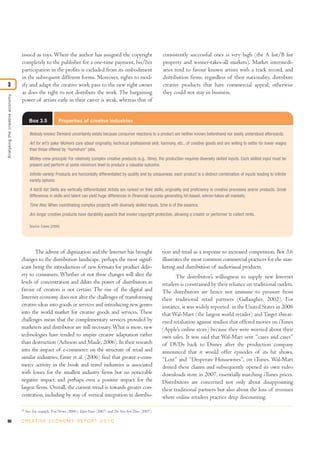
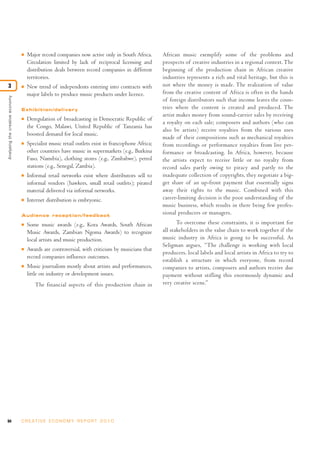
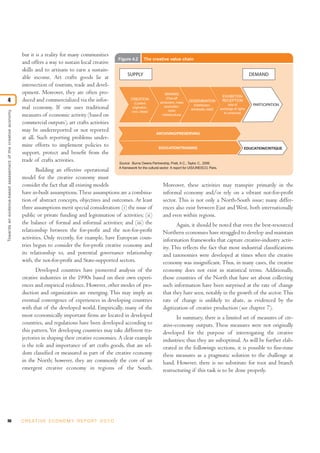
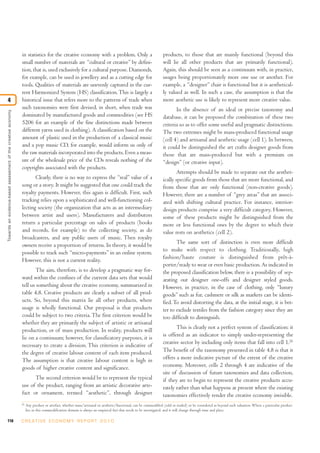
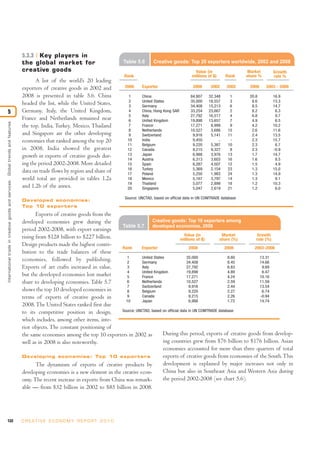
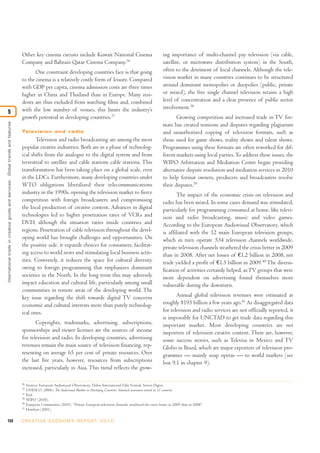
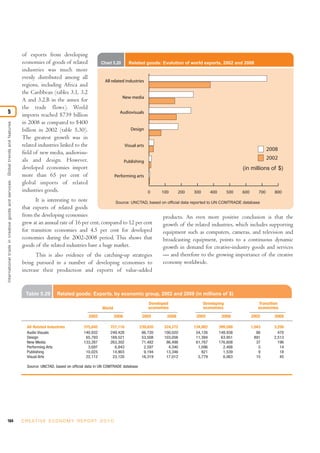
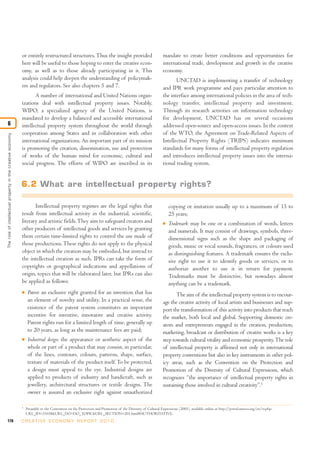
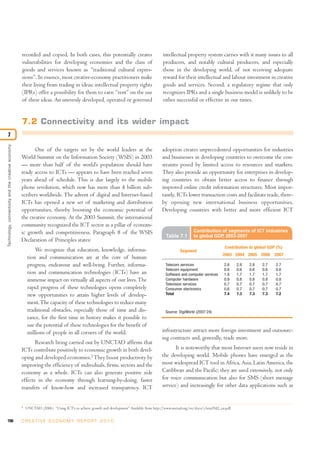
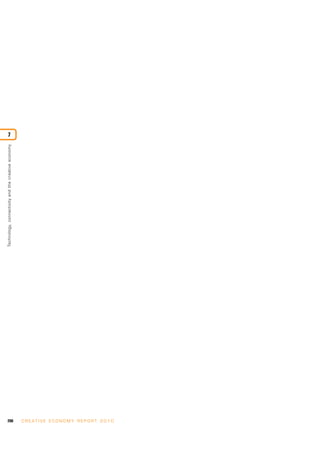
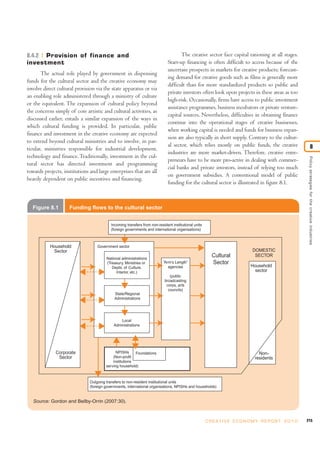
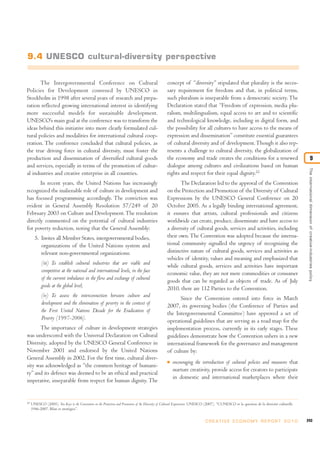
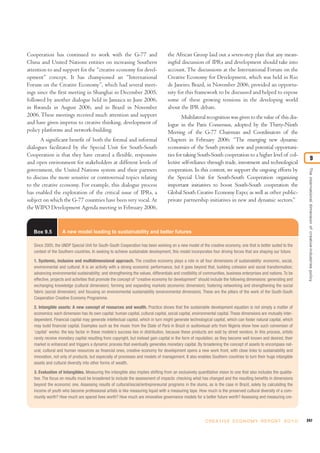
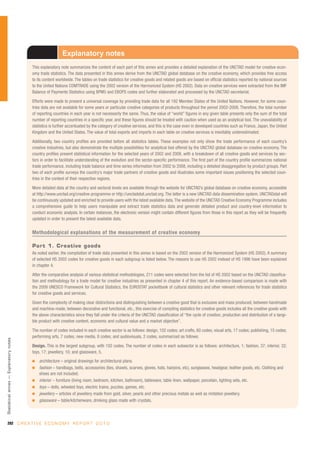
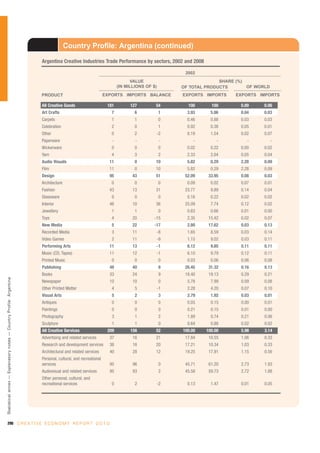
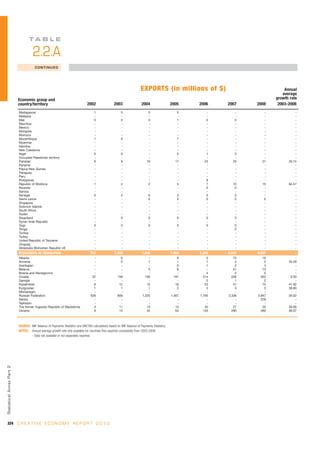
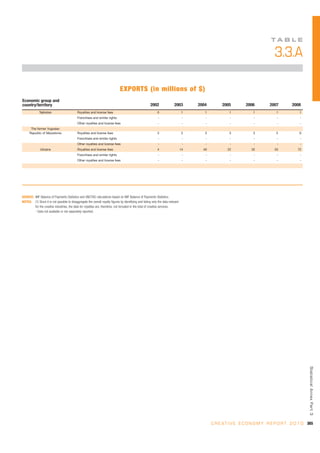
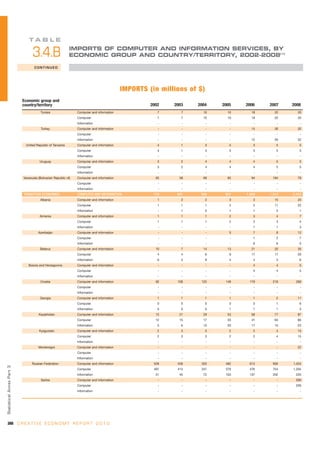
The creative industries contribute to output, value noted that in four of the eight countries shown, the creative
added, income and the balance of payments. Typically, these industries contributed more than 5 per cent of GVA, and in
industries have contributed somewhere between 2 and 6 per two countries, they contributed 10 per cent or more of
cent of GDP, depending on the definitions used. In 2007, employment. Comparisons with other sectors of the
the creative industries accounted for 6.4 per cent of the U.S. economies of developed countries are shown in table 1.8
economy, generating foreign sales and exports in the order and table 1.9.
of $125.6 billion, one of the larger exporting sectors in the
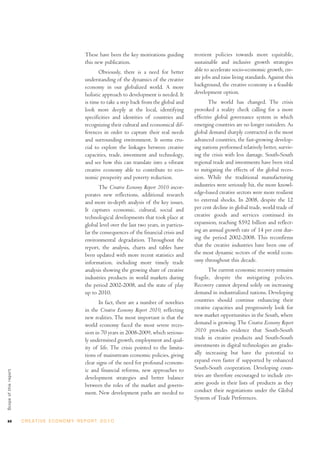
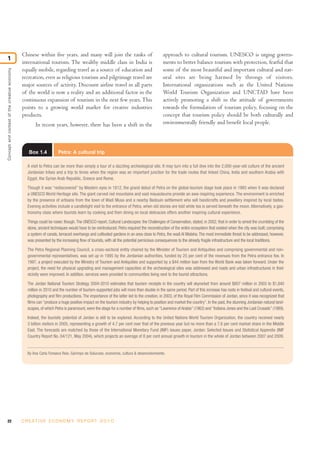
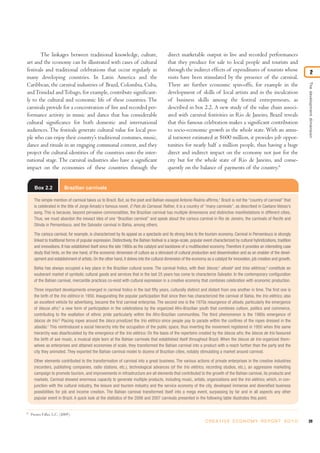
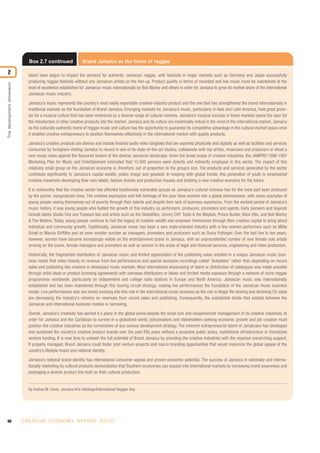
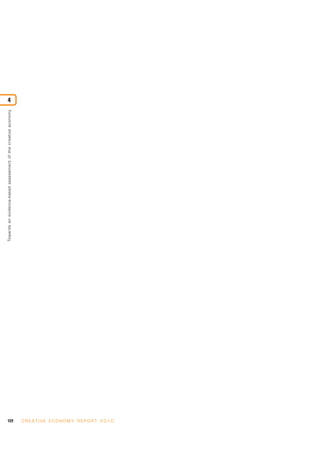
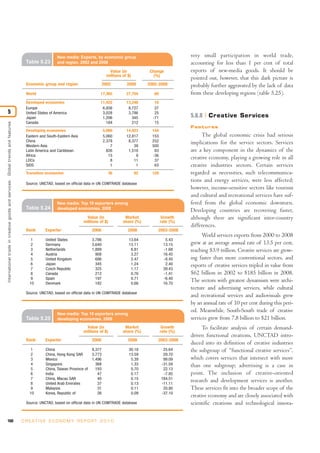
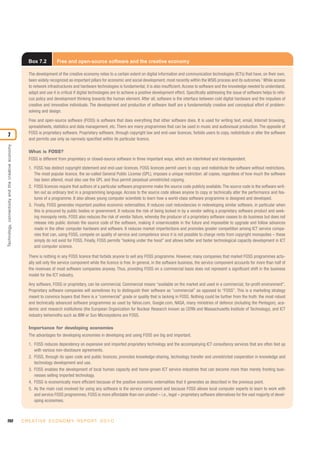
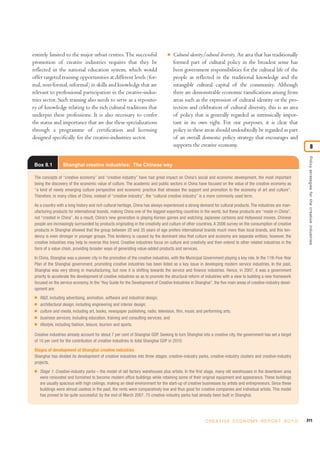
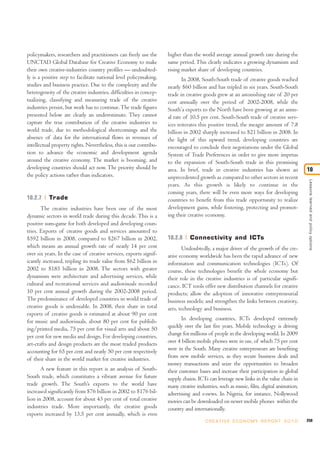
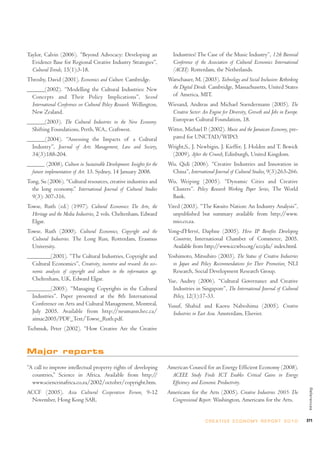
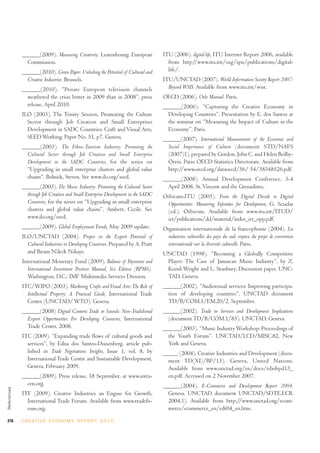
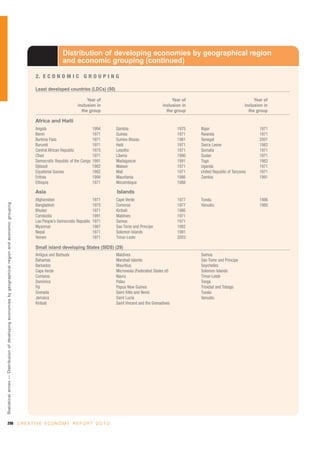
Table 1.6 Contribution of the cultural industries (a) to GDP or GVA for five countries, various years (b)
Country Reference year Currency Aggregate measured Contribution of cultural industries
Value (millions) % of GDP/GVA
Australia 1998–99 $A GDP 17,053 3.1
Canada 2002 $Can GDP 37,465 3.5
France 2003 € GVA 39,899 2.8
United Kingdom 2003 £ GVA 42,180 5.8
United States 2002 $US GVA 341,139 3.3
Notes: (a) Industries included: Advertising; architecture; video, film, photography; music, visual arts, performing arts; publishing, print media; broadcast media; art and antiques
trade; design, including fashion design.
(b) For qualifications to the interpretation of these data, refer to source.
Source: Gordon and Beilby-Orrin, International Measurement of the Economic and Social Importance of Culture, OECD (2007:54).
54
Ministry of Culture of Spain (2009).
55
Giorgio Napolitano, 31 December 2007, quoted in Santagata (2009).
56
Santagata (2009).
57
On the basis of Eurostat and AMADEUS databank, as reported by KEA, European Affairs in 2006.
58
Monitor Creative Industries (2008).
59
Siwek (2009).
60
ARC Centre of Excellence for Creative Industries and Innovation (2010).
30 C R E AT I V E E C O N O M Y R E P O R T 2 0 1 0](https://image.slidesharecdn.com/unctad-creativeeconomy-afeasibledevelopmentoption-110517093009-phpapp01/85/UNCTAD-Creative-Economy-A-feasible-development-option-60-320.jpg)
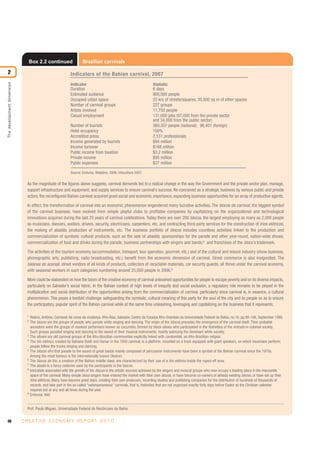
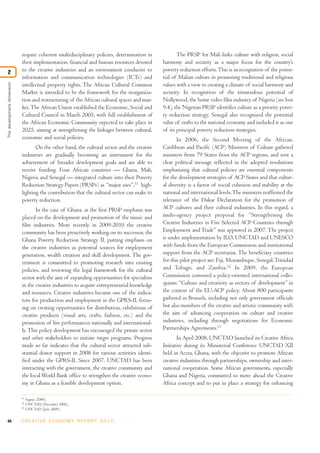

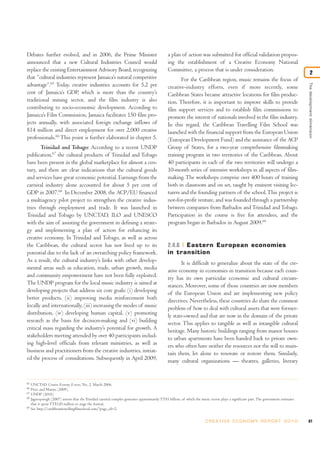
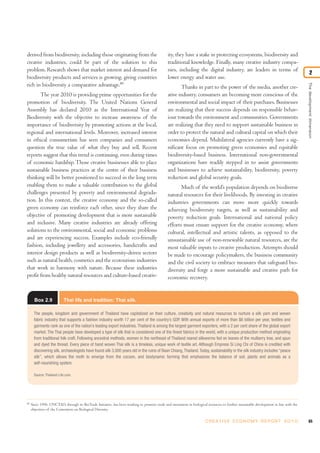


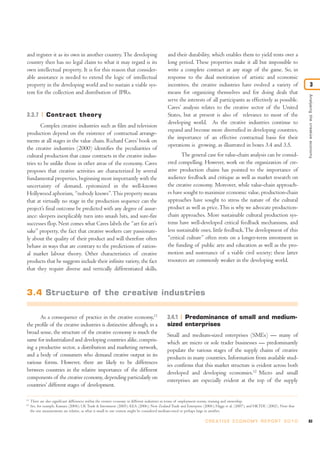
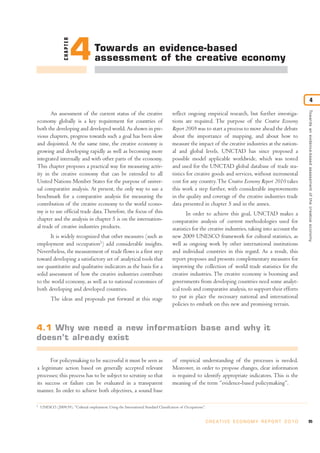
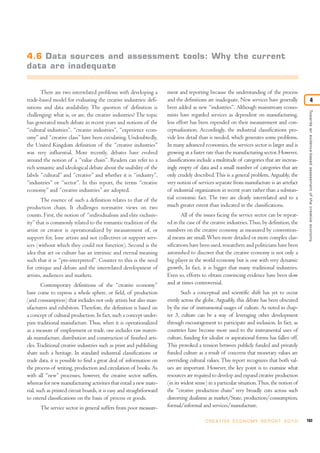
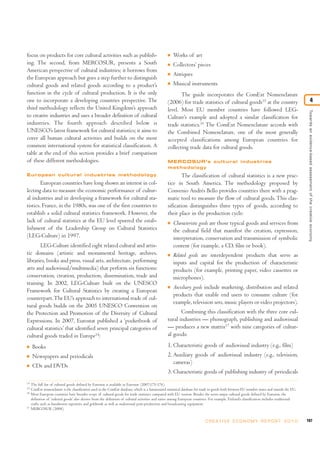
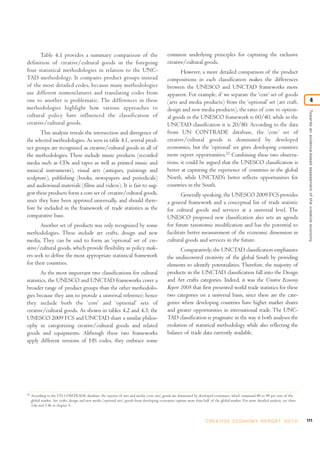


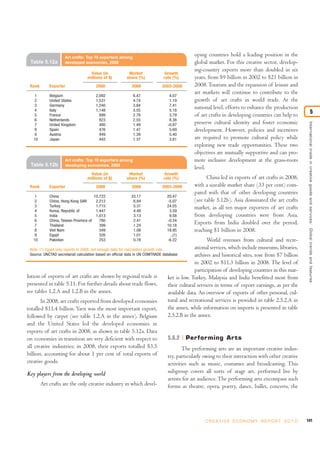
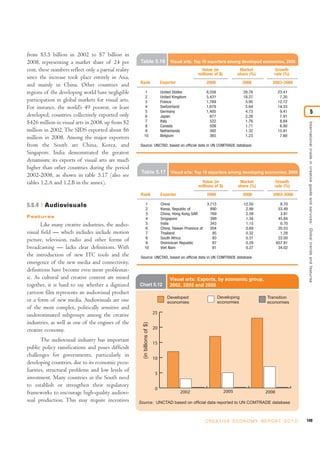
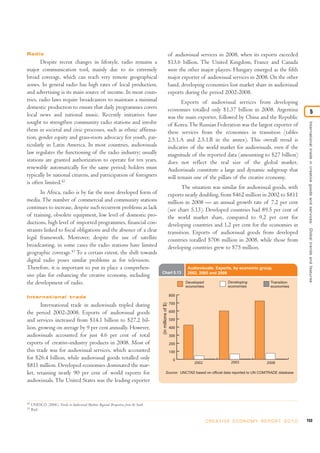
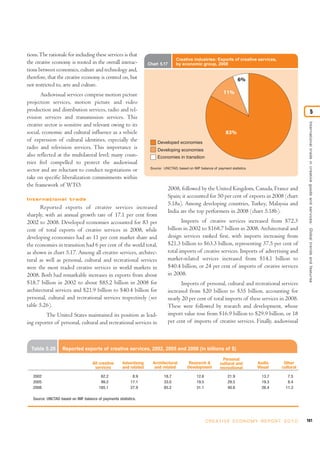


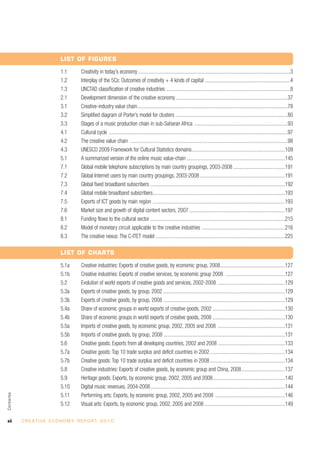
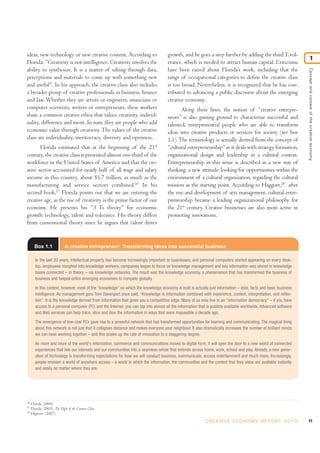
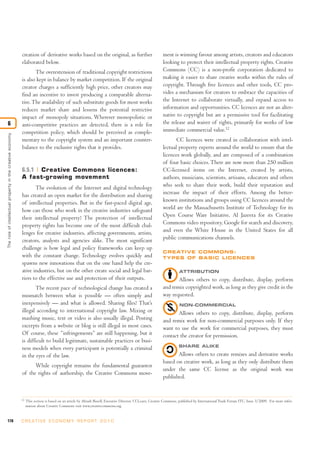
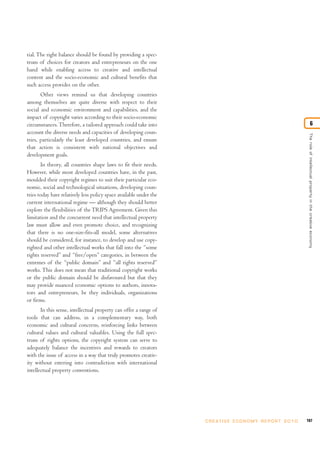
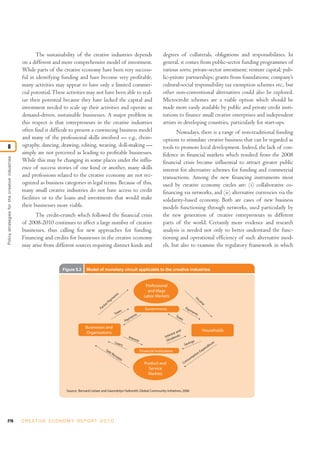
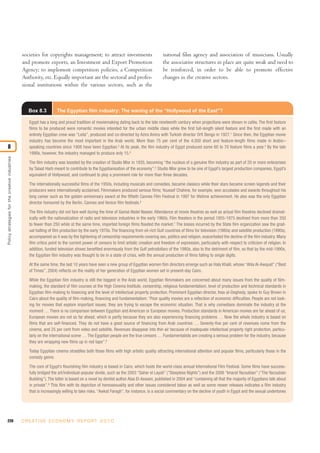
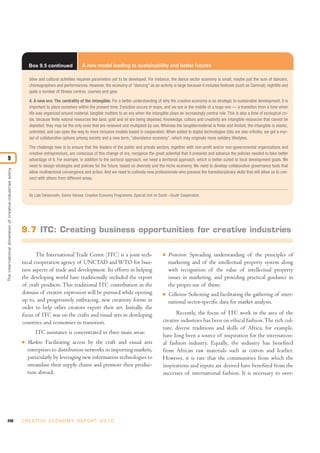
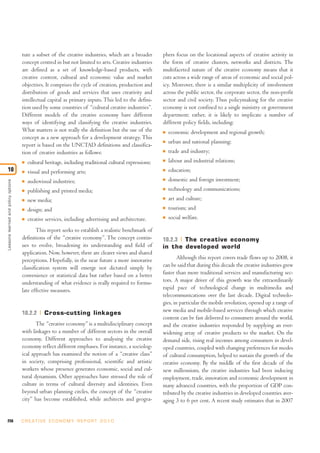
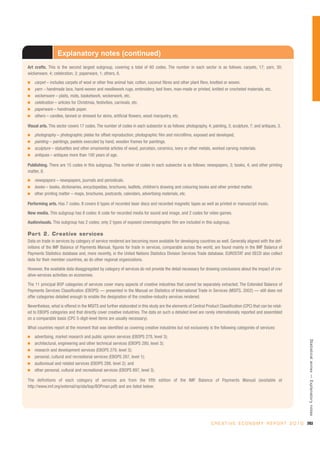
![defined in national legislation. The basic concepts in nation- I its reproductions in various forms, such as printed publi-
al law are, however, largely consistent with the provisions of cation or a CD;
international instruments. The most important of these is I its public performance, as in a play or musical work;
the Bern Convention for the Protection of Literary and
I its broadcasting, including by radio, television or satellite;
Artistic Works; at the time of drafting this report, there were
163 contracting parties to the Convention.4 I its translation into other languages or its adaptation, such
as the adaptation of a novel into a screenplay.
The economic necessity for copyright legislation aris-
es from the need to provide an incentive and a reward for the These economic rights have a time limit, according to
commercial production and dissemination of creative works. the relevant WIPO treaties, of 50 years after the creator’s
Copyright supports creativity by giving individuals — and death. National law may establish longer time limits.7 This 6
the creative industries in which they are involved — incen- limit enables both creators and their heirs to benefit finan-
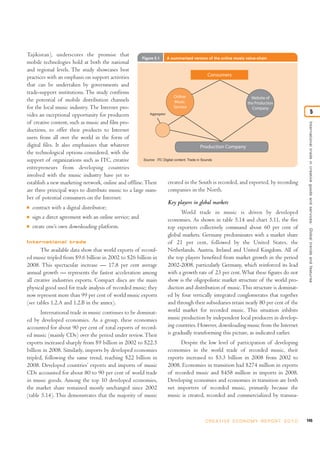
The role of intellectual proper ty in the creative economy
tives to invest time, efforts and money in creating, producing cially for a reasonable period. Once the copyright term has
and distributing works. In principle, copyright assures the expired, works fall into the public domain.
ownership of a tradable right that can be used to secure a Copyright provides exclusivity only over the form of
financial return on their investment.5 Certain legal philoso- expression of an idea but not to the idea itself. The creativi-
phies consider copyright law as originating from the ever- ty protected by copyright law is creativity in the choice and
increasing need of society to consume products of creative arrangement of words, musical notes, colours, shapes and so
industries and see copyright as the tool to bring the largest on. For example, it is the way in which an artisan has cre-
number of quality products to market where consumers will atively executed the idea of creating a tea set or the way a
ultimately judge their merit. Others seek the legitimacy of photographer has taken a picture of a specific subject that is
copyright in order to gain respect for works of the human copyrightable, not the idea itself. Copyright law protects the
mind and rely on the moral principle that individuals should owner of rights in artistic works against those who “copy”,
be rewarded for their creative labour and contribution to cul- i.e., those who take and use the form in which the original
tural diversity. work was expressed by the author. Ideas, processes, proce-
dures, methods of operation and facts by themselves may be
freely taken and applied or used, subject, of course, to other
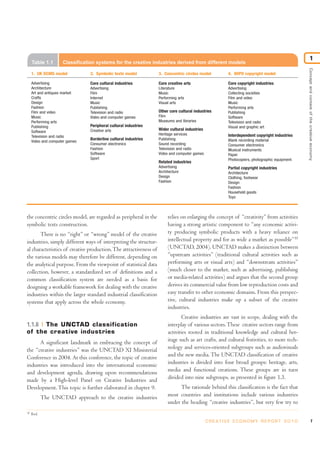
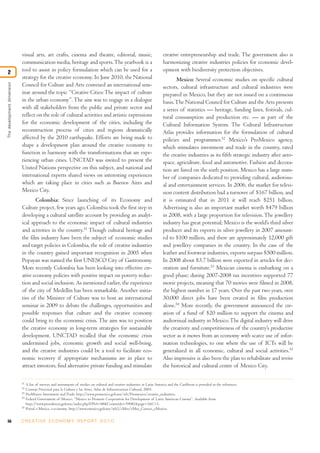
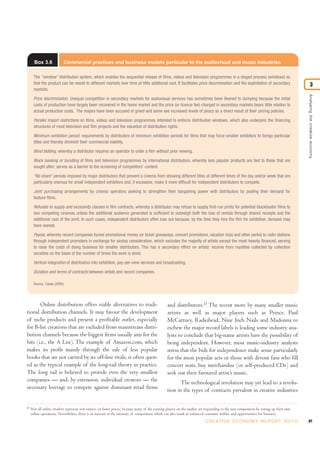
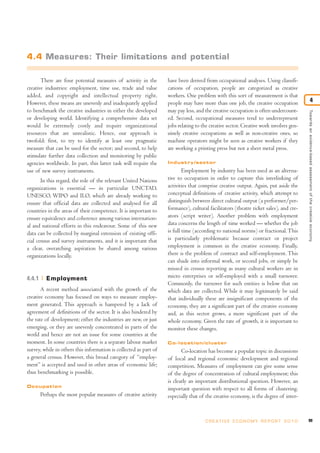
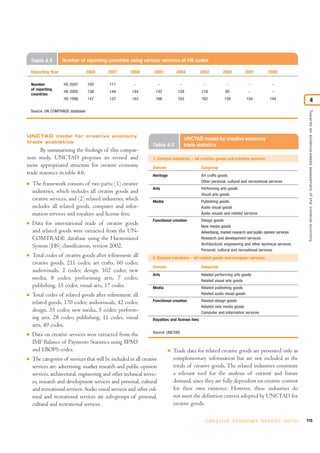
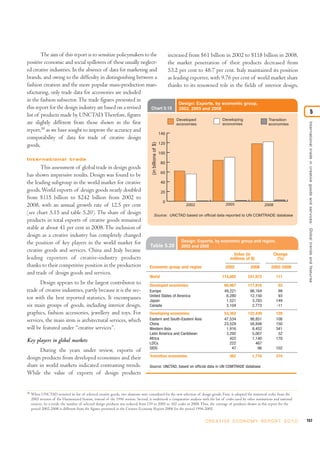
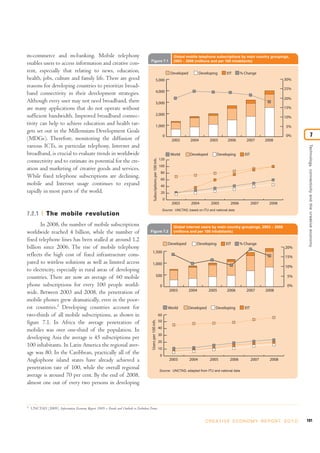
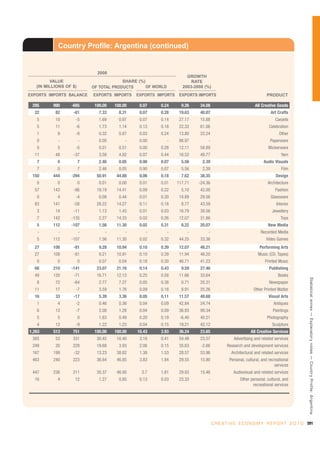
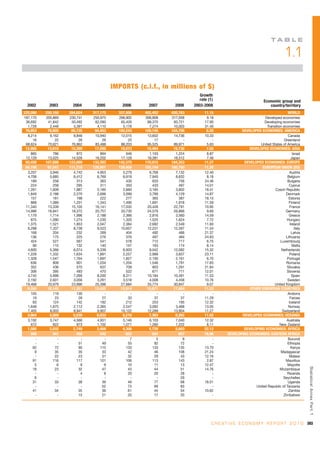
6.4.1 Exclusive rights types of limitations.
Copyright consists of a system of rights given to
creators in their literary and artistic works at the moment of
creation provided they are not under contract that specifies 6.4.2 Moral rights
otherwise.6 These rights are tradable and may be sold to other Copyright protection also includes moral rights, which
individuals and firms. Creators and ultimately their heirs, or involve the right to claim authorship of a work and the right
rights owners, hold the exclusive rights to use or license to oppose changes to it that could harm the creator’s reputa-
others to use the work on agreed terms. The holder of the tion. Moral rights correspond to the interests of creators in
copyright of a work can prohibit or authorize, for example: being identified as the originators of a particular work, and
the ability to control the conditions that surround its dis-
4
According to the Bern Convention, literary and artistic works are protected without any formalities by the contracting parties. If a creator is a national or resident of a country party
to that Convention (or a member of the WTO), or has published the work initially in one of the member countries, his/her copyright will be automatically protected in all the
other countries that are party to the Convention. Other major legal instruments include the International Convention for the Protection of Performers, Producers of Phonograms
and Broadcasting Organizations (at the time of drafting this report, there were 86 parties to the Rome Convention, as it is commonly known), the Agreement on Trade-Related
Aspects of Intellectual Property Rights (commonly known as the TRIPS Agreement; at drafting time, there were 151 WTO members, all of which are parties to the TRIPS
Agreement), and the WIPO Copyright Treaty (WCT) of 1996 and the WIPO Performances and Phonograms Treaty (WPPT) of 1996 (at drafting time, there were 64 contracting
parties to the WCT and 62 to the WPPT).
5
For a thorough analysis of the economics of copyright, see Landes and Posner (1989:325, 325-333, 344-353).
6
If a creative product is produced under a “work [made] for hire” contract — which is common in the music and publishing industries — the contractor or employer is considered
the legal author. In this case, the creator of the work may or may not be publicly credited for the work (attribution) and this has no effect on the ownership status. For example,
news journals may attribute news articles as written by their staff but will retain the ownership and, from a copyright perspective, the authorship of the articles. In such cases, even
though the commercial component of the copyright is detached from the real creators, countries that are signatories of the Bern Convention recognize certain non-commercial moral
rights that are inalienable under work-for-hire contracts.
7
For example, in India, the term is 60 years after the creator’s death; in the European Union and the United States, 70 years; and in Mexico, 100 years. Copyright laws of a wide
range of countries can be consulted in the Collection of Laws for Electronic Access (CLEA) database of WIPO at http://www.wipo.int/clea/en/index.jsp.
C R E AT I V E E C O N O M Y R E P O R T 2 0 1 0 173](https://image.slidesharecdn.com/unctad-creativeeconomy-afeasibledevelopmentoption-110517093009-phpapp01/85/UNCTAD-Creative-Economy-A-feasible-development-option-203-320.jpg)
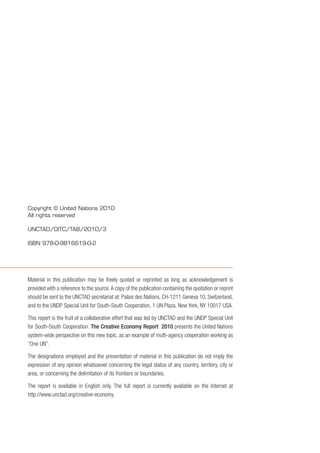
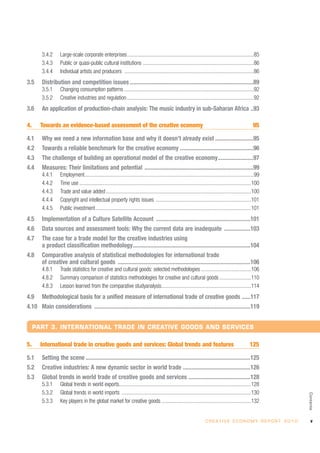
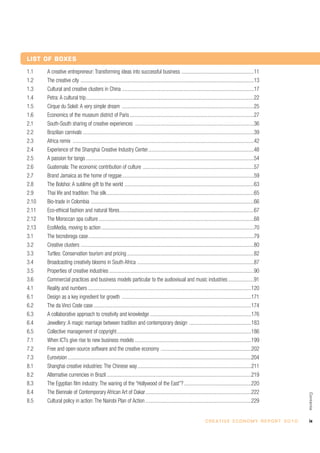
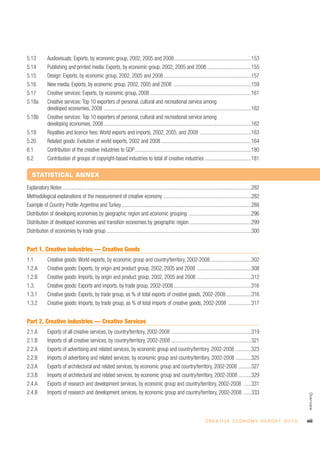
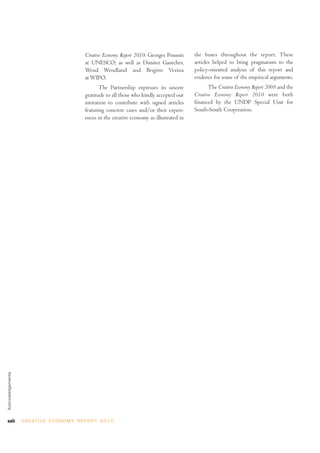
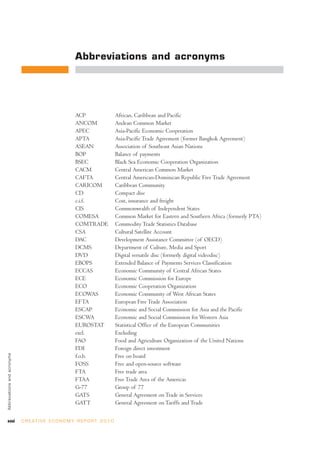
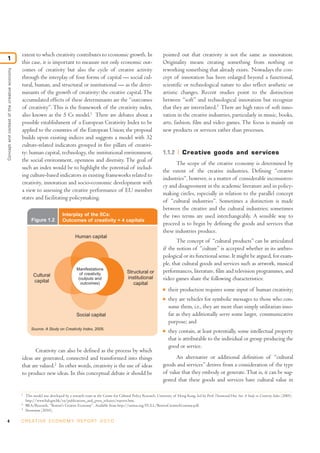
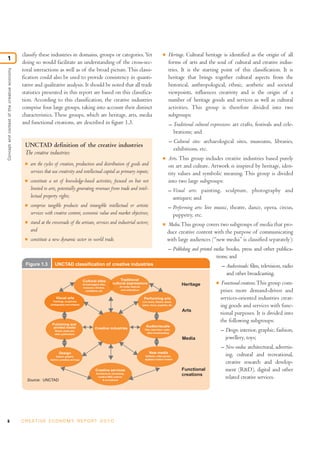
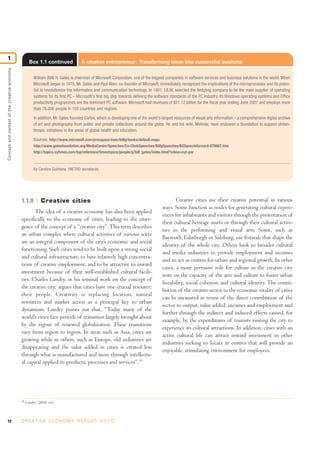
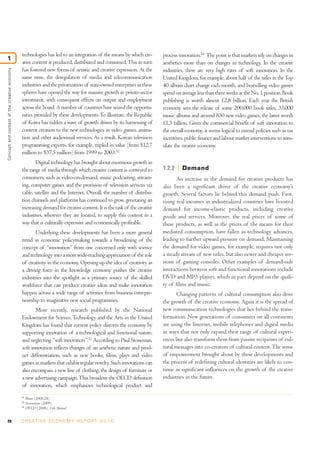
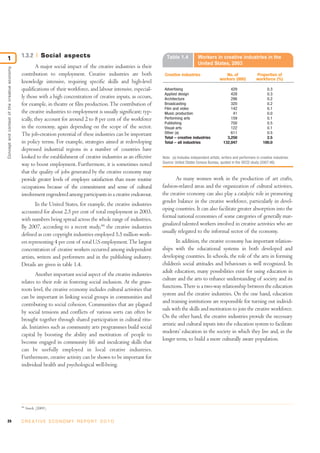
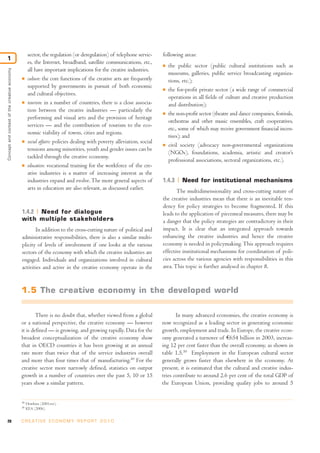
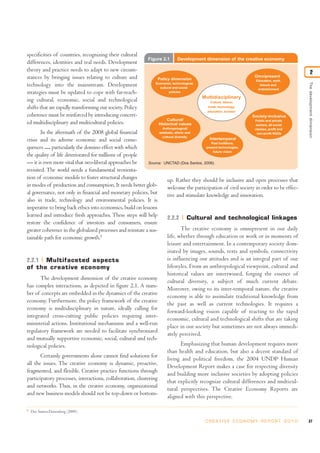
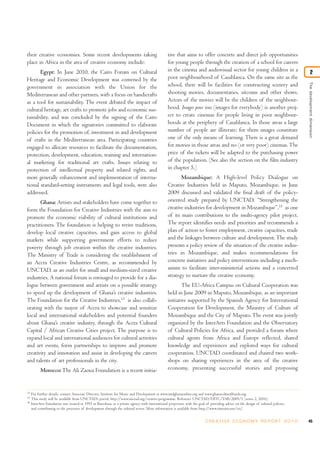
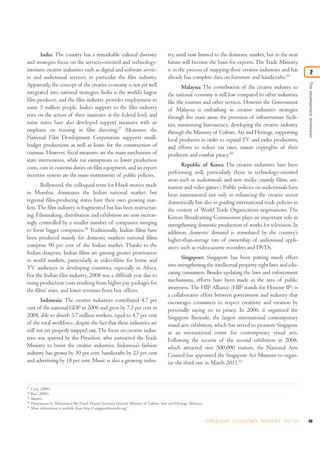
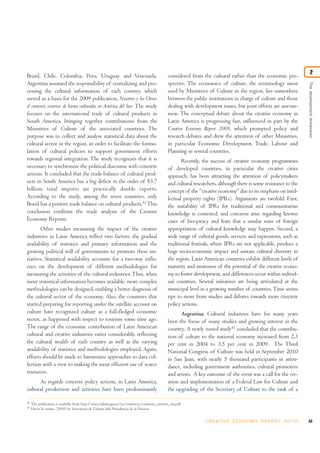
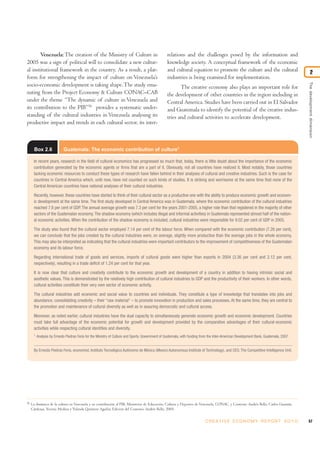
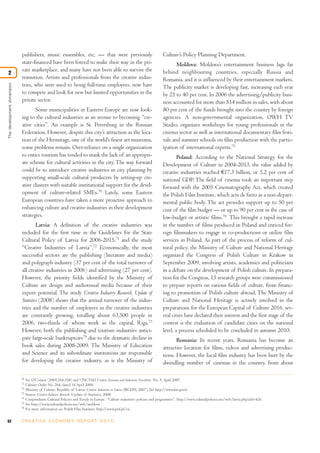
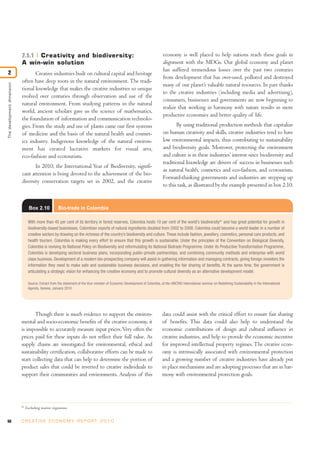
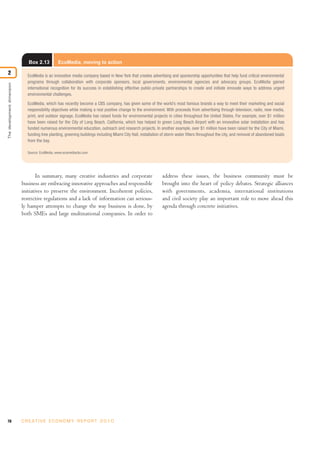
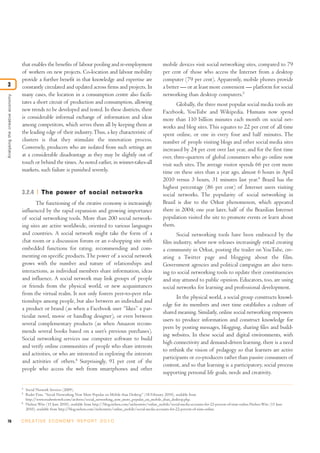
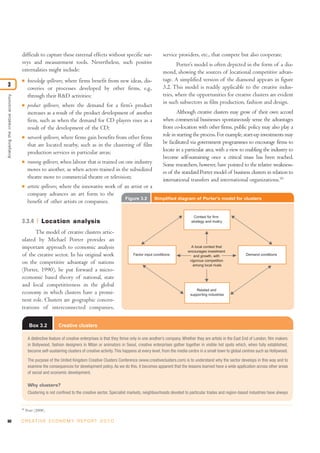
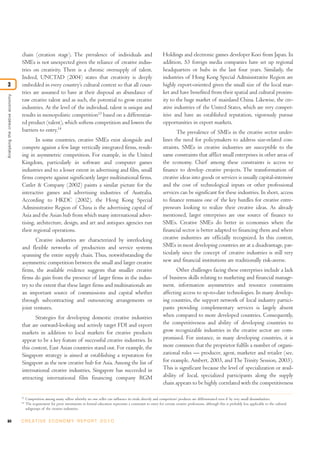
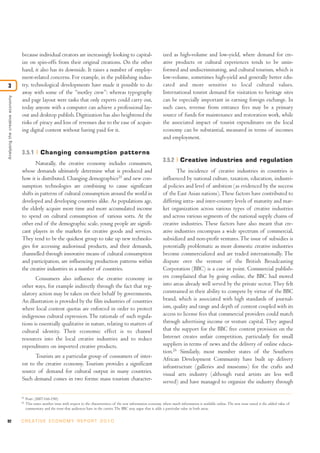
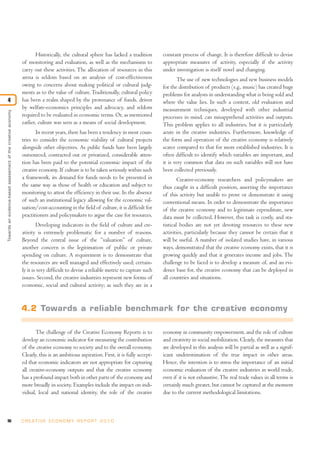
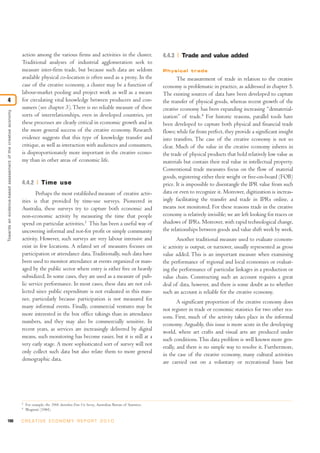
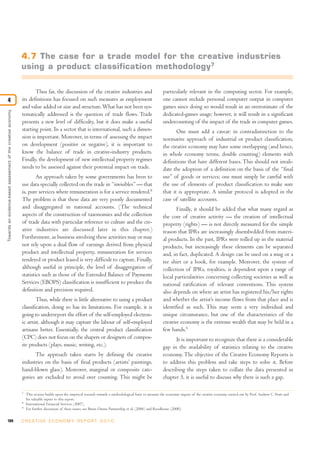
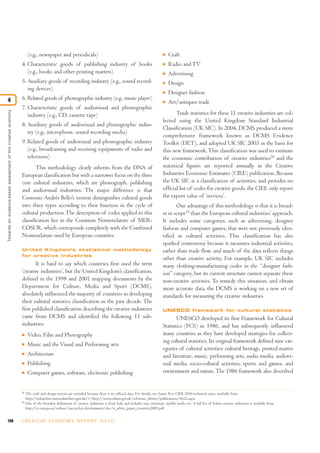
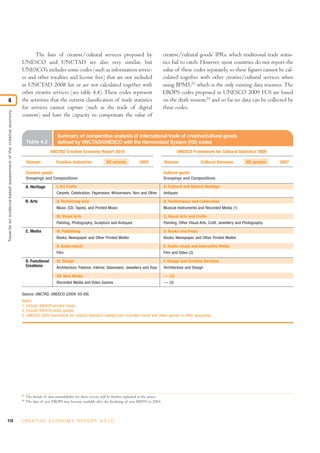
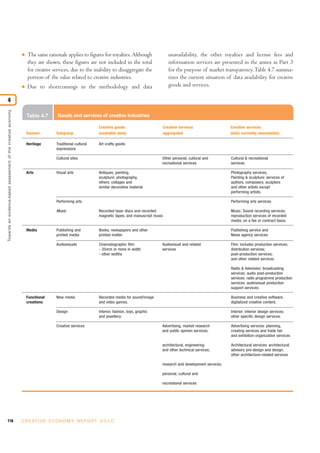
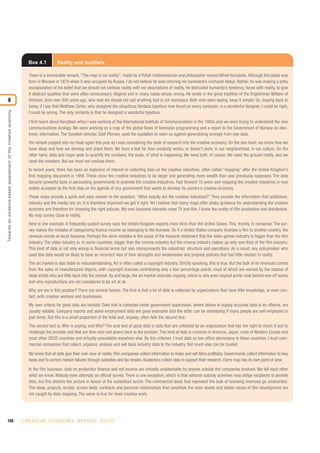
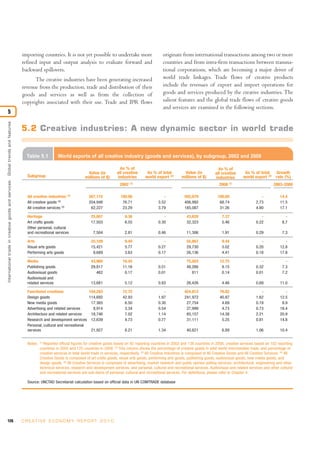
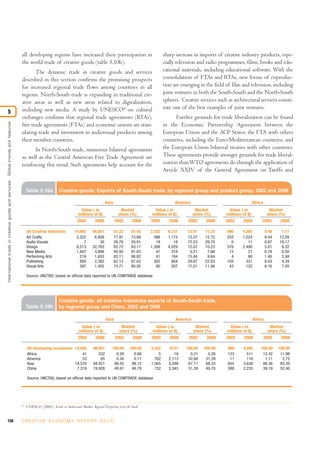
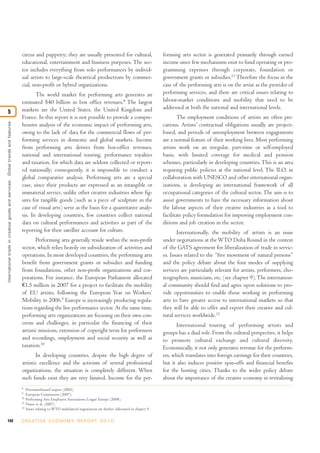
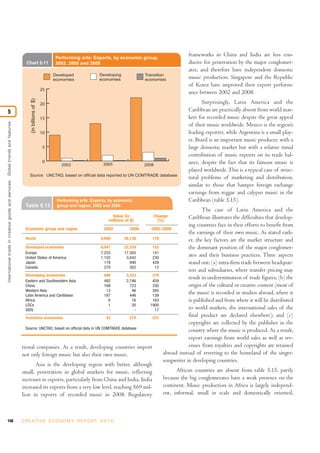
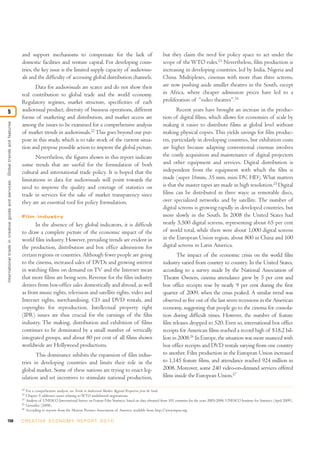
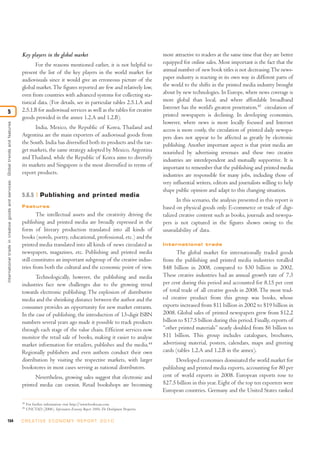
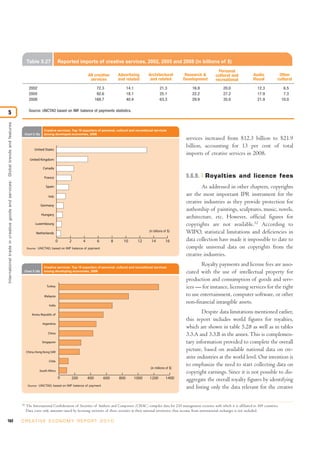
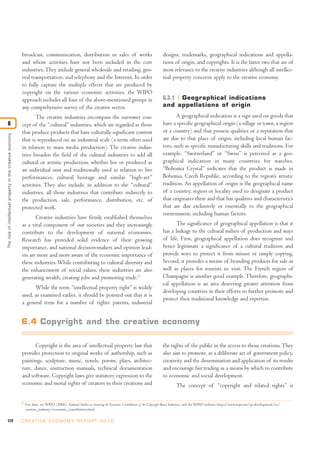
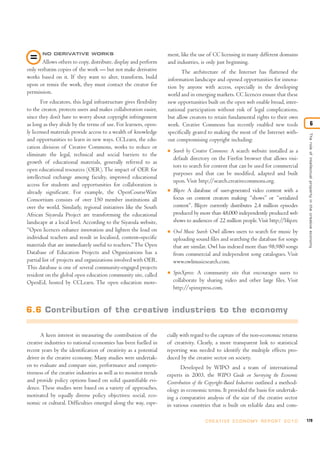
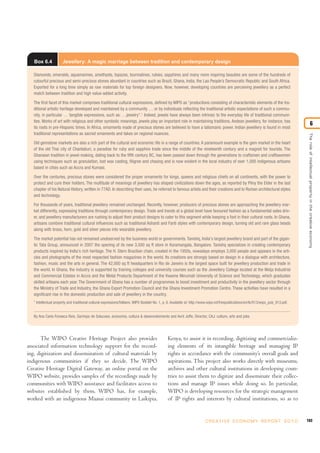
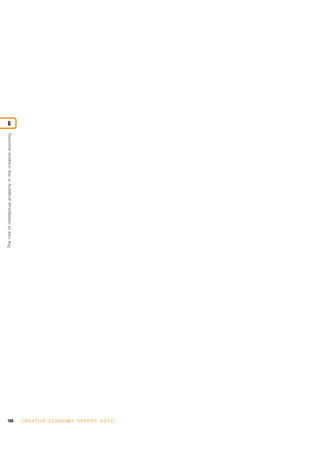
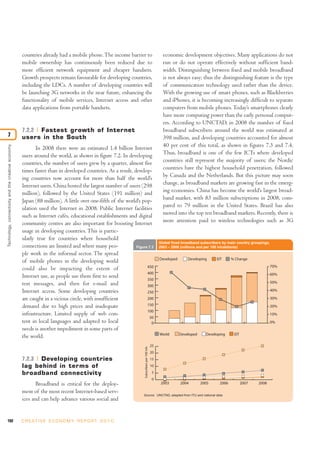
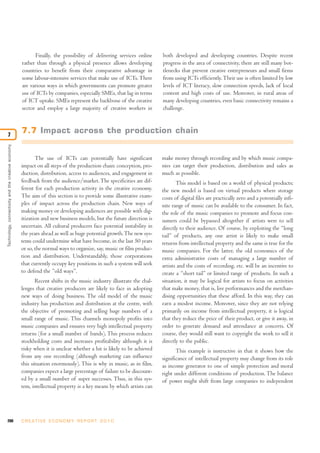
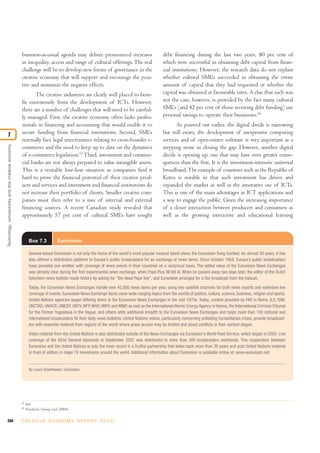
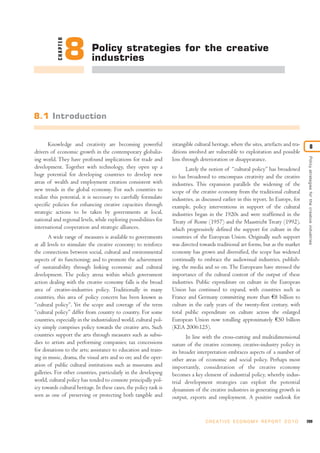
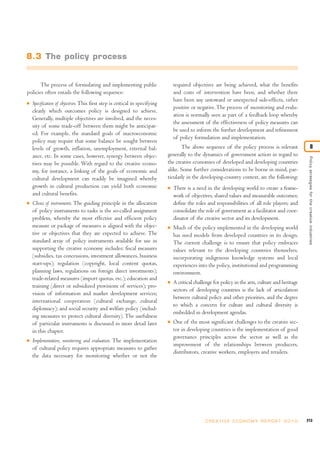
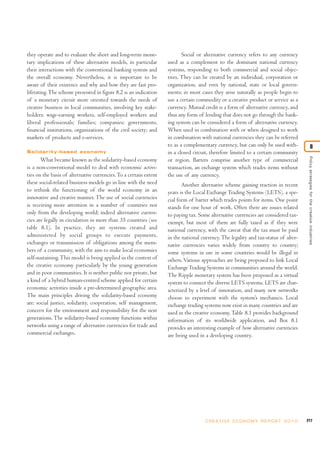
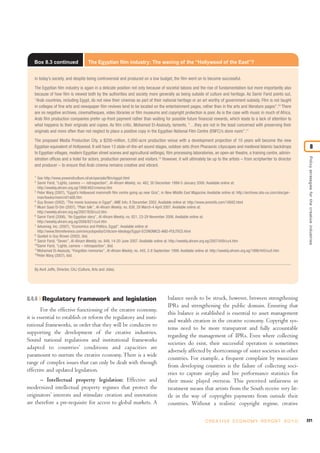
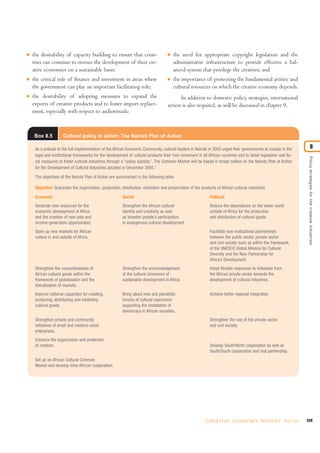
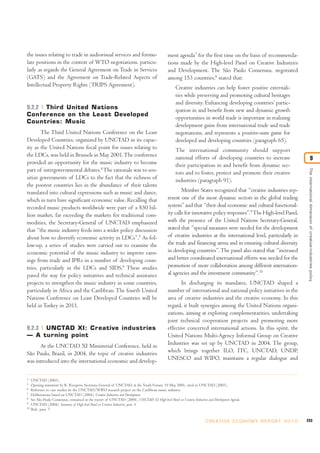
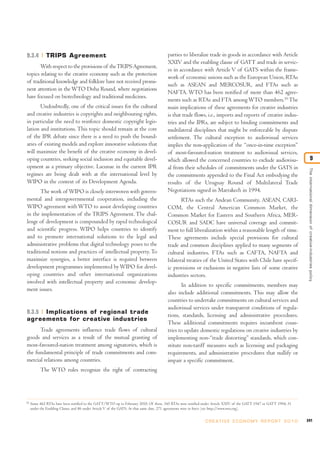
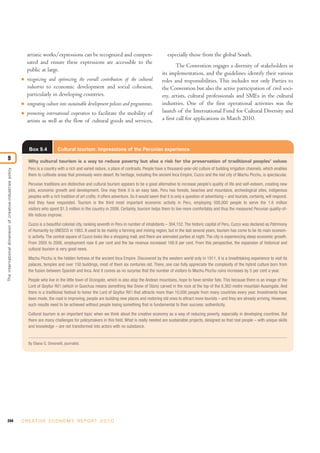
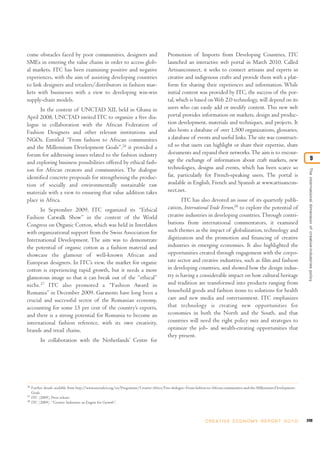
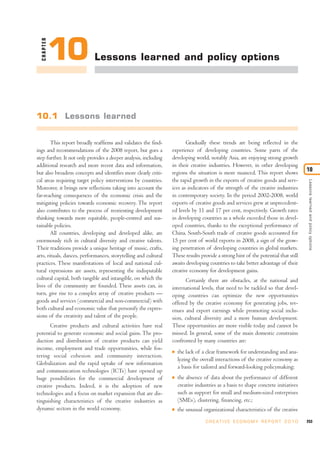
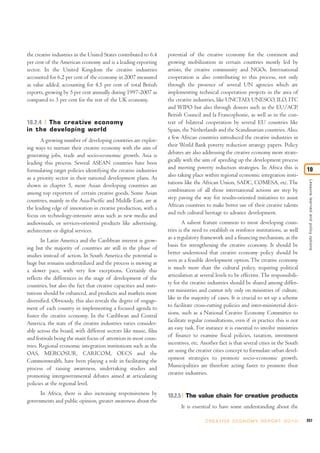
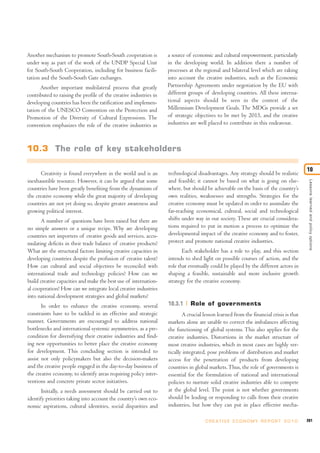
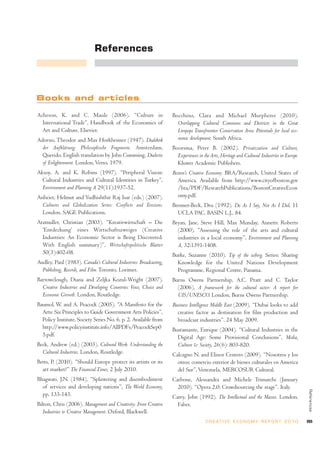
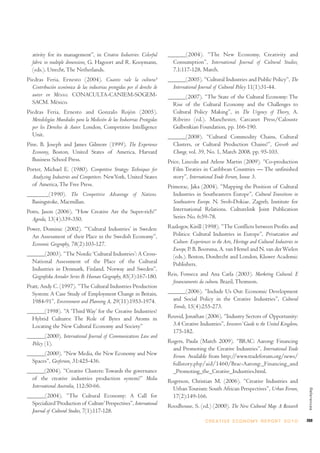
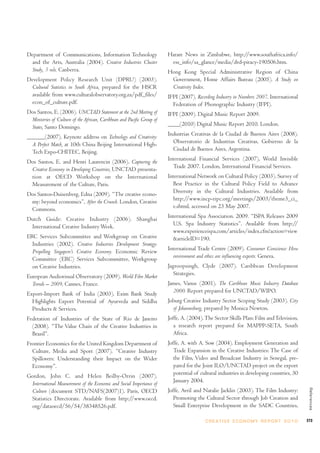
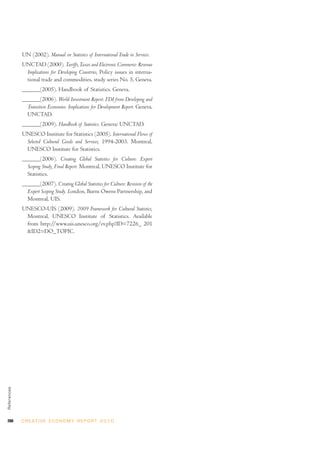
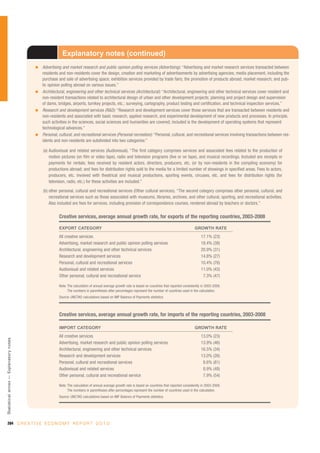
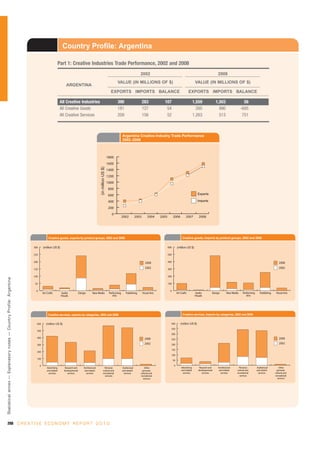
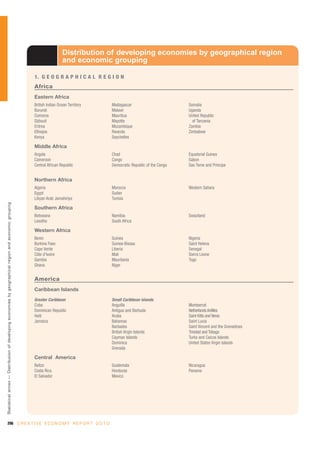
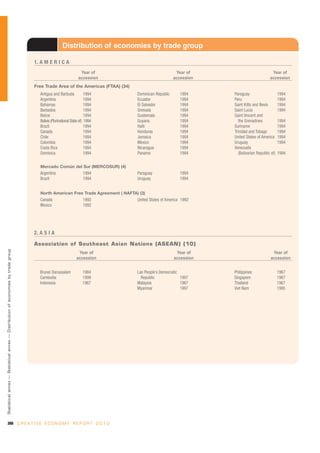
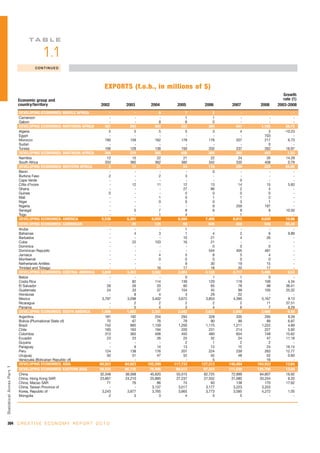
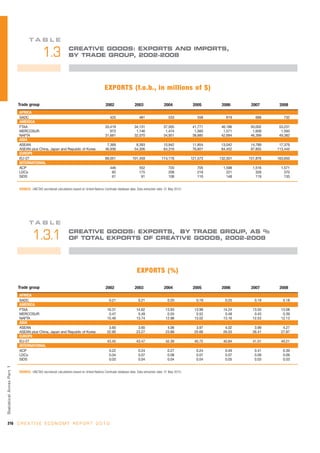
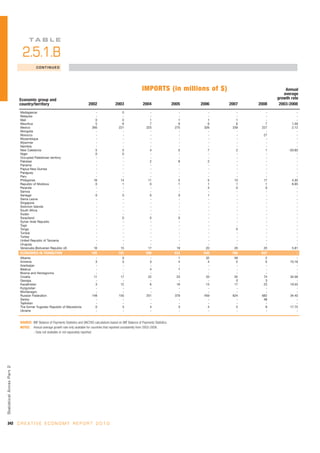
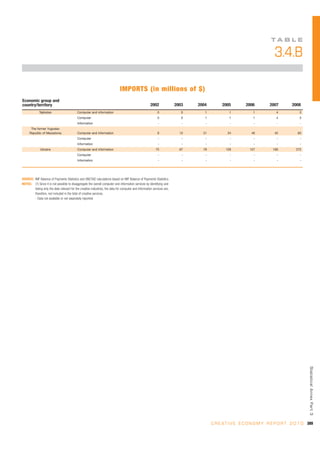
![Box 6.2 The Da Vinci Code case
A copyright infringement case was brought against the publishers of The Da Vinci Code by Michael Baigent and Richard Leigh, two of the authors of a
1982 non-fiction work, The Holy Blood and The Holy Grail. According to an article in the June 2006 issue of WIPO Magazine, “At the centre of the dis-
pute was a ‘hypothesis’ presented in The Holy Blood and The Holy Grail” according to which “references to the Grail in early manuscripts were disguised
references not to the chalice, but rather to holy blood or Sang real, i.e. to the bloodline of Jesus Christ, and to the belief that this bloodline … had
continued and merged with the French Merovingian dynasty”.
The plaintiffs “claimed copyright in the literary work and alleged that Dan Brown”, author of The Da Vinci Code, “had copied the way in which they had
made the sequence of connections of the facts of the merging of the bloodlines. Since there was little copying of the actual text of The Holy Blood and
The Holy Grail, the claim was that there had been non-literal copying of a substantial part of their literary work”.
6
The Holy Blood and The Holy Grail “is comprised largely of historical facts which are unprotectable ideas. Baigent and Leigh based their case, therefore,
The role of intellectual proper ty in the creative economy
on the claim that Brown had taken a substantial part of the ‘manner’ in which they had expressed those ideas, as opposed to taking the ideas themselves”.
“The court held that, while the evidence was clear that Dan Brown and his primary researcher (his wife) had drawn on The Holy Blood and The Holy Grail
to a greater extent than Brown had acknowledged, this did not mean that he had infringed copyright in the book. Rather, they had used The Holy Blood
and The Holy Grail, and other books, to provide general background material for the writing of The Da Vinci Code”.
“The significance of the case for copyright law relates to the fact that the lawyers acting for Baigent and Leigh attempted to make – and lost – an argu-
ment that there can be non-literal copying of a work of literature. The non-literal argument has previously been successfully used, usually in the case of
computer programs or recipes or knitting patterns.”
Source: Dr. Uma Suthersanen, “Copyright in the Courts: The Da Vinci Code”, WIPO Magazine, June 2006, available at:
http://www.wipo.int/wipo_magazine/en/2006/03/article_0004.html. See Michael Baigent and Richard Leigh v. The Random House Group Limited Neutral Citation
Number: [2006] EWHC 719 (Ch), available at: http://www.binarylaw.co.uk/2006/04/smithy_code.htm.
semination, be it from the very decision to go public to the is not included in the world trade of creative industries. This
safekeeping of authenticity, thus addressing both economic is a crucial area that requires more work in order to measure
and cultural dimensions. Moral rights are inalienable from and evaluate the full contribution of the creative industries
the authors and cannot be transferred to third parties under to the world economy. WIPO is examining possibilities for
commercial contracts.8 improving its data collection system, so hopefully in the near
future we will be able to discern a clearer picture of the earn-
ings from royalties originating from the creative industries.
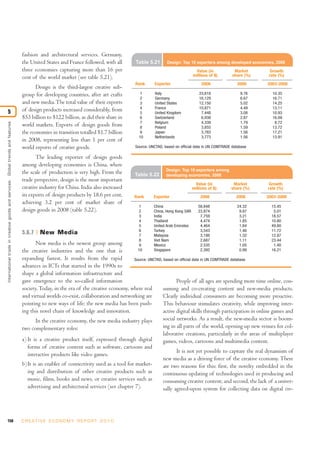
6.4.3 Related rights In principle, works of the mind are created in order to
Many creative works protected by copyright require be disseminated to a wider audience. This generally cannot
mass distribution, communication and financial investment be done by an author alone, since it requires financial invest-
for their dissemination (for example, publications, sound ment by intermediaries that have the necessary production
recordings and films); hence, creators often sell or license the and reproduction infrastructure, access to retailers and dis-
copyrights to their works to individuals or companies best tribution networks and professional competencies — such as
able to market the works in return for payment. These pay- management, marketing and public relations — that the
ments are often made dependent on the actual use of the author may not possess. A play needs to be represented on
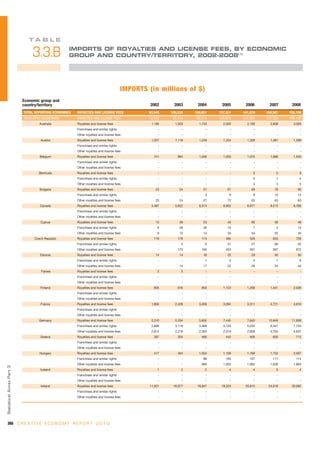
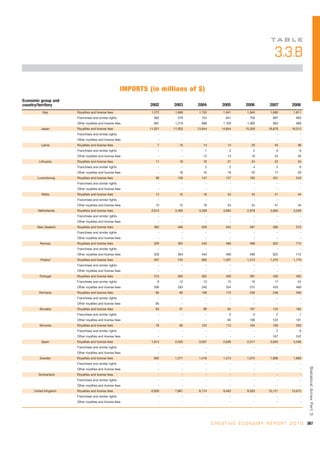
work and are then referred to as “royalties”. In chapter 5 and stage; a song needs to be performed by artists, reproduced in
the annex of this report, statistics related to trade of royal- the form of CDs or broadcast by means of radio facilities.
ties are presented as an indication of the magnitude of the All persons who make use of literary, artistic or scientific
trade flows. The market of royalties has been expanding works in order to make them publicly accessible to others
quickly, from $83 billion in 2002 to $182 billion in 2008. require their own protection against the unauthorized use of
However, this data covers all royalties, of which creative their contributions in the process of communicating the
industries are just a part. As the data is not disaggregated, it work to the public. The field of rights related to copyright
8
While the Bern Convention is “moral rights” friendly, the United States does not recognize it.
174 C R E AT I V E E C O N O M Y R E P O R T 2 0 1 0](https://image.slidesharecdn.com/unctad-creativeeconomy-afeasibledevelopmentoption-110517093009-phpapp01/85/UNCTAD-Creative-Economy-A-feasible-development-option-204-320.jpg)
![and made commercially available by the likes of IBM or is imperative to ensure that creators really benefit from the
Novell, is available under the GNU General Public earnings of their work. If the real problems could be solved,
License.10 National copyright legislation is obliged to this would encourage better enforcement in developing
enforce and respect the licence conditions as declared in countries. Therefore, the key issue is not only enforcement
these and other open public licenses, and recent cases have but also the ambiguities of the current IPR regime, which
upheld the rights of the copyright owners distributing works deserve to be carefully addressed by governments.
under alternative free and/or open licences.11 In considering the protection and enforcement of
copyright and related rights, piracy appears as one of the
central issues. All kinds of works are at risk of unauthorized
6.4.5 Enforcement of copyright use. Music, books, videos, DVDs and even craft design are 6
The acquisition of copyrights is of little economic copied illegally. WIPO argues that in developing economies,
The role of intellectual proper ty in the creative economy
value if these rights cannot be enforced effectively. The cred- as a result of the flooding of markets with cheap “copyright-
ibility of the system depends to a considerable extent on the free” foreign products, domestic creators and producers lose
enforceability of the rights it confers. Well-functioning their competitiveness, which in turn endangers cultural diver-
enforcement mechanisms are the best means to limit the sity and national identity. This is a huge challenge in many
number of violations of copyrights and to ensure that rights countries, and the argument is that countries where piracy is
holders and society as a whole can reap the benefits from the rampant may forego opportunities for growth and develop-
intellectual property system. However, this is another area in ment on several levels, both tangible and intangible, since it
which more transparency is required. One of the main com- destabilizes the local creative industries and undermines the
plaints from artists and creators in developing countries is efforts of creative entrepreneurs and businesses. Inadequate
the lack of data related to the real rights transactions. A enforcement of copyright limits incentives to develop
number of questions have no simple answers: What are the creative products, especially for small and medium-sized
values of rights transferred inside corporations from the enterprises. Other critiques point to the need to review the
consuming to the producing country? Who benefits from it? current IPR legislation to address the root of the issue, not
In most cases, the rights holders are not the authors. Thus it just the consequences.
6.5 The economics of copyright
Copyrighted works, like other intangible goods, suffer or eventually “All rights reserved”, anyone else who wants to
from what economists call the public goods problem: they use the work needs to seek permission from the owner. Yet
are non-rivalries and non-excludable goods. This means that while these rights may be exclusive, they are not absolute and
their use by one person does not reduce their usefulness for some national IPR legislation provides limitations and
other persons; thus an unlimited number of people may con- exceptions to help to keep the copyright system balanced to
sume the work without using it up. In addition, while the avoid the costs of an overly extensive set of rights. These
cost of creating copyright goods is often high, the cost of so-called “fair-use” rights indicate a permissible degree of
reproducing them is low. This leads to an economic disincen- copying, in part or in full, within the family or household
tive to commercialize new works. circle, for creating backups in the production of comic and
The limited monopoly granted by copyright laws pro- satirical material, and for the purpose of study and academ-
vides copyright owners with the legal entitlement to exclude ic research. Creative Commons licences refers to a set of
others from enjoying the copyrighted work. In the case of liberal copyright licences, often referred to as “copyleft”,
traditional copyright where the terms and conditions are not that instruct the users of the work as to which conditions
specified beyond the designation “Copyright [date]”, “©” (none, some, any/all) govern copying, attribution and the
10
http://www.gnu.org/copyleft/gpl.html.
11
See http://gpl-violations.org/about.html.
C R E AT I V E E C O N O M Y R E P O R T 2 0 1 0 177](https://image.slidesharecdn.com/unctad-creativeeconomy-afeasibledevelopmentoption-110517093009-phpapp01/85/UNCTAD-Creative-Economy-A-feasible-development-option-207-320.jpg)
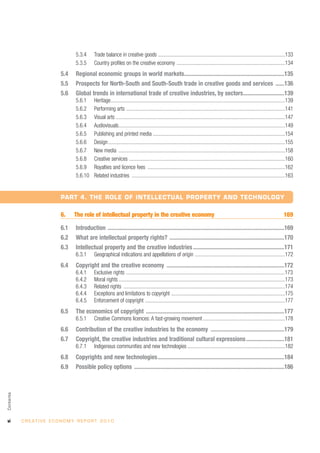
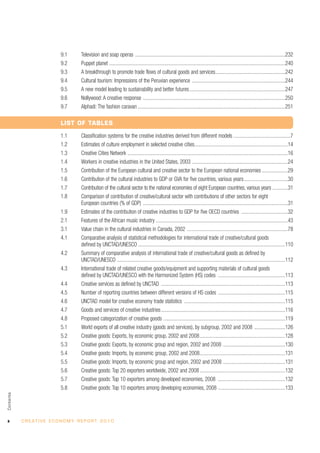
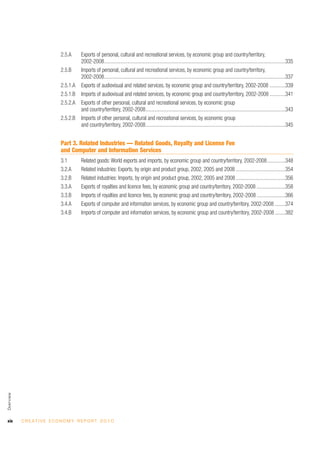
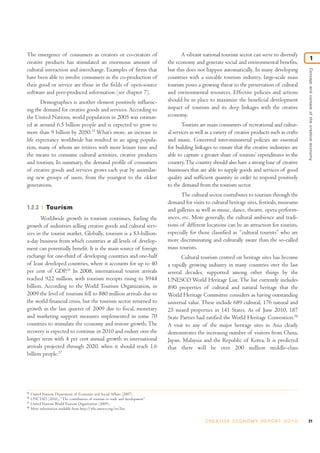
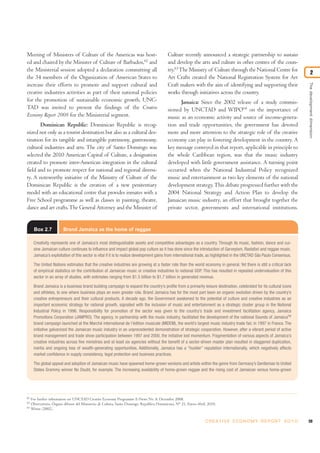
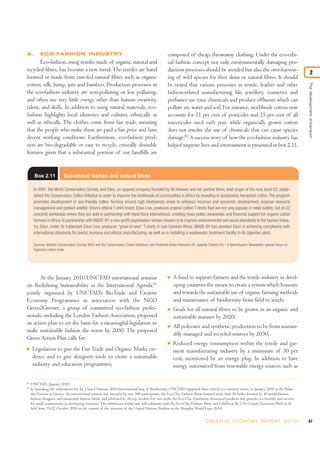
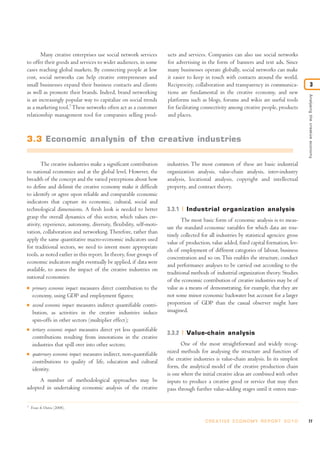
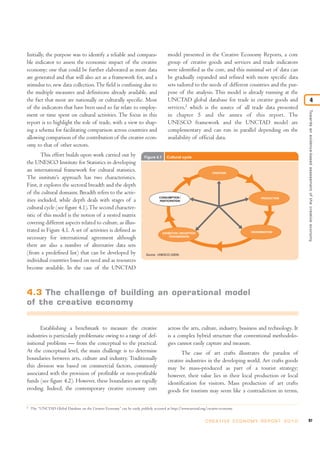
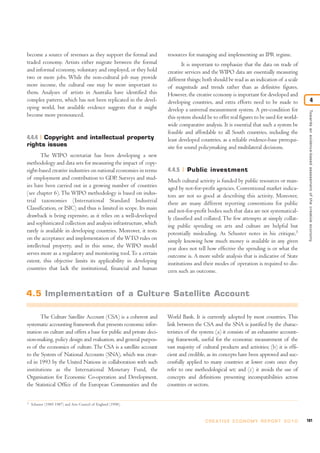
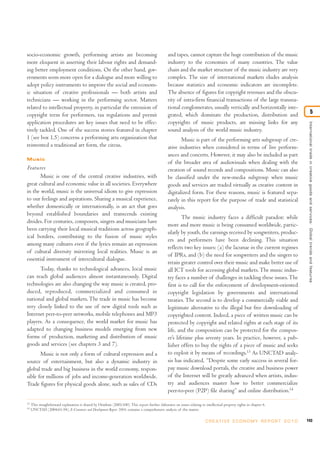
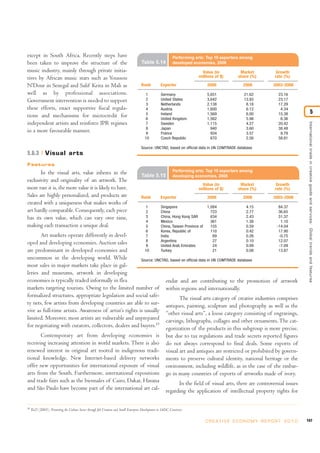
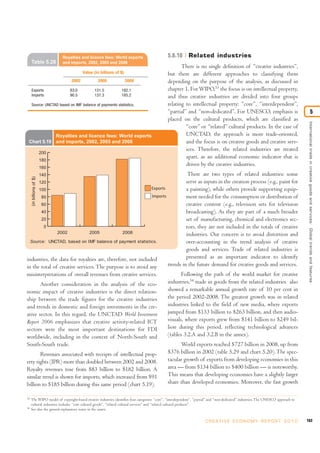
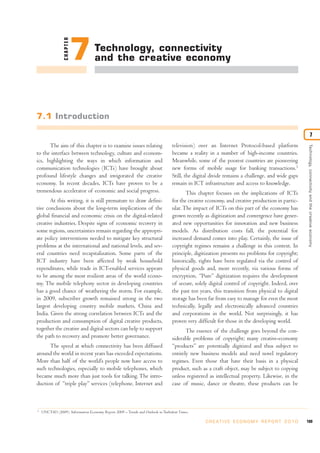
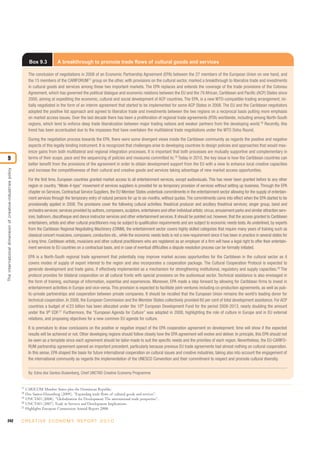
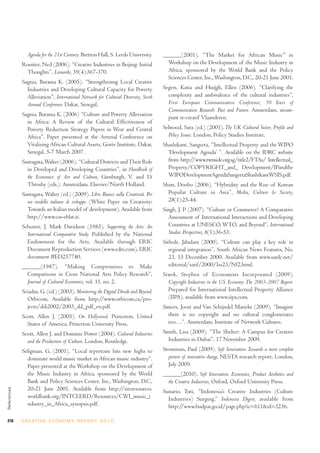
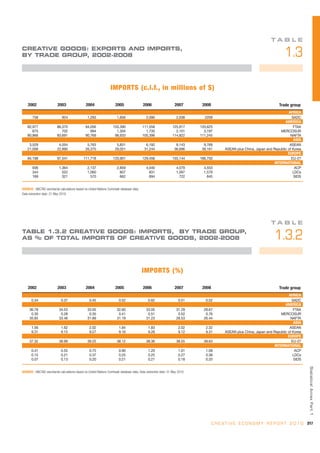
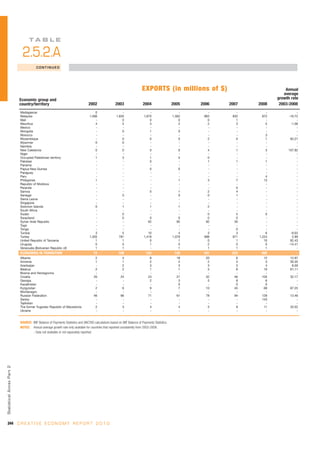
![Box 6.5 Collective management of copyright
“How is it possible to ensure that an individual musician is remunerated each time his song is played on the radio?
Or a writer whenever his play is performed? How can the copyright and related rights of such creators be managed
efficiently so as to enable them to concentrate on their creative activity while receiving the economic reward due to
them?
“From Artist to Audience, a WIPO booklet produced in cooperation with the International Confederation of Societies
of Authors [and Composers] (CISAC) and the International Federation of Reproduction Rights Organisations (IFRRO),
aims to answer some of these questions by exploring one way in which the copyright and related rights system
works, namely through the collective management of rights.”
6
“From Artist to Audience (Publication No. 922) is available in PDF in English or French on the WIPO Free Publications
The role of intellectual proper ty in the creative economy
website: www.wipo.int/freepublications/en/”
Source: Excerpt from “From Artist to Audience — Collective Management of Copyright”, WIPO Magazine, January 2007. Available at:
http://www.wipo.int/wipo_magazine/en/2007/01/article_0004.html .
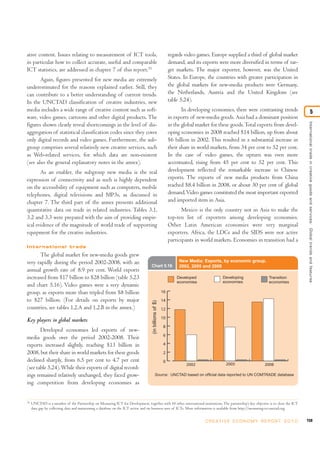
6.9 Possible policy options
The analysis in this chapter underscores the idea that enhances the enjoyment of, culture, knowledge and enter-
an efficient and fair international intellectual property sys- tainment all over the world. Ideally, under this system of
tem is in the interest of creators, creative industries and con- rights, rights owners are assured that their works can be dis-
sumers in all countries, and the level of its implementation seminated without fear of unauthorized use of their creative
is often the subject of discussions in free trade agreements. and intellectual products. In practice, viable enforcement is
IPRs are territorial, which means that they are protected only often a more critical issue than legal acknowledgement.
in the country or region where protection has been applied Increasing awareness of the contribution and potential of
for and obtained. Protecting intellectual property in export the creative sector for development is a major task.
markets is crucial if a creator is to enjoy the same benefits of Protecting copyright is a public-policy goal of countries
protection abroad as are enjoyed in the domestic market. seeking sustained growth in the creative economy. The rich,
From the WIPO perspective, adherence to interna- intangible cultural heritage of many indigenous and
tional instruments allows developing countries to have equal local communities and developing countries is a source of
access to the markets of other member nations, and to creativity that should be tapped for the direct benefit of
ensure that their local creators’ works are protected abroad. these communities and countries.
It allows the creation of a domestic creative-industry infra- According to WIPO, the inefficiency of intellectual
structure that competes with foreign products. This helps to property legislation and enforcement systems imperils the
establish credibility in the global community. economic growth to which the creative industries contribute.
Intellectual property provides incentives to creators Enforcement is as important as the education and awareness.
and entrepreneurs in the form of a tradable economic asset Countries that wish to see their creative industries prosper
— a copyright — that is instrumental for investing in the must take a strong stance for the promotion of the full
development, production and distribution of goods and spectrum of copyrights and their licences, for the best way
services, in a market economy, that are largely based on to expand the creative economy is to implement a balanced
human creativity. This in turn helps increase access to, and copyright framework that realizes their development poten-
186 C R E AT I V E E C O N O M Y R E P O R T 2 0 1 0](https://image.slidesharecdn.com/unctad-creativeeconomy-afeasibledevelopmentoption-110517093009-phpapp01/85/UNCTAD-Creative-Economy-A-feasible-development-option-216-320.jpg)

![PricewaterhouseCoopers (2008). “Global Entertainment SICA Dutch centre for international cultural activities
and Media Outlook Report, 2008-2012”. (2010). Looking outward to uncertain times — 2009 offshore
Rao, M. (2006). “Trends in Audiovisual Markets: analysis.
Perspectives from Asia”, Trends in Audiovisual Markets: Regional Siwek, Stephen E. (2004). Copyright Industries in the US Economy:
Perspectives from the South (document CI/COM/2006/ The 2004 Report. Economists Incorporated.
PUB/10), UNESCO. ______(2005). Engines for Growth: Economic Contribution of the
Réseau international pour la diversité culturelle (RIDC). Le US Intellectual Property Industries. Economists Incorporated.
renforcement des industries créatives et le développement des capacités ______(2009). The 2003-2007 Report of the Copyright Industries
culturelles pour réduire la pauvreté, Carnet de route du RIDC. in the U.S. Economy. Economists Incorporated for the
Available from http://www.incd.net/docs/INCD_ International Intellectual Property Alliance.
roadmap.doc_Nov06FR.htm.
South African Cultural Observatory. Background docu-
Royal Danish Embassy – Bangkok, Danish Trade Council ments. Available from www.culturalobservatory.org.za.
(2007). Sector Overview: The Fashion Industry in Thailand.
South African Department of Arts and Culture (2006). Arts,
SADC (1998). Report on the Sector of Culture and Information Culture and Food Security in Southern Africa. Draft report.
Policies, Priorities and Strategies, May 1998. Available from
http://www.teledata.mz/sadccult/poling.htm. Task Force on Cultural Indicators of Human Development
in Africa (2004). Cultural Indicators: Views from Africa, draft-
Safact [South African Federation Against Copyright ed for presentation at the Congress of Cultural Rights
Theft] piracy campaign. Available from http://www. and Human Development under the auspices of the
southafrica.info/ess_info/sa_glance/media/dvd-piracy- Forum Barcelona.
190506.htm.
The Work Foundation (2007), Staying Ahead: The Economic
Sagnia, Burama (2006). “Culture and Poverty Alleviation in Performance of the UK’s Creative Industries.
Africa: A Review of the Cultural Effectiveness of Poverty
Reduction Strategy Papers in West and Central Africa”, Tourism Review 2010. Morocco’s Tourism Industry
report prepared for the ARTerial Conference on Vitalizing Recorded Growth in 2009. Available from http://www.
African Cultural Assets, Gorée Institute, Dakar, Senegal, tourism-review.com/moroccos-tourism-industry-record-
5-7 March 2007. Available from http://www. ed-growth-in-2009--news2084.
hivox.nl/english/english/arterial/background-materials. World Bank (2003). Ouest afrique économie, study of Ivory
Accessed on 19 July 2007. Coast, Senegal and Mali. Available from http://sitere-
Seligman, George (2001). The Market for African Music, sources.worldbank.org/INTCEERD/Resources/CWI_
Washington, D.C.: Workshop on the Development of the music_industry_in_Africa_synopsis.pdf.
Music Industry in Africa, World Bank and Policy Sciences
Center, 20-21 June.
Publications of international organizations
American Council for an Energy-Efficient Economy (2008). old/press030404.html.
ACEEE Study Finds ICT Enables Critical Gains in Energy European Commission (2007). Mobility an instrument for more
Efficiency and Economic Productivity. Available from and better jobs: The European Job Mobility Action Plan (2007-
http://aceee.org/press/e081pr.htm. 2010). Brussels, 2007.
Export-Import Bank of India (2003). EXIM Bank Study ______(2008). Highlights European Commission Annual
Highlights Export Potential of Ayurveda and Siddha Products & Report 2008.
References
Services. Available from http://www.eximbankindia.com/
C R E AT I V E E C O N O M Y R E P O R T 2 0 1 0 275](https://image.slidesharecdn.com/unctad-creativeeconomy-afeasibledevelopmentoption-110517093009-phpapp01/85/UNCTAD-Creative-Economy-A-feasible-development-option-305-320.jpg)
![______(2004). São Paulo Consensus: Report of the Eleventh Session German Commission for UNESCO, May 2007.
(document TD/412). ______(2007). Trade in Services and Development Implications
______(2004). Summary of High-level Panel on Creative Industries (document TD/B/COM.1.85), Geneva, UNCTAD.
(document TD/L.379). ______(2007). Creative Economy and Industries Newsletter,
______(2004). The Least Developed Countries Report. Geneva, No. 5, April, p.3.
UNCTAD. ______(2007). Creative Economy and Industries Newsletter,
______(2004). The Music Industry in Senegal: The Potential for No. 6.
Economic Development. Report prepared by Andy Pratt for ______(2008). Creative Economy e-News No. 7, May.
UNCTAD. Available from http://www.lse.ac.uk/collec-
tions/geographyAndEnvironment/whosWho/profiles/p ______(2008). Creative Economy e-News No. 8, December.
ratt/pdf/Senegal.pdf. ______(2008). Secretary-General’s high-level panel on the
______(2004). UNCTAD XI High-level Panel on Creative creative economy and industries for development. Pre-
Industries and Development Agenda. Available online at conference event, Geneva, 14-15 January 2008.
http://www.unctad.org/en/docs/tdximisc1_en.pdf. Background paper prepared by the UNCTAD secretariat
(document TD(XII)/BP/4, 17 January 2008).
______(2005). The Digital Divide: ICT Development Indices
2004, UNCTAD, Geneva. ______(2008). Outcome of the Secretary-General’s high-
level panel on the creative economy and industries for
______(2006). Analysis of Options for Implementing Disclosure of development. Pre-conference event, Geneva, 14-15
Origin Requirements in Intellectual Property Applications. Geneva, January 2008. Note prepared by the UNCTAD secretari-
UNCTAD. at (document TD/423, 7 February 2008).
______(2006). Creative Industries Division pamphlet, ______(2008). Globalization for Development: the inter-
“Creative Economy and Industries”. Geneva, UNCTAD. national trade perspective, UNCTAD, 2008 (UNC-
______(2006). Creative Economy and Industries Newsletter, N4, TAD/DITC/2007/1)
December, 2006. ______(2009). Creative Economy e-News No. 9, June.
______(2006). Information Economy Report 2006: The ______(2009). Creative Economy e-News No. 10, September.
Development Perspective (document UNCTAD|SDTE|
ECB| 2006|1). Geneva. (Sales no. E.06.II.D.8). ______(2009). Creative Economy e-News No. 11, December,
2009.
______(2006). Trade and Development Report. Geneva, UNC-
TAD. ______(2009). Evolution of the international trading system and of
international trade from a development perspective: Impact of the crisis.
______(2006). Using ICTs to achieve growth and develop- UNCTAD document (TD/B/56/7), Geneva, September
ment, background paper (document TD/B/COM.3/ 2009.
EM.29/2), 11 September 2006. Available from
http://www.unctad.org/en/docs/c3em29d2_en.pdf. ______(2009). Information Economy Report: Trends and Outlook in
Turbulent Times. United Nations, New York and Geneva.
______(2007). Challenging Conventional Wisdom: Development
Implications of Trade in Services Liberalization, Trade, Poverty and ______(2009). Manual for the Production of Statistics on
Cross-cutting Development Issues, Study Series No. 2. the Information Economy, UNCTAD, New York and
(document [TD]UNCTAD/DITC/TAB/POV/2006/ Geneva.
1 UNCTAD, New York and Geneva. ______(2009). “The contribution of tourism to trade and
______(2007). Developing Countries in International Trade 2006: development.” Trade and Development Board, UNCTAD,
Trade and Development Index (UNCTAD/DITC/TAB/ Geneva.
2006/1). Geneva, UNCTAD. ______(2009). The Least Developed Countries Report 2009: The
______(2007). Reconciling cultural and international trade State and Development Governance. United Nations, New York
References
policies, paper by E. dos Santos, UNCTAD, presented at and Geneva.
the Conference on Cultural Diversity organized by the _____ (2010). Creative Economy e-News No. 12, April.
C R E AT I V E E C O N O M Y R E P O R T 2 0 1 0 277](https://image.slidesharecdn.com/unctad-creativeeconomy-afeasibledevelopmentoption-110517093009-phpapp01/85/UNCTAD-Creative-Economy-A-feasible-development-option-307-320.jpg)
![______(2010). Press Release, Geneva, January. ______(2000). World Cultural Report. Paris, UNESCO.
______(2010). Successful trade and development strategies ______(2003). Study on International Flows of Cultural Goods:
for mitigating the impact of the global economic and 1980-1998. Paris, UNESCO.
financial crises, UNCTAD(TD/B/C.I/7), Geneva. ______(2003). Workshop on Culture and Development in NEPAD’s
February, 2010. Programme of Action. Workshop report.
______(2010). The contribution of tourism to trade and ______(2004). “Take Note! The (Re)Naissance of the
development. (TD/B/C.I/8), Geneva, February. Music Industry in Sub-Saharan Africa”. Paper prepared
_____ (2010). Trade liberalization and informality: new by Cecile Ambert of Development Works for The Global
stylized facts, UNCTAD Policy issues in international Alliance for Cultural Diversity, Division of Arts and
trade and commodities study series, No. 43, Geneva 2010, Cultural Enterprise, UNESCO, Paris.
by Marco Fugazza and Norbert Fiess. http://www.unc- ______(2005). African Music: New Challenges, New Vocations,
tad.org/en/docs/itcdtab44_en.pdf prepared by Tchebwa, M.
UNCTAD-ICTSD (2005). Resource Book on TRIPS and ______(2005). Convention on the Protection and promo-
Development. tion of the Diversity of Cultural expressions [online].
UNCTAD-ICTSD: Project on IPRs and Sustainable Available from http://unesdoc.unesco.org/umages/
Development. Geneva. 0014/01429/142919e.pdf.
UNDP (2004). Human Development Report: Cultural Liberty in ______(2005). International Flows of Selected Cultural Goods and
Today’s Diverse World. New York, published for the United Services, 1994-2003.
Nations Development Programme. ______(2005). Ten Keys to the Convention on the Protection and
_____(2010). Tip of the Iceberg, Series Sharing Knowledge Promotion of the Diversity of Cultural Expressions.
for the UNDP- Regional Centre, Panama. Dr. Suzanne ______(2006). Framework for National Capacity Building Projects
Burke, 5 February 2010. for Statistics on Cultural Industries. Revised draft (PA).
United Nations Environment Programme. Website page on ______(2006). Trends in Audiovisual Markets: Regional Perspectives
ecotourism. Division of Technology, Industry, and from the South (document CI/COM/2006/PUB/10).
Environment. Sustainable Consumption and Production UNESCO, Paris.
Branch. Available at www.unep.fr/scp/tourism/topics/
______(2006). The Audiovisual Markets in Developing Countries:
ecotourism.
Statistical assessment centred on 11 countries. Study conducted by
UNESCO (1982). Cultural Industries: A Challenge for the Future Emmanuel Cocq and Florence Levy.
of Culture. Paris, UNESCO.
______(2006). Understanding Creative Industries: Cultural
______(1988). World cultural report. Paris, UNESCO. Statistics for Public-Policy Making. UNESCO, Paris.
______(1993). Les droits culturels: projet de déclaration. ______(2007). L’UNESCO et la question de la diversité culturelle
Switzerland, Editions Universitaires, Université de 1946-2007, Bilan et stratégies (internal document).
Fribourg. CLT/CPD.
______(1997). UNESCO/ITC Symposium on Crafts and the ______(2009). Investing in Cultural Diversity and Intercultural
International Market: Trade and Customs Codification. Manila. Dialogue, Paris, UNESCO.
______(1998). Culture, Creativity and Markets, UNESCO ______(2009). The Creative Cities Network: A Global
World Report Series. Platform for Local Endeavor. UNESCO, Paris.
______(1999). The Florence Agreement and Its Protocol of Nairobi. ______(2009). 2009 UNESCO framework for cultural statistics.
Paris. UNESCO, Institute for Statistics, Montreal, Canada.
______(2000). Copyright: Engine of Development, prepared by ______(2009). “Cultural employment: Using the
References
Oman, Ralph. International Standard Classification of Occupations”, in
278 C R E AT I V E E C O N O M Y R E P O R T 2 0 1 0](https://image.slidesharecdn.com/unctad-creativeeconomy-afeasibledevelopmentoption-110517093009-phpapp01/85/UNCTAD-Creative-Economy-A-feasible-development-option-308-320.jpg)


This document provides an embargo on summarizing or quoting the contents of the attached report before 15 December 2010 at 17:00 GMT. The report was produced through collaboration between UNCTAD and UNDP on the topic of the creative economy. It presents a United Nations system-wide perspective on the creative economy as an example of inter-agency cooperation.


![[Academic Research Project] Challenges and opportunities of social networks f...](https://cdn.slidesharecdn.com/ss_thumbnails/researchproject-socialmedia-v2-121004045052-phpapp02-thumbnail.jpg?width=640&height=640&fit=bounds)


