Downloaded 323 times
![“How are we expecting [advertisers] to take [the mobile phone] as an advertising device seriously if we
keep telling them about the unbelievable complexity that arises out of the fact that we have 20 carriers
in the US, 2 basic technologies – GSM and CDMA, and 2 downloadable standards – BREW and J2ME with
different versions on different handsets, and then we have mobile TV and VCast but only on some
handsets for $50/month. Why don’t you add a few more complexities and then talk to the advertisers
and say – Why don’t you spend a few thousand dollars on mobile advertising to try out, it’s really fun!
That’s why iPhone version 1.0 has such a high penetration! It’s simple!”
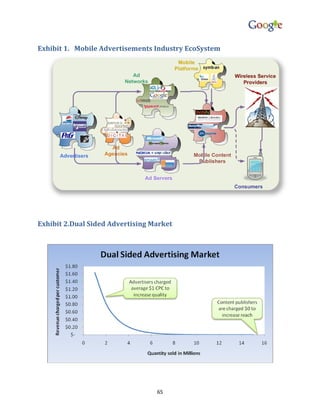
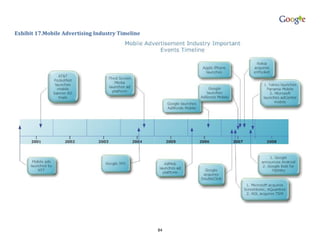
Ad platforms, advertisers, content providers and wireless service providers have to think
creatively and collaboratively to provide a very different way to distribute ads to mobile
phones. Standard banner ads don’t work on the smaller screen size of the mobile
phones. Dropping a successful business model that has worked so well on the internet
has been hard for the players. Innovation is required to make mobile ads successful.
Without that, the consumers will get annoyed and turned off with this model quickly.
Opportunities
No clear market leader established yet
There are smaller players in the industry where a lot of consolidation has been
happening. But nobody has been able to establish a clear market leadership position
yet. Admob serves about 2 Billion ad impressions per month. This is still very small
compared to the internet space. This provides a very lucrative opportunity for the
incumbents in internet ad networks and wireless service providers as they can tap into
their existing networks and fuel the market. Incumbents can also establish their
presence by acquiring market leaders in the space. This will help them learn the new
industry as well.
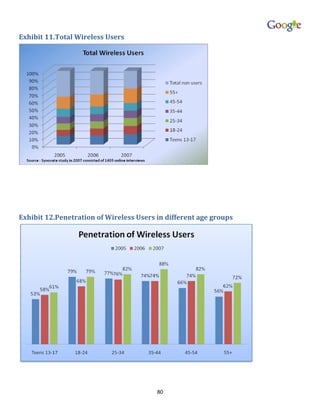
Data penetration projected to increase
There are several drivers behind this projection. The decelerating voice ARPUs has
motivated to push wireless data as the next growth area. The handsets available today
are more feature rich and are able to offer a great multimedia experience33. To go with
this, 4G networks will soon bring broadband capabilities to the phones making them
very powerful and useful devices. With FCC mandating the winner of the C block of 700
Mhz spectrum auction to open up its network, wireless service providers will have to
look at newer ways to monetize their networks.
31](https://image.slidesharecdn.com/googleteamandroidfinal-110115201206-phpapp01/85/Google-team-android_final-41-320.jpg)
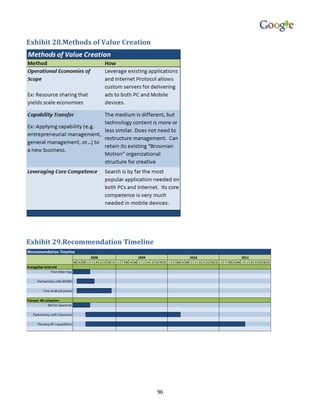
![conveys the confidence Google has in its own products, but also enables a more
reliable and user friendly product.
Organizational Structure and Controls
Andy Grove, founder of Intel Corp. observed, “From the outside it looks like Google’s
organizational structure is best described by . . . Brownian motion… in an expanding
bottle. Does [Eric Schmidt] think it will work forever?” In his video response, Eric
Schmidt confirms that the description is accurate, but only for its creative workforce.
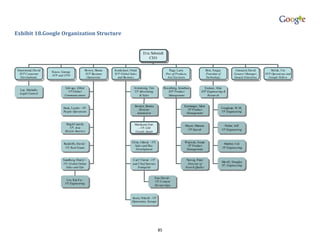
Google runs its finance, legal, investment, M&A and sales in a traditional way although
its creative side, engineering and R&D, can be described as Brownian motion. As seen
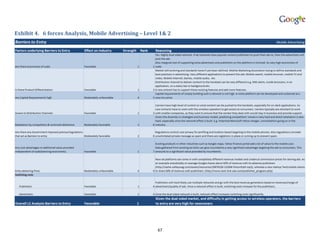
in their organizational chart in Exhibit 18, at the management level, the creative
workforce falls under the President (Products) and President (Technology). As
mentioned earlier, their Engineering and R&D departments do not follow a hierarchical
structure. Managers are more like tech leads who program at least half time. The
company follows agile programming throughout the company, which enables
programmers to move from one department to the other very easily. In most software
companies, corporate structure limits the movement of employees between projects,
resulting in employees being overworked and burnt out, thus reducing productivity,
innovation and morale. Google eliminates this by encouraging employees to move
between projects at any time without any questions asked. This prompts us to ask how
this system makes sure programmers don’t leave trouble projects behind with buggy
code, in short, what controls are used in monitoring appraising employee behavior. This
is where employee rewards / incentives come in. Reward levels are tied to the
importance of a project, so employees working on more important projects are rewarded
better. The environment can be best described as a bunch of start-ups within a
company. Since employees work on any idea that comes to their mind, they are
rewarded when their products turns out to be tremendously impactful.
So what are the rewards? - Financial rewards can be anything from gift certificates and
massage coupons to huge bonuses and stock option grants. Non financial rewards
include recognizing employees responsible for important product launches in quarterly
all-hands meeting by putting up their pictures and receiving applauds from everyone
35](https://image.slidesharecdn.com/googleteamandroidfinal-110115201206-phpapp01/85/Google-team-android_final-45-320.jpg)


The document is a detailed analysis of a capstone project focused on Google's strategic move into the mobile industry with the development of the Android platform. It includes an external and internal analysis of the mobile advertising and operating system industries, competitor analysis, recommendations for strategy implementation, and highlights Google's partnerships and ambitions to enhance mobile internet access while monetizing it through advertisements. Key suggestions include collaborating with handset manufacturers and focusing on local search and mobile TV to accelerate Android's market penetration.
![[Academic Research Project] Challenges and opportunities of social networks f...](https://cdn.slidesharecdn.com/ss_thumbnails/researchproject-socialmedia-v2-121004045052-phpapp02-thumbnail.jpg?width=640&height=640&fit=bounds)


![[Full Report] Barriers and Opportunities at the Base of the Pyramid - The Rol...](https://cdn.slidesharecdn.com/ss_thumbnails/undp-osd-barriersandopportunitiesbopfullreportweb-140822084014-phpapp01-thumbnail.jpg?width=640&height=640&fit=bounds)


