The document discusses the revision of the UN List of Industrial Products to better reflect today's economies and industries. Some key points:
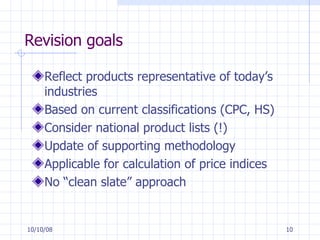
- The original 1973 list was out of date and needed revision to add new products and align with updated classifications like CPC and HS.
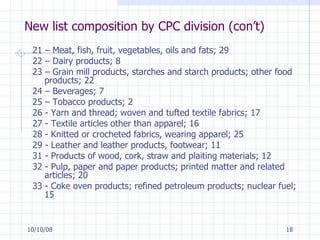
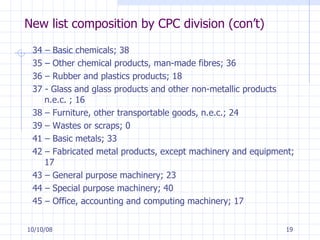
- The draft new list has 601 products, with 190 carried over unchanged and 366 new products added. It aims to provide balanced industry coverage across CPC divisions.
- Products are defined and coded based on the CPC, mostly at the subclass level or below. The list seeks to maintain historical production time series where possible.