Definition
UML isa standard language for specifying, visualizing,
constructing and documenting the artifacts of software
systems.
UML is different from the other programming languages like
Java, C++ but tools can be used to generate code in various
languages using UML diagrams.
UML is a pictorial language used to make software blue prints.
3.
Goals of UML
A picture is worth a thousand words, this absolutely fits while
discussing about UML.
UML diagrams are not only for developers but also for business users,
common people and anybody interested to understand the system. So it
must be clear that UML is not a development method rather it
accompanies with processes to make a successful system.
The goal of UML can be defined as a simple modelling mechanism to
model all possible practical systems in today’s complex environment.
4.
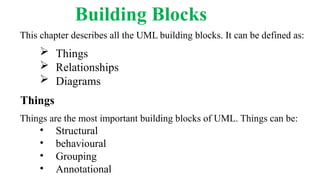
Building Blocks
This chapterdescribes all the UML building blocks. It can be defined as:
Things
Relationships
Diagrams
Things
Things are the most important building blocks of UML. Things can be:
• Structural
• behavioural
• Grouping
• Annotational
5.
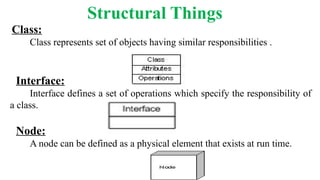
Structural Things
Class:
Class representsset of objects having similar responsibilities .
Interface:
Interface defines a set of operations which specify the responsibility of
a class.
Node:
A node can be defined as a physical element that exists at run time.
6.
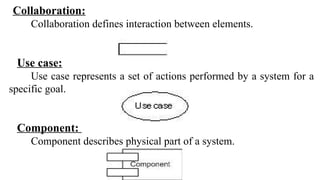
Collaboration:
Collaboration defines interactionbetween elements.
Use case:
Use case represents a set of actions performed by a system for a
specific goal.
Component:
Component describes physical part of a system.
7.
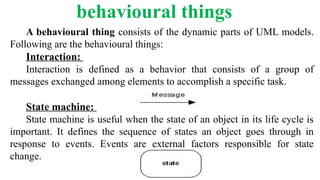
behavioural things
A behaviouralthing consists of the dynamic parts of UML models.
Following are the behavioural things:
Interaction:
Interaction is defined as a behavior that consists of a group of
messages exchanged among elements to accomplish a specific task.
State machine:
State machine is useful when the state of an object in its life cycle is
important. It defines the sequence of states an object goes through in
response to events. Events are external factors responsible for state
change.
8.
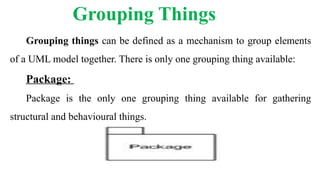
Grouping Things
Grouping thingscan be defined as a mechanism to group elements
of a UML model together. There is only one grouping thing available:
Package:
Package is the only one grouping thing available for gathering
structural and behavioural things.
9.
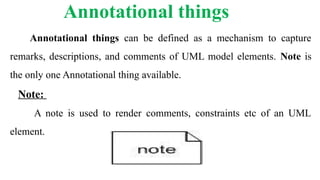
Annotational things
Annotational thingscan be defined as a mechanism to capture
remarks, descriptions, and comments of UML model elements. Note is
the only one Annotational thing available.
Note:
A note is used to render comments, constraints etc of an UML
element.
10.
Relationship
Relationship is anothermost important building block of UML. It
shows how elements are associated with each other and this association
describes the functionality of an application.
There are four kinds of relationships available.
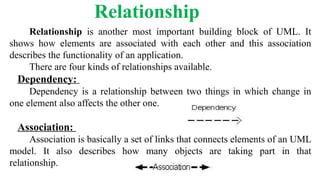
Dependency:
Dependency is a relationship between two things in which change in
one element also affects the other one.
Association:
Association is basically a set of links that connects elements of an UML
model. It also describes how many objects are taking part in that
relationship.
11.
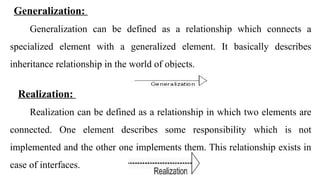
Generalization:
Generalization can bedefined as a relationship which connects a
specialized element with a generalized element. It basically describes
inheritance relationship in the world of objects.
Realization:
Realization can be defined as a relationship in which two elements are
connected. One element describes some responsibility which is not
implemented and the other one implements them. This relationship exists in
case of interfaces.
12.
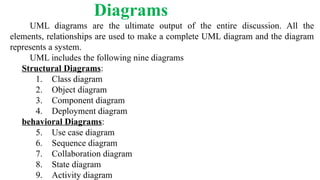
Diagrams
UML diagrams arethe ultimate output of the entire discussion. All the
elements, relationships are used to make a complete UML diagram and the diagram
represents a system.
UML includes the following nine diagrams
Structural Diagrams:
1. Class diagram
2. Object diagram
3. Component diagram
4. Deployment diagram
behavioral Diagrams:
5. Use case diagram
6. Sequence diagram
7. Collaboration diagram
8. State diagram
9. Activity diagram
13.
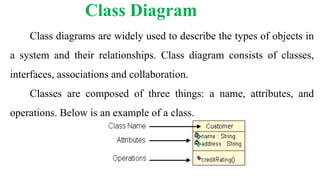
Class Diagram
Class diagramsare widely used to describe the types of objects in
a system and their relationships. Class diagram consists of classes,
interfaces, associations and collaboration.
Classes are composed of three things: a name, attributes, and
operations. Below is an example of a class.
14.
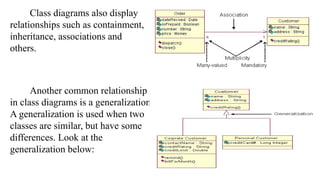
Class diagrams alsodisplay
relationships such as containment,
inheritance, associations and
others.
Another common relationship
in class diagrams is a generalization.
A generalization is used when two
classes are similar, but have some
differences. Look at the
generalization below:
15.
When to Use:Class Diagrams
Class diagrams are used in nearly all Object Oriented software designs.
Use them to describe the Classes of the system and their relationships to
each other.
How to Draw: Class Diagrams
Class diagrams are some of the most difficult UML diagrams to draw.
To draw detailed and useful diagrams a person would have to study UML
and Object Oriented principles for a long time. Therefore, this page will give
a very high level overview of the process.
16.
Object Diagram
Object diagramscan be described as an instance of class diagram.
So these diagrams are more close to real life scenarios where we
implement a system.
Object diagrams are a set of objects and their relationships just like
class diagrams and also represent the static view of the system.
The usage of object diagrams is similar to class diagrams but they
are used to build prototype of a system from practical perspective.
17.
Component Diagram
Component diagramsrepresent a set of components and their
relationships. These components consist of classes, interfaces or
collaborations.
So Component diagrams represent the implementation view of a system.
During design phase software artifacts (classes, interfaces etc) of a
system are arranged in different groups depending upon their relationship.
Now these groups are known as components.
Finally, component diagrams are used to visualize the implementation.
18.
Deployment Diagram
Deployment diagramsare a set of nodes and their relationships.
These nodes are physical entities where the components are deployed.
Deployment diagrams are used for visualizing deployment view
of a system. This is generally used by the deployment team.
Note: If the above descriptions and usages are observed carefully
then it is very clear that all the diagrams are having some relationship
with one another. Component diagrams are dependent upon the
classes, interfaces etc which are part of class/object diagram. Again the
deployment diagram is dependent upon the components which are
used to make a component diagrams.
19.
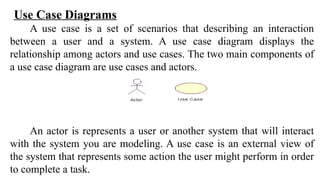
Use Case Diagrams
Ause case is a set of scenarios that describing an interaction
between a user and a system. A use case diagram displays the
relationship among actors and use cases. The two main components of
a use case diagram are use cases and actors.
An actor is represents a user or another system that will interact
with the system you are modeling. A use case is an external view of
the system that represents some action the user might perform in order
to complete a task.
20.
When to Use:Use Cases Diagrams
Use cases are used in almost every project. These are helpful in
exposing requirements and planning the project. During the initial
stage of a project most use cases should be defined, but as the project
continues more might become visible.
How to Draw: Use Cases Diagrams
Use cases are a relatively easy UML diagram to draw, but this is
a very simplified example. Start by listing a sequence of steps a user
might take in order to complete an action.
21.
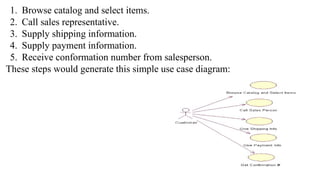
1. Browse catalogand select items.
2. Call sales representative.
3. Supply shipping information.
4. Supply payment information.
5. Receive conformation number from salesperson.
These steps would generate this simple use case diagram:
22.
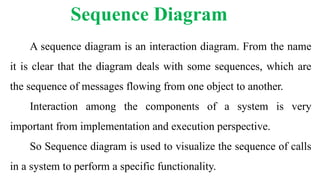
A sequence diagramis an interaction diagram. From the name
it is clear that the diagram deals with some sequences, which are
the sequence of messages flowing from one object to another.
Interaction among the components of a system is very
important from implementation and execution perspective.
So Sequence diagram is used to visualize the sequence of calls
in a system to perform a specific functionality.
Sequence Diagram
23.
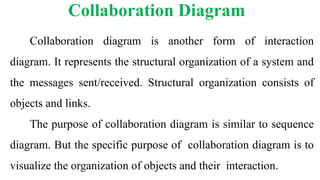
Collaboration diagram isanother form of interaction
diagram. It represents the structural organization of a system and
the messages sent/received. Structural organization consists of
objects and links.
The purpose of collaboration diagram is similar to sequence
diagram. But the specific purpose of collaboration diagram is to
visualize the organization of objects and their interaction.
Collaboration Diagram
24.
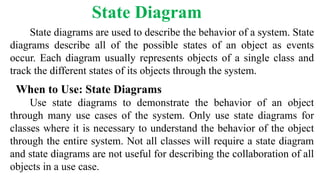
State diagrams areused to describe the behavior of a system. State
diagrams describe all of the possible states of an object as events
occur. Each diagram usually represents objects of a single class and
track the different states of its objects through the system.
When to Use: State Diagrams
Use state diagrams to demonstrate the behavior of an object
through many use cases of the system. Only use state diagrams for
classes where it is necessary to understand the behavior of the object
through the entire system. Not all classes will require a state diagram
and state diagrams are not useful for describing the collaboration of all
objects in a use case.
State Diagram
25.
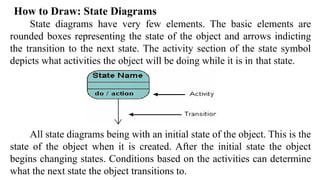
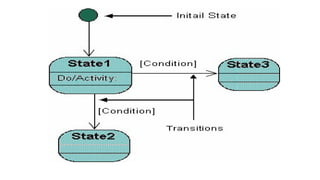
How to Draw:State Diagrams
State diagrams have very few elements. The basic elements are
rounded boxes representing the state of the object and arrows indicting
the transition to the next state. The activity section of the state symbol
depicts what activities the object will be doing while it is in that state.
All state diagrams being with an initial state of the object. This is the
state of the object when it is created. After the initial state the object
begins changing states. Conditions based on the activities can determine
what the next state the object transitions to.
27.
Activity diagrams describethe workflow behaviour of a system.
Activity diagrams are similar to state diagrams because activities are the state
of doing something. The diagrams describe the state of activities by showing
the sequence of activities performed. Activity diagrams can show activities
that are conditional or parallel.
When to Use: Activity Diagrams
Activity diagrams should be used in conjunction with other modeling
techniques such as interaction diagrams and state diagrams. The main reason
to use activity diagrams is to model the workflow behind the system being
designed. Activity Diagrams are also useful for:
analyzing a use case by describing what actions need to take place and
when they should occur; describing a complicated sequential algorithm; and
modeling applications with parallel processes.
Activity Diagrams
28.
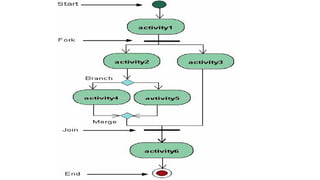
How to Draw:Activity Diagrams
Activity diagrams show the flow of activities through the system.
Diagrams are read from top to bottom and have branches and forks to
describe conditions and parallel activities. A fork is used when
multiple activities are occurring at the same time.
The diagram below shows a fork after activity1. This indicates
that both activity2 and activity3 are occurring at the same time. After
activity2 there is a branch. The branch describes what activities will
take place based on a set of conditions. All branches at some point are
followed by a merge to indicate the end of the conditional behavior
started by that branch. After the merge all of the parallel activities
must be combined by a join before transitioning into the final activity
state