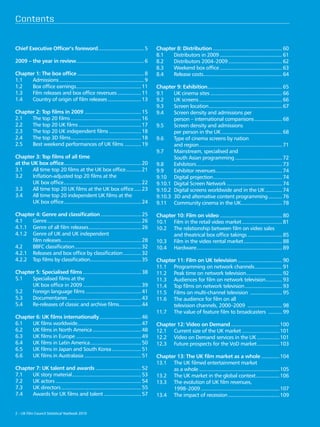
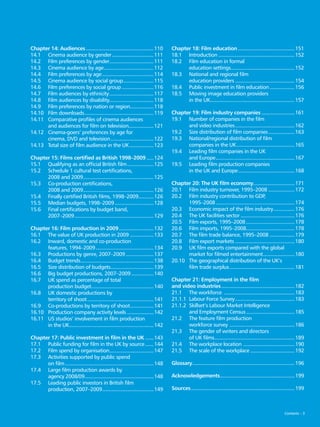
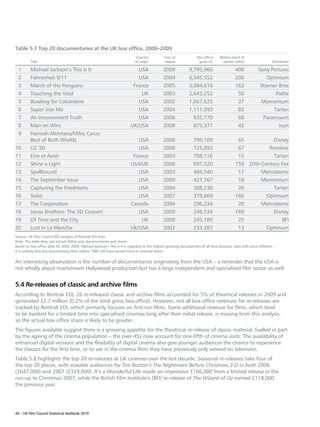
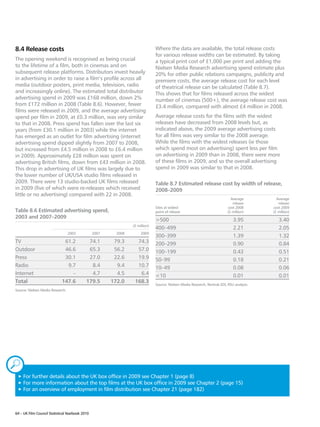
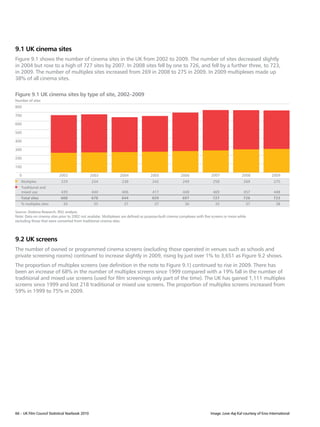
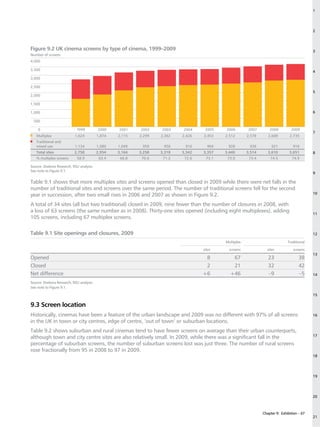
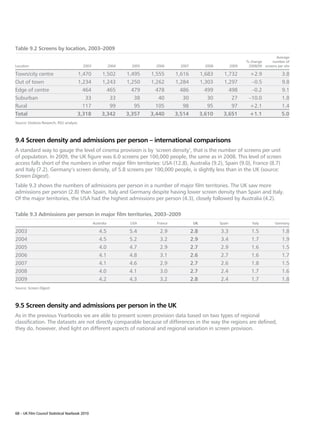
Statistical Yearbook 2010
UK Film Council
10 Little Portland Street
London W1W 7JG
T +44 (0)20 7861 7861
F +44 (0)20 7861 7862
This Statistical Yearbook
is available online at
www.ukfilmcouncil.org.uk
Welcome to the 2010 UK Film Council
Statistical Yearbook. This yearbook, the
eighth we have published, is a rich source
of industry data and analysis on film in the
UK. This publication is one of the ways we
deliver on our commitment to evidence-
based film policy. We hope you enjoy this
yearbook and find it useful.
Contents


Chief Executive Officer’s foreword. ................................ 5
                                  .                                                    Chapter 8: Distribution................................................... 60
                                                                                       8.1	  Distributors in 2009.............................................. 61
2009 – the year in review................................................. 6
                         .                                                             8.2	  Distributors 2004–2009........................................ 62
                                                                                       8.3	  Weekend box office.............................................. 63
Chapter 1: The box office................................................. 8           8.4	  Release costs......................................................... 64
                                                                                                           .
1.1	  Admissions.............................................................. 9
1.2	  Box office earnings............................................... 11
                             .                                                         Chapter 9: Exhibition...................................................... 65
                                                                                                                  .
1.3	  Film releases and box office revenues.................. 11                       9.1	    UK cinema sites..................................................... 66
1.4	  Country of origin of film releases......................... 13                   9.2	    UK screens............................................................. 66
                                                                                       9.3	    Screen location. .................................................... 67
                                                                                                                   .
Chapter 2: Top films in 2009.......................................... 15              9.4	    Screen density and admissions per
2.1	  The top 20 films.................................................... 16          	       person – international comparisons..................... 68
2.2	  The top 20 UK films.............................................. 17             9.5	    Screen density and admissions
2.3	  The top 20 UK independent films........................ 18                       	       per person in the UK............................................. 68
2.4	  The top 3D films................................................... 18
                        .                                                              9.6	    Type of cinema screens by nation
2.5	  Best weekend performances of UK films............. 19                            	       and region............................................................. 71
                                                                                       9.7	    Mainstream, specialised and
Chapter 3: Top films of all time                                                       	       South Asian programming................................... 72
at the UK box office........................................................ 20
                      .                                                                9.8	    Exhibitors. ............................................................. 73
                                                                                                          .
3.1	    All time top 20 films at the UK box office. .......... 21  .                   9.9	    Exhibitor revenues. ............................................... 74
                                                                                                                        .
3.2	    Inflation-adjusted top 20 films at the                                         9.10	 Digital projection.................................................. 74
                                                                                                                      .
	       UK box office. ....................................................... 22
                      .                                                                9.10.1	 Digital Screen Network......................................... 74
3.3	    All time top 20 UK films at the UK box office...... 23                         9.10.2	 Digital screens worldwide and in the UK............. 74
3.4	    All time top 20 independent UK films at the                                    9.10.3	 3D and alternative content programming........... 76
	       UK box office. ....................................................... 24
                      .                                                                9.11	 Community cinema in the UK.............................. 78
                                                                                                                                          .

Chapter 4: Genre and classification.............................. 25                   Chapter 10: Film on video.............................................. 80
4.1	   Genre..................................................................... 26   10.1	 Film in the retail video market.............................. 81
4.1.1	 Genre of all film releases...................................... 26
                                           .                                           10.2	 The relationship between film on video sales
4.1.2	 Genre of UK and UK independent                                                  	     and theatrical box office takings.......................... 85
	      film releases.......................................................... 28
                       .                                                               10.3	 Film in the video rental market. ........................... 88
                                                                                                                                       .
4.2	   BBFC classification................................................. 32         10.4	 Hardware.............................................................. 89
                                                                                                        .
4.2.1	 Releases and box office by classification.............. 32
4.2.2	 Top films by classification..................................... 35             Chapter 11: Film on UK television................................. 90
                                                                                       11.1	 Programming on network channels.................... 91
                                                                                                                                     .
Chapter 5: Specialised films........................................... 38             11.2	 Peak time on network television.......................... 92
                                                                                                                               .
5.1	  Specialised films at the                                                         11.3	 Audiences for film on network television............ 93
                                                                                                                                             .
	     UK box office in 2009........................................... 39              11.4	 Top films on network television............................ 93
5.2	  Foreign language films......................................... 41               11.5	 Films on multi-channel television ........................ 95
5.3	  Documentaries...................................................... 43           11.6	 The audience for film on all
5.4	  Re-releases of classic and archive films................ 44
                                                         .                             	     television channels, 2000–2009 .......................... 98
                                                                                       11.7	 The value of feature film to broadcasters ........... 99
Chapter 6: UK films internationally............................... 46
6.1	  UK films worldwide.............................................. 47
                          .                                                            Chapter 12: Video on Demand....................................100
6.2	  UK films in North America.................................... 48                 12.1	 Current size of the UK market............................101
6.3	  UK films in Europe................................................ 49            12.2	 Video on Demand services in the UK.................101
6.4	  UK films in Latin America..................................... 50
                                   .                                                   12.3	 Future prospects for the VoD market.................103
6.5	  UK films in Japan and South Korea...................... 51
6.6	  UK films in Australasia.......................................... 51             Chapter 13: The UK film market as a whole..............104
                                                                                       13.1	 The UK filmed entertainment market
Chapter 7: UK talent and awards.................................. 52                   	     as a whole...........................................................105
7.1	  UK story material.................................................. 53
                            .                                                          13.2	 The UK market in the global context. ................106
                                                                                                                                                 .
7.2	  UK actors............................................................... 54      13.3	 The evolution of UK film revenues,
7.3	  UK directors........................................................... 55       	     1998–2009..........................................................107
7.4	  Awards for UK films and talent............................ 57                    13.4	 The impact of recession......................................109


2 – UK Film Council Statistical Yearbook 2010
Chapter 14: Audiences..................................................110          Chapter 18: Film education..........................................151
14.1	 Cinema audience by gender...............................111                   18.1	 Introduction........................................................152
14.2	 Film preferences by gender................................111
                                        .                                           18.2	 Film education in formal
14.3	 Cinema audience by age....................................112
                                    .                                               	     education settings..............................................152
                                                                                                                  .
14.4	 Film preferences by age......................................114              18.3	 National and regional film
14.5	 Cinema audience by social group......................115
                                                  .                                 	     education providers............................................154
14.6	 Film preferences by social group........................116                   18.4	 Public investment in film education...................156
14.7	 Film audiences by ethnicity. ...............................117
                                        .                                           18.5	 Moving image education providers
14.8	 Film audiences by disability................................118               	     in the UK.............................................................157
                                                                                                    .
14.9	 Film preferences by nation or region.................118
                                                       .
14.10	 Film downloads. .................................................119
                         .                                                          Chapter 19: Film industry companies.........................161
14.11	 Comparative profiles of cinema audiences                                     19.1	 Number of companies in the film
	      and audiences for film on television..................121
                                                      .                             	     and video industries............................................162
14.12	 Cinema-goers’ preferences by age for                                         19.2	 Size distribution of film companies....................163
	      cinema, DVD and television................................122                19.3	 National/regional distribution of film
14.13	 Total size of film audience in the UK..................123                   	     companies in the UK...........................................165
                                                                                    19.4	 Leading film companies in the UK
Chapter 15: Films certified as British 1998–2009......124                           	     and Europe. ........................................................167
                                                                                                       .
15.1	 Qualifying as an official British film....................125                 19.5	 Leading film production companies
15.2	 Schedule 1 cultural test certifications,                                      	     in the UK and Europe.........................................168
                                                                                                                     .
	     2008 and 2009...................................................125
                        .
15.3	 Co-production certifications,                                                 Chapter 20: The UK film economy..............................171
	     2008 and 2009...................................................126
                        .                                                           20.1	 Film industry turnover, 1995–2008....................172
15.4	 Finally certified British films, 1998–2009...........126.                     20.2	 Film industry contribution to GDP,
15.5	 Median budgets, 1998–2009.............................128                     	      1995–2008..........................................................174
15.6	 Final certifications by budget band,                                          20.3	 Economic impact of the film industry................176
	     2007–2009..........................................................129        20.4	 The UK facilities sector........................................176
                                                                                    20.5	 Film exports, 1995–2008....................................178
Chapter 16: Film production in 2009..........................132                    20.6	 Film imports, 1995–2008...................................178
                                                                                                                           .
16.1	 The value of UK production in 2009..................133                       20.7	 The film trade balance, 1995–2008...................179
16.2	 Inward, domestic and co-production                                            20.8	 Film export markets............................................180
	      features, 1994–2009. .........................................134
                                   .                                                20.9	 UK film exports compared with the global
16.3	 Productions by genre, 2007–2009.....................137                       	      market for filmed entertainment.......................180
                                                                                                                                       .
16.4	 Budget trends.....................................................138
                        .                                                           20.10	 The geographical distribution of the UK’s
16.5	 Size distribution of budgets...............................139
                                              .                                     	      film trade surplus................................................181
16.6	 Big budget productions, 2007–2009.................140
16.7	 UK spend as percentage of total                                               Chapter 21: Employment in the film
	      production budget.............................................140
                                .                                                   and video industries......................................................182
16.8	 UK domestic productions by                                                    21.1	 The workforce ....................................................183
	      territory of shoot.................................................141       21.1.1	 Labour Force Survey............................................183
16.9	 Co-productions by territory of shoot.................141
                                                            .                       21.1.2	 Skillset’s Labour Market Intelligence
16.10	 Production company activity levels....................142                    	       and Employment Census....................................185
16.11	 US studios’ involvement in film production                                   21.2	 The feature film production
	      in the UK.............................................................142
                  .                                                                 	       workforce survey . ..............................................186
                                                                                    21.3	 The gender of writers and directors
Chapter 17: Public investment in film in the UK.......143                           	       of UK films..........................................................189
                                                                                                         .
17.1	 Public funding for film in the UK by source.......144                         21.4	 The workplace location . ....................................190
17.2	 Film spend by organisation................................147
                                              .                                     21.5	 The scale of the workplace.................................192
17.3	 Activities supported by public spend
	     on film.................................................................148   Glossary..........................................................................196
                                                                                            .
17.4	 Large film production awards by
	     agency 2008/09..................................................148
                            .                                                       Acknowledgements......................................................199
                                                                                                    .
17.5	 Leading public investors in British film
	     production, 2007–2009. ....................................149
                                         .                                          Sources............................................................................199


                                                                                                                                                             Contents – 3
The UK Film Council                                   We do this by supporting the UK film industry,
                                                      celebrating our film culture, and nurturing

is the Government-                                    our film talent.
                                                      We fund film development and production, short

backed lead agency                                    filmmaking, distribution, film education, festivals, skills
                                                      development, and digital innovation initiatives for film.

for film in the UK and                                Our work also encourages inward investment into the
                                                      UK film production sector, the export of British films to

our aim is to ensure
                                                      international markets and fosters UK co-production with
                                                      international partners. We fund and support the British

that audiences at
                                                      Film Institute, the UK’s National and Regional Screen
                                                      Agencies and the MEDIA Desk UK. Our work also extends
                                                      to research, statistics and market intelligence to support
home and abroad                                       the development of the UK film sector and combating
                                                      film theft. The Certification Unit for qualifying British
can enjoy great                                       films is also part of the UK Film Council.


British films.


We want to ensure that there are no barriers to
accessing our publications. If you, or someone you
know, would like a large print, audiotape or an
alternative version of this report, please contact:
Communications Department
UK Film Council
10 Little Portland Street
London W1W 7JG
Email: info@ukfilmcouncil.org.uk
Tel: +44 (0) 20 7861 7884
Fax: +44 (0) 20 7861 7863
www.ukfilmcouncil.org.uk
http://www.ukfilmcouncil.org.uk


4 – UK Film Council Statistical Yearbook 2010
Chief Executive Officer’s foreword


                                The 2010 Statistical Yearbook, compiled by the UK Film
                                Council’s Research and Statistics Unit, once again
                                presents the most comprehensive picture of film
                                in the UK.
                                And this year, for the first time, the Yearbook moves
                                fully online, making it an even more accessible,
                                open and valuable resource, and one which,
                                depending on your needs, can be explored online,
                                downloaded or printed either in whole or in part.
                                All aspects of the film sector are captured here, offering
                                a compelling insight into the ways in which audiences
                                across the UK are discovering, accessing and enjoying
                                film and film culture, underlining the continued success
                                that British films and filmmakers are enjoying both
                                at home and on the world stage, and, perhaps most
                                informatively of all, shedding light on the rapidly
                                evolving patterns in the financing, production,
                                exhibition and distribution of film.
                                The sheer breadth and depth of statistics contained here
                                mean that they can be analysed any number of ways.
                                What is undeniable, however, is their ability to highlight
                                once again the growing value of the UK film industry,
                                the enduring strength of our creative talent and the vital
                                role that films and film culture play in the life of millions
                                of people up and down the UK.
                                We must all continue to work hard, therefore, to ensure
                                that the infrastructure, support and funding systems
                                remain in place to allow British film to prosper and
                                succeed in this digital age.


                                John Woodward
                                Chief Executive Officer
                                UK Film Council


                                                                  Chief Executive Officer’s foreword – 5
2009 – the year in review


2009 was the year cinema bucked the recession.              The UK appetite for specialised films seems to be rising.
UK cinema visits of 174 million made 2009 the second        As the total number of releases has risen over the last
highest year for admissions since 1971, while the UK        10 years, the proportion of specialised films has increased
box office grew to a record £944 million. The arrival       from 58% to 69%, taking 15% of the box office in 2009.
of 3D made a vital contribution. In its new consumer-       This suggests a steady broadening of cinematic tastes.
friendly form, 3D established itself as the viewing         Documentaries, for example, have risen from negligible
experience of choice for action, adventure, animation       numbers and takings in 2000–2002 to 56 feature
and fantasy films.                                          documentary releases in 2009, earning £12 million
                                                            at the box office, led by Michael Jackson’s This Is It.
Avatar was the run-away box office success of 2009,
generating more in 3D takings alone than the total          2009 was an excellent year overall for film production
gross of any other 2009 film. Still on release in April     in the UK, with studios busy with inward investment
2010, with UK box office takings of over £91 million,       films such as Harry Potter and the Deathly Hallows,
it displaced Titanic at the top of our inflation-adjusted   Robin Hood, Gulliver’s Travels and Clash of the Titans.
all-time top 20 UK box office chart. It was the only film   The UK spend of inward investment films reached
of 2009 to break into this chart.                           £753 million, the highest on record, while the total
                                                            UK spend of £957 million was, after 2003, the second
Three UK films had a particular impact at the UK and
                                                            best year on record. However, within this positive scene,
international box office in 2009: Harry Potter and the
                                                            domestic UK films had a tougher time, finding it harder
Half-Blood Prince continued the dominance of the
                                                            to raise money and lowering their budgets as a result.
schoolboy wizard franchise, while Slumdog Millionaire
                                                            Co-productions have been most affected by changes
hit the jackpot as the most successful-ever UK
                                                            in the regulatory and economic environment. Only 22
independent film. The third most popular UK film of
                                                            were made in 2009, with a combined UK spend of
the year, Sherlock Holmes, confirmed the enduring
                                                            £35 million.
appeal of characters from classic British fiction.
                                                            Public funding for the UK film sector fell slightly in
Other UK independent films to win significant
                                                            2008/09, to £256 million, from £261 million the
audiences in 2009 included St Trinian’s 2: The Legend
                                                            previous year. Within this total, tax relief for UK film
of Fritton’s Gold, Nativity, Harry Brown, Dorian Gray
                                                            production again made the single biggest contribution,
and In the Loop.
                                                            at £110 million.
UK producers have sometimes been criticised for
producing too many ‘dramas’ rather than films in
more popular genres, however our analysis of UK
independent films in 2009 (Chapter 4) shows a genre
range not too dissimilar from all films with only 24%
being in the drama category. However, the proportion
of the box office taken by different genres is strongly
affected by the performance of particular titles.
Amongst UK independent films in 2009, drama took
45% of the box office, due primarily to the success
of Slumdog Millionaire.


                                                            Specialised film’s share


                                                            15%
                                                            of the UK box office

UK box office


£944m
6 – UK Film Council Statistical Yearbook 2010
Amongst the film activities supported by public             In television, though film audiences on the main
investment is film education. This year, for the first      broadcast channels continued to fall, strong growth
time, we present data that show the wide reach of           was recorded in both subscription film channels and
film education in the UK – from 2009’s 6,674 A Level        free-to-air digital multi-channel. The latter now
film studies candidates to the 392,000 children who         accounts for a third of all film watching on television.
attended screenings as part of National Schools Film        While cinema is key for new releases, it remains the
Week. By the end of 2009 there were almost 3,000            case that most film watching in the UK takes place
school film clubs across the UK (involving 92,000           on television. In 2009, we estimate that television
pupils) and 355 providers of moving image education         accounted for 75% of total film viewing occasions
outside the school or university classroom. The rapid       in the UK.
expansion of film education and its extensive reach
                                                            Regular readers of the Statistical Yearbook will notice
shows the value of film as a tool to engage learners
                                                            some additions this year:
and its relevance in equipping students (both children
and adults) to participate fully in the growing             •	  etails of the production and/or performance
                                                               D
digital economy.                                               of UK independent films (various chapters).
                                                               This reflects requests from readers in our user
Film and moving image education begins a process
                                                               survey in August 2009 for more information
that leads to audience appreciation for UK films and
                                                               about UK independent films;
Oscars® and BAFTAs for British talent. Brits continued
their winning ways in 2009 with Slumdog Millionaire         •	  10-year time series of the performance of
                                                               A
taking six Oscars® including Best Picture and Best             specialised films at the UK box office (Chapter 5);
Achievement in Directing (Danny Boyle), while Kate
                                                            •	  he box office performance of UK films in Japan
                                                               T
Winslet won Best Actress for her role in The Reader,
                                                               and Korea (Chapter 6);
Michael O’Connor took Best Achievement in Costume
Design for The Duchess and James Marsh and Simon            •	  chart of UK admissions going back 75 years
                                                               A
Chin won Best Documentary Feature for Man on Wire,             (1935–2009 inclusive) for historical comparative
the gripping story of Philippe Petit’s tightrope walk          purposes (Chapter 1);
between the twin towers of the New York World Trade         •	  new chapter on film education, gathering for the
                                                               A
Centre in 1974. In total, British talent accounted for         first time the available statistics on film education at
17% of the awards at the leading ceremonies and                school, university and in the community. It is intended
festivals we monitor – the Oscars®, the BAFTAs, Berlin,        that this will serve as the basis for wider coverage of
Sundance, Cannes, Venice and Toronto.                          the cultural aspects of film in the future.
While admissions and box office were up in 2009,            We welcome feedback on the Yearbook and we
revenue for the film market as a whole was static           thank those who gave us their ideas in 2009/10.
compared with 2008, showing the challenges of both          All of the information is available to view online
the recession and the transition to digital. The physical   at www.ukfilmcouncil.org.uk.
video markets (rental and retail) shrank in 2009 while
video on demand (VoD) grew. However, the potential          David Steele
of digital VoD has yet to be fully realised and the         Head of Research and Statistics Unit
growth in VoD was not enough to offset the decline          Sean Perkins
in physical video.                                          Senior Research Executive
                                                            Nick Maine
                                                            Research Executive


UK production spend


£957m
                                                                                                   2009 – the year in review – 7
Chapter 1:
The box office


Despite the recession the UK     Facts in focus

box office saw record receipts   •  K cinema admissions reached 173.5 million, up 6%
                                   U
                                   on 2008.
and the highest admissions       •  ox office receipts were £944 million, up 11% on 2008.
                                   B
since 2002. One of the main      •  03 films were released for a week or more in the UK
                                   5
drivers of this growth was the     and Republic of Ireland.

emergence of 3D cinema, with     •  K films, including co-productions, accounted for 23%
                                   U
                                   of releases and 17% of the market by value.
a string of popular titles       •  he top 100 films earned over 91% of the gross
                                   T
including Avatar, Ice Age III      box office.
and Up.                          •  D films accounted for 16% of UK and Republic of
                                   3
                                   Ireland box office revenues in 2009 (£176 million),
                                   up from just 0.4% in 2008.
1


                                                                                                                                                                      2


1.1 Admissions                                                                 The April release of another 3D animated title, Monsters                               3
                                                                               vs. Aliens and action thriller Fast  Furious increased
The 173.5 million cinema admissions recorded for the                           ticket sales by 41% compared with April 2008 and a raft
UK in 2009 were up 5.6% on 2008 (Figure 1.1), the                              of major studio releases such as X-Men Origins:
highest since 2002 and the second highest since 1971.                          Wolverine, Star Trek, Angels and Demons and Night at
                                                                                                                                                                      4
Admissions also increased in most other European                               the Museum 2 continued to lift admissions in May.
territories – German admissions rose by 13%, French                            Surprise hit comedy The Hangover and franchise films
admissions by 6% and there were also increased ticket                          Terminator Salvation and Transformers: Revenge of the                                  5
sales in Spain (up 3%, the first increase in five years)                       Fallen contributed to the 6% increase in June
and Russia (12%).                                                              admissions. Admissions across the summer months
                                                                               failed to match the levels of 2008, when Mamma Mia!                                    6

Figure 1.1 Annual UK admissions, 2000–2009                                     and The Dark Knight earned over £110 million between
Million                                                                        them, but the sixth instalment of the Harry Potter series,
200                                                                            Harry Potter and the Half-Blood Prince, was released in                                7
                                                                               July and went on to gross almost £51 million. Ice Age III
150                                                                            was also released in July and grossed over £35 million,
                                                                               with over half of that from 3D screens. The release of                                 8
                                                                               another 3D animation, Up, and the second film in the
100
                                                                               Twilight series, Twilight Saga: New Moon boosted
                                                                               autumn admissions and the year ended with the highest                                  9
 50                                                                            December admissions for four years as Avatar became
                                                                               the widest released and most successful 3D film to date.
  0               00        01   02   03    04    05   06   07   08    09                                                                                             10

Source: CAA, Rentrak EDI.                                                      Table 1.1 Monthly UK cinema admissions, 2008–2009
                                                                                                                          2008              2009            % +/–
                                                                               Month                                   (million)         (million)        on 2008     11
                                                                      Total
                                                                 admissions
                                                                               January                                 13.5               14.5            +7.7
Year                                                               (million)   February                                12.9               15.0           +16.4
                                                                                                                                                                      12
2000                                                               142.5       March                                   12.2               11.9            –2.3
2001                                                               155.9       April                                    9.8               13.8           +40.8
2002                                                               175.9       May                                     12.7               15.8           +24.0        13
2003                                                               167.3       June                                    11.8               12.5            +5.6
2004                                                               171.3       July                                    21.4               20.0            –6.4
2005                                                               164.7       August                                  20.4               15.5           –23.8
                                                                                                                                                                      14

2006                                                               156.6       September                               10.7                9.7            –9.0
2007                                                               162.4       October                                 13.0               13.5            +3.8        15
2008                                                               164.2       November                                13.5               14.9           +10.4
2009                                                               173.5       December                                12.3               16.3           +32.5
                                                                                                                                                                      16
Source: CAA, Rentrak EDI.                                                      Total                                  164.2              173.5            +5.6
The year began strongly with January admissions up 8%                          Source: CAA, Rentrak EDI.
                                                                               Note: Figures may not sum to totals due to rounding.
on the previous year, due mainly to the release of UK                                                                                                                 17
film Slumdog Millionaire. The first major 3D animated                          Average weekly admissions ranged from 2.3 million in
release of the year, Bolt, and the continued strong                            September to 4.5 million in July (Table 1.2). Average
performance of Slumdog Millionaire following BAFTA                             weekly admissions in December were 3.7 million, up                                     18
and Academy Award® success helped to lift February                             from 2.8 million per week in December 2008.
ticket sales by 16% (see Table 1.1).
                                                                                                                                                                      19


                                                                                                                                                                      20


Image: Slumdog Millionaire courtesy of Pathé UK                                                                                       Chapter 1: The box office – 9
                                                                                                                                                                      21
Table 1.2 Average weekly admissions, 2008–2009                           Table 1.3 Cinema admissions by region, 2009
                                                    2008        2009                                                            Admissions
                                                  weekly      weekly     Region                                                   (million)      %
                                                 average     average
Month                                            (million)   (million)   London                                                    41.7        24.0
January                                             3.0         3.3      Midlands                                                  24.6        14.2
February                                            3.1         3.7      Lancashire                                                19.8        11.4
March                                               2.8         2.7      Southern                                                  16.0         9.2
April                                               2.3         3.2      Yorkshire                                                 14.6         8.4
May                                                 2.9         3.6      Central Scotland                                          12.8         7.4
June                                                2.8         2.9      Wales and West                                            11.4         6.6
July                                                4.8         4.5      East of England                                           11.3         6.5
August                                              4.6         3.5      North East                                                 6.5         3.7
September                                           2.5         2.3      Northern Ireland                                           5.7         3.3
October                                             2.9         3.1      South West                                                 4.3         2.5
November                                            3.2         3.5      Northern Scotland                                          3.6         2.1
December                                            2.8         3.7      Border                                                     1.3         0.8
Source: CAA, Rentrak EDI.                                                Total                                                    173.5       100.0
                                                                         Source: CAA, Rentrak EDI.
Table 1.3 shows how the 2009 admissions break down                       Note: Figures may not sum to totals due to rounding.
by ISBA TV region, with London accounting for almost a
quarter of UK admissions (24%). The pattern of national                  Figure 1.2 puts UK admissions in a longer term
and regional admissions has remained largely                             perspective. Cinema-going increased rapidly during
unchanged over the last decade.                                          the Second World War, as audiences sought the latest
                                                                         news as well as escapism from the conflict. Ticket sales
                                                                         reached a peak of 1.64 billion in 1946 but then
                                                                         declined steeply throughout the late 1950s and early
                                                                         1960s as television ownership became commonplace.
                                                                         The introduction of the VCR in the early 1980s had a
                                                                         further negative impact on admissions and the nadir
                                                                         was reached in 1984 with cinema-going levels down
                                                                         to an average of one visit per person per year. However,
                                                                         the introduction of multiplex cinemas to the UK from
                                                                         1985 onwards reversed the trend and ushered in a
                                                                         decade and a half of steady growth. After a pause
                                                                         from 2003 to 2006, admissions grew again in 2007–
                                                                         2009 returning to levels last seen in the early 1970s.


10 – UK Film Council Statistical Yearbook 2010
1


                                                                                                                                                                                             2


Figure 1.2 Annual UK admissions, 1935–2009                                                                                                                                                   3
Admissions (million)
1,800.0

1,600.0                                                                                                                                                                                      4

1,400.0

1,200.0                                                                                                                                                                                      5

1,000.0

  800.0                                                                                                                                                                                      6

  600.0

  400.0                                                                                                                                                                                      7

  200.0

       0.0             1937          1943          1949            1955         1961           1967           1973     1979          1985    1991          1997       2003         2009      8
        Admissions 946.0           1,541.0       1,430.0      1,181.8           449.1      264.8          134.2       111.9           72.0   100.3        138.9       167.3        173.5

Source: BFI, CAA, Rentrak EDI.
       Admissions                  Admissions                     Admissions                    Admissions                  Admissions              Admissions                 Admissions    9
Year     (million)          Year     (million)             Year     (million)           Year      (million)          Year     (million)      Year     (million)         Year     (million)
1935         912.3          1946     1,635.0               1957       915.2             1968          237.3          1979       111.9        1990         97.4          2001       155.9
1936         917.0          1947     1,462.0               1958       754.7             1969          214.9          1980       101.0        1991       100.3           2002       175.9
                                                                                                                                                                                             10
1937         946.0          1948     1,514.0               1959       581.0             1970          193.0          1981         86.0       1992       103.6           2003       167.3
1938         987.0          1949     1,430.0               1960       500.8             1971          176.0          1982         64.0       1993       114.4           2004       171.3
1939         990.0          1950     1,395.8               1961       449.1             1972          156.6          1983         65.7       1994       123.5           2005       164.7
1940     1,027.0            1951     1,365.0               1962       395.0             1973          134.2          1984         54.0       1995       114.6           2006       156.6     11
1941     1,309.0            1952     1,312.1               1963       357.2             1974          138.5          1985         72.0       1996       123.5           2007       162.4
1942     1,494.0            1953     1,284.5               1964       342.8             1975          116.3          1986         75.5       1997       138.9           2008       164.2
1943     1,541.0            1954     1,275.8               1965       326.6             1976          103.9          1987         78.5       1998       135.2           2009       173.5
                                                                                                                                                                                             12
1944     1,575.0            1955     1,181.8               1966       288.8             1977          103.5          1988         84.0       1999       139.1
1945     1,585.0            1956     1,100.8               1967       264.8             1978          126.1          1989         94.5       2000       142.5


                                                                                                                                                                                             13
1.2 Box office earnings
According to the CAA/Rentrak EDI, the total UK box office for 2009 was £944 million, up 11% on 2008. This figure
                                                                                                                                                                                             14
covers all box office earnings during the calendar year 2009 for all films exhibited in the UK. The trends in box office
takings from 2000 are shown in Table 1.4 and indicate growth of 62% in the period.
                                                                                                                                                                                             15
Table 1.4 UK box office trends, 2000–2009                                                             1.3 Film releases and box office revenues
                            Box office gross                                      Cumulative
Year                             (£ million)                      %+/–                    %
                                                                                                      In the UK and Republic of Ireland in 2009, 503 films
                                                                                                      were released for a week or more, down 5% on 2008.                                     16
2000                                   583                           –                     –          They generated £1,127 million in box office revenues –
2001                                   645                        10.6                  10.6          an increase of 21% on 2008. This figure differs from
2002                                   755                        17.0                  29.5          the £944 million in paragraph 1.2 because it includes                                  17

2003                                   742                        –1.7                  27.3          revenues generated in 2010 by films released in 2009
                                                                                                      and covers the Republic of Ireland as well as the UK,
2004                                   770                         3.8                  32.1          which distributors treat as a single distribution territory.                           18
2005                                   770                         0.0                  32.1
2006                                   762                        –1.0                  30.7
2007                                   821                         7.7                  40.8                                                                                                 19

2008                                   850                         3.5                  45.8
2009                                   944                        11.1                  61.9
                                                                                                                                                                                             20
Source: CAA, Rentrak EDI.


                                                                                                                                                          Chapter 1: The box office – 11
                                                                                                                                                                                             21
As can be seen in Table 1.5, the top 100 films took 91% of the box office, a slight increase on 2008’s figure.
The remaining 403 films (80% of all releases) accounted for just 9% of gross revenues. A total of 14 films were
released in the 3D format, up from six in 2008, and these films accounted for 16% of the UK and Republic of
Ireland box office in 2009, up from 0.4% in 2008.

Table 1.5 Summary of results at the UK and Republic of Ireland box office, 2005–2009
                                                                                                         2005            2006              2007              2008              2009

Releases                                                                                               467             505               516               527              503
Combined gross £ million                                                                              844.9           845.3             933.8             934.5          1,126.7
Top 20 films (% of box office)                                                                         54.7            48.1              51.2              49.6             48.6
Top 50 films (% of box office)                                                                         75.7            71.1              75.7              72.4             72.9
Top 100 films (% of box office)                                                                        91.5            88.6              91.0              90.3             91.1
Source: Rentrak EDI, RSU analysis.
Note: Table 1.5 and all subsequent analysis of the theatrical market includes all titles released in 2009. The combined gross reflects the territorial gross (that is, including the
Republic of Ireland), and includes those titles released in 2009 but also making money into 2010, up to and including 21 February 2010.

Although the top 100 films have held their percentage of the box office, Figure 1.3 shows that the share of the top
50 films fell from 84% in 2001 to 73% last year. This reflects a relative strengthening in the performance of mid-box
office films compared with the blockbusters, perhaps because the cinema audience has become gradually more
diverse over these years.


Figure 1.3 Market share percentage of top 50,                                               Figure 1.4 Gross box office of top 50,
top 51–150 and rest of films, 2000–2009                                                     top 51–150 and rest of films, 2000–2009
%                                                                                            £ million
100                                                                                          1,200


                                                                                             1,000
 80

                                                                                               800
 60

                                                                                               600

 40
                                                                                               400

 20
                                                                                               200


    0               00     01     02     03      04    05     06      07    08     09             0              00     01      02    03     04     05     06     07     08     09


    % share          3      2      2       2      3      3      5      4      4      3         Gross box         16     11      16    21     23     25     38     37     32     33
    of rest                                                                                    office of rest

    % share of      17     14     16     20     22     21     24     20     24     24          Gross box office 106   105     132    160    179    182    206    190    226    273
    top 51–150                                                                                 top 51–150

    % share of      81     84     82     78     75     76     71     76     72     73          Gross box office 514   628     680    634    622    641    600    707    676    821
    top 50                                                                                     of top 50

Source: Rentrak EDI, RSU analysis.                                                          Source: Rentrak EDI, RSU analysis.
Note: Figures may not sum to 100 due to rounding.
                                                                                            The number of films released in the UK in 2009 by the
Figure 1.4 depicts the increase in box office revenue                                       number of sites at the widest point of release is outlined
over the last decade, with the top 50 films earning                                         in Table 1.6. A total of 170 films were released at 100
£821 million in 2009, up 60% since 2000, while those                                        sites or more (34%), while 196 films were released on
ranked 51–150 earned £273 million in 2009, up 157%                                          fewer than 10 sites (39% of all films released). Six out
since 2000.                                                                                 of 10 films released in the UK went out on 49 prints or
                                                                                            fewer, the same as 2008.

12 – UK Film Council Statistical Yearbook 2010
1


                                                                                                                                                                              2


Table 1.6 Number of releases and average box office gross by number of sites at widest point of release, 2009                                                                 3
Number of sites at WPR                                                                                Number             % of releases               Average box office (£)

500                                                                                                      9                     1.8                       35,369,000
                                                                                                                                                                              4
400–499                                                                                                  46                     9.1                       10,823,000
300–399                                                                                                  53                    10.5                        3,480,000
200–299                                                                                                  30                     6.0                        2,076,000          5
100–199                                                                                                  32                     6.4                          955,000
50–99                                                                                                    31                     6.2                          453,000
10–49                                                                                                   106                    21.1                          153,000          6

10                                                                                                     196                    39.0                           15,000
Total                                                                                                   503                   100.0                        2,240,000
                                                                                                                                                                              7
Source: Rentrak EDI, RSU analysis.
Note: Average box office rounded to nearest £1,000. Figures may not sum to totals due to rounding.

                                                                                                                                                                              8

1.4 Country of origin of film releases
As Table 1.7 indicates, of all films released in 2009, 42% (39% in 2008) were of USA origin (excluding UK                                                                     9
co-productions), and these films accounted for 81% of the total box office earnings (up from 65% in 2008).
UK films, including co-productions, accounted for 23% of releases (up from 21% in 2008) and 16.7% of the box
office, of which UK independent films earned over 8.2% and UK studio-backed titles 8.5%.                                                                                      10

Films whose country of origin lies outside the UK and USA accounted for 35% of releases (down from 40% in 2008)
but only 2.4% of earnings. European films represented 16% of all releases and 1.2% of revenues. Films from India
                                                                                                                                                                              11
accounted for 1% of the box office from 12% of the releases and films from the rest of the world represented just
0.2% of the box office gross from 7% of releases.

                                                                                                                                                                              12
Table 1.7 Country of origin of films released in the UK and Republic of Ireland, 2009
                                                                                    No. of releases                    % of       2009 box office          2009 box office
Country of origin                                                                          in 2009             all releases            (£ million)              share (%)
                                                                                                                                                                              13
USA                                                                                          212                  42.1                     912.5                    81.0
UK independent films                                                                         100                  19.9                      92.4                     8.2
UK studio-backed films*                                                                       13                   2.6                      95.6                     8.5      14

All UK                                                                                       113                  22.5                     188.0                    16.7
Europe                                                                                        82                  16.3                      13.8                     1.2
                                                                                                                                                                              15
India                                                                                         59                  11.7                      10.8                     1.0
Rest of the world                                                                             37                   7.4                       1.7                     0.2
Total                                                                                        503                 100.0                   1,126.7                    100       16

Source: Rentrak EDI, RSU analysis.
Box office gross = cumulative total up to 21 February 2010. *‘Studio-backed’ means backed by one of the major US film studios.
                                                                                                                                                                              17
The changes in market share over time by country of origin of films are shown in Table 1.8. Overall, UK market share
fell to its lowest level since 2003 but the UK independent component was the highest since our records began in
2002. US market share increased to 81%, almost level with the 2003 record figure.
                                                                                                                                                                              18


                                                                                                                                                                              19


                                                                                                                                                                              20


                                                                                                                                           Chapter 1: The box office – 13
                                                                                                                                                                              21
Table 1.8 Market share by country of origin, 2002–2009
                                                   2002     2003     2004     2005     2006          2007     2008        2009

USA                                               73.4     81.6     73.2     63.1     77.1        67.7       65.2       81.0
UK studio-backed                                  16.1     12.5     19.5     26.2     14.4        21.8       25.4        8.5
UK independent                                     6.5      3.4      3.9      6.9      4.7         6.8        5.7        8.2
All UK                                            22.6     15.9     23.4     33.1     19.1        28.6       31.1       16.7
Europe                                             0.7      0.9      0.6      1.6      1.2         1.8        2.3        1.2
India                                              1.0      1.0      1.1      1.5      1.8         1.6        1.4        1.0
Rest of the world                                  0.5      0.8      1.8      0.8      0.7         0.5        0.3        0.2
Total                                            100.0    100.0    100.0    100.0    100.0       100.0      100.0      100.0
Source: UK Film Council RSU.

Table 1.9 compares the number of UK films across several gross box office bands with the non-UK output in 2009.
The UK is better represented in the over £30 million gross category thanks to the success of Harry Potter and the
Half-Blood Prince and Slumdog Millionaire. However, 62% of UK releases earned less than £100,000.

Table 1.9 UK and non-UK releases by box office gross band, 2009
                                                                                          Non-UK releases            UK releases

Box office gross (£ million)                                                         Number    % releases   Number   % releases

30                                                                                     3         0.8          2         1.8
20 – 29.99                                                                              8         2.1          1         0.9
10 – 19.99                                                                             14         3.6          0           0
5 – 9.99                                                                               34         8.7          5         4.4
1 – 4.99                                                                               55        14.1         15        13.3
0.5 – 0.99                                                                             20         5.1          9         8.0
0.1 – 0.49                                                                             62        15.9         12        10.6
Less than 0.1                                                                         194        49.7         69        61.6
Total                                                                                 390       100.0        113       100.0
Source: Rentrak EDI, RSU analysis.


„
  3F
    or more information about top films in 2009 see Chapter 2 (page 15)
  3F
    or further details of film distribution in 2009 see Chapter 8 (page 60)
  3
   For information about weekend/weekday box office performance see Chapter 8, section 8.3 (page 63)
  3
   For a review of the exhibition sector in 2009 see Chapter 9 (page 65)


14 – UK Film Council Statistical Yearbook 2010
Chapter 2:
Top films in 2009


The top film of 2009, Avatar,        Facts in focus

became the highest grossing          •  he biggest film of the year was Avatar, which earned
                                       T
                                       over £91 million to become the highest grossing film
film of all time at the UK box         of all time at the UK box office.
office. It was one of a trio of 3D   •  hree UK films featured in the top 20 – Harry Potter
                                       T
                                       and the Half-Blood Prince, Slumdog Millionaire and
releases in the top five films of      Sherlock Holmes.
the year, signalling the huge        •  here were nine sequels in the top 20, up from eight
                                       T
popularity of the format.              in 2008.
                                     •  he top 20 UK films grossed £173 million at the UK
                                       T
                                       box office.
                                     •  K independent film Slumdog Millionaire topped the
                                       U
                                       weekend box office charts for four weeks in 2009,
                                       more than any other film.
                                     •  lumdog Millionaire was also the highest grossing
                                       S
                                       UK independent film, earning more than £31 million.
                                     •  D film screenings accounted for 16% of the UK and
                                       3
                                       Republic of Ireland box office for films released in
                                       2009 (£176 million).
2.1 The top 20 films
In 2009 Avatar became the highest grossing film of all time at the UK box office, earning over £83 million up
to 21 February 2010 and £91.4 million by 4 April, to surpass the previous record of £69.2 million set in 2008 by
Mamma Mia!. Harry Potter and the Half-Blood Prince, the sixth in the Harry Potter franchise, grossed £51 million
to claim the runner-up spot in the 2009 chart. Fourteen films earned more than £20 million, up from 10 in 2008,
and all films in the top 20 earned more than £15 million (Table 2.1). Sequels and franchises accounted for nine of
the top 20 films, up from eight in 2008.
Three UK titles featured in the top 20 – Harry Potter and the Half-Blood Prince, Slumdog Millionaire and Sherlock
Holmes. As in 2008, it was a good year for animation, with Ice Age III, Up, Monsters vs. Aliens, A Christmas Carol
and Bolt earning just over £129 million between them.

Table 2.1 Box office results for the top 20 films released in the UK and Republic of Ireland, 2009
                                                                                                             Number              Opening
                                                                          Country           Box office    of opening            weekend
         Title                                                            of origin   gross (£ million)      cinemas     gross (£ million)                       Distributor

 1       Avatar*                                                           USA               83.27#            503                8.51            20th Century Fox
 2       Harry Potter and the Half-Blood Prince                         UK/USA               50.72             584               19.78                Warner Bros
 3       Ice Age III                                                       USA               35.02             526                7.64            20th Century Fox
 4       Up                                                                USA               34.59             511                6.41                      Disney
 5       Slumdog Millionaire                                                UK               31.66             324                1.83                       Pathé
 6       The Twilight Saga: New Moon                                       USA               27.47             497               11.68                     E1 Films
 7       Transformers: Revenge of the Fallen                               USA               27.06             516                8.35                  Paramount
 8       Sherlock Holmes*                                               UK/USA               25.71             476                3.08                Warner Bros
 9       Alvin and the Chipmunks 2:
                                                                            USA              23.16             478                 5.35           20th Century Fox
         The Squeakquel*
10       The Hangover                                                      USA               22.12             422                 3.19               Warner Bros
11       Star Trek                                                      USA/Ger              21.40             499                 5.95                 Paramount
12       Monsters vs. Aliens                                               USA               21.37             520                 4.35                 Paramount
13       A Christmas Carol                                                 USA               20.19             446                 1.92                     Disney
14       Night at the Museum 2                                          USA/Can              20.03             515                 4.16           20th Century Fox
15       2012                                                              USA               19.50             480                 6.49              Sony Pictures
16       Angels and Demons                                                 USA               18.79             506                 6.05              Sony Pictures
17       Bolt                                                              USA               17.94             496                 5.46                     Disney
18       X-Men Origins: Wolverine                                          USA               16.28             488                 6.66           20th Century Fox
19       Brüno                                                             USA               15.78             456                 5.00                   Universal
20       Marley and Me                                                     USA               15.25             467                 4.41           20th Century Fox
Source: Rentrak EDI, RSU analysis.
Box office gross = cumulative total up to 21 February 2010.
#At 4 April 2010 Avatar had grossed £91.4 million.
Films with an asterisk (*) were still on release on 21 February 2010.


16 – UK Film Council Statistical Yearbook 2010                                          Image: Harry Potter and the Half-Blood Prince © 2009 Warner Bros. Entertainment
                                                                                                                                Inc. Harry Potter Publishing Rights © J.K.R.
1


                                                                                                                                                   2


2.2 The top 20 UK films                                                                                                                            3

The top 20 UK films, shown in Table 2.2, had a combined gross of £173 million, which was 15% of the total UK box
office. This was down from £266 million in 2008 (28% of gross box office). The top three films accounted for almost
two-thirds of the top 20’s combined gross, a similar proportion to that in 2008, but 2008’s top three included the                                 4
record-breaking Mamma Mia!. Two of the top three were inward investment films, with Slumdog Millionaire at
number two being the highest ranked independent UK film. While 54% of the top 20 films’ combined box office was
from inward investment films, 15 of the 20 titles were independent films. The top 20 UK films encompassed a wide                                   5
range of genres including action, animation, fantasy, comedy, crime and drama.

                                                                                                                                                   6
Table 2.2 Box office results for the top 20 UK films released in the UK and Republic of Ireland, 2009
                                                                               Country           Box office
         Title                                                                 of origin   gross (£ million)                         Distributor
                                                                                                                                                   7
 1       Harry Potter and the Half-Blood Prince                              UK/USA               50.72                    Warner Bros
 2       Slumdog Millionaire                                                      UK              31.66                           Pathé
 3       Sherlock Holmes*                                                    UK/USA               25.71                    Warner Bros             8
 4       Fantastic Mr. Fox*                                                  UK/USA                9.03                20th Century Fox
 5       St Trinian’s 2: The Legend of Fritton’s Gold*                            UK               7.07                  Entertainment
                                                                                                                                                   9
 6       The Boat That Rocked                                                UK/USA                6.23                        Universal
 7       Nativity                                                                 UK               5.20                         E1 Films
 8       The Young Victoria                                                  UK/USA                5.11                     Momentum               10
 9       Planet 51*                                                           UK/Spa               4.91                  Entertainment
10       Harry Brown*                                                             UK               4.56                      Lions Gate
11       The Imaginarium of Dr Parnassus*                                    UK/Can                3.94                      Lions Gate            11

12       Nine*                                                               UK/USA                3.23                  Entertainment
13       Dorian Gray                                                              UK               2.97                     Momentum
                                                                                                                                                   12
14       The Damned United                                                   UK/USA                2.24                   Sony Pictures
15       An Education*                                                       UK/USA                2.24                         E1 Films
16       In the Loop                                                              UK               2.16                       Optimum              13

17       Last Chance Harvey                                                  UK/USA                2.14                     Momentum
18       Lesbian Vampire Killers                                                  UK               1.67                     Momentum
                                                                                                                                                   14
19       Moon                                                                     UK               1.32                   Sony Pictures
20       Looking for Eric                                               UK/Fra/Bel/Ita             1.31                             Icon
Source: Rentrak EDI, RSU analysis.                                                                                                                 15
Box office gross = cumulative total up to 21 February 2010.
Films with an asterisk (*) were still on release on 21 February 2010.

                                                                                                                                                   16


                                                                                                                                                   17


                                                                                                                                                   18


                                                                                                                                                   19


                                                                                                                                                   20


                                                                                                               Chapter 2: Top films in 2009 – 17
                                                                                                                                                   21
2.3 The top 20 UK independent films
The top 20 UK independent films, shown in Table 2.3, had a combined gross of £85 million, which was 8% of the
total UK box office. Slumdog Millionaire was the highest earning film by far of the UK independent films. Its gross
accounted for 37% of the combined gross of the top 20 UK independent films, and it was the only UK independent
film to earn more than £10 million. Three other films, St Trinian’s 2: The Legend of Fritton’s Gold, the partly
improvised comedy Nativity and the story of the early years of Queen Victoria’s reign, The Young Victoria, all grossed
more than £5 million. Again, the top 20 UK independent films encompassed many genres and included four comedy
films, and three biopics, The Young Victoria, Nowhere Boy and Bronson.

Table 2.3 Box office results for the top 20 UK independent films released in the UK and Republic of Ireland, 2009
                                                                                                       Country             Box office
         Title                                                                                         of origin     gross (£ million)         Distributor

 1       Slumdog Millionaire                                                                         UK                     31.66                 Pathé
 2       St Trinian’s 2: The Legend of Fritton’s Gold*                                               UK                      7.07        Entertainment
 3       Nativity                                                                                    UK                      5.20              E1 Films
 4       The Young Victoria                                                                     UK/USA#                      5.11          Momentum
 5       Planet 51*                                                                              UK/Spa                      4.91        Entertainment
 6       Harry Brown*                                                                                UK                      4.56           Lions Gate
 7       The Imaginarium of Dr Parnassus*                                                       UK/Can                       3.94           Lions Gate
 8       Nine*                                                                                  UK/USA#                      3.23        Entertainment
 9       Dorian Gray                                                                                 UK                      2.97          Momentum
10       An Education*                                                                          UK/USA#                      2.24              E1 Films
11       In the Loop                                                                                 UK                      2.16            Optimum
12       Last Chance Harvey                                                                     UK/USA#                      2.14          Momentum
13       Lesbian Vampire Killers                                                                     UK                      1.67          Momentum
14       Moon                                                                                        UK                      1.32         Sony Pictures
15       Looking For Eric                                                                  UK/Fra/Bel/Ita                    1.31                  Icon
16       Nowhere Boy*                                                                                UK                      1.27                  Icon
17       Bright Star                                                                             UK/Aus                      1.07          Warner Bros
18       Love Aaj Kal                                                                            UK/Ind                      1.04                  Eros
19       The Secret of Moonacre                                                          UK/Hungary/Fra                      0.94          Warner Bros
20       Bronson                                                                                     UK                      0.90               Vertigo
Source: Rentrak EDI, RSU analysis.
Box office gross = cumulative total up to 21 February 2010.
Films with an asterisk (*) were still on release on 21 February 2010.
#The Young Victoria, Nine, An Education and Last Chance Harvey were made with independent (non-studio) US support.


2.4 The top 3D films
The development of digital 3D exhibition had a major impact on the box office in 2009. Fourteen 3D films were
released in 2009, generating £175.8 million, up to 21 February 2010, from their 3D screenings (16% of the UK and
Republic of Ireland box office). The top 10 3D releases are listed in Table 2.4. My Bloody Valentine was the first of
these films to be released and, although it had the lowest 3D gross and the lowest total gross of all the listed films,
its 3D gross as a percentage of total gross was the highest of 2009’s 3D films. This film was also shown at the lowest
number of 3D sites. As the number of 3D sites increased through the year, so did the total gross and the 3D gross
of 3D films.


18 – UK Film Council Statistical Yearbook 2010
1


                                                                                                                                                                                 2


Avatar was the highest grossing film of the year, so it appears at the top of the 3D list, but its 3D takings of                                                                 3
£68.5 million (83% of its total gross) up to 21 February 2010, were greater than the total gross of any other 2009
film. This film was released in December and has played in the highest number of 3D sites of all films. The second
and third highest grossing 3D films, Ice Age III and Up, are both in the top four of all films in 2009 (the only non-3D
                                                                                                                                                                                 4
film in the top four is Harry Potter and the Half-Blood Prince). Further, the top six 3D films appear in the top 20 films
of the year, which indicates the popularity of 3D films and their increasing importance to the UK box office.
                                                                                                                                                                                 5
Table 2.4 Top 10 3D releases in the UK and Republic of Ireland, 2009
                                                                          Total gross          3D gross      3D as % of         Number of
         Title                                                             (£ million)        (£ million)    total gross          3D sites                         Distributor
                                                                                                                                                                                 6
 1       Avatar*                                                             83.27              68.52               82               302             20th Century Fox
 2       Ice Age III                                                         35.02              18.15               52               240             20th Century Fox
 3       Up                                                                  34.59              20.77               60               266                        Disney           7

 4       Monsters vs. Aliens                                                 21.37               9.37               44               169                   Paramount
 5       A Christmas Carol                                                   20.19              14.27               71               281                        Disney           8
 6       Bolt                                                                17.94               7.18               40               124                        Disney
 7       G-Force                                                             13.58               9.36               69               228                        Disney
 8       The Final Destination                                               12.81              10.72               84               228               Entertainment             9

 9       Coraline                                                             7.43               5.46               73               124                      Universal
10       My Bloody Valentine                                                  6.95               6.20               89               118                    Lions Gate
                                                                                                                                                                                 10
Source: Rentrak EDI.
Box office gross = cumulative total up to 21 February 2010.
Films with an asterisk (*) were still on release on 21 February 2010.
Note: the 3D figures do not include IMAX screenings, although IMAX revenues contribute to the total gross.                                                                       11


2.5 Best weekend performances of UK films                                                                                                                                        12
A total of 36 films topped the UK weekend box office charts over the course of 2009 and two of those, Harry Potter
and the Half-Blood Prince and Slumdog Millionaire, were UK titles. These two films spent a total of seven weeks at
number one (Table 2.5). Slumdog Millionaire, a UK independent film, was the top film at the UK box office on four                                                                13
weekends, which is more than any other film in 2009. Harry Potter and the Half-Blood Prince took £4.7 million on
its opening day and £19.8 million on its opening weekend. However, this film opened on Wednesday 15 July, so
the opening ‘weekend’ was extended to five days. Takings on the usual Friday to Sunday three-day weekend were                                                                    14
£11.9 million. Harry Potter and the Half-Blood Prince’s opening ‘weekend’ takings were 39% of the film’s final box
office gross while Slumdog Millionaire’s opening weekend represented just 8% of its final box office gross.
                                                                                                                                                                                 15
Table 2.5 UK films at number one in the weekend box office charts, 2009
                                                                                                    Weekend            Box office                                No. of weeks
Title                                                                    First week at top   gross (£ million)   gross (£ million)              Distributor           at no. 1   16

Harry Potter and the Half-Blood Prince                               17 July 2009                     19.8                 50.7       Warner Bros                           3
Slumdog Millionaire                                              16 January 2009                       2.6                 31.7            Pathé                            4
                                                                                                                                                                                 17
Source: Rentrak EDI, RSU analysis.


„                                                                                                                                                                                18


  3F
    or more about the top films of all time see Chapter 3 (page 20)
  3F
    or more on UK talent and awards see Chapter 7 (page 52)                                                                                                                    19
  3F
    or further information about film distribution in 2009 see Chapter 8 (page 60)
  3F
    or information about weekend/weekday box office performance see Chapter 8, section 8.3 (page 63)
  3F
    or an overview of the exhibition sector in 2009 see Chapter 9 (page 65)
                                                                                                                                                                                 20


                                                                                                                                             Chapter 2: Top films in 2009 – 19
                                                                                                                                                                                 21
Chapter 3:
Top films of all time at the UK box office


Avatar has entered the record       Facts in focus

books as the top earning film       •  he top 20 highest grossing films at the UK box office
                                      T
                                      include two films from 2009 – Avatar and Harry Potter
of all time at the UK box office,     and the Half-Blood Prince.
surpassing the record held by       •  vatar has beaten Titanic to take the top spot in the
                                      A
                                      inflation-adjusted box office chart.
Titanic for over a decade. Harry
                                    •  arry Potter and Lord of the Rings films made up six and
                                      H
Potter, with six out of the top       three respectively of the top 20 films in the unadjusted
20 films, continues to cast his       all time chart. James Bond titles scored two in the top 20.

spell as the UK’s favourite hero.   •  equels and franchise films made up 16 of the top 20.
                                      S
                                    •  leven of the top 20 films were UK/USA collaborations.
                                      E
                                    •  hirteen of the top 20 films were based on stories and
                                      T
                                      characters created by UK writers.
1


                                                                                                                                                                                        2


3.1 All time top 20 films at the UK box office                                                                                                                                          3

In the absence of admissions data on individual films, top films can only be measured in terms of earnings at the
box office. Inflation is a key factor affecting earnings and this needs to be borne in mind against some of the figures
quoted in this chapter (however, some figures are adjusted for inflation). Most of this chapter relates to actual box                                                                   4
office receipts from 1989 onwards so can be categorised as all time top films since it is unlikely that anything
produced before 1989 will have earned more in nominal terms.
                                                                                                                                                                                        5
Avatar became the highest grossing film of all time at the UK box office, earning over £91 million by 4 April 2010.
One other film released in 2009 appears in the list of the top 20 films of all time at the UK box office – Harry Potter
and the Half-Blood Prince. The list, shown in Table 3.1, is dominated by franchise movies, including six Harry Potter
                                                                                                                                                                                        6
titles and the Lord of the Rings trilogy. In fact, only four of the top 20 are neither sequels nor franchise titles,
namely Avatar, Mamma Mia!, Titanic and The Full Monty. Eleven of the top 20 films are UK/USA collaborations
and the importance of UK creative talent to the global film industry is underlined by the presence of no fewer
than 13 films based on stories and characters created by UK writers.                                                                                                                    7


Table 3.1 All time top 20 films at the UK box office
                                                                                                                                                                                        8
                                                                                                                        UK box
                                                                                                     Country        office total                                              Year of
          Title                                                                                      of origin       (£ million)                     UK distributor           release

 1        Avatar*                                                                               USA                    83.27             20th Century Fox                     2009      9

 2        Mamma Mia!                                                                         UK/USA                    69.17                    Universal                     2008
 3        Titanic                                                                               USA                    69.03             20th Century Fox                     1998      10
 4        Harry Potter and the Philosopher’s Stone                                           UK/USA                    66.10                 Warner Bros                      2001
 5        Lord of the Rings: The Fellowship of the Ring                                      USA/NZ                    63.00               Entertainment                      2001
 6        Lord of the Rings: The Return of the King                                          USA/NZ                    61.06               Entertainment                      2003      11

 7        Lord of the Rings: The Two Towers                                                  USA/NZ                    57.60               Entertainment                      2002
 8        Casino Royale                                                                 UK/USA/Czech                   55.60                Sony Pictures                     2006
                                                                                                                                                                                        12
 9        Harry Potter and the Chamber of Secrets                                            UK/USA                    54.78                 Warner Bros                      2002
10        Pirates of the Caribbean: Dead Man’s Chest                                            USA                    52.52                  Buena Vista                     2006
11        The Full Monty                                                                     UK/USA                    52.23             20th Century Fox                     1997      13

12        Star Wars Episode I: The Phantom Menace                                               USA                    51.06             20th Century Fox                     1999
13        Quantum of Solace                                                                  UK/USA                    51.07                Sony Pictures                     2008
                                                                                                                                                                                        14
14        Harry Potter and the Half-Blood Prince                                             UK/USA                    50.72                 Warner Bros                      2009
15        Harry Potter and the Order of the Phoenix                                          UK/USA                    49.43                 Warner Bros                      2007
16        Harry Potter and the Goblet of Fire                                                UK/USA                    49.20                 Warner Bros                      2005      15

17        The Dark Knight                                                                    UK/USA                    49.07                 Warner Bros                      2008
18        Shrek 2                                                                               USA                    48.10                          UIP                     2004
                                                                                                                                                                                        16
19        Jurassic Park                                                                         USA                    47.89                          UIP                     1993
20        Harry Potter and the Prisoner of Azkaban                                           UK/USA                    46.08                 Warner Bros                      2004
Source: Rentrak EDI, RSU analysis.                                                                                                                                                      17
Note: Figures have not been inflation adjusted.
Box office gross = cumulative total up to 21 February 2010. At 4 April 2010 Avatar had grossed £91.4 million.
Films with an asterisk (*) were still on release on 21 February 2010.
Based on box office data for 1989–2009. The table is titled all time because, with price inflation, it is unlikely that any films before 1989 will have earned more in nominal terms.   18


                                                                                                                                                                                        19


                                                                                                                                                                                        20


Image: Avatar ©2009, Twentieth Century Fox. All rights reserved                                                           Chapter 3: Top films of all time at the UK box office – 21
                                                                                                                                                                                        21
3.2 Inflation-adjusted top 20 films at the UK box office
Table 3.2 shows an inflation-adjusted box office chart based on films released in the UK since 1975 (when coverage
of leading titles begins). Even after adjusting the figures for inflation, Avatar is the highest grossing film of all time
at the UK box office with £91 million (up to 4 April 2010) in 2008/09 terms, with Titanic slipping to second place
with £88 million. Avatar was still on release on 4 April 2010, so its final gross will be higher than shown in Table 3.2.
The first of three Harry Potter films is at number three, with the franchise’s first outing Harry Potter and the
Philosopher’s Stone earning the equivalent of £79.8 million. All three Lord of the Rings films make the chart, with
The Fellowship of the Ring in fourth place (£76 million). In fifth place is Mamma Mia!, the highest grossing film of
2008, with an inflation-adjusted gross of £70.9 million. Three classic releases from the 1970s remain in the top 20:
Steven Spielberg’s Jaws (1975) is at number six with adjusted revenues of £70 million, the original Star Wars (1977)
appears at number 11 with £65.8 million and Grease (1978) is at 14 with £61 million.

Table 3.2 Top 20 highest grossing films at the UK box office (inflation adjusted1)
                                                                                                                  UK box
                                                                                                              office total
                                                                                                  Country       (2008/09                             Year of
          Title                                                                                   of origin    £ million)           UK distributor   release

 1        Avatar                                                                                   USA            91.4*      20th Century Fox        2009
 2        Titanic                                                                                  USA            88.0       20th Century Fox        1998
 3        Harry Potter and the Philosopher’s Stone                                              UK/USA            79.8           Warner Bros         2001
 4        Lord of the Rings: The Fellowship of the Ring                                         USA/NZ            76.0         Entertainment         2001
 5        Mamma Mia!                                                                            UK/USA            70.9              Universal        2008
 6        Jaws                                                                                     USA            70.0                    UIP        1975
 7        Lord of the Rings: The Return of the King                                             USA/NZ            69.4         Entertainment         2003
 8        Jurassic Park                                                                            USA            69.3                    UIP        1993
 9        The Full Monty                                                                        UK/USA            68.0       20th Century Fox        1997
10        Lord of the Rings: The Two Towers                                                     USA/NZ            67.3         Entertainment         2002
11        Star Wars                                                                                USA            65.8       20th Century Fox        1977
12        Harry Potter and the Chamber of Secrets                                               UK/USA            64.0           Warner Bros         2002
13        Star Wars Episode I: The Phantom Menace                                                  USA            63.8       20th Century Fox        1999
14        Grease                                                                                   USA            60.6                    UIP        1978
15        Casino Royale                                                                      UK/USA/Cze           58.6          Sony Pictures        2006
16        Pirates of the Caribbean: Dead Man’s Chest                                               USA            55.4            Buena Vista        2006
17        E.T., The Extra-Terrestrial                                                              USA            55.2                    UIP        1982
18        Toy Story 2                                                                              USA            54.7            Walt Disney        2000
19        Harry Potter and the Goblet of Fire                                                   UK/USA            53.4           Warner Bros         2005
20        Shrek 2                                                                                  USA            53.4                    UIP        2004
Source: UK Film Council RSU analysis of Rentrak EDI data.
1.	 The 2008/09 £ calculated using the UK GDP deflator (HMT).
*The box office gross for Avatar is to 4 April 2010; it was still on release at that time.


22 – UK Film Council Statistical Yearbook 2010
1


                                                                                                                                                                                        2


3.3 All time top 20 UK films at the UK box office                                                                                                                                       3

The list of the all time top 20 UK films is dominated by inward investment features, with British talent, infrastructure
and locations supported by US studio investment (Table 3.3). All six Harry Potter films feature in the top 20, together
with three titles from the James Bond franchise.                                                                                                                                        4


Table 3.3 All time top 20 UK films at the UK box office
                                                                                                                                                                                        5
                                                                                                                           UK box
                                                                                                       Country         office total                                           Year of
          Title                                                                                        of origin        (£ million)                 UK distributor            release

 1        Mamma Mia!                                                                             UK/USA                  69.17                 Universal                     2008       6

 2        Harry Potter and the Philosopher’s Stone                                               UK/USA                  66.10              Warner Bros                      2001
 3        Casino Royale                                                                       UK/USA/Cze                 55.60             Sony Pictures                     2006       7
 4        Harry Potter and the Chamber of Secrets                                                UK/USA                  54.78              Warner Bros                      2002
 5        The Full Monty                                                                         UK/USA                  52.23          20th Century Fox                     1997
 6        Quantum of Solace                                                                      UK/USA                  51.07             Sony Pictures                     2008       8

 7        Harry Potter and the Half-Blood Prince                                                 UK/USA                  50.72              Warner Bros                      2009
 8        Harry Potter and the Order of the Phoenix                                              UK/USA                  49.43              Warner Bros                      2007
                                                                                                                                                                                        9
 9        Harry Potter and the Goblet of Fire                                                    UK/USA                  49.20              Warner Bros                      2005
10        The Dark Knight                                                                        UK/USA                  49.07              Warner Bros                      2008
11        Harry Potter and the Prisoner of Azkaban                                               UK/USA                  46.08              Warner Bros                      2004       10

12        Bridget Jones’s Diary                                                                  UK/USA                  42.01                       UIP                     2001
13        Charlie and the Chocolate Factory                                                      UK/USA                  37.46              Warner Bros                      2005
                                                                                                                                                                                        11
14        Love Actually                                                                          UK/USA                  36.80                       UIP                     2003
15        Die Another Day                                                                        UK/USA                  36.06          20th Century Fox                     2002
16        Bridget Jones: The Edge of Reason                                                      UK/USA                  36.00                       UIP                     2004       12

17        Wallace  Gromit: The Curse of the Were-Rabbit                                         UK/USA                  32.01                       UIP                     2005
18        Slumdog Millionaire                                                                        UK                  31.66                    Pathé                      2009
                                                                                                                                                                                        13
19        Notting Hill                                                                           UK/USA                  31.01                 Universal                     1999
20        The Da Vinci Code                                                                      UK/USA                  30.51             Sony Pictures                     2006
Source: Rentrak EDI, RSU analysis.                                                                                                                                                      14
Note: Figures have not been inflation adjusted.
Based on box office data for 1989–2009. The table is titled all time because, with price inflation, it is unlikely that any films before 1989 will have earned more in nominal terms.


                                                                                                                                                                                        15


                                                                                                                                                                                        16


                                                                                                                                                                                        17


                                                                                                                                                                                        18


                                                                                                                                                                                        19


                                                                                                                                                                                        20


                                                                                                                          Chapter 3: Top films of all time at the UK box office – 23
                                                                                                                                                                                        21
3.4 All time top 20 independent UK films at the UK box office
Table 3.4 highlights the all time top earning independent (that is, made without US major studio involvement)
UK titles. The highest grossing independent British film was Slumdog Millionaire (£31.7 million) followed by
Four Weddings and a Funeral (£27.8 million) and Trainspotting (£12.4 million). Each of the top nine UK independent
films earned more than £10 million at the UK box office, and all the top 20 UK independent films earned in excess
of £5 million.

Table 3.4 All time top 20 independent UK films at the UK box office
                                                                                                                        UK box
                                                                                                   Country          office total                                              Year of
          Title                                                                                    of origin         (£ million)                    UK distributor            release

 1        Slumdog Millionaire                                                                    UK                   31.66                         Pathé                    2009
 2        Four Weddings and a Funeral                                                            UK                   27.76                        Carlton                   1994
 3        Trainspotting                                                                          UK                   12.43                     Polygram                     1996
 4        St Trinian’s                                                                           UK                   12.28                Entertainment                     2007
 5        Gosford Park                                                                      UK/USA#                   12.26                Entertainment                     2002
 6        Bend it Like Beckham                                                               UK/Ger                   11.55                    Lions Gate                    2002
 7        Run, Fat Boy, Run                                                                 UK/USA#                   11.02                Entertainment                     2007
 8        Kevin  Perry Go Large                                                                 UK                   10.46                           Icon                   2000
 9        East is East                                                                           UK                   10.37                     Film Four                    1999
10        The Queen                                                                       UK/Fra/Ita                   9.42                         Pathé                    2006
11        Valiant                                                                           UK/USA#                    8.52                Entertainment                     2005
12        The Duchess                                                                     UK/Fra/Ita                   7.12                         Pathé                    2008
13        St Trinian’s 2: The Legend of Fritton’s Gold                                           UK                    7.07                Entertainment                     2009
14        Waking Ned                                                                     UK/Fra/USA#                   7.06              20th Century Fox                    1999
15        Miss Potter                                                                       UK/USA#                    6.95                   Momentum                       2007
16        Stormbreaker                                                                   UK/Ger/USA#                   6.82                Entertainment                     2006
17        The Constant Gardener                                                          UK/Ger/USA#                   6.22                            UIP                   2005
18        The Magic Roundabout                                                               UK/Fra                    5.96                         Pathé                    2005
19        Nativity                                                                               UK                    5.20                       E1 Films                   2009
20        Bride and Prejudice                                                               UK/USA#                    5.18                         Pathé                    2004
Source: Rentrak EDI, RSU analysis.
Note: Figures have not been inflation adjusted.
Based on box office data for 1989–2009. The table is titled all time because, with price inflation, it is unlikely that any films before 1989 will have earned more in nominal terms.
#Gosford Park, Run, Fat Boy, Run, Valiant, Waking Ned, Miss Potter, Stormbreaker, The Constant Gardener and Bride and Prejudice were made with independent (non
studio) US support.


„
  3F
    or top films in 2009 see Chapter 2 (page 15)
  3F
    or more on UK talent see Chapter 7 (page 52)


24 – UK Film Council Statistical Yearbook 2010
Chapter 4:
Genre and classification


Cinema-goers enjoy a wide         Facts in focus

choice of styles, genres          •  omedy, traditionally popular with a broad spectrum
                                    C
                                    of audiences, accounted for 24% of releases and 20%
and subjects. Comedy is             of the box office.
consistently the UK’s favourite   •  rama accounted for the second highest proportion
                                    D
                                    of releases (21%) but shared only 7% of the box office.
genre, taking a fifth of the
                                  •  cience fiction, including the record breaking Avatar,
                                    S
box office in 2009. More films      took more money per site on average than other genres.
were classified ‘15’ than any     •  he genre pattern of UK films and UK independent films
                                    T
other classification, but ‘12A’     was broadly similar to that of all films on release but
                                    there were differences in the patterns of box office by
films took the largest single       genre. Amongst UK independent films, drama took
                                    most at the box office.
share of the box office.
                                  •  ore films were released with a ‘15’ classification than
                                    M
                                    any other category (44% of all releases) though ‘12A’
                                    films took the largest share of the box office (42% of
                                    total box office).
4.1 Genre
For statistical purposes, the Research and Statistics Unit assigns a primary genre to every film released in the UK in
2009. This is not meant to be prescriptive but helps gauge the relative popularity of different genres on a consistent
basis from year to year. The list of genres is based on conventions commonly used within the industry and by
published sources such as the British Board of Film Classification (BBFC) and the Internet Movie Database (IMDb).
The full list of genres and classification of each title released in the UK and Ireland in 2009 is available on our website
(www.ukfilmcouncil.org.uk/genre).


4.1.1 Genre of all film releases
Table 4.1 indicates the relative popularity of different genres at the box office in the UK and Republic of Ireland
in 2009. Comedy was once again the top grossing genre (earning £223.3 million), followed by animation
(£160.0 million) and action (£147.2 million). The top two films of 2009 at the UK box office, the record breaking
Avatar and the very successful Harry Potter and the Half-Blood Prince helped the science fiction and fantasy genres
to fourth and sixth places in the list of highest grossing genres. Harry Potter and the Half-Blood Prince accounted
for three-quarters of the total box office of all fantasy genre films. Despite having the second largest proportion
of releases (21%), drama films shared only 7% of the box office gross.

Table 4.1 Films released in the UK and Republic of Ireland by genre, 2009, ranked by gross box office
                                  Number         % of all   Gross box office    % of total
Genre                           of releases      releases         (£ million)   box office                                     Top performing title

Comedy                               121          24.1              223.3          19.8                               The Hangover
Animation                             14           2.8              160.0          14.2                                   Ice Age III
Action                                55          10.9              147.2          13.1        Transformers: Revenge of the Fallen
Sci-fi                                 9           1.8              133.8          11.9                                       Avatar
Drama                                104          20.7               77.9           6.9                        Slumdog Millionaire
Fantasy                                6           1.2               67.6           6.0      Harry Potter and the Half-Blood Prince
Horror                                35           7.0               66.7           5.9                            Final Destination
Crime                                 32           6.4               40.6           3.6                                 Gran Torino
Romance                               10           2.0               38.0           3.4              The Twilight Saga: New Moon
Family                                 2           0.4               36.7           3.3                Alvin and the Chipmunks 2:
                                                                                                                    The Squeakquel
Thriller                             19            3.8             33.7            3.0                         Angels and Demons
Adventure                             9            1.8             33.2            2.9                      Night at the Museum 2
Biopic                               19            3.8             22.7            2.0                           The Young Victoria
Musical                               5            1.0             20.7            1.8                                         Fame
War                                   5            1.0             12.5            1.1                         Inglourious Basterds
Documentary                          57           11.3             12.0            1.1                   Michael Jackson’s This Is It
Western                               1            0.2             0.1           0.1               Once upon a Time in the West
Total                               503          100.0          1,126.7          100.0
Source: Rentrak EDI, BBFC, IMDb, RSU analysis.
Figures as at 21 February 2010.

Three of the top performing films by genre originated in the UK, demonstrating the variety of story types of
successful British films (Harry Potter and the Half-Blood Prince, Slumdog Millionaire and The Young Victoria).


26 – UK Film Council Statistical Yearbook 2010                                                Image: Inglourious Basterds © 2009 Universal Studios.
                                                                                                 ALL RIGHTS RESERVED. Photo by Francois Duhamel
1


                                                                                                                                           2


The pattern of genres ranked by the average number of sites at the widest point of release (WPR) is shown in Table                         3
4.2. The top genre by WPR in 2009 was family. This is the same as in 2007, but science fiction, 2008’s top genre,
is fourth in the present list, despite the influence of Avatar. In 2009 the average WPR for family films was 476 sites.
This average is based on just two films however, Alvin and the Chipmunks 2: The Squeakquel which had a WPR
                                                                                                                                           4
of 492, and G-Force with a WPR of 459. The film with the widest release at WPR in 2009 was Harry Potter and the
Half-Blood Prince, with 586 sites. Documentary continued to have a low average number of sites at WPR, but 2009’s
average of 20 is almost double 2008’s average of 11. Western is shown as the genre with the lowest average
                                                                                                                                           5
number of sites at WPR, but this is based on a limited showing (two cinemas) of the 1968 film Once upon a Time
in the West.

                                                                                                                                           6
Table 4.2 Films released in the UK and Republic of Ireland by genre, 2009,
ranked by average widest point of release
                                                                           Average number                                        Gross     7
                                                                           of sites at widest        Number of               box office
Genre                                                                       point of release           releases              (£ million)

Family                                                                                476                   2                  36.7
                                                                                                                                           8
Animation                                                                             357                  14                 160.0
Fantasy                                                                               349                   6                  67.6
Sci-fi                                                                                296                   9                 133.8        9
Musical                                                                               268                   5                  20.7
Adventure                                                                             253                   9                  33.2
                                                                                                                                           10
Horror                                                                                158                  35                  66.7
Action                                                                                156                  55                 147.2
Biopic                                                                                144                  19                  22.7        11
Romance                                                                               137                  10                  38.0
Comedy                                                                                135                 121                 223.3
                                                                                                                                           12
War                                                                                   128                   5                  12.5
Crime                                                                                 114                  32                  40.6
Thriller                                                                              110                  19                  33.7        13
Drama                                                                                  48                 104                  77.9
Documentary                                                                            20                  57                  12.0
Western                                                                                 2                   1                  0.1        14

Total                                                                                 122                 503               1,126.7
Source: Rentrak EDI, BBFC, IMDb, RSU analysis.
                                                                                                                                           15
Figures as at 21 February 2010.


                                                                                                                                           16


                                                                                                                                           17


                                                                                                                                           18


                                                                                                                                           19


                                                                                                                                           20


                                                                                                Chapter 4: Genre and classification – 27
                                                                                                                                           21
Table 4.3 demonstrates what the different genres generated in box office revenues per site, which gives a good
indication of performance in the market while controlling for the size of release. Science fiction tops this list, mainly
due to Avatar. A high percentage of the sites screening Avatar showed it on 3D screens, which attract premium
prices. Comedy, which took the largest slice of box office overall, is much lower placed when the average WPR
is taken into account, indicating a long tail of less able performers.

Table 4.3 Films released in the UK and Republic of Ireland by genre, 2009,
ranked by average box office gross per site
                                                                                                       Average          Gross
                                                                                                     box office     box office
Genre                                                                                                per site (£)   (£ million)   Total sites

Sci-fi                                                                                               50,136           113.8        2,668
Family                                                                                               38,543            36.7          951
Fantasy                                                                                              32,314            67.6        2,092
Animation                                                                                            32,027           160.0        4,995
Romance                                                                                              27,647            38.0        1,374
War                                                                                                  19,558            12.5          641
Action                                                                                               17,196           147.2        8,559
Thriller                                                                                             16,173            33.7        2,085
Drama                                                                                                15,473            77.9        5,036
Musical                                                                                              15,458            20.7        1,342
Adventure                                                                                            14,561            33.2        2,280
Western                                                                                              14,276            0.1            2
Comedy                                                                                               13,627           223.3       16,388
Horror                                                                                               12,052            66.7        5,535
Crime                                                                                                11,118            40.6        3,656
Documentary                                                                                          10,407            12.0        1,155
Biopic                                                                                                8,277            22.7        2,745
Total                                                                                                18,319         1,126.7       61,504
Source: Rentrak EDI, BBFC, IMDb, RSU analysis.
Figures as at 21 February 2010.
Total sites = number of releases multiplied by average number of sites at widest point of release.


4.1.2 Genre of UK and UK independent film releases
Looking at the genres of UK films and UK independent films released in 2009 we see similar rankings to those for
all films released for percentages of releases by genre, but differences in share of box office by genre (Figures 4.1
and 4.2). Comedy, drama and documentary occupied the top three places for numbers of releases for UK,
UK independent and all film releases. For all releases comedy was clearly the genre with the greatest proportion of
releases while for both UK and UK independent films drama was the top genre. However, when looking at box office
by genre, there are notable differences between the three categories. For all films, comedy was the top earning
genre (20% of the total box office for all films), while the box office success of Harry Potter and the Half-Blood Prince
and Slumdog Millionaire made fantasy (with 30% of the total box office for UK films) the highest earning category
for UK films, and drama (45% of the box office for UK independent films) the highest earning genre for UK
independent films. Comedy accounted for 12% of the box office for UK films and 18% of the box office for UK
independent films. For all films, drama and fantasy accounted for 7% and 6% of the total box office respectively.
Avatar’s record breaking box office gross contributed to the science fiction genre taking 12% of the total box office
for all films, whereas science fiction films accounted for only 0.7% of the total box office for UK films and 1.4% of
the total box office for UK independent films (Tables 4.1, 4.4 and 4.5).


28 – UK Film Council Statistical Yearbook 2010
1


                                                                                                                                                      2


Table 4.4 UK films released in the UK and Republic of Ireland by genre, 2009, ranked by gross box office                                              3
                                                                     Gross             %
                               Number of                    %    box office      of total
Genre                            releases      of all releases   (£ million)   box office                                     Top performing title
                                                                                                                                                      4
Fantasy                               4               3.5          55.7          29.6            Harry Potter and the Half-Blood Prince
Drama                                26              23.0          42.8          22.8                               Slumdog Millionaire
Action                                8               7.1          26.7          14.2                                   Sherlock Holmes               5
Comedy                               18              15.9          23.1          12.3       St Trinian’s 2: The Legend of Fritton’s Gold
Animation                             3               2.7          14.0           7.4                                  Fantastic Mr. Fox
                                                                                                                                                      6
Biopic                                8               7.1          10.5           5.6                                The Young Victoria
Crime                                 5               4.4           4.6           2.5                                       Harry Brown
Musical                               2               1.8           3.5           1.9                                               Nine              7
Romance                               4               3.5           2.6           1.5                                Last Chance Harvey
Horror                               11               9.7           1.6           0.8                                        Tormented
Sci-fi                                1               0.9           1.3           0.7                                              Moon               8

Thriller                              9               8.0           0.9           0.5                                           Triangle
Documentary                          13              11.5           0.4           0.2                                      Age of Stupid
                                                                                                                                                      9
War                                   1               0.9           0.3           0.2                                        Glorious 39
Total                               113             100.0         188.0         100.0
Source: Rentrak EDI, BBFC, IMDb, RSU analysis.                                                                                                        10
Figures as at 21 February 2010.
Note: Percentages may not add to 100 due to rounding.

UK fantasy films returned to top the chart in 2009 (Table 4.4), as was predicted in section 4.1.2 of our Yearbook                                     11

2009. Harry Potter and the Half-Blood Prince’s gross of £50.7 million was itself more than the total gross for any
other genre, and helped the total gross for the fantasy genre to £55.7 million. Drama had more releases than
any other genre, and is second in the list, but 74% of the genre’s total box office was contributed by Slumdog                                        12
Millionaire’s gross of £31.7 million.
Action was the third highest earning genre, mainly due to the success of Sherlock Holmes. Also contributing
                                                                                                                                                      13
to the total gross for this genre were three re-released James Bond films, Dr No, From Russia with Love and
On Her Majesty’s Secret Service.
Comedy was the fourth highest earning genre, down from third in 2008, but with the same share of the total box                                        14
office from fewer releases. In 2009 UK comedy films earned 12% of the total box office from 18 releases while in
2008 the comedy genre earned 12% of the total box office from 25 releases. The highest-grossing UK comedy of
2009 was St Trinian’s 2: The Legend of Fritton’s Gold at £7.1 million compared with Angus, Thongs and Perfect                                         15
Snogging at £5.5 million in 2008. For all films, comedy was the highest earning genre and hence contributed a
higher percentage of the box office for all films (19%) than for UK films (12%) (see Tables 4.1 and 4.4).
                                                                                                                                                      16


                                                                                                                                                      17


                                                                                                                                                      18


                                                                                                                                                      19


                                                                                                                                                      20


                                                                                                           Chapter 4: Genre and classification – 29
                                                                                                                                                      21
Table 4.5 UK independent films released in the UK and Republic of Ireland by genre, 2009,
ranked by gross box office
                                                                       Gross             %
                                 Number of                    %    box office      of total
Genre                              releases      of all releases   (£ million)   box office                                Top performing title

Drama                                  24              24.0           42.0         45.4                               Slumdog Millionaire
Comedy                                 17              17.0           16.9         18.2       St Trinian’s 2: The Legend of Fritton’s Gold
Biopic                                  7               7.0            8.2          8.9                                The Young Victoria
Fantasy                                 3               3.0            5.0          5.4                 The Imaginarium of Dr Parnassus
Animation                               2               2.0            5.0          5.4                                          Planet 51
Crime                                   5               5.0            4.6          5.0                                       Harry Brown
Musical                                 2               2.0            3.5          3.8                                               Nine
Romance                                 4               4.0            2.6          2.8                                Last Chance Harvey
Sci-fi                                  1               1.0            1.3          1.4                                              Moon
Thriller                                9               9.0            0.9          1.0                                           Triangle
Action                                  4               4.0            0.9          1.0                                Dead Man Running
Horror                                  9               9.0            0.9          0.9                                        Tormented
Documentary                            12              12.0            0.4          0.4                                      Age of Stupid
War                                     1               1.0            0.3          0.3                                        Glorious 39
Total                                 100             100.0           92.4        100.0
Source: Rentrak EDI, BBFC, IMDb, RSU analysis.
Figures as at 21 February 2010.
Note: Percentages may not add to 100 due to rounding.

In 2009, 113 UK films were released and of these 100 were UK independent films. Because of the small number of
non-independent UK films there are only small differences in the proportions of releases by genre. However, because
some of the non-independent UK films, such as Harry Potter and the Half-Blood Prince and Sherlock Holmes, had
considerable success at the box office, there are differences in the percentages of box office takings by genre.
Drama was the most popular genre for UK independent films. The £42 million earned by films of this genre
represented 45% of the total box office of all UK independent films. This is largely due to the success of Slumdog
Millionaire which grossed £31.7 million. Comedy was the second highest earning genre with 18% of the total
box office. Comedy included the second and third highest grossing UK independent films of 2009, St Trinian’s 2:
The Legend of Fritton’s Gold (£7.1 million) and Nativity (£5.2 million).
Biopic was the third highest earning genre for UK independent films. The Young Victoria’s gross of £5.1 million
accounted for 62% of the total for this genre, which also included Nowhere Boy, the film about the early adolescent
years of John Lennon. Biopics contributed 9% of the total gross of all UK independent films in 2009. This compares
with 6% for UK films and just 2% for all films (see Tables 4.1, 4.4 and 4.5).
Dramas, biopics, horrors and thrillers formed a higher proportion of UK and UK independent film releases than of all
films released in the UK in 2009. Comedy and action were the genres that were slightly under-represented in UK and
UK independent films, compared with all films released in the UK in 2009. The biggest difference in the proportions
of films released by genre between UK and UK independent films is in the action genre. Eight UK action films were
released in 2009, and only four of these were independent films.


30 – UK Film Council Statistical Yearbook 2010
1


                                                                                                                                                                                                 2


Figure 4.1 Proportion of box office by genre for all films, UK films and UK independent films, 2009                                                                                              3
% of box office
50

                                                                                                                                                                                                 4
40


30
                                                                                                                                                                                                 5

20

                                                                                                                                                                                                 6
10


 0
                          n


                                     e


                                                 n


                                                          ic


                                                                      y


                                                                              e


                                                                                           y


                                                                                                      a


                                                                                                           ily


                                                                                                                          y


                                                                                                                                 or


                                                                                                                                           al


                                                                                                                                                     ce


                                                                                                                                                              i


                                                                                                                                                                          r


                                                                                                                                                                                ar


                                                                                                                                                                                            n
                                                                                                                                                                                                 7


                                                                                                                                                            i-f


                                                                                                                                                                       le
                                                                    ed


                                                                                             r


                                                                                                                        as
                                    ur


                                                                              im


                                                                                                 am
                        tio


                                              io


                                                                                                                                                                                          er
                                                        op


                                                                                                                                           ic
                                                                                          ta


                                                                                                                                                                                W
                                                                                                                                 rr
                                                                                                          m


                                                                                                                                                 an


                                                                                                                                                                      ril
                                                                                                                                                           Sc
                                            at


                                                                                                                      nt
                                  nt


                                                                                                                                                                                         t
                                                                                                                                       us
                                                                     m


                                                                           Cr


                                                                                                                                Ho
                                                                                     en
                      Ac


                                                                                                                                                                                      es
                                                                                                          Fa
                                                       Bi


                                                                                                 Dr


                                                                                                                                                                     Th
                                                                                                                                                 m
                                           im


                                                                                                                     Fa
                                ve


                                                                  Co


                                                                                                                                       M


                                                                                                                                                                                      W
                                                                                    m


                                                                                                                                                Ro
                              Ad


                                       An


                                                                                   cu
                                                                              Do

                                                                                                                                                                                                 8
  All films             13.1         2.9    14.2           2.0      19.8      3.6          1.1     6.9         3.3        6.0    5.9       1.8       3.4    11.9          3.0   1.1        0.0
  UK films              14.2         0.0         7.4       5.6      12.3      2.5          0.2    22.8         0.0     29.6      0.8       1.9       1.4     0.7        0.5     0.2        0.0
  UK independent          1.0        0.0         5.4       8.9      18.2      5.0          0.4    45.4         0.0        5.4    0.9       3.8       2.8     1.4        1.0     0.3        0.0
  films                                                                                                                                                                                          9

Source: Rentrak EDI, BBFC, IMDb, RSU analysis.

                                                                                                                                                                                                 10
Figure 4.2 Proportion of releases by genre for all films, UK films and UK independent films, 2009
% of releases
30                                                                                                                                                                                               11

25


20                                                                                                                                                                                               12


15
                                                                                                                                                                                                 13
10


 5
                                                                                                                                                                                                 14
 0
                          n


                                     e


                                                   n


                                                             ic


                                                                       y


                                                                              e


                                                                                         ry


                                                                                                      a


                                                                                                           ily


                                                                                                                          y


                                                                                                                                 or


                                                                                                                                           al


                                                                                                                                                    ce


                                                                                                                                                                 i


                                                                                                                                                                          r


                                                                                                                                                                                ar


                                                                                                                                                                                          rn
                                                                                                                                                              i-f


                                                                                                                                                                       le
                                                                    ed


                                                                                                                       as
                                  ur


                                                                            im


                                                                                                 am
                        io


                                                io


                                                          op


                                                                                                                                          ic
                                                                                       ta


                                                                                                                                                                                W
                                                                                                                                 rr


                                                                                                                                                                                          te
                                                                                                           m


                                                                                                                                                 an


                                                                                                                                                                       ril
                                                                                                                                                           Sc
                         t


                                            at


                                                                                                                       nt
                                  nt


                                                                                                                                       us
                                                                   m


                                                                           Cr


                                                                                                                                Ho
                                                                                     en
                      Ac


                                                                                                                                                                                      es
                                                                                                          Fa
                                                       Bi


                                                                                                 Dr


                                                                                                                                                                     Th
                                                                                                                                                 m
                                           im


                                                                                                                     Fa
                                ve


                                                                  Co


                                                                                                                                       M


                                                                                                                                                                                      W
                                                                                      m


                                                                                                                                                Ro
                             Ad


                                       An


                                                                                   cu


                                                                                                                                                                                                 15
                                                                              Do


  All films             10.9         1.8         2.8       3.8      24.1      6.4         11.3    20.7         0.4        1.2    7.0       1.0       2.0     1.8          3.8   1.0        0.2
  UK films                7.1        0.0         2.7       7.1      15.9      4.4         11.5    23.0         0.0        3.5    9.7       1.8       3.5     0.9        8.0     0.9        0.0   16
  UK independent          4.0        0.0         2.0       7.0      17.0      5.0         12.0    24.0         0.0        3.0    9.0       2.0       4.0     1.0          9.0   1.0        0.0
  films

Source: Rentrak EDI, BBFC, IMDb, RSU analysis.                                                                                                                                                   17


                                                                                                                                                                                                 18


                                                                                                                                                                                                 19


                                                                                                                                                                                                 20


                                                                                                                                                      Chapter 4: Genre and classification – 31
                                                                                                                                                                                                 21
4.2 BBFC classification
All films in the UK must carry a classification indicating their suitability for exhibition in premises licensed for
cinematic exhibition by local authorities. The BBFC classifies the majority of films for theatrical release, although local
authorities may grant their own classification if they decide to.
The symbols used by the BBFC, and their meanings, are given in Table 4.6.

Table 4.6 BBFC film classifications
U (Universal)                                                                                                      Suitable for all
PG (Parental Guidance)                                     General viewing, but some scenes may be unsuitable for young children
12A                                       No-one younger than 12 may see a ‘12A’ film in a cinema unless accompanied by an adult
15                                                                        No-one younger than 15 may see a ‘15’ film in a cinema
18                                                                       No-one younger than 18 may see an ‘18’ film in a cinema
Source: BBFC website.


4.2.1 Releases and box office by classification
Table 4.7 provides a picture of how 2009 releases were classified. It shows that, as in previous years, more ‘15’ films
were released than any other category (44% of all releases, up from 37% in 2008) although they accounted for
a smaller proportion of the gross box office (22%). The largest share of gross box office was earned by ‘12A’ films
(42%). This was slightly less than the proportion earned by ‘12A’ films in 2008 (45%), and there was also a slight
decrease in the proportion of ‘12A’ certified films released, down from 28% to 24%.

Table 4.7 Releases in UK and Republic of Ireland by BBFC film classification, 2009
                                                                                                   Gross                        %
                                           Number of                          %                box office                of gross
BBFC classification                          releases                of releases               (£ million)              box office                    Top performing title

U                                                 24                     4.8                   131.0                       11.6                          Ice Age III
PG                                                72                    14.3                   204.2                       18.1                  Monsters vs. Aliens
12A                                              122                    24.3                   469.0                       41.6                              Avatar
15                                               223                    44.3                   248.9                       22.1                 Slumdog Millionaire
18                                                49                     9.7                    73.6                        6.5                               Brüno
No classification                                 13                     2.6                     0.1                        0.0                         Objectified
Total                                            503                   100.0                 1,126.7                      100.0
Source: Rentrak EDI, BBFC, RSU analysis.
Figures as at 21 February 2010.
Note: ‘No classification’ means no classification issued for theatrical release. Some of these films have a classification for video release.

Table 4.8 shows how 2009 releases of UK films were classified, and Table 4.9 shows how releases of UK independent
films were classified. The proportions of films released by BBFC classification were broadly similar for all films, UK
films and for UK independent films. The one notable difference was a higher proportion of ‘18’ films than ‘PG’ films
for UK independent films, whereas the reverse was true for all films and for UK films. However, because of the high
earning international and UK non-independent films there were differences in box office takings by classification
between UK independent films and the others, all films and UK films (Figure 4.3). For all films and UK films the
highest earning classification was ‘12A’ (42% of the total box office for all films and 48% of the total box office for
UK films), whereas for UK independent films the highest earning classification was ‘15’ (51% of the total box office).
Avatar, Harry Potter and the Half-Blood Prince and Sherlock Holmes were ‘12A’ films. All three contributed to the
difference between all films and UK independent films while the last two had a major impact on the difference
between UK films and UK independent films (see Tables 4.7, 4.8 and 4.9).


32 – UK Film Council Statistical Yearbook 2010
1


                                                                                                                                                                                      2


Table 4.8 Releases of UK films in UK and Republic of Ireland by BBFC film classification, 2009                                                                                        3
                                                                                      Gross                   %
                                        Number of                     %           box office           of gross
BBFC classification                       releases           of releases          (£ million)         box office                                              Top performing title
                                                                                                                                                                                      4
U                                               8                7.1                11.3                 6.0                                              Nativity
PG                                             14               12.4                23.3                12.4                                    Fantastic Mr. Fox
12A                                            22               19.5                90.9                48.4               Harry Potter and the Half-Blood Prince                     5
15                                             52               46.0                55.4                29.5                                 Slumdog Millionaire
18                                             13               11.5                 7.1                 3.8                                         Harry Brown
                                                                                                                                                                                      6
No classification                               4                3.5                 0.0                 0.0                              In Search of Beethoven
Total                                         113              100.0               188.0               100.0
Source: Rentrak EDI, BBFC, RSU analysis.                                                                                                                                              7
Figures as at 21 February 2010.
Note: ‘No classification’ means no classification issued for theatrical release. Some of these films have a classification for video release.


                                                                                                                                                                                      8
Table 4.9 Releases of UK independent films in UK and Republic of Ireland by BBFC film classification, 2009
                                                                                      Gross                   %
                                        Number of                     %           box office           of gross
BBFC classification                       releases           of releases          (£ million)         box office                                              Top performing title    9

U                                               8                8.0                 11.3               12.2                                             Nativity
PG                                              8                8.0                 14.2               15.3        St Trinian’s 2: The Legend of Fritton’s Gold                      10
12A                                            20               20.0                 14.5               15.6                  The Imaginarium of Dr Parnassus
15                                             49               49.0                 46.9               50.8                                Slumdog Millionaire
18                                             11               11.0                  5.6                6.0                                        Harry Brown                       11

No classification                               4                4.0                  0.0                0.0                             In Search of Beethoven
Total                                         100              100.0                 92.4              100.0
                                                                                                                                                                                      12
Source: Rentrak EDI, BBFC, RSU analysis.
Figures as at 21 February 2010.
Note: ‘No classification’ means no classification issued for theatrical release. Some of these films have a classification for video release.
                                                                                                                                                                                      13

Figure 4.3 Percentage of gross box office by BBFC film classification for all films,
UK films and UK independent films, 2009
                                                                                                                                                                                      14
% of gross box office
60


50                                                                                                                                                                                    15

40


30                                                                                                                                                                                    16


20

10                                                                                                                                                                                    17

 0                                      U                              PG                            12A                             15                           18

  All films                          11.6                            18.1                            41.6                          22.1                           6.5
                                                                                                                                                                                      18
  UK films                            6.0                            12.4                            48.4                          29.5                           3.8
  UK independent                     12.2                            15.3                            15.6                          50.8                           6.0
  films
                                                                                                                                                                                      19
Source: Rentrak EDI, BBFC, RSU analysis.
Figures as at 21 February 2010.
Note: Category ‘12A’ includes those films that were given the ‘12’ classification before 2003. The ‘12’ classification was superseded by ‘12A’ for films showing
at the cinema in August 2002. The first film given a ‘12A’ classification was The Bourne Identity.                                                                                    20


                                                                                                                                           Chapter 4: Genre and classification – 33
                                                                                                                                                                                      21
There has been some gradual change in the proportions of films by classification over the last nine years, as shown
in Figure 4.4. The proportion of the most common ‘15’ classification fell slightly below its average 40% mark in 2008
but then increased to 44% in 2009. Until 2008 a slow decline in the ‘PG’ classification was compensated by the
gentle rise of the ‘12A’ classification, but in 2009 the increase in the proportion of films released with a ‘15’
classification has seen a compensating decrease in the proportion of ‘12A’ films.

Figure 4.4 Percentage of releases in UK and Republic of Ireland by film classification, 2001–2009
% of releases
50


40


30


20


10


 0                   2001              2002      2003   2004      2005        2006         2007         2008         2009
      U               7.0                  8.0    5.2    6.0       6.2          5.7          5.2          5.9            4.8
     PG                19                  23    16.1     18      17.1         14.9         15.9         14.6        14.3
     12A               18                  20     26    26.4      24.8         27.5         25.4         28.5        24.3
      15               40                  40    40.4     39      37.3         38.8         40.1         36.6        44.3
      18               15                   9    12.1    8.6      10.7          9.1          9.1          9.7            9.7

Source: Rentrak EDI, BBFC, RSU analysis.
See note to Figure 4.3.


The shares of box office by film classification vary widely from year to year as demonstrated in Figure 4.5. However,
the box office ranking of the classifications has remained fairly constant over time, the top earner being ‘12A’, with
‘U’ and ‘18’ consistently being the lowest earners, and ‘PG’ and ‘15’ exchanging second and third places over the
years. In 2007 and 2008 films in the ‘PG’ category earned more at the box office than those in the ‘15’ category,
but this was reversed in 2009 with the ‘15’ films increasing their share of the box office to 22% and ‘PG’ films
reducing their share to 18%.


34 – UK Film Council Statistical Yearbook 2010
1


                                                                                                                                               2


Figure 4.5 Percentage of gross box office of releases in UK and Republic of Ireland by film classification, 2001–2009                          3
% of gross box office
50

                                                                                                                                               4
40


30
                                                                                                                                               5

20

                                                                                                                                               6
10


 0                      2001               2002   2003       2004        2005          2006        2007             2008              2009
                                                                                                                                               7
        U               10.2               13.4   10.4       16.6        16.7          13.9        11.8               8.4              11.6
        PG              28.8               22.4   11.8       23.3           19         15.2        24.2              21.4              18.1
        12A             30.3               39.8   42.4       28.2        40.4          43.9        34.7              44.8              41.6
        15              23.5               21.1   29.2       26.6        19.9          21.2        23.7              20.0              22.1    8
        18               7.3                3.6    6.3        5.2          3.8          5.7          5.5              5.4               6.5

Source: Rentrak EDI, BBFC, RSU analysis.
Figures as at 21 February 2010.
                                                                                                                                               9
See note to Figure 4.3.


4.2.2 Top films by classification                                                                                                              10

Table 4.10 gives the top 10 ‘U’ classified films in 2009. Animation is the genre represented most in the table with
four out of 10 titles (traditionally aimed at the youngest audiences for whom a ‘U’ classification is preferable).
                                                                                                                                               11
Three of the 10 films came from the UK, one more than last year.

Table 4.10 Top 10 ‘U’ classified films, 2009                                                                                                   12

                                                                             Gross
                                                             Country     box office
Title                                                        of origin   (£ million)            Distributor                          Genre
                                                                                                                                               13
Ice Age III                                                    USA          35.0       20th Century Fox                     Animation
Up                                                             USA          34.6                 Disney                     Animation
Alvin and the Chipmunks 2:                                                                                                                     14
The Squeakquel                                                USA           23.2       20th Century Fox                         Family
Hannah Montana: The Movie                                     USA            8.5                 Disney                       Musical
                                                                                                                                               15
Hotel for Dogs                                             USA/Ger           7.2             Paramount                        Comedy
Cloudy with a Chance of Meatballs                             USA            6.5          Sony Pictures                     Animation
Nativity                                                        UK           5.2                E1 Films                      Comedy           16
Planet 51                                                   UK/Spa           4.9         Entertainment                      Animation
Beverly Hills Chihuahua                                       USA            3.7                 Disney                       Comedy
The Secret of Moonacre                               UK/Hungary/Fra          0.9           Warner Bros                         Fantasy         17

Source: Rentrak EDI, BBFC, IMDb, RSU analysis.
Figures as at 21 February 2010.
                                                                                                                                               18
The top 10 performing ‘PG’ classified films also included four animations (Table 4.11). Four of the films in this list,
Monsters vs. Aliens, A Christmas Carol, Bolt and G-Force, were shown in 3D, with the 3D gross for all four films being
a significant percentage of the total gross. The top 10 ‘PG’ films also included 2009’s top documentary, Michael                               19
Jackson’s This Is It. Only one of the top 10 films came from the UK, compared with three last year.

                                                                                                                                               20


                                                                                                    Chapter 4: Genre and classification – 35
                                                                                                                                               21
Table 4.11 Top 10 ‘PG’ classified films, 2009
                                                                       Gross
                                                      Country      box office
Title                                                 of origin    (£ million)             Distributor              Genre

Monsters vs. Aliens                                    USA            21.4              Paramount            Animation
A Christmas Carol                                      USA            20.2                  Disney           Animation
Night at the Museum 2                              USA/Can            20.0        20th Century Fox           Adventure
Bolt                                                   USA            17.9                  Disney           Animation
Marley  Me                                            USA            15.3        20th Century Fox             Comedy
G-Force                                                USA            13.5                  Disney              Family
Michael Jackson’s This Is It                           USA             9.8           Sony Pictures         Documentary
Fantastic Mr. Fox                                   UK/USA             9.0        20th Century Fox           Animation
Fame                                                   USA             8.8          Entertainment              Musical
Confessions of a Shopaholic                            USA             8.3                  Disney             Comedy
Source: Rentrak EDI, BBFC, IMDb, RSU analysis.
Figures as at 21 February 2010.

The top ‘12A’ film in 2009 was the record breaking Avatar followed by Harry Potter and the Half-Blood Prince (Table
4.12). The top ‘12A’ films therefore include the top two highest grossing films released in 2009. Action is the genre
represented most in the table with four out of 10 titles, followed by science fiction with three titles. Two of the top
10 films came from the UK, the same number as last year.

Table 4.12 Top 10 ‘12A’ classified films, 2009
                                                                        Gross
                                                       Country      box office
Title                                                  of origin    (£ million)             Distributor             Genre

Avatar                                                 USA              83.3       20th Century Fox                Sci-fi
Harry Potter and the Half-Blood Prince              UK/USA              50.7           Warner Bros              Fantasy
The Twilight Saga: New Moon                            USA              27.5                E1 Films           Romance
Transformers: Revenge of the Fallen                    USA              27.1             Paramount               Action
Sherlock Holmes                                     UK/USA              25.7           Warner Bros               Action
Star Trek                                           USA/Ger             21.4             Paramount                 Sci-fi
2012                                                   USA              19.5          Sony Pictures              Action
Angels and Demons                                      USA              18.8          Sony Pictures              Thriller
X-Men Origins: Wolverine                               USA              16.3       20th Century Fox              Action
Terminator Salvation                                   USA              14.2          Sony Pictures                Sci-fi
Source: Rentrak EDI, BBFC, IMDb, RSU analysis.
Figures as at 21 February 2010.

By definition, ‘15’ classified films contain stronger material than the younger categories. Depending on the type of
film they are likely to involve more adult-oriented themes, comedy, crime and language. This is reflected in the top
10, where the horror and crime genres account for half of the films in the list (Table 4.13). The ‘15’ category films
were topped by the UK independent drama Slumdog Millionaire, followed by the comedy The Hangover. Only two
films in this list are comedies, compared with five last year. Two of the top 10 films came from the UK, compared
with just one last year.


36 – UK Film Council Statistical Yearbook 2010
1


                                                                                                                                              2


Table 4.13 Top 10 ‘15’ classified films, 2009                                                                                                 3
                                                                           Gross
                                                       Country         box office
Title                                                  of origin       (£ million)               Distributor                        Genre
                                                                                                                                              4
Slumdog Millionaire                                       UK              31.7                    Pathé                         Drama
The Hangover                                             USA              22.1             Warner Bros                         Comedy
The Final Destination                                    USA              12.8           Entertainment                          Horror        5
Paranormal Activity                                      USA              10.0                     Icon                         Horror
District 9                                            USA/NZ               9.0            Sony Pictures                           Sci-fi
                                                                                                                                              6
Role Models                                          USA/Ger               8.4                Universal                        Comedy
Gran Torino                                          USA/Aus               8.3             Warner Bros                           Crime
Public Enemies                                           USA               7.0                Universal                          Crime        7
Drag Me to Hell                                          USA               6.9              Lions Gate                          Horror
Knowing                                               USA/UK               6.8                 E1 Films                         Action
                                                                                                                                              8
Source: Rentrak EDI, BBFC, IMDb, RSU analysis.
Figures as at 21 February 2010.

Because of the challenging nature of ‘18’ classified films, which contain the strongest content, their audience appeal                        9
is generally much narrower than other categories. The most popular genres of the top 10 titles in this category in
2009 were horror, action and crime (Table 4.14). Two films, Brüno and Inglourious Basterds, broke the £10 million
barrier. In 2008, Sweeney Todd (£11 million) was the only ‘18’ film to gross more than £10 million, and before that
                                                                                                                                              10
The Departed (£12.8 million) in 2006 was the last ‘18’ to do so. There were two UK titles (compared with three in
2008) among the top 10 of this classification in 2009.

                                                                                                                                              11
Table 4.14 Top 10 ‘18’ classified films, 2009
                                                                               Gross
                                                           Country         box office
Title                                                      of origin       (£ million)          Distributor                         Genre     12

Brüno                                                      USA                 15.8            Universal                       Comedy
Inglourious Basterds                                    USA/Ger                10.9            Universal                          War         13
Watchmen                                                   USA                  8.9         Paramount                           Action
My Bloody Valentine                                        USA                  7.0          Lions Gate                         Horror
Law Abiding Citizen                                        USA                  6.4         Paramount                            Crime        14

Saw VI                                           Can/USA/UK/Aus                 5.4          Lions Gate                         Horror
Harry Brown                                                  UK                 4.6          Lions Gate                          Crime
                                                                                                                                              15
Underworld 3                                               USA                  2.6      Entertainment                          Action
Friday the 13th                                            USA                  2.3         Paramount                           Horror
Crank 2: High Voltage                                      USA                  1.6          Lions Gate                         Action        16

Source: Rentrak EDI, BBFC, IMDb, RSU analysis.
Figures as at 21 February 2010.
                                                                                                                                              17


„                                                                                                                                             18
  3F
    or cinema admissions and box office in 2009 see Chapter 1 (page 8)
  3F
    or top foreign language films of the last decade see Chapter 5 (page 38)
  3F
    or a look at cinema audiences see Chapter 14 (page 110)                                                                                 19
  3F
    or information about film classification in the UK see www.bbfc.org.uk
  3F
    or more details of genre classification see www.ukfilmcouncil.org.uk/genre
                                                                                                                                              20


                                                                                                   Chapter 4: Genre and classification – 37
                                                                                                                                              21
Chapter 5:
Specialised films


Specialised films offer           Facts in focus

audiences an experience of        •  47 specialised films were released in the UK in 2009
                                    3
                                    (69% of the total) earning £173 million (15% of the
cinema that is very different       total gross box office).
from mainstream commercial        •  ilms in 28 different languages (including English)
                                    F
                                    were released in the UK in 2009.
fare. Such films may offer an
                                  •  61 foreign language films made up 32% of total
                                    1
innovative cinematic style,         releases, but shared just 2% of the UK box office.
engage with challenging           •  indi was the most frequent foreign language in terms
                                    H
subject matter, be in foreign       of the number of releases, with 3 Idiots and Love Aaj Kal
                                    being the two most popular Hindi films.
languages or portray              •  6 documentary films were released, accounting for
                                    5
experiences from different          11% of releases but only 1% of the gross box office.

cultures. Evidence shows that     •  6 classic and archive films were re-released (5% of
                                    2
                                    the total), accounting for 0.2% of the box office.
specialised films are a growing
aspect of our film culture.
1


                                                                                                                                                                                   2


5.1 Specialised films at the UK box office in 2009                                                                                                                                 3

The UK Film Council’s definition of ‘specialised’ is broad and relates to those films that do not sit easily within a
mainstream and highly commercial genre. Many are from the independent production sector (although they may
be handled by a mainstream, studio-based distributor) or are made with a low production budget (compared to                                                                        4
a studio production) and may focus more on script and character than on effects and star names. They may be
expected to appeal to a narrower audience segment than mainstream films.
                                                                                                                                                                                   5
Specifically, the UK Film Council considers most subtitled foreign language films, documentaries and archive/classic
films to be specialised. For films that do not fall into these categories, other criteria are applied and consideration
is given to films that are less easy to define as a particular genre or that deal with challenging and complex subject
                                                                                                                                                                                   6
matter. For more information on the UK Film Council’s definition of specialised film, and to access the specialised
film database, see www.ukfilmcouncil.org.uk/specialisedfilms.
In total, 347 specialised films were released in 2009, representing 69% of the total number of UK theatrical releases                                                              7
last year. These films grossed £173 million, just over 15% of total box office earnings (Table 5.1).

Table 5.1 Specialised* films in the UK and Republic of Ireland, 2009                                                                                                               8

                                                                                                                                Gross             Share of              Average
                                                                                    Number of             Share of          box office           gross box          widest point
Type                                                                                  releases        releases (%)          (£ million)          office (%)           of release
                                                                                                                                                                                   9
Foreign language                                                                         161                    32            25.6                   2.3                    18
Documentaries                                                                             56                    11            12.0                   1.1                    21
Re-releases                                                                               26                     5             2.7                   0.2                    25     10

Other specialised films                                                                  117                    23           133.1                  11.8                    83
All specialised films**                                                                  347                    69           173.1                  15.4                    41
                                                                                                                                                                                   11
Source: Nielsen EDI data, RSU analysis.
*‘Specialised’ as identified by the UK Film Council and listed in the specialised films database as at 11 March 2010.
For more information visit www.ukfilmcouncil.org.uk/specialisedfilmsdb.
**Note that because of some overlap of categories (eg a film can be categorised as foreign language and as a documentary) the total refers to the number of specialised            12
films, not the sum total of the categories in the table.


A 10-year analysis of specialised film releases and market                             Figure 5.1 Specialised films 2000–2009
share is shown in Figure 5.1. Applying the UK Film                                     Percentage of releases and market share                                                     13

Council definition of specialised film retrospectively                                 70.0
to films released prior to 2003 (when the Prints and
Advertising Fund was established) we can see that                                      60.0                                                                                        14
almost six in every 10 films released at the UK box office
                                                                                       50.0
from 2000–2002 were specialised. The figure has grown
steadily from a low point of 51% in 2003 to 69% last                                                                                                                               15
                                                                                       40.0
year. Market share increased from 8% in 2008 to over
15% in 2009, due largely to the strong performance of                                  30.0
films such as Slumdog Millionaire, Inglourious Basterds,                                                                                                                           16
Michael Jackson’s This Is It and The Curious Case of                                   20.0
Benjamin Button.
                                                                                       10.0                                                                                        17

                                                                                          0               00    01    02      03     04    05       06        07    08    09

                                                                                                                                                                                   18
                                                                                         Specialised    57.7 58.2 58.0       50.5    55.4 55.7 58.8 64.4 66.6 69.0
                                                                                         films as % of
                                                                                         total releases

                                                                                         Market share     7.6   5.9   6.4     5.1    9.8   6.5      8.5       8.0   8.2   15.4     19
                                                                                         of specialised
                                                                                         films (%)

                                                                                       Source: UK Film Council analysis of Rentrak EDI data.
                                                                                                                                                                                   20


Image: Broken Embraces courtesy of Pathé UK                                                                                                Chapter 5: Specialised films – 39
                                                                                                                                                                                   21
By sorting specialised films into four separate types –                               similar impact on revenues in 2004). Foreign language
documentaries, foreign language films, re-releases and                                film grosses have doubled in 10 years, with fluctuations
films with a distinctive genre, hook or style – we can                                depending on individual high grossing titles (such as
better understand the patterns of specialised film                                    Crouching Tiger, Hidden Dragon and Amélie in 2001
distribution over time. As Figure 5.2 shows, there has                                and The Passion of the Christ in 2004). The combined
been a steady increase in the number of theatrically                                  revenues for re-releases are comparatively small and
released feature documentaries over the last decade –                                 have only risen above £2 million on three occasions in
from 10 in 2000 to 56 last year. The number of                                        the last decade, again depending on one or two high
re-released films tracked by Rentrak EDI has remained                                 profile re-issues. However, it is better to judge re-issues
largely the same, although this figure does not include                               in terms of screen averages rather than overall grosses.
all re-releases, particularly limited or one-off screenings                           Finally, the more subjective category of titles with
in independent cinemas. The number of foreign                                         distinctive and non-mainstream genre or styles saw
language films increased from a low point of 96 releases                              a huge increase in revenue last year due to the
in 2001 to a peak of 193 in 2005 and has since                                        performance of films such as Slumdog Millionaire,
fluctuated. Finally, the more subjective category of films                            Inglourious Basterds, The Curious Case of Benjamin
with innovative or unconventional approaches, genre or                                Button and Fantastic Mr. Fox which lifted specialised
style saw numbers decline from 86 in 2000 to a low of                                 film revenues in 2009 to over £173 million.
20 in 2005 before rising again to a peak of 117 in 2009.
                                                                                      Figure 5.3 Box office gross (£ million) of specialised
Figure 5.2 Number of specialised releases, 2000–2009                                  films, 2000–2009
No. of releases                                                                       £ million
500                                                                                   200.00
450                                                                                   180.00
400                                                                                   160.00
350                                                                                   140.00
300                                                                                   120.00
250                                                                                   100.00
200                                                                                    80.00
150                                                                                    60.00
100                                                                                    40.00
 50                                                                                    20.00
  0                  00     01     02    03      04     05     06    07    08   09      0.00              00     01     02     03    04       05   06   07   08   09
      Foreign       106     96   123    142      159    193   165   161   179   148       Foreign      11.95 29.75 17.20 20.30 38.30 27.11 29.70 32.15 26.92 25.32
      language                                                                            language
      Documentary 10         4      8    18      23     27     34    36    49   56        Documentary 0.57 0.17 2.24 5.28 9.27 4.77 4.57 1.57 4.12 12.02
      Re-release     19     25     25    17       21     20    25    29    26   26        Re-release     2.95 2.29 1.40 1.34 0.55 0.30 1.24 1.74 0.97 2.68
      Genre/hook/    86     80     58    36       47     20    73   109    97   117       Genre/       33.32 12.15 32.65 14.52 33.23 23.31 37.35 39.70 45.05 133.10
      style                                                                               hook/style

Source: UK Film Council analysis of Rentrak EDI data.                                 Source: UK Film Council analysis of Rentrak EDI data.


The box office performance of specialised films, again
split into the four sub-categories of documentary,
foreign language, re-releases and films with a distinctive
hook, genre or style, is shown in Figure 5.3. Theatrical
revenues for documentaries are at a 10-year high,
although this is due to the success of one major release
– Michael Jackson’s This Is It (Fahrenheit 9/11 had a


40 – UK Film Council Statistical Yearbook 2010
1


                                                                                                                                                                               2


5.2 Foreign language films                                                            The 27 foreign languages were spread over 161 releases                                   3
                                                                                      in the UK and Republic of Ireland (32% of all releases,
Films in 28 different languages (including English) were                              down four percentage points since 2008), earning
released in the UK and the Republic of Ireland in 2009,                               £25.6 million at the box office (Table 5.3).
compared with 30 in 2008 (Table 5.2). Hindi was again                                                                                                                          4
the top non-English language at the box office, with a                                This represented 2% of the total UK gross box office
1% share of revenues, followed by French (0.5%) and                                   for 2009, down from 3% in 2008 and the lowest
Spanish (0.3%).                                                                       since 2002.                                                                              5


Table 5.2 Languages of films released, 2009                                           Table 5.3 Foreign language films at the UK and
                                                                                      Republic of Ireland box office, 2002–2009                                                6
Main                                    Number Gross box office Box office share
language                              of releases    (£ million)             (%)                                                    % of        Box office % of total gross
                                                                                                             Number         all releases        (£ million)      box office
English                                    327         1,042.8                92.5
                                                                                      2002                      131             35.5               17.1                2.2     7
English with others*                        15            58.3                 5.2
Hindi                                       44            10.9                 1.0    2003                      147             34.7               20.4                2.5
French                                      31             5.9                 0.5    2004                      169             37.5               38.1                4.6     8

Spanish                                     12             3.6                 0.3    2005                      203             43.5               26.9                3.2
Swedish                                      2             1.2                 0.1    2006                      171             33.9               29.8                3.5
Tamil                                       10             0.7                 0.1    2007                      170             32.9               32.3                3.5     9


Italian                                      3             0.7                 0.1    2008                      188             35.7               27.1                2.9
German                                       7             0.6                 0.1    2009                      161             32.0               25.6                2.3
                                                                                                                                                                               10
                                                                                      Source: Rentrak EDI, BBFC, IMDb, RSU analysis.
Punjabi                                      6             0.5                0.1
                                                                                      Figures as at 21 February 2010.
Mandarin                                     1             0.4                0.1
Korean                                       3             0.2                0.1    Films in European languages other than English earned                                    11
                                                                                      1.1% of the gross box office from 13.5% of releases and
Polish                                       2             0.2                0.1
                                                                                      South Asian subcontinent languages also shared 1.1%
Romanian                                     3             0.2                0.1    of the box office from 12% of releases (Table 5.4). Taken                                12
Turkish                                      9             0.2                0.1    together, foreign language films played on average at
Japanese                                    11             0.1                0.1    only 18 sites at their widest point of release (up from 15
                                                                                      in 2008) compared with an average of 171 for English                                     13
Bengali                                      1            0.1                0.1
                                                                                      language releases.
Burmese                                      1            0.1                0.1
Cantonese                                    1            0.1                0.1                                                                                             14
Danish                                       2            0.1                0.1
Farsi                                        1            0.1                0.1
Hebrew                                       1            0.1                0.1                                                                                             15

Hungarian                                    1            0.1                0.1
Kazakh                                       1            0.1                0.1
                                                                                                                                                                               16
Malayalam                                    1            0.1                0.1
Norwegian                                    1            0.1                0.1
Portuguese                                   3            0.1                0.1                                                                                             17

Slovak                                       1            0.1                0.1
Thai                                         2            0.1                0.1
                                                                                                                                                                               18
Total                                      503         1,126.7               100.0
Source: Rentrak EDI, BBFC, IMDb, RSU analysis.
*‘English with others’ includes films whose main language was English but with
                                                                                                                                                                               19
extensive use of other languages, such as Slumdog Millionaire in English and Hindi.


                                                                                                                                                                               20


                                                                                                                                           Chapter 5: Specialised films – 41
                                                                                                                                                                               21
Table 5.4 Language of releases in the UK and Republic of Ireland, 2009 (ranked by number of releases)
                                                                                                                                                    Average sites at
                                                                   Number                        % of      Gross box office           % of gross       widest point
Main language                                                    of releases                 releases            (£ million)          box office         of release

English and English with others*                                     342                     68.0               1,101.1                  97.7                 171
European other than English                                           68                     13.5                  12.4                   1.1                  16
South Asian subcontinent                                              62                     12.3                  12.1                   1.1                  24
Other Asian                                                           20                      4.0                   0.8                   0.1                  15
Other international                                                   11                      2.2                   0.3                  0.1                   3
Total                                                                503                    100.0               1,126.7                 100.0                 122
Source: Rentrak EDI, BBFC, IMDb, RSU analysis.
*See note to Table 5.2.
Figures as at 21 February 2010. Figures may not sum to totals due to rounding.

While the top foreign language film in 2009 was in French (Coco Before Chanel), the top 20 as a whole was
dominated by Hindi films, which accounted for 11 titles (Table 5.5). Six films earned over £1 million, including
Indian films 3 Idiots and Love Aaj Kal, Pedro Almodóvar’s Broken Embraces, Tomas Alfredson’s Let the Right One
In, and the first part of Steven Soderbergh’s two biopics of Che Guevara.

Table 5.5 Top 20 foreign language films released in the UK and Republic of Ireland, 2009
                                                                                                        Gross box office
         Title                                                                   Country of origin            (£ million)             Distributor   Main language

 1       Coco Before Chanel                                                                Fra                      2.6            Optimum             French
 2       3 Idiots                                                                       India                       1.8                Adlabs            Hindi
 3       Broken Embraces                                                                  Spa                       1.4          Warner Bros          Spanish
 4       Che: Part One                                                               Fra/Spa                        1.4            Optimum            Spanish
 5       Let the Right One In                                                            Swe                        1.1          Momentum             Swedish
 6       Love Aaj Kal                                                                 UK/Ind                        1.0                    Eros          Hindi
 7       The Class                                                                         Fra                      0.9          Artificial Eye        French
 8       Kambakkht Ishq                                                                 India                       0.7                    Eros          Hindi
 9       Mesrine: Killer Instinct                                                Fra/Can/Ita                        0.7          Momentum              French
10       The White Ribbon                                                        Aut/Ger/Fra                        0.6          Artificial Eye       German
11       De Dhana Dhan                                                                  India                       0.6                    Eros          Hindi
12       Dil Bole Haddipa                                                               India                       0.5              Yash Raj            Hindi
13       Billu Barber                                                                   India                       0.5                    Eros          Hindi
14       Chandni Chowk to China                                                   India/USA                         0.5          Warner Bros             Hindi
15       Blue                                                                           India                       0.4         B4U Network              Hindi
16       Ajab Prem Ki Ghazab Kahani                                                     India                       0.4         B4U Network              Hindi
17       New York                                                                       India                       0.4              Yash Raj            Hindi
18       Red Cliff                                                                     China                        0.4        Entertainment         Mandarin
19       Kurbaan                                                                        India                       0.4          UTV Comms               Hindi
20       Il Divo                                                                      Ita/Fra                       0.4          Artificial Eye         Italian
Source: Rentrak EDI, BBFC, IMDb, RSU analysis.
Figures as at 21 February 2010.


42 – UK Film Council Statistical Yearbook 2010
1


                                                                                                                                         2


This year, four of the top 20 foreign language films were supported by the UK Film Council. The four titles (Che: Part                   3
One, Il Divo, Let the Right One In and Broken Embraces) received funding to pay for additional prints and advertising,
affording greater opportunity for UK audiences to see the films.
Table 5.6 shows the 10 biggest foreign language films of the last decade. The top film is The Passion of the Christ                      4
(£11.1 million), followed by Crouching Tiger, Hidden Dragon (£9.4 million). There are three Mandarin and three
Spanish films in the top 10, but only one French language title.
                                                                                                                                         5

Table 5.6 Top 10 foreign language films, 2000–2009
                                                                           UK box office
         Title                                              Language     total (£ million)      UK distributor         Year of release   6

 1       The Passion of the Christ           Aramaic/Latin/Hebrew               11.08                 Icon                    2004
 2       Crouching Tiger, Hidden Dragon                  Mandarin                9.37        Sony Pictures                    2001
                                                                                                                                         7
 3       Amélie                                             French               5.01         Momentum                        2001
 4       Apocalypto                                         Mayan                4.11                 Icon                    2007
 5       Hero                                            Mandarin                3.82              Disney                     2004       8

 6       House of Flying Daggers                         Mandarin                3.78               Pathé                     2004
 7       Volver                                            Spanish               2.88               Pathé                     2006
                                                                                                                                         9
 8       The Motorcycle Diaries                            Spanish               2.75               Pathé                     2004
 9       Pan’s Labyrinth                                   Spanish               2.72           Optimum                       2006
10       The Lives of Others                               German                2.70          Lions Gate                     2007       10

Source: Rentrak EDI, RSU analysis.


                                                                                                                                         11
5.3 Documentaries
In all, 56 feature documentaries were released at the UK box office in 2009, representing 11% of theatrical releases.
                                                                                                                                         12
They earned £12 million in total, around 1% of the overall box office gross. The most successful documentary of the
year was Michael Jackson’s This Is It, which earned £9.8 million. This was followed by The September Issue and Jonas
Brothers: The 3D Concert.
                                                                                                                                         13
Michael Jackson’s This Is It is now the highest grossing documentary of all time at the UK box office (Table 5.7),
the previous highest earning documentary, Michael Moore’s Fahrenheit 9/11 grossed £6.5 million in 2004. French
natural history documentary March of the Penguins is in third place with £3.1 million and British-made Touching the
                                                                                                                                         14
Void is at number four with £2.6 million. There are two 3D music documentaries in the top 20, and we may well see
more documentaries in the 3D format in future.

                                                                                                                                         15


                                                                                                                                         16


                                                                                                                                         17


                                                                                                                                         18


                                                                                                                                         19


                                                                                                                                         20


                                                                                                     Chapter 5: Specialised films – 43
                                                                                                                                         21
Table 5.7 Top 20 documentaries at the UK box office, 2000–2009
                                                                            Country           Year of              Box office    Widest point of
         Title                                                              of origin         release               gross (£)     release (sites)                  Distributor

 1       Michael Jackson’s This Is It                                       USA               2009            9,795,960                    498            Sony Pictures
 2       Fahrenheit 9/11                                                    USA               2004            6,545,552                    200               Optimum
 3       March of the Penguins                                            France              2005            3,084,616                    163             Warner Bros
 4       Touching the Void                                                   UK               2003            2,643,252                     50                   Pathé
 5       Bowling for Columbine                                              USA               2002            1,667,625                     37             Momentum
 6       Super Size Me                                                      USA               2004            1,111,093                     83                  Tartan
 7       An Inconvenient Truth                                              USA               2006              935,770                     68              Paramount
 8       Man on Wire                                                     UK/USA               2008              879,377                     43                     Icon
 9       Hannah Montana/Miley Cyrus:
         Best of Both Worlds                                                USA               2008               799,109                    65           Disney
10       U2 3D                                                              USA               2008               725,893                    67         Revolver
11       Etre et Avoir                                                    France              2003               708,116                    15           Tartan
12       Shine a Light                                                   USA/UK               2008               697,320                   159 20th Century Fox
13       Spellbound                                                         USA               2003               484,540                    17      Metrodome
14       The September Issue                                                USA               2009               427,767                    18      Momentum
15       Capturing the Friedmans                                            USA               2004               388,238                    26           Tartan
16       Sicko                                                              USA               2007               378,669                   166        Optimum
17       The Corporation                                                 Canada               2004               296,234                    20      Metrodome
18       Jonas Brothers: The 3D Concert                                     USA               2009               249,534                   169          Disney
19       Of Time and the City                                                UK               2008               245,189                    25              BFI
20       Lost in La Mancha                                               UK/USA               2002               233,383                    13        Optimum
Source: UK Film Council RSU analysis of Rentrak EDI data.
Note: The table does not include IMAX-only documentaries and shorts.
Based on box office data for 2000–2009. Michael Jackson’s This Is It is regarded as the highest grossing documentary of all time because, even with price inflation,
it is unlikely that any documentary films before 1989 will have earned more in nominal terms.

An interesting observation is the number of documentaries originating from the USA – a reminder that the USA is
not wholly about mainstream Hollywood production but has a large independent and specialised film sector as well.


5.4 Re-releases of classic and archive films
According to Rentrak EDI, 26 re-released classic and archive films accounted for 5% of theatrical releases in 2009 and
generated £2.7 million (0.2% of the total gross box office). However, not all box office revenues for re-releases are
tracked by Rentrak EDI, which primarily focuses on first-run films. Some additional revenue for films, which tend
to be booked for a limited time into specialised cinemas long after their initial release, is missing from this analysis,
so the actual box office share is likely to be greater.
The figures available suggest there is a growing appetite for the theatrical re-release of classic material, fuelled in part
by the ageing of the cinema population – the over-45s now account for one-fifth of cinema visits. The availability of
enhanced digital versions and the flexibility of digital cinema also give younger audiences the chance to experience
the classics for the first time, or to see in the cinema films they have previously only viewed on television.
Table 5.8 highlights the top 20 re-releases at UK cinemas over the last decade. Seasonal re-releases take four of
the top 20 places, with sizeable audiences for Tim Burton’s The Nightmare Before Christmas 3-D in both 2006
(£647,000) and 2007 (£329,000). It’s a Wonderful Life made an impressive £166,000 from a limited release in the
run-up to Christmas 2007, while the British Film Institute’s (BFI) re-release of The Wizard of Oz earned £118,000
the previous year.


44 – UK Film Council Statistical Yearbook 2010
1


                                                                                                                                                            2


The highest earning re-release in the UK over the last decade was Stanley Kubrick’s A Clockwork Orange, which                                               3
grossed £2.1 million from a wide release in 2000. The chart features an interesting mix of genres – Ridley Scott’s
Alien: The Director’s Cut grossed over £500,000 in 2003, while Luchino Visconti’s The Leopard earned £347,000
from its limited release in the same year. Bernardo Bertolucci’s The Conformist was re-released by the BFI in 2008
                                                                                                                                                            4
and grossed £111,000 (with an opening weekend average of £4,500). With the successful 3D re-release of Toy Story
in 2009 (£2 million from 251 cinemas) we can anticipate further 3D re-releases in the years ahead.
Four of the top 20 were re-released by the BFI, illustrating its importance in maintaining and strengthening the                                            5
UK’s film culture.

Table 5.8 Top 20 re-releases at the UK box office, 2000–2009                                                                                                6

                                                                  Country        Year of      Box office   Widest point of
         Title (year of original release)                         of origin   re-release       gross (£)    release (sites)                Distributor

 1       A Clockwork Orange (1972)                                   UK         2000       2,067,302                 328            Warner Bros             7

 2       E.T. (20th anniversary) (1982)                             USA         2002       2,063,690                 313                    UIP
 3       Toy Story (3D re-release) (1996)                           USA         2009       2,017,464                 251                Disney              8
 4       The Nightmare Before Christmas
         3-D (1993)                                                 USA         2006        646,798                    5           Disney
 5       Alien: The Director’s Cut (1979)                       UK/USA          2003        545,782                  134 20th Century Fox                   9

 6       Apocalypse Now Redux (1979)                                USA         2001        455,335                   22           Disney
 7       The Leopard (1963)                                 Italy/France        2003        346,807                    5               BFI
                                                                                                                                                            10
 8       It’s a Wonderful Life (1946)                               USA         2007        329,891                   33       Park Circus
 9       The Nightmare Before Christmas
         3-D (1993)                                                  USA        2007        328,759                    44                Disney             11
10       2001: A Space Odyssey (1968)                            UK/USA         2001        326,496                     4           Warner Bros
11       Breakfast at Tiffany’s (1961)                               USA        2001        313,443                     5                    BFI
12       A bout de souffle (1960)                                     Fra       2000        173,301                     5             Optimum               12

13       This is Spinal Tap (1984)                                   USA        2000        166,203                    22             Optimum
14       Amadeus (Director’s Cut) (1984)                             USA        2002        145,234                     8           Warner Bros
                                                                                                                                                            13
15       The Wizard of Oz (1939)                                     USA        2006        118,033                    33                    BFI
16       White Christmas (1954)                                      USA        2008        117,808                    27            Park Circus
17       The Conformist (1970)                              Italy/France/                                                                                   14
                                                               Germany          2008        111,202                    6                      BFI
18       The Seventh Seal (1957)                                 Sweden         2007        105,594                    6                  Tartan
                                                                                                                                                            15
19       Grease (30th Anniversary) (1978)                            USA        2008        105,241                  143              Park Circus
20       Tokyo Story (1953)                                        Japan        2004         95,935                    4                  Tartan
Source: UK Film Council RSU analysis of Rentrak EDI data.                                                                                                   16


                                                                                                                                                            17


                                                                                                                                                            18


„                                                                                                                                                           19
 3
  For more on the box office see Chapter 1 (page 8)
 3F
   or more on genre and classification see Chapter 4 (page 25)
                                                                                                                                                            20


                                                                                                                        Chapter 5: Specialised films – 45
                                                                                                                                                            21
Chapter 6:
UK films internationally


Global box office revenues        Facts in focus

reached almost $30 billion        •  orldwide, the gross box office for films of all countries
                                    W
                                    of origin increased by 8% on 2008 to $30 billion.
in 2009, with UK films sharing    •  he UK share of the global theatrical market was 7%
                                    T
7% of this market. Harry Potter     ($2 billion).

and the Half-Blood Prince and     •  he top 10 performing UK films worldwide grossed
                                    T
                                    $1.8 billion in 2009.
Slumdog Millionaire were the
                                  •  arry Potter and the Half-Blood Prince was the best
                                    H
stand-out performers, the           performing UK-qualifying film at the worldwide box
latter boosting the share           office, earning over $900 million in 2009.
                                  •  K films represented 7% of releases at the North
                                    U
of independent UK films to          American box office (9% in 2008), and 7% of the
its highest level since our         market (16% in 2008), at a value of $705 million.

records began.                    • n Europe, the top British film was Harry Potter and
                                    I
                                    the Half-Blood Prince with 26 million admissions,
                                    followed by Slumdog Millionaire with 11 million.
1


                                                                                                                                                                               2


6.1 UK films worldwide                                                                                                                                                         3

Global box office receipts reached $29.9 billion in 2009, up 8% on 2008 (Table 6.1). UK films had a 7% share of
this market, earning $2 billion. UK inward investment films (UK films wholly or partly financed and controlled by
US studios but featuring UK cast, crew, locations, facilities, post-production and often UK source material) earned                                                            4
4.4% of the worldwide box office while UK independent films shared 2.3% of global revenues, thanks largely to
the success of Slumdog Millionaire.
                                                                                                                                                                               5
As Table 6.1 shows, the UK market share fluctuates significantly from year to year. The lower UK market share in
2009 can be explained by the reduced number of UK inward investment films in the marketplace compared to 2008,
when The Dark Knight, Quantum of Solace and Mamma Mia! dominated the worldwide box office. However, with
                                                                                                                                                                               6
a larger number of inward investment titles being made in 2009, an increase in UK share in 2010 is anticipated.

Table 6.1 UK films global market share, 2002–2009                                                                                                                              7
                                                                    UK film                  Global
                                                                 worldwide                theatrical                               US studio-backed           Independent
                                                                      gross                 market                 UK share           UK films share         UK films share
Year                                                            (US$ billion)           (US$ billion)                   (%)                      (%)                    (%)    8
2002                                                                   1.8                    19.8                     9.1                    7.6                      1.5
2003                                                                   1.4                    20.1                     6.9                    5.5                      1.5
                                                                                                                                                                               9
2004                                                                   2.9                    24.9                    11.6                   10.0                      1.6
2005                                                                   3.6                    23.1                    15.5                   13.4                      2.2
2006                                                                   2.2                    25.5                     8.6                    7.5                      1.2     10
2007                                                                   3.3                    26.3                    12.5                   10.6                      1.9
2008                                                                   4.2                    27.8                    15.1                   13.3                      1.8
                                                                                                                                                                               11
2009                                                                   2.0                    29.9                     6.7                    4.4                      2.3
Source: MPAA, Screen Digest, Rentrak EDI, UK Film Council.

The highest grossing UK film of 2009 was the sixth instalment of the Harry Potter series, Harry Potter and the Half-                                                           12

Blood Prince, which earned $934 million worldwide (Table 6.2). Oscar®-winning Slumdog Millionaire grossed
$327 million in 2009 and its lifetime earnings now stand at approximately $377 million. Guy Ritchie’s Sherlock
Holmes, a late December release, grossed $191 million in 2009 but has now earned almost $500 million worldwide.                                                                13


Table 6.2 Top 10 UK films worldwide, 2009
                                                                                                                                                                               14
                                                                                                                                            Country        Worldwide gross
         Title                                                                                                                              of origin         (US$ million)

 1     Harry Potter and the Half-Blood Prince                                                                                            UK/USA                      934
                                                                                                                                                                               15
 2     Slumdog Millionaire                                                                                                                   UK                      327
 3     Sherlock Holmes*                                                                                                                  UK/USA                      191
 4     Planet 51*                                                                                                                        UK/Spa                       94       16

 5     The Tale of Despereaux                                                                                                            UK/USA                       67
 6     Fantastic Mr. Fox*                                                                                                                UK/USA                       43
                                                                                                                                                                               17
 7     The Boat That Rocked                                                                                                              UK/USA                       36
 8     Inkheart                                                                                                                          UK/USA                       35
 9     Earth                                                                                                                             UK/Ger                       35       18

10     Mamma Mia!                                                                                                                        UK/USA                       30
Total top 10                                                                                                                                                       1,792
                                                                                                                                                                               19
Source: UK Film Council, Rentrak EDI, IFTA, Screen International, Variety.
Note: Additional box office data have been received since the ‘UK films international market share 2009’ statistics were released on 25 March 2010.
*Still on international theatrical release as at 31 March 2010.
Data are based on gross box office revenue in the calendar year 2009.
                                                                                                                                                                               20


Image: Sherlock Holmes © 2009 Warner Bros. Entertainment Inc                                                                        Chapter 6: UK films internationally – 47
                                                                                                                                                                               21
6.2 UK films in North America
Table 6.3 shows the country of origin of films released in the USA and Canada in 2009. The UK share of the gross box
office fell from 16% in 2008 to 7% in 2009, with UK films representing 7% of releases in the North American market
(down from 9% in 2008). The total revenue from these films stood at $705 million, down from $1.6 billion in 2008.

Table 6.3 Country of origin of films in the USA and Canada, 2009
                                                                                                                 Box office
                                                                                               Box office            share
Country of origin                                      Number of releases   % of releases   (US$ million)              (%)

UK and UK co-productions (non-USA)                                  26            4.5            113                1.1
UK/USA                                                              15            2.6            592                5.5
Sub-total                                                           41            7.2            705                6.6
USA                                                                373           65.1          9,810               91.2
Rest of world                                                      159           27.7            238                2.2
Total                                                              573          100.0         10,752              100.0
Source: Rentrak EDI, RSU analysis.
Figures may not sum to totals due to rounding.


Table 6.4 UK market share in North America, 2002–2009
                                                                                                            UK market share
Year                                                                                                                     %

2002                                                                                                                  7.2
2003                                                                                                                  5.7
2004                                                                                                                 11.0
2005                                                                                                                 15.8
2006                                                                                                                  9.2
2007                                                                                                                 11.8
2008                                                                                                                 16.3
2009                                                                                                                  6.6
Source: Rentrak EDI, RSU analysis.

Harry Potter and the Half-Blood Prince was the top performing UK-qualifying film in 2009 in North America, followed
by Sherlock Holmes with $207 million (Table 6.5). Animated family film Planet 51 earned $42 million, while the
theatrical version of the BBC’s Planet Earth series grossed $32 million.


48 – UK Film Council Statistical Yearbook 2010
1


                                                                                                                                                                               2


Table 6.5 Top 20 UK films at the USA and Canada box office (including co-productions), 2009                                                                                    3
                                                                                                 Country         Box office gross
          Title                                                                                  of origin         (US$ million)                                 Distributor

 1        Harry Potter and the Half-Blood Prince                                            UK/USA                       302.0                       Warner Bros               4
 2        Sherlock Holmes                                                                   UK/USA                       207.0                       Warner Bros
 3        Planet 51                                                                          UK/Spa                       42.1                     Sony Pictures
                                                                                                                                                                               5
 4        Earth                                                                              UK/Ger                       32.0                       Walt Disney
 5        Fantastic Mr. Fox                                                                 UK/USA                        20.9                  20th Century Fox
 6        Nine                                                                              UK/USA                        19.7           The Weinstein Company                 6
 7        Inkheart                                                                          UK/USA                        17.3                       Warner Bros
 8        An Education                                                                           UK                       12.0                      Sony Classics
 9        The Young Victoria                                                                UK/USA                        10.4                        Apparition               7

10        Pirate Radio aka The Boat That Rocked                                             UK/USA                         8.0                    Focus Features
11        The Imaginarium of Dr Parnassus                                                    UK/Can                        7.5                      Sony Classics
                                                                                                                                                                               8
12        Moon                                                                                   UK                        5.0                      Sony Classics
13        Bright Star                                                                        UK/Aus                        4.4                        Apparition
14        Chéri                                                                           UK/Fra/Ger                       2.7                          Miramax                9

15        Easy Virtue                                                                       UK/USA                         2.7                      Sony Classics
16        Love Aaj Kal                                                                       UK/Ind                        2.4                                Eros
                                                                                                                                                                               10
17        In the Loop                                                                            UK                        2.4                           IFC Films
18        Is Anybody There?                                                                 UK/USA                         2.0                       Story Island
19        Me and Orson Welles                                                               UK/USA                         1.2                Freestyle Releasing              11

20        The Boys are Back                                                                  UK/Aus                        0.8                          Miramax
Source: Rentrak EDI, RSU analysis.
Note: Table lists the gross box office for films released in the USA and Canada in 2009 and includes 2010 earnings up to 7 March 2010.                                         12


6.3 UK films in Europe                                                                                                                                                         13

The UK’s market share in the major European territories is highlighted in Table 6.6. Over 10% of Italian theatrical
revenues were earned by UK films, with shares around the 7% mark in France, Germany and Spain.
                                                                                                                                                                               14

Table 6.6 UK market share in selected European territories, 2009
                                                                                                                                           Box office             UK share     15
                                                                                                                                         for UK films                2009
Country                                                                                                                                    (€ million)                 (%)

France                                                                                                                 13.5m (admissions)                             6.7
                                                                                                                                                                               16
Germany                                                                                                                              66.0                             6.6
Italy                                                                                                                                65.3                            10.4
Spain                                                                                                                                51.1                             7.2      17

Source: Rentrak EDI, RSU analysis.

The top British film in European countries (other than the UK and Republic of Ireland) in 2009 was Harry Potter                                                                18
and the Half-Blood Prince with 26 million admissions, followed by Slumdog Millionaire with 11 million (Table 6.7).
Planet 51 performed well in Spain, with 1.9 million admissions, while Ken Loach’s Looking for Eric was the fifth
most popular UK film in France, selling 500,000 tickets.                                                                                                                       19


                                                                                                                                                                               20


                                                                                                                                    Chapter 6: UK films internationally – 49
                                                                                                                                                                               21
Table 6.7 Top 20 UK films in other European countries, 2009
                                                                                                                                    Country
          Title                                                                                                                     of origin   European admissions

 1        Harry Potter and the Half-Blood Prince                                                                                 UK/USA            25,654,203
 2        Slumdog Millionaire                                                                                                         UK           10,951,926
 3        Planet 51                                                                                                               UK/Spa            3,349,364
 4        The Imaginarium of Dr Parnassus                                                                                        UK/Can             1,758,331
 5        The Tale of Despereaux                                                                                                 UK/USA             1,541,656
 6        The Boat That Rocked                                                                                                   UK/USA             1,413,721
 7        Sherlock Holmes                                                                                                        UK/USA             1,368,044
 8        Inkheart                                                                                                               UK/USA             1,292,152
 9        Easy Virtue                                                                                                            UK/USA               913,431
10        Dorian Gray                                                                                                                 UK              886,434
11        Last Chance Harvey                                                                                                     UK/USA               861,749
12        Looking for Eric                                                                                                  UK/Fra/Bel/Ita            801,379
13        The Duchess                                                                                                             UK/Fra              586,969
14        Chéri                                                                                                               UK/Fra/Ger              504,460
15        The Boy in the Striped Pyjamas                                                                                         UK/USA               466,441
16        The Young Victoria                                                                                                     UK/USA               248,877
17        In the Loop                                                                                                                 UK              117,030
18        City of Ember                                                                                                          UK/USA                91,390
19        Bright Star                                                                                                             UK/Aus               68,898
20        Brideshead Revisited                                                                                                        UK               44,177
Source: European Audiovisual Observatory Lumière Database.
Data based on admissions from 24 European countries (excluding the UK and Republic of Ireland) in the 2009 calendar year.


6.4 UK films in Latin America
UK films earned between 6% and 8.5% of the box office in the Latin American territories for which data are available.
The top performing films were Harry Potter and the Half-Blood Prince, Slumdog Millionaire and Planet 51.

Table 6.8 UK market share in selected Latin American countries, 2009

                                                                                                                                   Box office              UK share
                                                                                                                                 for UK films                 2009
Country                                                                                                                         (US$ million)                   (%)

Argentina                                                                                                                              8.4                    6.9
Brazil                                                                                                                                35.0                    6.1
Chile                                                                                                                                  6.7                    8.5
Mexico                                                                                                                                42.6                    6.7
Source: Rentrak EDI, RSU analysis.


50 – UK Film Council Statistical Yearbook 2010
1


                                                                                                                                          2


6.5 UK films in Japan and South Korea                                                                                                     3

The share of UK films in Japan was boosted by the 2009 release of both Mamma Mia! and Quantum of Solace,
but Harry Potter and the Half-Blood Prince was the highest grossing UK film.
                                                                                                                                          4

Table 6.9 UK market share in Japan and South Korea, 2009
                                                                                                                                          5
                                                                                                     Box office               UK share
                                                                                                   for UK films                  2009
Country                                                                                           (US$ million)                    (%)

Japan                                                                                                 152.8                       6.9     6
South Korea                                                                                            52.5                       5.3
Source: Rentrak EDI, RSU analysis.
                                                                                                                                          7


6.6 UK films in Australasia
                                                                                                                                          8
In 2009, UK films accounted for 10% of the theatrical market in Australia and 14% in New Zealand. Once again,
Harry Potter and the Half-Blood Prince, Sherlock Holmes and Slumdog Millionaire were the highest earning UK films.
                                                                                                                                          9
Table 6.10 UK market share in Australia and New Zealand, 2009

                                                                                                     Box office               UK share
                                                                                                                                          10
                                                                                                   for UK films                  2009
Country                                                                                           (US$ million)                    (%)

Australia                                                                                               99.8                     9.7
                                                                                                                                          11
New Zealand                                                                                             17.3                    13.6
Source: Rentrak EDI, RSU analysis.

                                                                                                                                          12

Note: Definition of ‘UK film’
For the purposes of this chapter, a UK film is one which is certified as such by the UK Secretary of State for Culture,
Media and Sport under Schedule 1 of the Films Act 1985, via the Cultural Test, under one of the UK’s bilateral                            13
co-production agreements or the European Convention on Cinematographic Co-production; a film which has
not applied for certification but which is obviously British on the basis of its content, producers, finance and talent;
or (in the case of a re-release) a film which met the official definition of a British film prevailing at the time it was                 14
made or was generally considered to be British at that time. Most UK films in the analysis (including the major UK/
USA films) fall into the first group – films officially certified as British.
                                                                                                                                          15


                                                                                                                                          16


                                                                                                                                          17


                                                                                                                                          18


„                                                                                                                                         19
 3F
   or more information on the UK and global market for filmed entertainment see Chapter 13 (page 104)
 3F
   or more information about the UK film economy see Chapter 20 (page 171)
                                                                                                                                          20


                                                                                               Chapter 6: UK films internationally – 51
                                                                                                                                          21
Chapter 7:
UK talent and awards


For a small country, the UK        Facts in focus

film industry has an astonishing   •  f the top 200 global box office successes of 2001–
                                     O
                                     2009, 30 films are based on stories and characters
creative record. For the past        created by UK writers. Together they have earned
                                     more than $16 billion at the worldwide box office.
nine years, British actors,
                                   •  ight of the top 20 global box office successes of the
                                     E
directors, writers and other         last nine years are based on novels by British writers.
film talent have been prominent    •  ore than half of the top 200 films released worldwide
                                     M
in the global box office charts      since 2001 have featured UK actors in lead or prominent
                                     supporting roles.
and award ceremonies. Story        •  ritish directors have directed 19 of the 200 biggest
                                     B
material from UK writers has         films of the last nine years with David Yates topping
                                     the league.
continued to find enthusiastic
                                   •  K films and talent won 36 major film awards in 2009,
                                     U
audiences and UK talent has          with Slumdog Millionaire being the most recognised
taken our culture and identity       film. The 241 awards received from 2001–2009
                                     represented 14% of the total of all major awards.
to the world.
1


                                                                                                                                             2


7.1 UK story material                                                                                                                        3

The global box office performance of UK films and foreign films which draw on UK source material is a good
indicator of the international impact and exposure of British culture. Of the top 200 grossing films released
worldwide between 2001 and 2009, 28 are British qualifying films, but UK-originated story material provided the                              4
inspiration for 30 – a feat only bettered by US story material. Collectively these 30 films have earned more than
$16 billion at the global box office.
                                                                                                                                             5
Novels by British writers have provided the source material for eight of the top 20 grossing films worldwide since
2001 (see www.ukfilmcouncil.org.uk/research for a list of the top 200 films). The top 20 grossing films adapted from
stories or characters created by UK writers are listed in Table 7.1. Nineteen are adapted from novels, graphic novels
                                                                                                                                             6
and short stories written by UK authors and one is based on a successful stage production.

Table 7.1 Top 20 grossing films worldwide based on stories and characters created by UK writers, 2001–2009                                   7
                                                                          Gross
                                                       Country        box office                                         UK story material
Rank     Title                                         of origin   (US$ million)     US distributor                               (writer)
                                                                                                                                             8
 1       The Lord of the Rings:
         The Return of the King                       USA/NZ           1,119         New Line                Novel by JRR Tolkien
 2       Harry Potter and the Philosopher’s Stone     UK/USA             970       Warner Bros               Novel by JK Rowling
                                                                                                                                             9
 3       Harry Potter and the Order of the Phoenix    UK/USA             937       Warner Bros               Novel by JK Rowling
 4       Harry Potter and the Half-Blood Prince       UK/USA             934       Warner Bros               Novel by JK Rowling
 5       The Lord of the Rings: The Two Towers        USA/NZ             923         New Line                Novel by JRR Tolkien            10

 6       Harry Potter and the Goblet of Fire          UK/USA             896       Warner Bros               Novel by JK Rowling
 7       Harry Potter and the Chamber of Secrets      UK/USA             879       Warner Bros               Novel by JK Rowling
                                                                                                                                             11
 8       The Lord of the Rings:
         The Fellowship of the Ring                   USA/NZ              868        New Line                Novel by JRR Tolkien
 9       Harry Potter and the Prisoner of Azkaban     UK/USA              795      Warner Bros               Novel by JK Rowling             12
10       The Chronicles of Narnia:
         The Lion, the Witch and the Wardrobe         USA/NZ              749       Disney            Novel by CS Lewis
11       The War of the Worlds                           USA              596   Paramount             Novel by HG Wells                      13

12       Casino Royale                             UK/USA/Cze             595 Sony Pictures         Novel by Ian Fleming
13       Mamma Mia!                                   UK/USA              585     Universal Musical book and screenplay
                                                                                                                                             14
                                                                                                  by Catherine Johnson
14       Quantum of Solace                           UK/USA               546 Sony Pictures Based on Ian Fleming novels
15       Charlie and the Chocolate Factory           UK/USA               473 Warner Bros           Novel by Roald Dahl                      15
16       Die Another Day                             UK/USA               432    MGM/UA Based on Ian Fleming novels
17       The Chronicles of Narnia: Prince Caspian    UK/USA               420       Disney            Novel by CS Lewis
18       Sherlock Holmes                             USA/UK               417 Warner Bros            Based on Sir Arthur                     16

                                                                                                     Conan Doyle novels
19       The Golden Compass                          UK/USA               365     New Line       Novel by Philip Pullman
                                                                                                                                             17
20       Wanted                                         USA               345     Universal       Graphic novel written
                                                                                                          by Mark Millar
Source: UK Film Council RSU.                                                                                                                 18


                                                                                                                                             19


                                                                                                                                             20


Image: An Education courtesy of E1 Entertainment                                                      Chapter 7: UK talent and awards– 53
                                                                                                                                             21
Of the 30 films from the top 200 based on UK stories and characters, the majority (71%) were based on novels by
authors such as Sir Arthur Conan Doyle, Roald Dahl, Helen Fielding, Ian Fleming, CS Lewis, Philip Pullman, JK Rowling,
JRR Tolkien and HG Wells (Figure 7.1). The top grossing UK film of 2009 was Harry Potter and the Half-Blood Prince,
which was based on the novel by JK Rowling. The international popularity of UK comedy writing was highlighted by the
success of original screenplays for Borat: Cultural Learnings of America for Make Benefit Glorious Nation of Kazakhstan
and Love Actually. Films based on graphic novels by UK writers, such as Wanted and Constantine, had a major global
impact, as did the computer game Tomb Raider in its film spin-off. The musical Mamma Mia! started life as a UK stage
production in 1999, with the songs of ABBA woven into a story written by British playwright Catherine Johnson.


Figure 7.1 Origin of UK story material in the top 200 films at the international box office, 2001–2009

   Novel                                               77%
   Original screenplay                                 10%
   Comic book/graphic novel                             7%
   Computer game                                        3%
   Musical                                              3%


7.2 UK actors
UK acting talent is widely recognised as being among the best in the world and more than half (113) of the top
200 films at the international box office since 2001 have featured British actors in either lead/title roles (30) or in the
supporting cast (83). The prominent role played by UK actors in many of the major blockbusters of the last decade is
reflected in Figure 7.2 which shows the top 12 British actors based on appearances in the top 200 films. Orlando Bloom,
Ian McKellen and Christopher Lee have featured in some of the biggest franchises in cinema history such as Lord of the
Rings, Pirates of the Caribbean, X-Men and the Star Wars prequels. New entries this year include Jonathan Pryce (who
appeared in three Pirates of the Caribbean films, and two successful 2009 films, GI Joe and Bedtime Stories), Ewan
McGregor (two Star Wars films, Robots and 2009’s Angels and Demons) and Christian Bale (for his role as Batman
in Batman Begins and The Dark Knight, and two successful 2009 films, Public Enemies and Terminator Salvation).


54 – UK Film Council Statistical Yearbook 2010
1


                                                                                                                                                                                               2


Figure 7.2 Top 12 UK actors featured in the top 200 films at the worldwide box office, 2001–2009                                                                                               3
(number of appearances in brackets)
Total gross box office (US$ billion)
7.00
                                                                                                                                                                                               4
6.00

5.00
                                                                                                                                                                                               5
4.00

3.00
                                                                                                                                                                                               6
2.00

1.00
                                                                                                                                                                                               7
   0
                                              )


                                            6)


                                              )


                                                                            )


                                                                                                )


                                                                                                              )


                                                                                                                             4)


                                                                                                                                                     )


                                                                                                                                                                      )


                                                                                                                                                                                        )
                                   G tso /
                                          t( /
                                 rt a ffe
                                     rin n
                                           (8


                                           (6


                                                                            (6


                                                                                             (5


                                                                                                              (4


                                                                                                                                                 (4


                                                                                                                                                                    (4


                                                                                                                                                                                     (4
                                                                                                                            r(
                      om


                                         n


                                                                       ee


                                                                                           e


                                                                                                           se


                                                                                                                                               e


                                                                                                                                                                 ne


                                                                                                                                                                                   ig
                             pe W cli


                                                                                                                            go
                                                                                           yc


                                                                                                                                                 l
                                       le


                                                                                                                                              Ba


                                                                                                                                                                                   ra
                                                                                                         ee
                          Ru maRad


                                                                        L


                                                                                                                                                                 ai
                                    el


                                                                                        Pr
                     o


                                                                                                                          re


                                                                                                                                                                                 C
                                                                     er


                                                                                                                                                                C
                                                                                                         Cl
                  Bl


                                 cK


                                                                                                                                          n
                                                                                                                        cG


                                                                                                                                                                              el
                                                                                      an
                                                                 ph


                                                                                                                                         tia


                                                                                                                                                             el
                                el


                                                                                                    hn
                  o


                              M


                                                                                                                                                                              ni
                                                                                                                                                            ha
                                                                                                                     M
                                                                                                                                                                                               8
                             ni


                                                                                   th
               nd


                                                                to


                                                                                                                                        ris
                          Em


                                                                                                                                                                             Da
                                                                                                    Jo
                            n
                         Da


                                                                                                                                                            ic
                                                                                   na
                                                               ris


                                                                                                                   an


                                                                                                                                    Ch
            rla


                         Ia


                                                                                                                                                         M
                                                                                 Jo
                                                           Ch


                                                                                                                Ew
           O


  Total gross            6.30           5.41            4.53                4.13             3.20             2.38               2.25                1.96             1.87              1.76
  box office
  (US$ billion)                                                                                                                                                                                9

Source: UK Film Council RSU.
Criteria: based on four or more appearances, either in lead/title role or supporting role.

                                                                                                                                                                                               10

7.3 UK directors
Nineteen of the 200 highest grossing films at the worldwide box office have been directed by British directors                                                                                 11
(Figure 7.3 and Table 7.2). David Yates’s two Harry Potter films (Harry Potter and the Order of the Phoenix and
Harry Potter and the Half-Blood Prince) made him the British director with the most commercial success in recent
years, with total box office takings of $1.87 billion. Christopher Nolan is second following Batman Begins and                                                                                 12
The Dark Knight, with combined box office takings of $1.37 billion. In third place is Mike Newell who directed
Harry Potter and the Goblet of Fire, which grossed $896 million. Ridley Scott was the most prolific director, with
three films (Kingdom of Heaven, Hannibal and American Gangster) in the top 200, grossing over $826 million                                                                                     13
between them. The success of The Bourne Supremacy and The Bourne Ultimatum ensures that Paul Greengrass
features twice in the top 200 list, with a combined gross of $731 million. Two new British directors appear in the
top 200 films due to the success of their 2009 films. These are Danny Boyle who directed Slumdog Millionaire, which                                                                            14
grossed $362 million, and Guy Ritchie, whose Sherlock Holmes has grossed $417 million to date. Three women
feature in the top 200 list – Sharon Maguire and Beeban Kidron – for Bridget Jones’s Diary and Bridget Jones:
The Edge of Reason respectively and also Phyllida Lloyd, who made the transition from West End stage to film
                                                                                                                                                                                               15
with her 2008 debut feature, Mamma Mia!.


                                                                                                                                                                                               16


                                                                                                                                                                                               17


                                                                                                                                                                                               18


                                                                                                                                                                                               19


                                                                                                                                                                                               20


                                                                                                                                                      Chapter 7: UK talent and awards – 55
                                                                                                                                                                                               21
Figure 7.3 Top 10 UK directors based on top 200 grossing films, 2001–2009
(number of films in brackets)
Gross box office (US$ million)
1,900


1,425


  950


  475


    0
                       2)


                                         )


                                                           )


                                                                            )


                                                                                            )


                                                                                                            )


                                                                                                                           )


                                                                                                                                           )


                                                                                                                                                             )


                                                                                                                                                                              )
                                        (2


                                                          (1


                                                                        (3


                                                                                            (2


                                                                                                           (1


                                                                                                                         (1


                                                                                                                                       (1


                                                                                                                                                            (1


                                                                                                                                                                             (1
                      s(


                                    an


                                                         l


                                                                       tt


                                                                                        ss


                                                                                                       d


                                                                                                                         e


                                                                                                                                      le


                                                                                                                                                        on


                                                                                                                                                                         re
                                                      el
                    te


                                                                                                                     hi
                                                                                                       oy
                                                                        o


                                                                                                                                       y
                                                                                       ra


                                                                                                                                                                        ui
                                                      w
                                   ol


                                                                                                                                                       dr
                                                                                                                                    Bo
                  Ya


                                                                     Sc


                                                                                                                    tc
                                                                                                      Ll


                                                                                                                                                                        ag
                                                                                        g
                                                    Ne
                                    N


                                                                                                                                                      Ki
                                                                                                                    Ri
                                                                                     en
                                                                 ey


                                                                                                   a


                                                                                                                                 y
                d


                                                                                                                                                                       M
                                 er


                                                                                                                                nn
                                                                                                 lid


                                                                                                                                                  an
              vi


                                                                                                                uy
                                                  e


                                                                                   re
                                                                dl
                             ph


                                                ik
            Da


                                                                                                                                                                  on
                                                                                                 yl
                                                                                G


                                                                                                                               Da
                                                                                                                G


                                                                                                                                                 eb
                                                                Ri
                                                M
                            to


                                                                                              Ph


                                                                                                                                                                  ar
                                                                                ul


                                                                                                                                                 Be
                           ris


                                                                                                                                                                 Sh
                                                                              Pa
                       Ch


  Gross              1,871              1,370             896          826              731             585              417               362              261              254
  box office
  (US$ million)

Source: UK Film Council RSU.


Table 7.2 UK directors from the top 200 films at the global box office and their films, 2001–2009
                                                                                                                                                                           Total gross
                                                                                                                                                                            box office
Director                                                                                                                                          Film(s)                (US$ million)

David Yates                                                                        Harry Potter and the Order of the Phoenix,
                                                                                       Harry Potter and the Half-Blood Prince                                                 1,871
Christopher Nolan                                                                            Batman Begins, The Dark Knight                                                   1,370
Mike Newell                                                                               Harry Potter and the Goblet of Fire                                                   896
Ridley Scott                                                                American Gangster, Hannibal, Kingdom of Heaven                                                      826
Paul Greengrass                                                               The Bourne Supremacy, The Bourne Ultimatum                                                        731
Phyllida Lloyd                                                                                                  Mamma Mia!                                                      585
Guy Ritchie                                                                                                  Sherlock Holmes                                                    417
Danny Boyle                                                                                               Slumdog Millionaire                                                   362
Beeban Kidron                                                                              Bridget Jones: The Edge of Reason                                                    261
Sharon Maguire                                                                                           Bridget Jones’s Diary                                                  254
Simon West                                                                                            Lara Croft: Tomb Raider                                                   252
Richard Curtis                                                                                                   Love Actually                                                  245
Steve Bendelack                                                                                             Mr Bean’s Holiday                                                   228
Tom Vaughan                                                                                          What Happens in Vegas                                                      219
Source: UK Film Council RSU.


56 – UK Film Council Statistical Yearbook 2010
1


                                                                                                                                                                      2


7.4 Awards for UK films and talent                                                                                                                                    3

UK films and British talent, in front of and behind the camera, have enjoyed major award recognition since 2001.
Table 7.3 illustrates the number of awards won by UK films and individuals at two major international award
ceremonies (Academy Awards®, BAFTA Film Awards) and the major international film festivals (Berlin, Cannes,                                                           4
Sundance, Toronto and Venice). In all, there were 241 award winners, representing 14% of the awards made.

                                                                                                                                                                      5
Table 7.3 Awards for British films and talent, 2001–2009	
Year                                                                                             Number of UK award winners*                            UK share %

2001                                                                                                                  25                                       14     6
2002                                                                                                                  24                                       15
2003                                                                                                                  22                                       13
                                                                                                                                                                      7
2004                                                                                                                  22                                       13
2005                                                                                                                  23                                       14
2006                                                                                                                  25                                       14     8
2007                                                                                                                  32                                       15
2008                                                                                                                  32                                       15
                                                                                                                                                                      9
2009                                                                                                                  36                                       17
Total                                                                                                                241                                       14
*Awards include Academy Awards® and BAFTA Film Awards, and Berlin, Cannes, Sundance, Toronto and Venice festivals.                                                    10
Source: UK Film Council.

UK films and talent won 36 major academy and festival awards in 2009, 17% of the total number conferred (Table
7.4). Slumdog Millionaire won six awards for UK talent, including Best Film and Best Director, at both the Academy®                                                   11
and BAFTA awards (in total Slumdog Millionaire won eight Academy Awards® and seven BAFTAs). Kate Winslet was
also awarded Best Leading Actress at both the Academy® and BAFTA awards for her role in The Reader.
                                                                                                                                                                      12


                                                                                                                                                                      13


                                                                                                                                                                      14


                                                                                                                                                                      15


                                                                                                                                                                      16


                                                                                                                                                                      17


                                                                                                                                                                      18


                                                                                                                                                                      19


                                                                                                                                                                      20


                                                                                                                               Chapter 7: UK talent and awards – 57
                                                                                                                                                                      21
The documentary Man on Wire followed its 2008 success at the Sundance Film Festival by being awarded the 2009
Oscar® for Best Documentary Feature. This film was also given an Outstanding British Film award at the BAFTAs.
Andrea Arnold was awarded the Jury Prize at the Cannes Film Festival for Fish Tank, and two British documentaries
received awards at Sundance. Kim Longinotto won the Grand Jury Prize – World Cinema – Documentary for Rough
Aunties, and Havana Marking won two prizes, the Directing Award – World Cinema – Documentary and the
Audience Award – World Cinema – Documentary, for Afghan Star.

Table 7.4 UK award winners, 2009
Award ceremony/festival           Award                                Recipient                     Title

Academy Awards            ®
                                  Best Motion Picture of the Year      Christian Colson              Slumdog Millionaire
22 February 2009
                                  Best Performance by an Actress in
                                                                       Kate Winslet                  The Reader
                                  a Leading Role
                                  Best Achievement in Directing        Danny Boyle                   Slumdog Millionaire
                                  Best Writing, Screenplay Based
                                                                       Simon Beaufoy                 Slumdog Millionaire
                                  on Material Previously Produced
                                  or Published
                                  Best Achievement in Cinematography   Anthony Dod Mantle            Slumdog Millionaire
                                  Best Achievement in Costume Design   Michael O’Connor              The Duchess
                                                                       Ian Tapp, Richard Pryke
                                  Best Achievement in Sound Mixing                                   Slumdog Millionaire
                                                                       (with Resul Pookutty)
                                  Best Achievement in Editing          Chris Dickens                 Slumdog Millionaire
                                  Best Documentary, Features           James Marsh, Simon Chinn      Man on Wire
BAFTA Film Awards                 Best Film                            Christian Colson              Slumdog Millionaire
8 February 2009
                                  Leading Actress                      Kate Winslet                  The Reader
                                  Director                             Danny Boyle                   Slumdog Millionaire
                                  Original Screenplay                  Martin McDonagh               In Bruges
                                  Adapted Screenplay                   Simon Beaufoy                 Slumdog Millionaire
                                  Cinematography                       Anthony Dod Mantle            Slumdog Millionaire
                                  Costume Design                       Michael O’Connor              The Duchess
                                                                       Glenn Freemantle, Richard
                                  Sound                                                              Slumdog Millionaire
                                                                       Pryke, Tom Sayers, Ian Tapp
                                                                       (with Resul Pookutty)
                                  Editing                              Chris Dickens            Slumdog Millionaire
                                  Short Film                           Esther Campbell          September
                                                                                                Wallace and Gromit in
                                  Short Animation                      Nick Park, Steve Pegram,
                                                                                                “A Matter of Loaf and
                                                                       Bob Baker
                                                                                                Death”
                                  Outstanding British Film             James Marsh, Simon Chinn Man on Wire
                                  Outstanding British Contribution     Pinewood and Shepperton
                                  to Cinema                            Studios


58 – UK Film Council Statistical Yearbook 2010
1


                                                                                                                                         2


                                                                                                                                         3


                                                                                                                                         4


                                                                                                                                         5
Table 7.4 UK award winners, 2009 (continued)
Award ceremony/festival           Award                                    Recipient              Title
                                                                                                                                         6
BAFTA Film Awards      The Carl Foreman Award for Special
                                                                           Steve McQueen          Hunger
8 February 2009 cont. Achievement by a British Director,
                       Writer or Producer in their First
                       Feature Film                                                                                                      7

                       Orange Rising Star Award                            Noel Clarke
                       Academy Fellowship                                  Terry Gilliam
                                                                                                                                         8
Berlin International   Silver Bear, Best Short Film                        Daniel Elliott         Jade
Film Festival
5–15 February 2009                                                                                                                       9
                       Prize of the Ecumenical Jury –
                                                                           Richard Loncraine      My One and Only
                       Special Mention
Cannes Film Festival   Jury Prize                                          Andrea Arnold          Fish Tank                              10
13–24 May 2009
                       Best Actress                                        Charlotte Gainsbourg   Antichrist
Sundance Film Festival Grand Jury Prize – World Cinema –                                                                                 11
                                                                           Kim Longinotto         Rough Aunties
15–25 January 2009 Documentary

                                                                                                                                         12
                                  Directing Award – World Cinema –
                                                                           Havana Marking         Afghan Star
                                  Documentary
                                  World Cinema Screen Writing Award        Guy Hibbert            Five Minutes of Heaven
                                                                                                                                         13
                                  Audience Award – World Cinema –
                                                                           Havana Marking         Afghan Star
                                  Documentary
                                  Audience Award – World Cinema –                                                                        14
                                                                           Lone Scherfig          An Education
                                  Dramatic
                                  Short Filmmaking Award – Honorable
                                                                           Sam Taylor-Wood        Love You More
                                  Mention                                                                                                15
Venice Film Festival              Volpi Cup – Best Actor                   Colin Firth            A Single Man
2–12 September 2009
Source: UK Film Council.                                                                                                                 16
Note: No awards were made to British talent or films at Toronto in 2009.


                                                                                                                                         17


                                                                                                                                         18


„
 3F
   or more details on the film distribution sector in 2009 see Chapter 8 (page 60)                                                     19

 3F
   or more information about the exhibition sector in 2009 see Chapter 9 (page 65)
 3F
   or more background on film production in 2009 see Chapter 16 (page 132)
                                                                                                                                         20


                                                                                                  Chapter 7: UK talent and awards – 59
                                                                                                                                         21
Chapter 8: Distribution


Film distribution in the         Facts in focus

UK is dominated by a few         •  he top 10 distributors had a 92% share of the market
                                   T
                                   in 2009, down from 95% in 2008.
very large companies but a       •  eekdays (Monday to Thursday) accounted for 42% of
                                   W
number of smaller companies        the box office, the highest share since our records began.

distribute almost as many        •  pening weekends represented 26% of the total
                                   O
                                   box office.
titles. Their combined
                                 •  stimated total advertising spend was £168 million,
                                   E
spending on advertising            a 2% fall on 2008.
was less in 2009 than in 2008,
but with fewer films released,
the average spend per film
saw very little change.
1


                                                                                                                                                                                 2


8.1 Distributors in 2009                                                                                                                                                         3

The top 10 distributors had a 92% share of the market in 2009, down from 95% in 2008 (Table 8.1) The remaining
83 distributors handled a total of 374 titles, 65% of the total, but gained only an 8% share of the box office.
The leading distributor was 20th Century Fox, which released the highest grossing film of all time in the UK, Avatar                                                             4
(though Table 8.1 includes box office data only to 3 January 2010, when Avatar’s takings were £32.8 million, still
below Mamma Mia!’s old record) as well as Ice Age III and Alvin and the Chipmunks 2: The Squeakquel. Walt Disney
Studios was the second highest grossing distributor, with films such as Up, A Christmas Carol and Bolt. Sony Pictures                                                            5
was in third place thanks to 2012 and Angels and Demons.

                                                                                                                                                                                 6
Table 8.1 Distributor share of box office, UK and Republic of Ireland, 2009
                                                                                                    Market                           Films on                      Box office
                                                                                                     share                             release                         gross
Distributor                                                                                            (%)                               2009                      (£ million)   7
20th Century Fox                                                                                   16.6                                    24                      178.7
Walt Disney Studios                                                                                12.4                                    22                      133.3
                                                                                                                                                                                 8
Sony Pictures                                                                                      11.3                                    28                      122.2
Warner Bros                                                                                        11.2                                    25                      120.8
Paramount                                                                                          10.8                                    19                      116.6         9
Universal Pictures                                                                                 10.5                                    29                      113.4
Entertainment                                                                                       8.6                                    24                       92.4
                                                                                                                                                                                 10
E1 Films                                                                                            4.9                                    11                       53.1
Lions Gate                                                                                          2.9                                    14                       31.8
Pathé                                                                                               2.9                                     5                       31.7         11
Sub-total                                                                                          92.2                                   201                      994.0
Others (83 distributors)                                                                            7.8                                   374                       83.5
Total                                                                                             100.0                                   575                    1,077.5         12

Source: Rentrak EDI.
Box office gross = cumulative box office total for all films handled by the distributor in the period 2 January 2009 to 3 January 2010.
Note: Percentages do not add to sub-total due to rounding.                                                                                                                       13

Table 8.2 highlights the top 10 distributors of foreign language films at the UK box office. Companies that release
Indian films, such as Yash Raj, Eros, Adlabs and UTV Communications, are well represented in the list. Curzon
                                                                                                                                                                                 14
Artificial Eye released the most foreign language titles (13) in 2009, while Optimum’s eight releases had the biggest
share of the box office (£4.5 million). Optimum’s releases included Coco Before Chanel, which was the highest
grossing foreign language film of the year.
                                                                                                                                                                                 15


                                                                                                                                                                                 16


                                                                                                                                                                                 17


                                                                                                                                                                                 18


                                                                                                                                                                                 19


                                                                                                                                                                                 20


Image: Coco Before Chanel courtesy of Optimum Releasing                                                                                          Chapter 8: Distribution – 61
                                                                                                                                                                                 21
Table 8.2 Top 10 distributors of foreign language films in the UK and Republic of Ireland, 2009
(ranked by box office gross)
                                                                                                         Films                      Average               Box office
                                                                                                     released                   widest point                  gross
Distributor
                                                                                                      in 2009                     of release              (£ million)

Optimum Releasing                                                                                          8                                42                 4.5
Eros International                                                                                         9                                36                 3.3
Curzon Artificial Eye                                                                                     13                                15                 2.5
Adlabs                                                                                                     6                                31                 2.3
Momentum                                                                                                   5                                40                 2.1
Warner Bros                                                                                                2                                77                 1.8
UTV Communications                                                                                         7                                34                 1.5
Yash Raj                                                                                                   4                                34                 1.2
B4U Network                                                                                                6                                21                 1.0
Studio 18                                                                                                  4                                37                 0.9
Source: Rentrak EDI, RSU analysis.
Note: The list includes distributors releasing two or more foreign language titles in the period 2 January 2009 to 3 January 2010.


8.2 Distributors 2004–2009
The distributors’ market shares fluctuate from year to year (Table 8.3). The leading distributor of 2009, 20th Century
Fox, saw its market share increase thanks to films such as Avatar and Ice Age III. The share of box office made by
distributors outside the top 10 ranged from under 3% in 2005 to over 5% in 2007 and 2008 and just under 8%
in 2009.

Table 8.3 Distributor market share as percentage of box office gross, 2004–2009
Distributor                                                               2004                2005                 2006              2007          2008        2009

20th Century Fox                                                       10.7                14.3                   20.9          13.9               9.4      16.6
Walt Disney                                                            14.5                13.1                   15.7          10.7               9.9      12.4
Sony Pictures                                                          10.0                 6.8                   16.1           8.2              12.5      11.3
Warner Bros                                                            14.7                18.2                    8.2          15.6              11.0      11.2
Paramount                                                                 –                   –                      –          14.7              16.9      10.8
Universal Pictures                                                        –                   –                      –          13.9              18.5      10.5
Entertainment                                                           7.9                 9.4                    7.9           9.5               8.0       8.6
E1 Films                                                                  –                   –                      –             –                 –       4.9
Lions Gate                                                              1.0                 0.3                    2.4           2.3               2.5       2.9
Pathé                                                                   2.8                 3.4                    3.2           1.3               2.1       2.9
Momentum                                                                2.2                 1.9                    2.3           3.4               3.5         –
UIP*                                                                   29.8                29.1                   18.9             –                 –         –
Top 10 total**                                                         96.1                97.3                   96.4          94.5              94.5      92.2
Others                                                                  3.9                 2.7                    3.6           5.5               5.5       7.8
Total                                                                 100.0               100.0                  100.0         100.0             100.0     100.0
Source: Rentrak EDI.
*Until 2006 Paramount and Universal distributed jointly as UIP.
**Top 10 total refers to the top 10 distributors of that particular year. Table is ranked by top 10 distributors in 2009.
Note: Percentages may not add to sub-totals due to rounding.


62 – UK Film Council Statistical Yearbook 2010
1


                                                                                                                                                                                   2


8.3 Weekend box office                                                                                                                                                             3

In 2009, 58% of the box office was taken at weekends (Friday to Sunday), almost the same as the 59% seen in 2008,
which was down from 64% in 2007 (Table 8.4). As in 2008, the films released in 2009 included some that attracted
large weekday audiences. Family films tend to attract weekday audiences, and some of 2009’s family films, such as                                                                  4
Ice Age III, Up and Alvin and the Chipmunks 2: The Squeakquel, were very successful at the box office. In addition,
the ‘Orange Wednesdays’ promotion continued to have an impact in 2009 with 14% of the box office being taken
on Wednesdays (compared with 12% in 2008).                                                                                                                                         5


Table 8.4 Box office percentage share by weekday/weekend, 2004–2009
                                                                                                                                                                                   6
                                                2004                    2005                     2006                     2007                      2008                  2009

Friday                                       15.3                     18.0                     16.5                    16.4                        16.7                 16.4
Saturday                                     24.5                     27.0                     25.1                    27.8                        24.4                 24.0       7

Sunday                                       19.9                     19.0                     18.7                    19.3                        18.3                 17.8
Weekend                                      59.7                     64.0                     60.3                    63.5                        59.4                 58.2
                                                                                                                                                                                   8
Monday                                        9.7                      8.0                      9.5                     7.2                         9.4                  9.2
Tuesday                                      10.1                      8.0                      9.5                     9.0                         9.5                  9.5
Wednesday                                    10.7                     10.0                     10.9                    11.6                        11.9                 13.7       9
Thursday                                      9.8                     10.0                      9.7                     8.7                         9.9                  9.5
Weekday                                      40.3                     36.0                     39.7                    36.5                        40.7                 41.8
                                                                                                                                                                                   10
Total                                       100.0                    100.0                    100.0                   100.0                       100.0                100.0
Source: Rentrak EDI.
Note: Percentages may not add to sub-totals due to rounding.
                                                                                                                                                                                   11
The opening weekend box office as a share of total theatrical revenue fell to 26% in 2009 as shown in Table 8.5.
Some of the top films such as Ice Age III, Slumdog Millionaire and The Hangover had longer theatrical runs and
so their opening weekend represented a smaller share of overall box office. The opening weekend box office as                                                                      12
a percentage of total theatrical revenue for Slumdog Millionaire was just 6%. However, this film’s success at the
BAFTA Awards and Academy Awards® was a significant factor in its box office success, and these awards were
won after its opening weekend.                                                                                                                                                     13


Table 8.5 Opening weekend as percentage of total box office, 2007–2009
                                                                                                                                                                                   14
                                                                                               % of total in                      % of total in                    % of total in
                                                                                                  opening                            opening                          opening
                                                                                                  weekend                            weekend                          weekend
Range of box office results                                                                           2007                               2008                             2009
                                                                                                                                                                                   15
All films                                                                                            28.5                              27.3                              26.1
More than £30 million                                                                                35.8                              21.7                              18.8
£20 million – £30 million                                                                            30.2                              31.0                              23.0      16
£10 million – £19.9 million                                                                          20.0                              29.2                              32.2
£5 million – £9.9 million                                                                            25.4                              27.6                              26.1
                                                                                                                                                                                   17
£1 million – £4.9 million                                                                            28.1                              27.4                              30.3
£200,000 – £999,000                                                                                  31.9                              34.1                              35.5
Less than £200,000                                                                                   34.1                              34.8                              36.5      18
Source: Rentrak EDI, RSU analysis.
Opening weekends include preview figures. For films with a limited initial opening, the wider release figure is included in the analysis.

                                                                                                                                                                                   19


                                                                                                                                                                                   20


                                                                                                                                                    Chapter 8: Distribution – 63
                                                                                                                                                                                   21
Chapter 1:
8.4 Release costs
The opening weekend is recognised as being crucial
                                                                               Where the data are available, the total release costs
                                                                               for various release widths can be estimated. By taking
                                                                               a typical print cost of £1,000 per print and adding the
The box office
to the lifetime of a film, both in cinemas and on
subsequent release platforms. Distributors invest heavily
                                                                               Nielsen Media Research advertising spend estimate plus
                                                                               20% for other public relations campaigns, publicity and
in advertising in order to raise a film’s profile across all                   premiere costs, the average release cost for each level
media (outdoor posters, print media, television, radio                         of theatrical release can be calculated (Table 8.7).
and increasingly online). The estimated total distributor                      This shows that for films released across the widest
advertising spend in 2009 was £168 million, down 2%                            number of cinemas (500+), the average release cost was
from £172 million in 2008 (Table 8.6). However, fewer                          £3.4 million, compared with almost £4 million in 2008.
films were released in 2009, and the average advertising
spend per film in 2009, at £0.3 million, was very similar                      Average release costs for the films with the widest
to that in 2008. Press spend has fallen over the last six                      releases have decreased from 2008 levels but, as
years (from £30.1 million in 2003) while the internet                          indicated above, the 2009 average advertising costs
has emerged as an outlet for film advertising (internet                        for all films was very similar to the 2008 average.
advertising spend dipped slightly from 2007 to 2008,                           While the films with the widest releases (ie those
but increased from £4.5 million in 2008 to £6.4 million                        which spend most on advertising) spent less per film
in 2009). Approximately £28 million was spent on                               on advertising in 2009 than in 2008, there were more
advertising British films, down from £43 million in 2008.                      of these films in 2009, and so the overall advertising
This drop in advertising of UK films was largely due to                        spend in 2009 was similar to that in 2008.
the lower number of UK/USA studio films released in
2009. There were 13 studio-backed UK films released                            Table 8.7 Estimated release cost by width of release,
in 2009 (five of which were re-releases which received                         2008–2009
little or no advertising) compared with 22 in 2008.
                                                                                                                              Average         Average
                                                                                                                               release         release
                                                                               Sites at widest                              cost 2008       cost 2009
Table 8.6 Estimated advertising spend,                                         point of release                             (£ million)     (£ million)
2003 and 2007–2009
                                                                               500                                            3.95            3.40
                                                                 (£ million)
                                                                               400–499                                         2.21            2.05
                                  2003           2007     2008        2009
                                                                               300–399                                         1.39            1.32
TV                            61.2           74.1        79.3      74.3        200–299                                         0.90            0.84
Outdoor                       46.6           65.3        56.2      57.0        100–199                                         0.43            0.51
Press                         30.1           27.0        22.6      19.9        50–99                                           0.18            0.21
Radio                          9.7            8.4         9.4      10.7        10–49                                           0.08            0.06
Internet                         –            4.7         4.5       6.4        10                                             0.01            0.01
Total                        147.6          179.5       172.0     168.3
                                                                               Source: Nielsen Media Research, Rentrak EDI, RSU analysis.
Source: Nielsen Media Research.


„
 3F
   or further details about the UK box office in 2009 see Chapter 1 (page 8)
 3F
   or more information about the top films at the UK box office in 2009 see Chapter 2 (page 15)
 3F
   or an overview of employment in film distribution see Chapter 21 (page 182)


64 – UK Film Council Statistical Yearbook 2010
Chapter 9:
Exhibition


The number of screens in the     Facts in focus

UK continues to rise, although   •  he UK had 3,651 screens, 41 more than 2008,
                                   T
                                   in 723 cinemas.
the availability of screens      •  here were six screens for every 100,000 people, the
                                   T
and admissions per person          same as in 2008, but lower than some other countries.

vary considerably across the     •  orthern Ireland had the highest number of screens
                                   N
                                   (9.6) per 100,000 people in the UK, while the East
country. The number of digital     Midlands (4.7), the North East (4.3) and the East
screens doubled during 2009,       of England (4.1) had the lowest.

while the number of 3D digital   •  nly 7% of screens were dedicated to ‘specialised’
                                   O
                                   (that is non-mainstream) programming, with 0.3%
screens increased by over          dedicated mainly to South Asian films.

six times.                       •  he UK had the second highest number of digital screens
                                   T
                                   in Europe with 642 screens (behind France’s 959 digital
                                   screens). The UK had 449 screens capable of screening
                                   digital 3D features (70% of all digital screens).
                                 •  he average ticket price was £5.44.
                                   T
9.1 UK cinema sites
Figure 9.1 shows the number of cinema sites in the UK from 2002 to 2009. The number of sites decreased slightly
in 2004 but rose to a high of 727 sites by 2007. In 2008 sites fell by one to 726, and fell by a further three, to 723,
in 2009. The number of multiplex sites increased from 269 in 2008 to 275 in 2009. In 2009 multiplexes made up
38% of all cinema sites.

Figure 9.1 UK cinema sites by type of site, 2002–2009
Number of sites
800

700

600

500

400

300

200

100

  0                        2002                  2003            2004               2005               2006               2007               2008              2009
   Multiplex                229                  234              238                242                249                258                269                275
   Traditional and
   mixed use                439                  444              406                417                448                469                457                448
   Total sites              668                  678              644                659                697                727                726               723
   % multiplex sites          34                  35               37                 37                 36                 35                 37                 38

Source: Dodona Research, RSU analysis.
Note: Data on cinema sites prior to 2002 not availabe. Multiplexes are defined as purpose-built cinema complexes with five screens or more while
excluding those that were converted from traditional cinema sites.


9.2 UK screens
The number of owned or programmed cinema screens (excluding those operated in venues such as schools and
private screening rooms) continued to increase slightly in 2009, rising by just over 1% to 3,651 as Figure 9.2 shows.
The proportion of multiplex screens (see definition in the note to Figure 9.1) continued to rise in 2009. There has
been an increase of 68% in the number of multiplex screens since 1999 compared with a 19% fall in the number of
traditional and mixed use screens (used for film screenings only part of the time). The UK has gained 1,111 multiplex
screens since 1999 and lost 218 traditional or mixed use screens. The proportion of multiplex screens increased from
59% in 1999 to 75% in 2009.


66 – UK Film Council Statistical Yearbook 2010                                                                           Image: Love Aaj Kal courtesy of Eros International
1


                                                                                                                                          2


Figure 9.2 UK cinema screens by type of cinema, 1999–2009                                                                                 3
Number of screens
4,000

3,500                                                                                                                                     4
3,000

2,500
                                                                                                                                          5
2,000

1,500

1,000                                                                                                                                     6

 500

    0                      1999          2000    2001    2002    2003    2004     2005   2006        2007        2008         2009
                                                                                                                                          7
   Multiplex              1,624          1,874   2,115   2,299   2,362   2,426   2,453   2,512       2,578      2,689        2,735
   Traditional and
   mixed use              1,134          1,080   1,049    959     956     916      904    928         936         921          916
   Total sites            2,758          2,954   3,164   3,258   3,318   3,342   3,357   3,440       3,514      3,610        3,651        8
   % multiplex screens      58.9          63.4    66.8    70.6    71.2    72.6    73.1    73.0        73.4       74.5          74.9

Source: Dodona Research, RSU analysis.
See note to Figure 9.1.
                                                                                                                                          9

Table 9.1 shows that more multiplex sites and screens opened than closed in 2009 while there were net falls in the
number of traditional sites and screens over the same period. The number of traditional screens fell for the second
                                                                                                                                          10
year in succession, after two small rises in 2006 and 2007 as shown in Figure 9.2.
A total of 34 sites (all but two traditional) closed in 2009, nine fewer than the number of closures in 2008, with
a loss of 63 screens (the same number as in 2008). Thirty-one sites opened (including eight multiplexes), adding                          11
105 screens, including 67 multiplex screens.

Table 9.1 Site openings and closures, 2009                                                                                                12

                                                                                         Multiplex                          Traditional

                                                                                 sites    screens              sites           screens
                                                                                                                                          13
Opened                                                                            8         67                  23                 38
Closed                                                                            2         21                  32                 42
Net difference                                                                   +6        +46                  –9                 –5     14

Source: Dodona Research, RSU analysis.
See note to Figure 9.1.

                                                                                                                                          15

9.3 Screen location
Historically, cinemas have been a feature of the urban landscape and 2009 was no different with 97% of all screens                        16
in the UK in town or city centres, edge of centre, ‘out of town’ or suburban locations.
Table 9.2 shows suburban and rural cinemas tend to have fewer screens on average than their urban counterparts,
                                                                                                                                          17
although town and city centre sites are also relatively small. In 2009, while there was a significant fall in the
percentage of suburban screens, the number of suburban screens lost was just three. The number of rural screens
rose fractionally from 95 in 2008 to 97 in 2009.
                                                                                                                                          18


                                                                                                                                          19


                                                                                                                                          20


                                                                                                             Chapter 9: Exhibition – 67
                                                                                                                                          21
Table 9.2 Screens by location, 2003–2009
                                                                                                                                               Average
                                                                                                                               % change      number of
Location                                  2003               2004     2005     2006       2007           2008           2009    2008/09 screens per site

Town/city centre                      1,470           1,502         1,495    1,555      1,616          1,683      1,732         +2.9               3.8
Out of town                           1,234           1,243         1,250    1,262      1,284          1,303      1,297          –0.5              9.8
Edge of centre                          464             465           479      478        486            499        498          –0.2              9.1
Suburban                                 33              33            38       40         30             30         27         –10.0              1.8
Rural                                   117              99            95      105         98             95         97         +2.1               1.4
Total                                 3,318           3,342         3,357    3,440      3,514          3,610      3,651         +1.1               5.0
Source: Dodona Research, RSU analysis.


9.4 Screen density and admissions per person – international comparisons
A standard way to gauge the level of cinema provision is by ‘screen density’, that is the number of screens per unit
of population. In 2009, the UK figure was 6.0 screens per 100,000 people, the same as in 2008. This level of screen
access falls short of the numbers in other major film territories: USA (12.8), Australia (9.2), Spain (9.0), France (8.7)
and Italy (7.2). Germany’s screen density, of 5.8 screens per 100,000 people, is slightly less than in the UK (source:
Screen Digest).
Table 9.3 shows the numbers of admissions per person in a number of major film territories. The UK saw more
admissions per person (2.8) than Spain, Italy and Germany despite having lower screen density than Spain and Italy.
Of the major territories, the USA had the highest admissions per person (4.3), closely followed by Australia (4.2).

Table 9.3 Admissions per person in major film territories, 2003–2009
                                                 Australia           USA       France             UK            Spain             Italy        Germany

2003                                                 4.5             5.4        2.9              2.8            3.3               1.5              1.8
2004                                                 4.5             5.2        3.2              2.9            3.4               1.7              1.9
2005                                                 4.0             4.7        2.9              2.7            2.9               1.6              1.5
2006                                                 4.1             4.8        3.1              2.6            2.7               1.6              1.7
2007                                                 4.1             4.6        2.9              2.7            2.6               1.8              1.5
2008                                                 4.0             4.1        3.0              2.7            2.4               1.7              1.6
2009                                                 4.2             4.3        3.2              2.8            2.4               1.7              1.8
Source: Screen Digest.


9.5 Screen density and admissions per person in the UK
As in the previous Yearbooks we are able to present screen provision data based on two types of regional
classification. The datasets are not directly comparable because of differences in the way the regions are defined;
they do, however, shed light on different aspects of national and regional variation in screen provision.


68 – UK Film Council Statistical Yearbook 2010
1


                                                                                                                                                                              2


The Cinema Advertising Association produces monthly admissions totals for each of the television advertising                                                                  3
regions used by the Incorporated Society of British Advertisers (ISBA). Screen and admissions data for 2009 using
these television regions are presented in Table 9.4. Although London had the highest numbers of screens and sites,
its screen density (6.5) was lower than that of Northern Ireland (9.6) and was the same as Central Scotland.
                                                                                                                                                                              4
The North East had the lowest screen density (4.0) among all ISBA regions.

Table 9.4 Screens and admissions by ISBA TV region, 2009 (ranked by screens per 100,000 people)                                                                               5
                                                          % of total                      Population      Screens per        Admissions       Admissions        Admissions
ISBA TV region                             Screens          screens              Sites        (‘000)* 100,000 people             (‘000)        per screen       per person

Northern Ireland                            171              4.7                25         1,775                  9.6         5,705            33,360                 3.2     6

Central Scotland                            237              6.5                38         3,626                  6.5        12,787            53,953                 3.5
London                                      788             21.6               153        12,208                  6.5        41,694            52,911                 3.4
                                                                                                                                                                              7
Wales and West                              302              8.3                70         4,787                  6.3        11,414            37,794                 2.4
Southern                                    332              9.1                81         5,405                  6.1        15,969            48,099                 3.0
Lancashire                                  428             11.7                59         6,971                  6.1        19,760            46,167                 2.8     8
Northern Scotland                            75              2.1                16         1,256                  6.0         3,573            47,644                 2.8
Border                                       36              1.0                19           607                  5.9         1,346            37,401                 2.2
                                                                                                                                                                              9
South West                                  106              2.9                35         1,839                  5.8         4,274            40,317                 2.3
Midlands                                    553             15.1               105         9,831                  5.6        24,624            44,528                 2.5
East of England                             214              5.9                46         4,209                  5.1        11,272            52,675                 2.7     10
Yorkshire                                   292              8.0                51         5,884                  5.0        14,565            49,879                 2.5
North East                                  117              3.2                25         2,894                  4.0         6,480            55,382                 2.2
                                                                                                                                                                              11
Total                                     3,651            100.0               723        61,293                  6.0       173,461            47,511                 2.8
Source: Dodona Research, Beacon Dodsworth, Cinema Advertising Association (CAA), RSU analysis.	
*Mid-year population estimates 2008. Crown copyright material is reproduced with the permission of the Controller Office of Public Sector Information (OPSI).
                                                                                                                                                                              12
There was a positive and statistically significant linear relationship between cinema admissions per person and
screen density in 2009, as shown in Figure 9.3. That is, the higher the number of screens per person, the higher
the admissions level. However, this association should not be interpreted as a causal relationship as it would be                                                             13
hard to prove whether higher demand caused the higher supply of cinema screens or vice versa.
The pattern of admissions by screen density for ISBA regions in 2009 was very similar to the pattern in 2008.
In 2009, as in 2008, some regions had above average screen densities, but their levels of admissions remained                                                                 14
low. For example, Wales and the West had a relatively high screen density of 6.3 per 100,000 people but its cinema
admissions rate was one of the lowest at 2.4 admissions per person. It is hard to pinpoint the reason behind this
observation. The levels of cinema admissions across regions are subject to numerous influences, such as fluctuations                                                          15
in population size during tourist seasons, the age composition of the population, presence or absence of a film
culture and varying competition from other forms of entertainment.
                                                                                                                                                                              16


                                                                                                                                                                              17


                                                                                                                                                                              18


                                                                                                                                                                              19


                                                                                                                                                                              20


                                                                                                                                                 Chapter 9: Exhibition – 69
                                                                                                                                                                              21
Figure 9.3 Cinema admissions per person by screen density across ISBA regions, 2009
Admissions per person
4.0

                                                                                       Central Scotland

3.5                                                                    London
                                                                                                                                                   Northern
                                                                                                                                                   Ireland
                                                                Southern

3.0                               East of               Northern
                                  England               Scotland
                                                                        Lancashire
                                                 Midlands
2.5
                             Yorkshire                                           Wales and West
                                                   South West
                    North East                                      Border
2.0           4                          5                         6                              7                  8                         9                          10
                                                                             Screen density
Source: Dodona Research, Beacon Dodsworth, CAA, RSU analysis.
*Mid-year population estimates 2008. Crown copyright material is reproduced with the permission of the Controller Office of Public Sector Information (OPSI).
Notes:
The line shown above is derived from a weighted linear regression so the results are more influenced by areas with larger population, for example, London
and the Midlands. The relationship between the variables is positive and statistically significant.
The area of the circle is proportional to the ISBA region’s population. Screen density means number of screens per 100,000 people.


Table 9.5 gives screen information for each of the English Government Office Regions, plus Scotland, Wales and
Northern Ireland, which correspond to the areas covered by the nine English Regional Screen Agencies, Scottish
Screen, the Film Agency for Wales and Northern Ireland Screen.

Table 9.5 Screens and population in the nations and Government Office Regions, 2009
(ranked by screens per 100,000 people)
                                                                                                                        Population                                   Average
                                                                                         % of total                       (in ‘000)         Screens per            number of
Nation/Government Office Region                                        Screens             screens           Sites   mid-year 2008*     100,000 people        screens per site

Northern Ireland                                                         171                4.7              25           1,775                    9.6                  6.8
London                                                                   559               15.3             110           7,620                    7.3                  5.1
South East                                                               533               14.6             121           8,380                    6.4                  4.4
Scotland                                                                 325                8.9              63           5,169                    6.3                  5.2
North West                                                               431               11.8              62           6,876                    6.3                  7.0
Wales                                                                    183                5.0              46           2,993                    6.1                  4.0
South West                                                               316                8.7              82           5,209                    6.1                  3.9
West Midlands                                                            310                8.5              53           5,411                    5.7                  5.8
Yorkshire and The Humber                                                 254                7.0              44           5,213                    4.9                  5.8
East Midlands                                                            207                5.7              42           4,433                    4.7                  4.9
North East                                                               112                3.1              22           2,576                    4.3                  5.1
East of England                                                          233                6.4              49           5,729                    4.1                  4.8
Others**                                                                  17                0.5               4              n/a                   n/a                  4.3
Total                                                                  3,651              100.0             723          61,383                    5.9                  5.0
Source: Dodona Research, Office for National Statistics (ONS), RSU analysis.
* Mid-2008 Population Estimates, ONS.
**Others include the Channel Islands and the Isle of Man.
n/a = not available.


70 – UK Film Council Statistical Yearbook 2010
1


                                                                                                                                       2


The pattern of national and regional variation in screen provision changed slightly in 2009 with Scotland and                          3
the South East moving up the screen density rankings. Northern Ireland had the highest number of screens per
100,000 people of the four nations (9.6), followed by Scotland (6.3), Wales (6.1) and England (5.7).
Table 9.5 also reveals that Northern Ireland and the North West had on average over six screens per site compared                      4
with the UK average of five. The South West, Wales and the South East fell below the average, showing a tendency
towards smaller cinemas and, particularly for the South West, proportionally fewer multiplex screens (see Table 9.6).
                                                                                                                                       5

9.6 Type of cinema screens by nation and region
Table 9.6 provides a snapshot of variations in multiplex provision around the UK. The South East had the largest                       6
number of multiplex screens (388), one more than the North West and 32 more than London. The North West
had the highest proportion of multiplex screens (90%). In England the lowest concentration of multiplex screens
was found in the South West (60%), which had a high number of traditional and mixed use screens (the third                             7
highest after London and the South East). The proportion of multiplex screens for England as a whole was 74%.
The Channel Islands and Isle of Man (59%) also had proportionally fewer multiplex screens than the UK average.
                                                                                                                                       8
Table 9.6 Cinema screens by type by nation or Government Office Region, 2009
(ranked by percentage multiplex)
                                                                                                   Traditional and                     9
Nation/Government Office Region                                          Multiplex   % multiplex        mixed use              Total

North West                                                                 387           89.8                44              431
Yorkshire and The Humber                                                   211           83.1                43              254       10

North East                                                                  93           83.0                19              112
Northern Ireland                                                           137           80.1                34              171
                                                                                                                                       11
West Midlands                                                              243           78.4                67              310
Wales                                                                      141           77.0                42              183
Scotland                                                                   248           76.3                77              325       12

East of England                                                            176           75.5                57              233
East Midlands                                                              156           75.4                51              207
                                                                                                                                       13
South East                                                                 388           72.8               145              533
London                                                                     356           63.7               203              559
South West                                                                 189           59.8               127              316       14

Other*                                                                      10           58.8                 7               17
Total                                                                    2,735           74.9               916            3,651
                                                                                                                                       15
Source: Dodona Research, RSU analysis.
*Other includes the Channel Islands and the Isle of Man.


                                                                                                                                       16


                                                                                                                                       17


                                                                                                                                       18


                                                                                                                                       19


                                                                                                                                       20


                                                                                                          Chapter 9: Exhibition – 71
                                                                                                                                       21
9.7 Mainstream, specialised and South Asian programming
Dodona Research categorises screens according to whether they show mostly mainstream, specialised (that is non-
mainstream, including ‘art-house’) or South Asian films.
Table 9.7 shows that by far the majority of screens mostly show mainstream films. In 2009, 551 cinemas with 3,388
screens showed mostly mainstream films (a rise of 1% for screens and a decrease of 1% for sites). This compared
with 168 sites (253 screens, 7% of screens) showing specialised films and four cinemas (10 screens, 0.3% of screens)
dedicated mainly to South Asian films. The numbers of screens showing mostly specialised films increased by 1% in
2009 while the number of cinemas stayed the same.

Table 9.7 Sites and screens by programme, 2005–2009
                                                                             Sites                                               Screens

Programme	                         2005          2006      2007   2008       2009       2005         2006    2007         2008     2009

South Asian                          5             5         4      4         4           18         18        10           10      10
Specialised                        132           157       177    168       168          206        231       255          250     253
Mainstream                         522           535       546    554       551        3,133      3,191     3,249        3,350   3,388
Source: Dodona Research, RSU analysis.

The majority (68%) of specialised screens were found in single, independent cinemas (that is, not part of a chain).
The pattern of programme type by location in 2009 is shown in Table 9.8. Screens showing mostly South Asian films
were located in town or city centres and suburban areas, while those devoted to specialised film were mainly found
in town or city centres. The overall pattern remained similar to last year.

Table 9.8 Percentages of screens by location and programme, 2009
Location                                                                 South Asian       Specialised      Mainstream             Total

Town/city centre                                                             80.0               85.0           44.5               47.5
Out of town                                                                     –                3.2           38.0               35.5
Edge of centre                                                                  –                2.0           14.6               13.6
Suburban                                                                     20.0                3.6            0.5                0.7
Rural                                                                           –                6.3            2.4                2.7
Total                                                                       100.0              100.0          100.0              100.0
Source: Dodona Research, RSU analysis.
Note: Percentages may not add to totals due to rounding.

This geographical analysis is extended in Tables 9.9 and 9.10, which reveal the distribution of South Asian and
specialised screens around the UK. Table 9.9 shows that 80% of all screens showing South Asian films were found
in London, with the remainder in the East Midlands, both areas having large British Asian populations.


72 – UK Film Council Statistical Yearbook 2010
1


                                                                                                                                       2


Table 9.9 Geographical spread of South Asian screens, 2009                                                                             3
Government Office Region                                                                 South Asian screens                      %

London                                                                                                   8                     80
                                                                                                                                       4
East Midlands                                                                                            2                     20
Total                                                                                                   10                    100
Source: Dodona Research, RSU analysis.                                                                                                 5

Screens showing mainly specialised films were concentrated in London and the South East, which housed 45%
of them in 2009 (Table 9.10). Scotland had 28 specialised screens and the South West 26, accounting for 11% and
                                                                                                                                       6
10% respectively, of such screens. The North East (3.2%), Wales (2.8%) and Northern Ireland (0.8%) had the smallest
number of specialised screens.

                                                                                                                                       7
Table 9.10 Geographical spread of specialised screens, 2009
Nation/Government Office Region                                                           Specialised screens                     %

London                                                                                                  75                  29.6       8

South East                                                                                              38                  15.0
Scotland                                                                                                28                  11.1
                                                                                                                                       9
South West                                                                                              26                  10.3
West Midlands                                                                                           17                   6.7
East Midlands                                                                                           15                   5.9       10

East of England                                                                                         15                   5.9
Yorkshire and The Humber                                                                                12                   4.7
                                                                                                                                       11
North West                                                                                              10                   4.0
North East                                                                                               8                   3.2
Wales                                                                                                    7                   2.8       12
Northern Ireland                                                                                         2                   0.8
Total                                                                                                  253                 100.0
                                                                                                                                       13
Source: Dodona Research, RSU analysis.


9.8 Exhibitors                                                                                                                         14

The number of exhibitors that owned or programmed 20 or more screens in the UK was 11 in 2009, the same as
in 2008 (13 in 2005 and 2006, 12 in 2007), as shown in Table 9.11. The five largest exhibitors owned approximately
                                                                                                                                       15
75% of all UK screens. The order of the list remained similar to last year except for Merlin Cinemas, which increased
its number of screens from 26 in 2008 to 31 in 2009, to move ahead of AMC in the list.
                                                                                                                                       16


                                                                                                                                       17


                                                                                                                                       18


                                                                                                                                       19


                                                                                                                                       20


                                                                                                          Chapter 9: Exhibition – 73
                                                                                                                                       21
Table 9.11 Cinema screens by exhibitors with 20+ screens, 2009
                                                                                                                                                         % of
Exhibitor                                                                                                                  Sites      Screens   total screens

Odeon                                                                                                                     106           840         23.0
Cineworld                                                                                                                  76           773         21.2
Vue                                                                                                                        67           641         17.6
National Amusements                                                                                                        21           274          7.5
Ward Anderson                                                                                                              25           213          5.8
Apollo                                                                                                                     13            77          2.1
City Screen                                                                                                                18            51          1.4
Reel Cinemas                                                                                                               14            51          1.4
Movie House Cinemas                                                                                                         5            39          1.1
Merlin Cinemas                                                                                                             10            31          0.8
AMC                                                                                                                         2            28          0.8
Others (14 major exhibitors and 312 independent single venue exhibitors)                                                  366           633         17.3
Total                                                                                                                     723         3,651        100.0
Source: Dodona Research.
Figures correct as at March 2010.
Notes:
Odeon is owned by Terra Firma Capital Partners, a European private equity firm with headquarters in London and Frankfurt.
Cineworld comprises the former Cine-UK and UGC chains and is owned by The Blackstone Group, a multinational private equity company.
Vue, which acquired Warner Village cinemas in 2003, is owned by SBC International Cinemas (headquartered in the UK).
National Amusements is owned by the family of Sumner Redstone, chairman of US media giant Viacom.
Ward Anderson is headquartered in the Republic of Ireland where it operates the Cineplex, IMC and Omniplex chains.


9.9 Exhibitor revenues
Dodona Research reports that total exhibitor revenue in 2009 stood at £1,193 million, 10% higher than in 2008.
Net concession revenue stood at £302 million (a rise of 11% on 2008), while gross advertising revenue totalled
£195 million.
Average ticket prices, calculated by dividing UK box office gross for the year (£944 million) by total UK admissions
(173.5 million), rose from £5.18 in 2008 to £5.44 in 2009, an increase of 5%.


9.10 Digital projection

9.10.1 Digital Screen Network
The UK Film Council’s 239 state-of-the-art digital cinema screens had been installed by the end of 2008. The end of
the final installations marked the beginning of the four-year contract with the cinemas for the delivery of specialised
films. At the end of 2008, the 239 Digital Screen Network screens accounted for a large proportion of the UK’s total
of 310 digital screens. Since then however, the rate of installation of digital screens in cinemas has accelerated, and
at the end of 2009 there were 642 digital screens in UK cinemas.


9.10.2 Digital screens worldwide and in the UK
According to Screen Digest, at the end of 2009 there were 16,335 DCI–level (Digital Cinema Initiatives; see Glossary)
digital screens worldwide, 86% up on 8,800 screens in 2008. Table 9.12 shows the number of high-end digital (often
referred to as ‘D-Cinema’ in the industry) screens in the world from 2005 to 2009. Worldwide, digital screens have
increased almost twenty-fold since 2005.


74 – UK Film Council Statistical Yearbook 2010
1


                                                                                                                                                                                 2


Table 9.12 Number of high-end digital screens in the world, 2005–2009                                                                                                            3
                                                                                                                                                                            %
                                                                                                                                                      % of           change in
                                                                                                                                                      2009             screens
Region                                               2005               2006                2007               2008               2009                total           2008/09    4
Americas                                            345             2,030               4,666              5,754              8,185                50.1                42.2
Asia-Pacific                                        272               430                 919              1,471              3,488                21.4               137.1
                                                                                                                                                                                 5
Europe                                              229               532                 864              1,547              4,580                28.0               196.1
of which UK                                          38               148                 296                310                642                 3.9               107.1
Africa and Middle East                                2                 4                   6                 28                 82                 0.5               192.9      6
Total                                               848             2,996               6,455              8,800             16,335               100.0                85.6
Source: Screen Digest.
Note: Figures prior to 2007 include a small number of digital screens using the earlier projectors (1.3K DLP Cinema projectors) that do not meet the DCI specifications.         7
The minimum projector resolution for DCI is 2K (see Glossary). Figures valid to March 2010.

The rise in the worldwide number of digital screens continued in 2009, with a total increase of 7,535 screens.
It was fuelled by the continuing growth of digital screens in Europe, which had the largest percentage increase                                                                  8

from 2008 to 2009 and the largest increase in numbers (40% of the worldwide total). North and South America’s
increase in digital screens from 2008 to 2009 accounted for 32% of the worldwide increase, and the Asia-Pacific
region accounted for 27%. The number of digital screens in Africa and the Middle East increased by 193%, from                                                                    9
28 in 2008 to 82 in 2009, but this increase of 54 screens represented just 0.5% of the worldwide total increase.
In Europe 12 countries, led by France, had more than 100 digital screens in 2009, compared with five in 2008 as
                                                                                                                                                                                 10
shown in Table 9.13. The top five countries had 63% (62% in 2008) of all of the high-end digital screens in Europe.
France increased its number of screens by 278% from 254 in 2008 to 959 in 2009, to have the largest number of
digital screens in Europe (21% of the European total). The largest percentage increases from 2008 to 2009, however,
were seen in the Czech Republic (780% increase from five to 44 screens) and in Finland (514% increase from seven                                                                 11

to 43 screens).

                                                                                                                                                                                 12
Table 9.13 European countries with 100 or more high-end digital screens, 2008–2009
(ranked by number of screens in 2009)
                                                                                                                                                      % of                       13
                                                                                                                                   Year               2009          % increase
                                                                                                                                                    Europe               from
Country                                                                                                        2008               2009                total              2008

France                                                                                                       254                 959               20.9               277.6      14

UK                                                                                                           310                 642               14.0               107.1
Germany                                                                                                      164                 525               11.5               220.1
                                                                                                                                                                                 15
Italy                                                                                                         78                 415                9.1               432.1
Russia                                                                                                        98                 331                7.2               237.8
Spain                                                                                                         58                 286                6.2               393.1      16
Austria                                                                                                      119                 239                5.2               100.8
Poland                                                                                                        56                 191                4.2               241.1
                                                                                                                                                                                 17
Portugal                                                                                                      36                 178                3.9               394.4
Belgium                                                                                                      107                 142                3.1                32.7
Netherlands                                                                                                   36                 105                2.3               191.7      18
Republic of Ireland                                                                                           46                 101                2.2               119.6
Rest of Europe                                                                                               185                 466               10.2               151.9
                                                                                                                                                                                 19
Europe total                                                                                               1,547               4,580              100.0               196.1
Source: Screen Digest.
See note to Table 9.12.
                                                                                                                                                                                 20


                                                                                                                                                    Chapter 9: Exhibition – 75
                                                                                                                                                                                 21
The overall increase in the number of high-end digital screens in the Asia-Pacific region was lower than in Europe
between 2008 and 2009. The region’s total number of screens increased by 137% from 1,471 to 3,488. China more
than doubled its number of screens (to 1,788) and now has 51% of the region’s digital screens. Table 9.14 shows
that the top five countries had just under 92% of all digital screens in the region. In the Asia-Pacific region, Australia
had the largest percentage increase in the number of digital screens (588%, from 42 to 289 screens in 2009), and
Japan increased its number of digital screens from 123 to 440 (an increase of 258%).

Table 9.14 Countries in Asia-Pacific region with 100 or more high-end digital screens, 2008–2009
(ranked by number of screens in 2009)
                                                                                                                                                    % of
                                                                                                                                  Year              2009           % increase
                                                                                                                                              Asia-Pacific              from
Country                                                                                                        2008              2009               total               2008

China                                                                                                          861           1,788                51.3               107.7
South Korea                                                                                                    199             536                15.4               169.3
Japan                                                                                                          123             440                12.6               257.7
Australia                                                                                                       42             289                 8.3               588.1
India                                                                                                          112             146                 4.2                30.4
Rest of Asia-Pacific                                                                                           134             289                 8.3               115.7
Asia-Pacific total                                                                                           1,471           3,488               100.0               137.1
Source: Screen Digest.
Percentages may not add to 100 due to rounding.
See note to Table 9.12.


9.10.3 3D and alternative content programming
Of the 642 high-end digital screens in the UK in 2009, 449 (70%) of them were 3D-capable digital screens.
This represents a greater than three-fold increase in the proportion of 3D digital screens over 2008. Some of the
popular 3D screenings in the UK in 2009 included Avatar (Avatar’s 3D box office takings alone were higher than
any other film has taken at the UK box office), Ice Age III and Up.
Table 9.15 shows the increasing number and proportion of 3D digital screens in the UK. The growth in 3D digital
screens coincided with an increase in the availability of 3D content internationally. Fourteen digital 3D features (films
produced in stereoscopic 3D format) were released in 2009, and there is a strong line-up, especially animations, of
3D releases for 2010, including Alice in Wonderland, Clash of the Titans 3D, Harry Potter and the Deathly Hallows:
Part 1, Shrek Forever After and Toy Story 3 3D.

Table 9.15 3D digital screens in the UK, 2006–2009
                                                        Number of
                                                         3D digital       Total digital       3D % of all
Year                                                       screens            screens      digital screens       Top performing digital 3D title in the UK/Republic of Ireland

2006                                                           5                148                 3.4         Tim Burton’s Nightmare Before Christmas
2007                                                          47                296                15.9                                         Beowulf
2008                                                          69                310                22.3                             Fly Me to the Moon
2009                                                         449                642                69.9                                          Avatar
Source: Screen Digest, Rentrak EDI, RSU analysis.
Note: 3D digital screens are capable of screening content made in stereoscopic 3D format. Top performing digital 3D titles in the UK and Republic of Ireland are based on
takings from 3D and IMAX screenings.


76 – UK Film Council Statistical Yearbook 2010
1


                                                                                                                                                                                   2


Alternative content (AC) or non-feature film programming is becoming a regular feature in some UK cinemas                                                                          3
equipped with digital screens. The UK is the most advanced territory in Europe for alternative content programming,
not least because it also has the highest number of digital sites and, until recently, the highest number of digital
screens (now surpassed by France). The availability of a digital screen base has allowed a wider range of content
                                                                                                                                                                                   4
on the big screen, allowed interactivity between the screen and the audience and potentially improved the use
of auditorium capacity during typically quiet periods, for example, special screenings of children’s television
programmes for parents with babies in the morning. Also, since alternative content events usually have only
                                                                                                                                                                                   5
one or two screenings they tend to generate higher occupancy rates than feature films.
There were 58 alternative content events screened in UK cinemas in 2009, according to Screen Digest (Figure 9.4).
In 2008, such events ranged from live or recorded operas and pop music concerts to film screenings with a live                                                                     6
’question and answer’ session or a live ‘virtual’ premiere. New types of events shown in 2009 included ballet,
a live poetry reading and a live Digital Cinema Workshop.
                                                                                                                                                                                   7
Figure 9.4 Alternative content events screened in UK cinemas by type of event, 2007–2009
Number of events
40
                                                                                                                                                                                   8


30                                                                                                                                                                                 9


20                                                                                                                                                                                 10


10                                                                                                                                                                                 11


 0                 Opera                                        Sport        Theatre        Kids (sub     Comedy           Ballet      Classical        Poetry        Education    12
                             Popular music        Film
                               concerts                                                 division of film)                            music concerts

     2007             8            11              7              4              0              0              1              0             0              0              0
     2008           39               9             4              6              6              2              1              0             0              0              0        13

     2009           34               2            11              1              2              0              1              3             2              1              1

Source: Screen Digest.
Note: Figures include live and recorded events. ‘Film’ includes film screenings followed by a live ‘question and answer’ session. ‘Kids’ includes cartoons or short                14
features that would normally be released on television or DVD.


Although there were fewer alternative content events in 2009 than in 2008, revenues from these events continued
                                                                                                                                                                                   15
to rise, as Figure 9.5 shows. This may be due to events being shown more widely as more digital screens become
available. Notable alternative content events screened in 2009 included a 3D showing of Olympic gold medallist
Usain Bolt’s 150 metres sprint in Manchester in May. This event was screened in Odeon cinemas before the showing
                                                                                                                                                                                   16
of Ice Age III. The National Theatre broadcast its production of Racine’s Phèdre starring Helen Mirren to 273 venues
around the world, enabling 30,000 viewers to see the play, rather than just those able to attend the live theatre.
Events in 2010 include Kenny Chesney: Summer in 3D, a 3D concert film of the singer’s 2008 summer tour across
the USA, released in cinemas in April.                                                                                                                                             17


                                                                                                                                                                                   18


                                                                                                                                                                                   19


                                                                                                                                                                                   20


                                                                                                                                                      Chapter 9: Exhibition – 77
                                                                                                                                                                                   21
Figure 9.5 Revenues from alternative content events            While many film societies and community cinemas
screened in UK cinemas, 2006–2009                              have been in existence over a long period, new ones
£ million                                                      are established all the time. Over half (56%) of the
5                                                              responding organisations were established in 2000 or
                                                               later, while 17% were established in the 1960s or earlier
4
                                                               (down from 24% in 2007/08).
3                                                              Nearly all of the film societies that responded (87%)
                                                               operated a membership system in 2008/09 and the
2                                                              average membership size was 138. The membership
                                                               of responding societies stood at 11,614. The BFFS
1                                                              estimates a total membership of over 38,000 across
                                                               all film societies known to them.
0                        2006            2007    2008   2009
                                                               The average full annual membership fee was £26.30
    Alternative           0.2              0.8    3.1    4.9   (down from £26.94 in 2007/08). Less than one-third of
    content revenues
                                                               societies that operated a membership system charged
Source: Screen Digest.                                         an additional admission fee (28%). The average
                                                               admission fee charged by these societies was £3.96.

9.11 Community cinema in the UK                                The responding organisations programmed a total of
                                                               682 different titles, in 1,581 screenings, during the
The screening of feature films in the UK is not limited to     2008/09 season (more than the 503 films released
cinemas belonging to the major cinema operators. There         theatrically in the UK in 2009). British films were
is a thriving sector of non-commercial providers bringing      screened 388 times (25% of all screenings, up from
a wide variety of programming, often specialised in            23% in 2007/08), and 49% of screenings were foreign
nature, to local communities which would otherwise be          language films (up from 39% in 2007/08). In total,
under-served by the commercial operators. This sector          70% of titles were screened by only one film society
is often referred to as community cinema. Members              (up from 65% in 2007/08), indicating the diversity
of local communities are often more involved in the            of programming choices made by individual societies.
programming of such cinemas than their commercial              However, some titles proved popular choices across
counterparts. Screenings of films in this sector are           many film societies, and 30 films were programmed
in venues such as village halls, mixed arts venues,            by 10 or more societies.
independent cinemas and the like.
                                                               Seven of these films programmed by 10 or more
There was a knowledge gap in the contribution of               respondents in 2008/09 were British, and 15 were in
community cinema until recently. In the Yearbook               a foreign language. The three most programmed films
2006/07 we presented the findings of a 2006 survey,            were Happy-Go-Lucky, The Kite Runner and Persepolis.
Cinema for All, commissioned by the British Federation         Just over half (51%, the same as in 2007/08) of all
of Film Societies (BFFS). This survey looked at the size,      responding organisations held special events in addition
composition and geographical distribution of the               to screenings in 2008/09.
community cinema sector in the UK. The survey has
since been repeated annually, and here we present a
summary of the key findings from the 2008/09 survey.


78 – UK Film Council Statistical Yearbook 2010
1


                                                                                                                                     2


The average audience size in 2008/09 was 76.                   Film societies and community cinemas enhance film                     3
The smallest audience recorded was just one admission          provision in thematic or geographical areas otherwise
and the largest stood at 347. The sum total of all             under-served by commercial cinemas. On average, film
admissions from responding organisations was 104,097.          societies and community cinemas were located around
                                                                                                                                     4
If this is extrapolated to all societies, the BFFS estimates   nine miles from the nearest commercial cinema.
that the total number of admissions in 2008/09 would           Moreover, 44% operated in rural areas (with 19% in
have been around 347,000.                                      remote rural areas more than 10 miles from the nearest
                                                                                                                                     5
                                                               settlement) compared with 3% of commercial screens
The most commonly used format for screenings
                                                               (Table 9.8). The South West was the region with the
was DVD (used ‘usually’ or ‘sometimes’ by 91% of
                                                               highest number of admissions, accounting for 23%
responding organisations). Only 16% of responding
                                                               of all admissions to film society screenings. In contrast,            6
societies still used VHS, and none of the societies
                                                               the number of admissions to commercial cinemas in
reported it as their usual projection format. One quarter
                                                               the South West ISBA region represented 2.5% of all
of the responding societies used 35mm as their usual
                                                               admissions to commercial cinemas (Table 9.4).                         7
projection format.
The vast majority of film societies used only one
venue for screenings (90%), and public buildings                                                                                     8
(for example, civic centres, village or town halls) were
the most common type (used by 38% of respondents).
Other types of venue included theatres (used by 15%                                                                                  9
of respondents), cinemas (14%), school halls or college/
university lecture theatres (11%) and mixed arts
centres (8%).
                                                                                                                                     10


                                                                                                                                     11


                                                                                                                                     12


                                                                                                                                     13


                                                                                                                                     14


                                                                                                                                     15


                                                                                                                                     16


„                                                                                                                                    17

 3F
   or cinema admissions and box office see Chapter 1 (page 8)
 3F
   or a look at cinema audiences see Chapter 14 (page 110)
                                                                                                                                     18
 3F
   or employment in the exhibition sector see Chapter 21 (page 182)
 3S
   ee www.ukfilmcouncil.org.uk/dsn for more about the UK Film Council’s Digital Screen Network, including
   a list of such screens by region
 3F
   or maps showing distances from households to closest commercial and independent cinemas in the UK,                              19

   see www.ukfilmcouncil.org.uk/exhibition
 3W
   ebsite for British Federation of Film Societies (BFFS): www.bffs.org.uk
                                                                                                                                     20


                                                                                                        Chapter 9: Exhibition – 79
                                                                                                                                     21
Chapter 10:
Film on video


Video offers audiences the        Facts in focus

opportunity to see films within   •  he combined rental and sales market for video on
                                    T
                                    physical media in 2009 was £2.39 billion, and feature
months of their cinema release      film on video accounted for £1.51 billion.
– and of course some films are    •  1 million films were rented on video in 2009 (72 million
                                    7
                                    in 2008) and 180 million films on video were sold
released on DVD only. In 2009,      (196 million in 2008).
people living in the UK bought    •  ilm accounted for 74% of the volume of the video sales
                                    F
an average of four physical         market and 61% of the value. UK film had a 20% share.

videos each, three of which       •  he most popular purchase on DVD was Harry Potter
                                    T
                                    and the Half-Blood Prince.
were feature films.               •  nline video rental of feature films accounted for 49%
                                    O
                                    of all rental transactions of feature films in 2009.
1


                                                                                                                                                              2


10.1 Film in the retail video market                                                                                                                          3

‘Video’ is used in this chapter as the generic description of all physical video formats, including DVD, UMD
(Universal Media Disc), high-definition DVD (HD-DVD) and Blu-ray, in line with the British Video Association’s
(BVA) definition, and does not include downloads. (For information on films rented or purchased by download,                                                  4
see Chapters 12 and 13.)
In 2009, 243 million videos were sold, down 5.4% on 2008. The total market value was £2,164 million (Figure 10.1),
                                                                                                                                                              5
down 10.1% on 2008. DVDs accounted for the vast bulk of video sales value (92%), while Blu-ray sales accounted
for 6.4% of total sales value in 2009, compared with 2.9% in 2008. Feature film represented approximately 61%
of the retail video market by value (£1,311 million) and 74% by volume. UK films accounted for around 20% of
                                                                                                                                                              6
sales of film on video.

Figure 10.1 Retail video sales (all categories), 1999–2009                                                                                                    7
Million
3,000

                                                                                                                                                              8
2,500


2,000
                                                                                                                                                              9

1,500

                                                                                                                                                              10
1,000


  500
                                                                                                                                                              11


     0                       1999           2000           2001           2002           2003    2004    2005    2006    2007       2008         2009
                                                                                                                                                              12
    Volume (million)            96            114            135            169            208    234     222     228     249         257          243
    Value (£ million)          878          1,101          1,417         1,896          2,245    2,478   2,309   2,219   2,349      2,408        2,164

Source: Screen Digest.                                                                                                                                        13
Note: Data in this table include all categories of retail video: film, TV, sport, fitness etc.


The number of films sold on video more than trebled between 1999 and 2008, from 61 million units to 196 million,
                                                                                                                                                              14
before falling in 2009 to 180 million units (Figure 10.2). The loss of some 900 Woolworth and Zavvi stores in 2009
is likely to have had an effect on DVD film sales. As Figure 10.3 shows, the average unit price increased with the
introduction of DVD in the late 1990s to reach a peak in 2002, but has since fallen back to the level of the late
                                                                                                                                                              15
1990s (£7.29).


                                                                                                                                                              16


                                                                                                                                                              17


                                                                                                                                                              18


                                                                                                                                                              19


                                                                                                                                                              20


Image: Ice Age III © 2009, Twentieth Century Fox. All rights reserved                                                        Chapter 10: Film on video – 81
                                                                                                                                                              21
Figure 10.2 Film on video retail sales, 1999–2009
Million
1,800

1,600

1,400

1,200

1,000

  800

  600

  400

  200

     0                          1999      2000         2001        2002        2003      2004    2005    2006    2007     2008      2009


     Volume (million)             61           76           96      128            158    180     164     165     188      196       180
     Value (£ million)           451          601          821    1,175       1,392      1,557   1,399   1,302   1,440    1,454     1,311

Source: UK Film Council RSU analysis of Official UK Charts Company and BVA data.


Figure 10.3 Retail price of film per unit, 1999–2000
Price (£)
10
 9
 8
 7
 6
 5
 4
 3
 2
 1
 0                   1999              2000         2001         2002        2003        2004    2005     2006     2007      2008      2009
       Price             7.46          7.87         8.56         9.15        8.80        8.64    8.52     7.89     7.68      7.42       7.29

Source: UK Film Council RSU.


Table 10.1 shows the top selling films on video in 2009. Harry Potter and the Half-Blood Prince topped the chart with
more than two million copies sold. The Dark Knight appears in 2009’s top 10 as well as being the second highest
selling video of 2008. Just outside this list (at number 11) is Star Trek, which was the highest selling Blu-ray disc
of 2009. Sales of Blu-ray discs accounted for 3.3% of all video sales by volume in 2009, up from 1.4% in 2008.


82 – UK Film Council Statistical Yearbook 2010
1


                                                                                                                                      2


Table 10.1 Top 10 films on video retail, 2009                                                                                         3
         Title                                                                         Country of origin                Distributor

 1       Harry Potter and the Half-Blood Prince                                             UK/USA           Warner
                                                                                                                                      4
 2       Quantum of Solace                                                                  UK/USA 20th Century Fox
 3       Twilight                                                                              USA E1 Entertainment
 4       Transformers: Revenge of the Fallen                                                   USA       Paramount                    5
 5       Slumdog Millionaire                                                                    UK 20th Century Fox
 6       Madagascar: Escape 2 Africa                                                           USA       Paramount
 7       Angels and Demons                                                                     USA     Sony Pictures                  6

 8       High School Musical 3: Senior Year                                                    USA      Walt Disney
 9       Ice Age III                                                                           USA 20th Century Fox
                                                                                                                                      7
10       The Dark Knight                                                                    UK/USA           Warner
Source: Official UK Charts Company, BVA.
                                                                                                                                      8
Once again, comedy was the dominant genre of films sold on video in 2009, accounting for over 23% of the market
as Figure 10.4 shows. Drama was the next most popular with 19% of all sales, followed by action/adventure with 15%.
                                                                                                                                      9
Figure 10.4 Sales breakdown by film genre, 2009
                                                        %
   Comedy                                            23.3                                                                             10
   Thriller                                           8.9
   Family                                            11.8
                                                                                                                                      11
   Horror                                             5.6
   Sci-fi                                             8.2
   Adult                                              0.1
                                                                                                                                      12
   War                                                2.4
   Musical                                            3.3
   Drama                                             19.4                                                                             13
   Western                                            1.1
   Action/adventure                                  15.3
   Anime                                              0.3                                                                             14

   Documentary                                        0.3
   Bollywood                                          0.0
                                                                                                                                      15
Source: Official UK Charts Company, BVA.


The top 10 UK performers on sell-through video in 2009 (Table 10.2) include four UK-qualifying titles which are also
                                                                                                                                      16
in the overall top 10 of the year. In addition, Mamma Mia! continued to sell well in 2009 after being the top selling
video of 2008 when it sold more than 5 million copies to become the highest selling DVD of all time in the UK.
By the end of 2009, it had sold almost 6 million copies. In second place in the list is Quantum of Solace, which
                                                                                                                                      17
was also the second highest selling Blu-ray disc of 2009.


                                                                                                                                      18


                                                                                                                                      19


                                                                                                                                      20


                                                                                                     Chapter 10: Film on video – 83
                                                                                                                                      21
Table 10.2 Top 10 UK-qualifying video film retail titles, 2009
         Title                                                                                                Country of origin     Distributor

 1       Harry Potter and the Half-Blood Prince                                                                  UK/USA            Warner
 2       Quantum of Solace                                                                                       UK/USA 20th Century Fox
 3       Slumdog Millionaire                                                                                         UK 20th Century Fox
 4       The Dark Knight                                                                                         UK/USA            Warner
 5       Mamma Mia!                                                                                              UK/USA Universal Pictures
 6       The Duchess                                                                                           UK/Fra/Ita 20th Century Fox
 7       The Boy in the Striped Pyjamas                                                                          UK/USA        Walt Disney
 8       Casino Royale                                                                                        UK/USA/Cze     Sony Pictures
 9       Rocknrolla                                                                                              UK/USA            Warner
10       Wild Child                                                                                              UK/USA Universal Pictures
Source: RSU analysis of Official UK Charts Company data.

The list of top 10 UK independent films sold on video in 2009 is topped by Slumdog Millionaire, which was also the
top grossing UK independent film at the UK box office in 2009 (Table 10.3). Biopics were also popular in 2009, with
The Duchess and The Young Victoria in second and third places in the list.

Table 10.3 Top 10 UK independent video film retail titles, 2009
         Title                                                                                                Country of origin     Distributor

 1       Slumdog Millionaire                                                                                          UK 20th Century Fox
 2       The Duchess                                                                                            UK/Fra/Ita 20th Century Fox
 3       The Young Victoria                                                                                     UK/USA#         Momentum
 4       City Rats                                                                                                    UK           Revolver
 5       Bronson                                                                                                      UK E1 Entertainment
 6       Adulthood                                                                                                    UK 20th Century Fox
 7       Kidulthood                                                                                                   UK           Revolver
 8       Run, Fat Boy, Run                                                                                      UK/USA#                 EIV
 9       The Bank Job                                                                                           UK/USA#          Lions Gate
10       Cass                                                                                                         UK          Optimum
Source: RSU analysis of Official UK Charts Company data.
#The Young Victoria, Run, Fat Boy, Run and The Bank Job were made with independent (non-studio) US support.


84 – UK Film Council Statistical Yearbook 2010
1


                                                                                                                                                2


10.2 The relationship between film on video sales and theatrical box office takings                                                             3

As can be seen from Table 10.1, the top selling titles on video tend to be the same as those which performed
well theatrically. Looking more closely at this relationship (Figures 10.5 and 10.6) we see a positive and statistically
significant association between box office and video sales. That is, the greater the gross box office for a film, the                           4
more videos it is likely to sell. Table 10.4 shows the number of videos a film is likely to sell at various box office levels.
For example, a film taking £5 million could be expected to sell 598,000 videos in the UK. There is considerable
variation around this result. On the data studied, 80% of films taking £5 million at the UK box office would sell                               5
between 199,000 and 998,000 videos. As the box office increases, the variation relative to the average gets smaller.
So a film taking £50 million at the box office could be expected to sell 3.4 million videos, with a variation (for 80%
of the titles) between 3.0 million and 3.8 million. The data also suggest that low to medium box office films receive                           6
a greater proportion of their total revenues from video sales than do high box office ‘blockbuster’ films (see box
for explanation).
                                                                                                                                                7

Figure 10.5 Scatter plot and fitted lines of video sales against gross box office for all films
Video sales (million)
4                                                                                                                                               8


3
                                                                                                                                                9


2
                                                                                                                                                10

1

                                                                                                                                                11
0                       0                         10                        20                            30   40                         50

      All films              All films, box office £1 million             All films, box office £1 million
                                                                                                                                                12
Source: RSU analysis of Rentrak EDI and Official UK Charts Company data.


                                                                                                                                                13


                                                                                                                                                14


                                                                                                                                                15


                                                                                                                                                16


                                                                                                                                                17


                                                                                                                                                18


                                                                                                                                                19


                                                                                                                                                20


                                                                                                               Chapter 10: Film on video – 85
                                                                                                                                                21
Figure 10.6 Scatter plot and fitted lines of video sales against gross box office for UK films
Video sales (million)
4


3


2


1


0                       0                            10                            20                             30                  40                             50

      UK films                 UK films, box office £1 million                  UKfilms, box office £1 million

Source: RSU analysis of Rentrak EDI and Official UK Charts Company data.
Note: the scatter plot shows all the points included in Figure 10.5 but the lines were fitted using data for UK films only.


Table 10.4 Average numbers of video sales for levels of gross box office
                                                                                      UK              Average number               Range containing the video sales of
                                                                               box office             of UK video sales          80% of films for the level of box office

                                                                                                                                     From                             To

Low box office gross films                                                £50,000                          13,000                     0                     60,000
                                                                         £100,000                          20,000                     0                     67,000
                                                                         £200,000                          34,000                     0                     81,000
                                                                         £500,000                          75,000                27,000                    122,000
                                                                         £750,000                         109,000                62,000                    156,000
                                                                         £1 million                       143,000                96,000                    190,000
High box office gross films                                              £5 million                       598,000               199,000                    998,000
                                                                        £10 million                       910,000               510,000                  1,310,000
                                                                        £20 million                     1,533,000             1,134,000                  1,933,000
                                                                        £50 million                     3,404,000             3,004,000                  3,803,000
Source: RSU analysis of Rentrak EDI and Official UK Charts Company data.


86 – UK Film Council Statistical Yearbook 2010
1


                                                                                                                                                    2


The relationship between UK box office                        Figures 10.5 and 10.6 show that while there is a                                      3
and UK video sales                                            positive relationship between box office and video
                                                              sales there is considerable variation for individual titles.
To test the relationship between the UK box office and        The relationship is weakest (most variation around the
UK video sales a sample of films that were released in        fitted line) for low grossing films (box office gross less
                                                                                                                                                    4
a particular year1 around the middle of the decade was        than £1 million), but even for these films the relationship
taken and their gross box office takings were compared        between the two variables is statistically significant.
with the number of video sales achieved after five years.     Further, the estimated impact of an increase in box                                   5
All films from the release year for which data on video       office on video sales for low grossing films is greater
sales were available were included in the sample.             than for higher grossing films.
The total number of films included was 356, and                                                                                                     6
78 of these were UK films. The gross box office for           From the regression analyses we can estimate the
the majority of the films in the sample was less than         average number of video sales for a given level of box
£1 million (238 of all films and 43 of the UK films).         office takings but, as can be seen from Figures 10.5
                                                                                                                                                    7
                                                              and 10.6, there is much variation around these averages.
Only films that were released theatrically are included in    Table 10.4 shows the average number of video sales for
this comparison (that is, no ‘straight to video’ films are    different levels of box office takings, for high grossing
included). Also, only sales of physical discs are included    films and for low grossing films separately. Also shown                               8
in the present comparison. It would be better to include      is a range of video sales for each level of box office
all films purchased, ie films on physical discs and films     takings. These ranges have been estimated so that the
purchased as downloads. However, while we have some           video sales of about 80% of films with the particular                                 9
information on the total number of films downloaded           level of box office takings lie within the range.
to own, we do not have information on numbers of
downloads by title for films purchased in this way            There were no differences between UK films and all
                                                                                                                                                    10
(see Chapter 12). Also, the films included in the             films in the relationship between box office takings
present analysis were released some time ago, so it           and video sales, and the expected increases in video
is likely that only a very small percentage of the total      sales for a given increase in box office are the same,
                                                                                                                                                    11
sales of these films would have been downloaded.              except that the samples were smaller, so the ranges
                                                              around the estimates are slightly wider.
Analyses of the data show statistically significant
positive linear relationships between gross box office        Figure 10.5 also shows that many more films in the                                    12
and video sales (after five years). That is, the greater      £5 million to £20 million box office range had video
the gross box office for a film, the more videos it would     sales above the fitted lines (fitted to all films’ and
expect to sell. As most of the films in the sample are        to high grossing films’ data) than below the lines.
                                                                                                                                                    13
clustered at the lower end of the box office and video        This suggests that the relationship between box office
sales scales, three separate lines were fitted to the data,   and video sales for the ‘blockbusters’ (box office around
using linear regression analysis. The first line represents   £30 million or greater) is different from that of other
                                                                                                                                                    14
the relationship between box office and video sales for       films, and that even films grossing in the £5 million to
all films, the second for films which took more than          £20 million range will obtain a greater proportion of
£1 million at the box office and the third for films which    total revenues from video sales than the blockbusters.
                                                              As more of the top films are now being released in 3D                                 15
took less than £1 million at the box office (Figure 10.5).
                                                              it is likely that in future a smaller percentage of their
Similar analyses were carried out for UK films only           total revenues will come from video sales (at least until
(Figure 10.6) and also showed a statistically significant     3D Blu-ray discs or downloads become widely available                                 16
positive linear relationship. The UK films contained in       and households become equipped with 3D home
the sample described above were included in these             viewing equipment).
analyses, rather than taking a different sample of UK                                                                                               17
films. The scatter plot shown in Figure 10.6 includes         1.	 particular year is not disclosed so as not to reveal the video sales
                                                                 The
                                                                 of individual titles, which under current arrangements are confidential
the data points for all films so as not to reveal the
                                                                 to the companies concerned.
identity of individual titles, but the lines are fitted
                                                                                                                                                    18
using the data for UK films only.


                                                                                                                                                    19


                                                                                                                                                    20


                                                                                                                   Chapter 10: Film on video – 87
                                                                                                                                                    21
10.3 Film in the video rental market
Total physical video rentals totalled 79 million in 2009 (including over-the-counter and online rentals). Film on video
rentals totalled 71 million, with an average value of £2.82. Online video renting (with postal delivery) now accounts
for 54% of all rental transactions and 49% of film on video rental transactions in the UK.
The number of feature film rental transactions in 2009 was down by 1.5 million from 2008, and the value of the
physical rental market fell to £199 million from a peak of £494 million in 2001 (Figure 10.7). This is due mainly to the
rapid decline of the over-the-counter rental market in the wake of competition from multi-channel television, film
theft and, in particular, the availability and lower cost of retail DVDs.


Figure 10.7 Film on video rental market, 2001–2009
Million
600


500


400


300


200


100


  0                                2001          2002   2003      2004      2005   2006        2007       2008           2009


   Transactions (million)           198          182    160           158   133     110          92         72             71
   Value (£ million)                494          492    457           458   390     327         280        202            199

Source: Screen Digest.


The most popular genre was comedy which accounted for 27% of rentals, followed by drama and action/adventure
titles (Figure 10.8). (It should be noted that these categories, as defined by Kantar Worldpanel, may differ from the
genre categories assigned to the theatrical market by the RSU in Chapter 4.)


Figure 10.8 Video rental share by genre, 2009
                                                                 %
   Comedy                                                      26.5
   Drama                                                       21.5
   Thriller                                                     7.9
   Action                                                      20.2
   Horror                                                       6.3
   Sci-fi                                                       4.2
   Children’s/family                                            8.7
   Others                                                       4.8
Source: Kantar Worldpanel, BVA.


The list of top 10 online rentals in 2009 is topped by Slumdog Millionaire, which was also one of the highest
selling videos of 2009 (Table 10.5). The Dark Knight is the only other film in this list which was also in the list of
top selling titles.


88 – UK Film Council Statistical Yearbook 2010
1


                                                                                                                                            2


Table 10.5 Top 10 online video rentals, 2009                                                                                                3
          Title                                                                             Country of origin                 Distributor

 1        Slumdog Millionaire                                                                         UK 20th Century Fox
                                                                                                                                            4
 2        The Curious Case of Benjamin Button                                                        USA           Warner
 3        Taken                                                                                  Fra/USA 20th Century Fox
 4        Changeling                                                                                 USA Universal Pictures                 5
 5        Burn After Reading                                                                         USA Universal Pictures
 6        The Reader                                                                             USA/Ger                EV
 7        Gran Torino                                                                            USA/Aus           Warner                   6

 8        The Dark Knight                                                                         UK/USA           Warner
 9        Seven Pounds                                                                               USA     Sony Pictures
                                                                                                                                            7
10        Australia                                                                              Aus/USA 20th Century Fox
Source: BVA.
Note: ‘Online rental’ refers to online ordering with postal delivery. See Glossary.                                                         8

The list of top 10 over-the-counter rentals in 2009 shows a different pattern from the online rentals, with only three
titles appearing in both lists (Table 10.6). None of the titles in the top over-the-counter rentals appears in the list of
best selling videos of 2009.                                                                                                                9


Table 10.6 Top 10 over-the-counter video rentals, 2009                                                                                      10
          Title                                                                        Country of origin                      Distributor

 1        Taken                                                                            Fra/USA            20th Century Fox
                                                                                                                                            11
 2        Knowing                                                                           USA/UK            E1 Entertainment
 3        Gran Torino                                                                      USA/Aus                      Warner
 4        Yes Man                                                                              USA                      Warner              12
 5        Role Models                                                                      USA/Ger            Universal Pictures
 6        He’s Just Not That Into You                                                      USA/Ger                           EV
                                                                                                                                            13
 7        The Curious Case of Benjamin Button                                                  USA                      Warner
 8        Tropic Thunder                                                                       USA                  Paramount
 9        Defiance                                                                             USA          Momentum Pictures               14
10        Body of Lies                                                                         USA                      Warner
Source: BVA.
                                                                                                                                            15


10.4 Hardware
According to the BVA, 5.5 million DVD players were sold in 2009, taking cumulative DVD hardware sales since launch                          16

to 60 million, almost one DVD player for every person in the UK. In addition, consumers increasingly have access to
high-definition DVD technology through dedicated players and games consoles in particular. The BVA reports that
200,000 Blu-ray stand-alone players were sold in 2009 and Screen Digest estimates that there are more than three                            17
million households in the UK with games consoles with Blu-ray capability.

                                                                                                                                            18


„                                                                                                                                           19

  3F
    or more information about top films at the UK box office see Chapter 2 (page 15)
  3F
    or more information about the UK film market as a whole see Chapter 13 (page 104)
                                                                                                                                            20


                                                                                                           Chapter 10: Film on video – 89
                                                                                                                                            21
Chapter 11:
Film on UK television


The number and variety of         Facts in focus

films broadcast on television     •  here were 5,973 unique film titles on television in 2009,
                                    T
                                    including 2,070 on terrestrial, 1,606 on subscription film
has soared since 2000.              channels and 3,283 on free-to-air film channels.
Viewers had a choice of           •  here were 2,218 film transmissions (2,070 unique titles)
                                    T
                                    on terrestrial channels, virtually unchanged from 2008,
nearly 6,000 film titles across     and an average of six films per day. Of these, 487 (22%)
all channels in 2009, worth         were UK films, and 76 (3%) were foreign language films.

approximately £1.1 billion to     •  n average of 1 million people watched each film on
                                    A
                                    peak-time network television (down from 1.3 million in
the broadcasters.                   2008), compared to median cinema audiences for the
                                    top 50 films of 2 million.
                                  •  he top film on terrestrial television was Pirates of
                                    T
                                    the Caribbean: At World’s End on BBC One, with
                                    6.4 million viewers.
                                  •  here were 3.4 billion viewings of feature film across
                                    T
                                    all television formats (except pay-per-view) in 2009 –
                                    the same level as 2008 and over almost 20 times the
                                    number of cinema admissions.
1


                                                                                                                                                              2


11.1 Programming on network channels                                                                                                                          3

Table 11.1 shows the number of feature films broadcast on the five terrestrial network channels in 2009 and the
total number of UK titles broadcast in that time. These are broken down into older titles (more than eight years old)
and recent theatrical releases (released in the last eight years). Here, UK film includes all titles listed as UK-originated                                  4
by the Broadcasters’ Audience Research Board (BARB), plus UK co-productions given other nationalities (mostly USA)
in the BARB data.
                                                                                                                                                              5
There were 2,218 films on terrestrial television in 2009, virtually unchanged from 2008, which represented an
average of six films a day. The proportion of recent UK films remained the same at 7%.

                                                                                                                                                              6
Table 11.1 Feature films broadcast on network television, 2009
                                                                                                                      Recent UK
                                                Number                   Number                  UK films           (ie released                Recent UK
                                                 of films             of UK films                    as %            theatrically             as % of total   7
Channel                                        broadcast               broadcast                  of total          since 2001)                  broadcast

BBC One                                            338                      63                       19                    43                       12.7
                                                                                                                                                              8
BBC Two                                            369                     119                       32                    35                        9.5
ITV1                                               446                     117                       26                    36                        8.1
Channel 4                                          561                     129                       23                    33                        5.9      9
Five                                               504                      59                       12                     7                        1.4
Total                                            2,218                     487                       22                   154                        6.9
                                                                                                                                                              10
Source: Attentional, UK Film Council RSU analysis.

Network television screened 76 foreign language films in 2009, 3% of the total, up from 73 in 2008 (3% of the
total), as Table 11.2 shows. The top foreign language film was the Jackie Chan martial arts comedy Rumble in the                                              11
Bronx, with an audience of 1.2 million on BBC One.

Table 11.2 Foreign language films broadcast on network television, 2009                                                                                       12

                                             Number
                                           of foreign                 %              Average
                                           language         of channel’s            audience                       Top rated foreign             Audience
                                                                                                                                                              13
Channel                              films broadcast         film output             (million)                        language film               (million)

BBC One                                           1                0.3                  1.2               Rumble in the Bronx                         1.2
BBC Two                                          25                6.8                  0.1                          Pinocchio                        0.5     14
ITV1                                              3                0.7                  0.1             The Children of Heaven                        0.1
Channel 4                                        42                7.5                  0.1            House of Flying Daggers                        0.6
                                                                                                                                                              15
Five                                              5                1.0                  0.3                         Fist of Fury                      0.6
Total                                            76                3.4                  0.1
Source: UK Film Council RSU.                                                                                                                                  16


                                                                                                                                                              17


                                                                                                                                                              18


                                                                                                                                                              19


                                                                                                                                                              20


Image: Wallace  Gromit: The Curse of the Were-Rabbit © Aardman Animations 2005                                      Chapter 11: Film on UK television – 91
                                                                                                                                                              21
The number of slots for feature film on network television has fluctuated since 2000, as Figure 11.1 shows with
Channel 4 and Five broadcasting the most films over the last decade.


Figure 11.1 Number of feature films on network television, 2000–2009

700

600

500

400

300

200

100

  0                    2000          2001        2002          2003           2004    2005           2006      2007   2008            2009
      BBC One           320              341      351           435            434     354            369       384    381             338
      BBC Two           509              514      433           451            499     426            397       447    395             369
      ITV1              287              285      269           312            268     373            184       243    367             446
      Channel 4         557              617      574           584            503     562            581       595    606             561
      Five              619              637      641           565            527     605            496       513    472             504
      Total            2,292        2,394        2,268         2,347          2,231   2,320          2,027    2,182   2,221           2,218

Source: Attentional, UK Film Council RSU.


11.2 Peak time on network television
In 2009, the proportion of peak-time hours (18:00 to 23:59 hours) dedicated to feature films varied widely across
the terrestrial channels. In terms of total hours, film represented 19% of programming on BBC One, 5% on BBC Two,
15% on Channel 4 and 21% on Five (Figure 11.2). ITV1’s film output more than doubled, from 9% in 2008 to
19% last year.

Figure 11.2 Composition of peak-time hours, 2009
Percentage
100
 90
 80
 70
 60
 50
 40
 30
 20
 10
  0                            BBC One           BBC Two               ITV1            Channel 4             Five             Total
   Factual                        14.0               47.3              14.9                   40.6           25.3             28.4
   Drama                          19.9                   6.0           31.0                   13.5           28.2             19.8
   Films: Cinema                  18.8                   4.6           19.1                   14.9           20.6             15.7
   News/current affairs           26.8               13.1              14.1                   13.7            7.7             15.0
   Entertainment                  13.8               15.7              14.1                   15.2           13.0             14.3
   Sport                           4.9                   8.6            6.4                    0.0            3.1              4.6
   Other                           1.2                   4.5            0.4                    1.7            0.1              1.5
   Films: made for TV              0.7                   0.1            0.0                    0.3            2.0              0.7

Source: Attentional.


92 – UK Film Council Statistical Yearbook 2010
1


                                                                                                                                      2


11.3 Audiences for film on network television                                                                                         3

The average audience for a film shown on peak-time network television was 1.1 million on BBC One, 800,000
on BBC Two, 1.2 million on ITV1 and 1 million on both Channel 4 and Five (Figure 11.3). Across all channels, the
average audience was 1 million, down from 1.3 million in 2008. This compares with median cinema admissions                            4
for the top 50 films of approximately 2 million.
Of the main programme categories, film accounts for the lowest average peak-time audience on ITV1 but performs
                                                                                                                                      5
relatively well on Five, as shown in Figure 11.3.


Figure 11.3 Average peak-time audience, 2009                                                                                          6
(000s)
7,000

6,000                                                                                                                                 7

5,000

4,000                                                                                                                                 8

3,000

2,000                                                                                                                                 9

1,000

    0                       BBC One           BBC Two               ITV1              Channel 4                    Five               10
   Drama                      6,141               971              6,191                 1,404                    1,391
   Entertainment              3,999              1,793             5,216                 1,324                      207
   Factual                    3,270              1,678             2,689                 1,543                      750
   Films: Cinema              1,088               830              1,161                 1,001                    1,009               11

   Films: made for TV           588              1,318                 –                 1,156                    1,072
   News/current affairs       4,182               770              2,581                   797                      797
   Other                      2,432               829              2,090                   570                      270               12
   Sport                      2,494              1,268             2,255                   303                      842
   All genres                 4,057              1,418             3,718                 1,308                      946

Source: BARB/Attentional.                                                                                                             13


11.4 Top films on network television                                                                                                  14

The most popular film on terrestrial television in 2009 was Pirates of the Caribbean: At World’s End, with 6.4 million
viewers tuning in to its premiere on BBC One (Table 11.3). In theatrical audience terms, this is equivalent to a box
office gross of £35 million (its actual gross was £41 million). The top 20 is dominated by recent animated family                     15
films such as Shrek 2, Ice Age 2: The Meltdown and The Incredibles.

                                                                                                                                      16


                                                                                                                                      17


                                                                                                                                      18


                                                                                                                                      19


                                                                                                                                      20


                                                                                             Chapter 11: Film on UK television – 93
                                                                                                                                      21
Table 11.3 Top 10 films on network television, 2009
                                                                                                Country of              Year of   TV audience
         Title                                                                     Channel          origin   theatrical release       (million)

 1       Pirates of the Caribbean: At World’s End                               BBC One           USA                 2007                6.4
 2       Shrek 2                                                                BBC One           USA                 2004                6.2
 3       Shrek 2                                                                BBC One           USA                 2004                6.0
 4       Ice Age 2: The Meltdown                                                    ITV1          USA                 2006                5.9
 5       The Incredibles                                                        BBC One           USA                 2004                5.6
 6       Harry Potter and the Goblet of Fire                                        ITV1       UK/USA                 2005                5.5
 7       Over the Hedge                                                         BBC One           USA                 2006                5.0
 8       Elf                                                                   Channel 4          USA                 2003                4.9
 9       Batman Begins                                                             ITV1        UK/USA                 2005                4.9
10       Pirates of the Caribbean: The Curse of the Black Pearl                 BBC One           USA                 2003                4.8
Source: Attentional, BARB.
Note: Shrek 2 was broadcast twice on BBC One – on 1 January and 24 December.

The top 10 UK films of 2009 (Table 11.4) included the premieres of Batman Begins, King Arthur, and The Da Vinci
Code. The highest ratings were recorded for the second broadcast of Harry Potter and the Goblet of Fire on ITV1.

Table 11.4 Top 10 UK-originated films on network television, 2009
                                                                                                Country of              Year of   TV audience
         Title                                                                    Channel           origin   theatrical release       (million)

 1       Harry Potter and the Goblet of Fire                                       ITV1        UK/USA                 2005               5.5
 2       Batman Begins                                                             ITV1        UK/USA                 2005               4.9
 3       Casino Royale                                                             ITV1        UK/USA                 2006               4.8
 4       King Arthur                                                           BBC One       UK/USA/Ire               2004               4.8
 5       Wallace  Gromit: The Curse of the Were-Rabbit                        BBC One         UK/USA                 2005               4.8
 6       Nanny McPhee                                                             ITV1         UK/USA                 2005               4.6
 7       Harry Potter and the Chamber of Secrets                                  ITV1         UK/USA                 2002               4.3
 8       The Da Vinci Code                                                          Five       UK/USA                 2006               4.1
 9       Love Actually                                                            ITV1         UK/USA                 2003               3.9
10       Harry Potter and the Prisoner of Azkaban                                 ITV1         UK/USA                 2004               3.9
Source: Attentional, BARB.


94 – UK Film Council Statistical Yearbook 2010
1


                                                                                                                                     2


11.5 Films on multi-channel television                                                                                               3

Table 11.5 shows the audience share for freeview/satellite/cable multi-channel television has continued to grow
in the last few years. Multi-channel television accounted for 41% of the UK television audience in 2009, up from
39% in 2008. The biggest loss over this period was experienced by ITV1, which saw its audience share drop from                       4
29% to 18%.

                                                                                                                                     5
Table 11.5 Television percentage audience shares, 2000–2009
Year                                      BBC One      BBC Two         ITV1     Channel 4            Five        Multi-channel TV

2000                                       27.2         10.8          29.3         10.5             5.7                    16.6      6
2001                                       26.9         11.1          26.7         10.0             5.8                    19.6
2002                                       26.2         11.4          24.1         10.0             6.3                    22.1
                                                                                                                                     7
2003                                       25.6         11.0          23.7          9.4             6.5                    23.6
2004                                       24.7         10.0          22.8          9.7             6.6                    26.2
2005                                       23.3          9.4          21.5          9.6             6.4                    29.8      8
2006                                       22.8          8.8          19.6          9.8             5.7                    33.3
2007                                       22.0          8.5          19.2          8.6             5.1                    36.5
                                                                                                                                     9
2008                                       21.8          7.8          18.4          8.2             5.0                    38.8
2009                                       20.9          7.5          17.8          7.5             4.9                    41.4
Source: BARB.                                                                                                                        10

Table 11.6 lists the number of films shown, average audience, the top film and audience for the top film, for a
selection of digital channels which broadcast feature films. The ITV digital channels screened over 1,300 films in
                                                                                                                                     11
2009, with an average audience of around 260,000 viewers. Charlie and the Chocolate Factory received the largest
audience for a single screening on multi-channel television, with almost two million viewers on ITV2. Film4 broadcast
over 2,600 films last year, averaging 133,000 viewers per film.
                                                                                                                                     12


                                                                                                                                     13


                                                                                                                                     14


                                                                                                                                     15


                                                                                                                                     16


                                                                                                                                     17


                                                                                                                                     18


                                                                                                                                     19


                                                                                                                                     20


                                                                                            Chapter 11: Film on UK television – 95
                                                                                                                                     21
Table 11.6 Feature film on selected digital channels, 2009
                                             Number of    Average film                                                               Audience for
Channel                              film transmissions      audience                                                    Top film        top film

BBC Three                                          117    508,634        Pirates of the Caribbean: The Curse of the Black Pearl     1,361,000
BBC Four                                            95    112,906                                                Calendar Girls       620,200
Bravo                                              261     46,361                                                   Apocalypto        213,600
E4                                                 184    261,986                                           Independence Day          789,400
Film 24                                            927      3,927                                        The Ultimate Weapon           75,400
Film4                                            2,649    133,404                                        Night at the Museum        1,008,500
Fiver                                              182    153,086                                            The Da Vinci Code        556,400
Five USA                                           308    146,365                                                    Swordfish        505,200
G.O.L.D.                                           157    139,643                                              Bruce Almighty         495,700
ITV2 – 4                                         1,359    260,094                            Charlie and the Chocolate Factory      1,986,900
More 4                                             393     86,128                                              Battle of Britain      437,100
More 24+                                           432     14,064                                              Prancer Returns        151,700
Movies 4 Men                                     5,533      5,359                              A.W.O.L. Absent Without Leave           98,900
Sci Fi                                             566     36,396                                Under Siege 2: Dark Territory        254,700
Sky 1 – 3                                          217    124,792                                                 I Am Legend         909,300
Sky Arts 1 – 2                                     150      1,497                                                   Last Mogul         11,300
Sunrise TV                                         390      4,565                                                     Maharaja         16,500
True Movies                                        360      6,989                                                  Santa Who?          54,100
Turner Classic Movies                            5,105      6,893                                                     Jack Frost      105,900
Watch                                              226    120,786                                                       Hellboy       393,400
Zone Horror/Zone Thriller                        1,830     10,480                                                    Ted Bundy         73,400
Source: Attentional, BARB.

The top film on free-to-air digital multi-channel (in terms of total audience across all transmissions) was Ice Age 2:
The Meltdown on ITV2 with a total audience of 5.8 million from five transmissions (Table 11.7).


96 – UK Film Council Statistical Yearbook 2010
1


                                                                                                                                               2


Table 11.7 Top 10 feature films on free-to-air digital multi-channel television, 2009                                                          3
                                                                               Number of    Country of              Year of          Total
          Title                                                   Channel   transmissions       origin   theatrical release       audience

 1        Ice Age 2: The Meltdown                                  ITV2               5        USA                2006        5,823,900        4
 2        The Mummy Returns                                   ITV2/Sci Fi            14     UK/USA                2001        4,515,300
 3        The 40 Year Old Virgin                                   ITV2               8        USA                2005        3,961,250
                                                                                                                                               5
 4        Charlie and the Chocolate Factory                        ITV2               4     UK/USA                2005        3,927,000
 5        Love Actually                                            ITV2               6     UK/USA                2003        3,656,400
 6        The Fast and the Furious: Tokyo Drift                    ITV2               6        USA                2006        3,595,850        6
 7        Bridget Jones: The Edge of Reason                        ITV2               6     UK/USA                2004        3,164,500
 8        2 Fast 2 Furious                                         ITV2               5        USA                2003        3,139,050
 9        Total Recall                                             ITV2              10        USA                1990        3,024,100        7

10        Ocean’s Eleven                                           ITV2               6        USA                2004        2,940,450
Source: Attentional, BARB.
                                                                                                                                               8

Table 11.8 outlines the number of films shown, average audience and top film on the UK’s premium subscription
movie channels. The various Sky Movie channels broadcast a total of 1,546 films across 43,591 slots while Disney
Cinemagic broadcast 1,423 films with an average audience of 23,000. The highest rated broadcast of a film on UK                                9

pay-TV was Indiana Jones and the Kingdom of the Crystal Skull, with 760,100 viewers on Sky Movies Premiere.

                                                                                                                                               10
Table 11.8 Feature films on premium subscription movie channels, 2009
                             Number of film   Average film                                                                        Audience
Channel                       transmissions      audience                                                         Top film      for top film
                                                                                                                                               11
Disney Cinemagic                  1,423         23,000                                             Toy Story 2                 207,700
Sky Movie channels               43,591         12,070       Indiana Jones and the Kingdom of the Crystal Skull                760,100
Source: Attentional, BARB.                                                                                                                     12


The top film in terms of combined viewings on the subscription film channels in 2009 was National Treasure:
Book of Secrets, which attracted a total audience of 5.4 million viewers from 184 transmissions on the Sky Movie                               13
channels (Table 11.9).


                                                                                                                                               14


                                                                                                                                               15


                                                                                                                                               16


                                                                                                                                               17


                                                                                                                                               18


                                                                                                                                               19


                                                                                                                                               20


                                                                                                     Chapter 11: Film on UK television – 97
                                                                                                                                               21
Table 11.9 Top 10 feature films on pay-TV film channels, 2009
                                                                                                                                                     Year of
                                                                                                                     Number of       Country       theatrical               Total
          Title                                                                                        Channel    transmissions      of origin       release             audience*

 1        National Treasure: Book of Secrets                                                   Sky Movies                     184      USA          2007              5,391,500
 2        The Mummy                                                                            Sky Movies                      98      USA          1999              4,186,500
 3        Alvin and the Chipmunks                                                              Sky Movies                      73      USA          2007              3,427,600
 4        Indiana Jones and the Kingdom of the Crystal Skull                                   Sky Movies                      47      USA          2007              3,357,900
 5        St Trinian’s                                                                         Sky Movies                      70       UK          2007              3,238,600
 6        Bee Movie                                                                            Sky Movies                      77      USA          2007              3,228,700
 7        The Game Plan                                                                        Sky Movies                     108      USA          2007              2,951,400
 8        Transformers                                                                         Sky Movies                      54      USA          2007              2,881,100
 9        Enchanted                                                                            Sky Movies                     127      USA          2007              2,687,500
10        Kung Fu Panda                                                                        Sky Movies                      33      USA          2008              2,674,500
Source: Attentional, BARB.
*Audience figures refer to total audience for all transmissions of that film across all subscription film channels in 2009.


11.6 The audience for film on all television channels, 2000–2009
In order to compare the audiences for film on television with the number of admissions to UK cinemas, we have
calculated the total audience for film broadcast on UK television since 2000 (see Figure 11.4). In 2000 there were
3.5 billion viewings of film on television, compared with cinema ticket sales of 143 million. Despite the massive
increase in the availability of titles with the introduction of digital television, the audience for film on television
actually declined from 2003 to 2007. The number has since recovered, largely due to the impact of the digital free-
to-air channels, but the number of film viewings per person has remained largely the same since 2000 when the
average person watched 63 films a year on terrestrial and multi-channel television. This represents 3.4 billion
television viewings per year compared with cinema admissions of 174 million.


Figure 11.4 Total audience for feature film on television (except nVoD), 2000–2009
Million
4,500

4,000
3,500

3,000
2,500

2,000

1,500
1,000

  500
     0                   2000            2001            2002             2003            2004             2005               2006         2007             2008            2009
      Terrestrial        2,901          2,929            2,601           2,833            2,579           2,350           1,949           1,827            1,808           1,725
     Subscription
     film channels         647            673              741             820              734             671                634          490                 489          559
     Other digital
     multi-channel           0               0              75             268              305             374                722           796                969        1,118
      Total (million) 3,548             3,602           3,417            3,921            3,618           3,395           3,305           3,113            3,266           3,402

Source: UK Film Council RSU, Attentional, BARB.
nVoD = pay-per-view.


98 – UK Film Council Statistical Yearbook 2010
1


                                                                                                                                       2


Figure 11.5 shows the total number of films shown on television since 2000. The steep rise in film showings                            3
to 2003 has since flattened but the 69,592 total in 2009 is almost double the number shown in 2000 (38,865).
The subscription film channels and digital multi-channel TV have driven this increase. In terms of unique film titles,
there were 2,070 films broadcast on terrestrial, 1,606 titles on the subscription film channels and 3,283 on other
                                                                                                                                       4
digital channels. Overall, 5,973 individual film titles were shown across all TV channels in 2009.

Figure 11.5 The total number of film transmissions on all television channels (except nVoD), 2000–2009                                 5

70,000

60,000                                                                                                                                 6

50,000

40,000                                                                                                                                 7

30,000

20,000                                                                                                                                 8

10,000

      0                 2000            2001     2002     2003     2004     2005     2006      2007          2008            2009      9
      Terrestrial      2,318           2,405     2,275    2,355    2,234    2,326    2,011    2,182          2,221          2,218
     Subscription
     film channels 36,547            40,277     46,720   52,552   47,499   47,698   44,346   34,737         40,014         45,015
     Other digital                                                                                                                     10
     multi-channel          0               0    4,573    7,900    8,821   13,144   17,998   20,765         20,274         22,359
      Total          38,865          42,682     53,568   62,807   58,554   63,168   64,355   57,684         62,509         69,592

Source: UK Film Council RSU, Attentional.                                                                                              11
nVoD = pay-per-view.


11.7 The value of feature film to broadcasters                                                                                         12


Based on a model developed by Attentional, we have estimated the value of feature film to UK broadcasters to be
approximately £1.1 billion in 2009. This figure is derived from the annual revenue per channel, that is, net advertising               13
revenue for the commercial channels, subscription revenues for the pay channels and the proportion of licence fee
applied to programming on the BBC channels, multiplied by the percentage of broadcast hours for feature film.
Despite the fall in advertising revenues associated with the recession, the 2009 value is slightly higher than the                     14
2008 value (£1.07 billion). This is due to an increase in the number of Sky subscribers (driven by HD), an increase
in peak-time film output (particularly on ITV1) and the continued rise in the number of films transmitted on the
free-to-air digital channels.                                                                                                          15


                                                                                                                                       16


                                                                                                                                       17


                                                                                                                                       18


„                                                                                                                                      19

 3
  For cinema admissions see Chapter 1 (page 8)
  For an overview of the film market as a whole see Chapter 13 (page 104)
 3
                                                                                                                                       20


                                                                                              Chapter 11: Film on UK television – 99
                                                                                                                                       21
Chapter 12:
Video on Demand


Video on Demand (VoD) brings        Facts in focus

films direct to our television      •  he total Video on Demand (VoD) and near-Video on
                                      T
                                      Demand (nVoD) film market was estimated to be worth
and computer screens and,             £124 million in 2009, up 3% on 2008.
increasingly, to our mobile         •  4 million households were able to access television-
                                      1
                                      based VoD and nVoD in 2009 and spent an estimated
devices, anytime, anywhere.           £108 million on films.
However, despite the number         •  nline film revenues increased by 156% to £15.9 million.
                                      O
of UK VoD services increasing       •  here are now 32 internet and television-based VoD film
                                      T
substantially over the last year,     services available to UK consumers, a five-fold increase
                                      in two years.
VoD revenues remained a small
part of the film value chain.
1


                                                                                                                                     2


12.1 Current size of the UK market                                                                                                   3

The Video on Demand (VoD) market in the UK can be divided into television-based services and internet and/or
mobile-based services. While cable TV and IPTV (Internet protocol TV) operators are able to offer a true-VoD service
(a system which streams content in real time from a server to the viewer), the leading satellite broadcaster, BSkyB, is              4
only able to offer a near-Video on Demand (nVOD) service, where multiple channels are used to show the same film
at staggered times. Around 14 million UK households were able to access VoD and nVoD films via television in 2009,
up from 12.6 million in 2008. However, the value of the total television-based market declined slightly from an                      5
estimated £114 million in 2008 to £108 million in 2009.
Despite broadband penetration of 65% of all UK households (and 90% of UK households connected to the internet),
                                                                                                                                     6
the online VoD market remained small in 2009, with estimated revenues of around £15.9 million (plus approximately
£300,000 from subscription services). However, this has grown from £6.2 million in 2008 and £700,000 in 2007 due
largely to the introduction of films on iTunes mid-way through 2008 and also on Xbox Live Marketplace.
                                                                                                                                     7
Screen Digest estimated that the combined value of the television-based VoD and nVoD and internet-based film
market was worth £124 million in 2009, roughly 3% of the total UK filmed entertainment market.
It should also be noted that title-by-title data are still unavailable for this sector and we are therefore unable to                8
report statistics on the top performing titles or the market share of UK films.


12.2 Video on Demand services in the UK                                                                                              9


VoD services in the UK employ four basic types of business model:
•	 Rental VoD – one-off rental, also known as download to rent;                                                                      10

•	 Subscription VoD (SVoD) – unlimited access to content for a fixed monthly sum;
•	 Retail – download-to-own (DTO) onto computer or portable device; and                                                              11

•	 Free/advert-supported VoD.
The number of VoD film services in the UK has grown rapidly over 2009. At the time of writing (March 2010),                          12
32 VoD film services could be identified compared with 17 in March 2009. Ten of these services offered more than
1,000 film titles, compared to five in March 2009. The leading VoD providers in the UK are listed in Table 12.1.
Virgin Media and Sky are the market leaders in television-based VoD and nVoD with over 13 million subscribers                        13
between them. Over 3.7 million Virgin Media TV subscribers are able to access a true-VoD service. The 9.7 million
Sky satellite subscribers are able to access nVoD films which can then be stored on personal video recorders (PVRs)
through the Sky Anytime service. This then becomes a service with qualities similar to true-VoD.                                     14

BT Vision (500,000 subscribers) and TalkTalk TV (100,000 subscribers) offer major studio films as part of a true-VoD
IPTV offering. For digital terrestrial television (DTT) viewers, Picturebox via Top Up TV Anytime offers a limited
                                                                                                                                     15
number of titles available through a compatible PVR.
iTunes has emerged as the leading internet-based VoD service, with a 55% share of the online market in 2009,
according to Screen Digest. Overall, catch-up TV has been the big success story of VoD, with BBC iPlayer recording                   16
120 million streams in January 2010. However, the number of feature films available on the service has been limited.


                                                                                                                                     17


                                                                                                                                     18


                                                                                                                                     19


                                                                                                                                     20


Image: Alvin and the Chipmunks 2: The Squeakquel ©2009, Twentieth Century Fox,                   Chapter 12: Video on Demand – 101
Monarchy Enterprises S.A.r.l. and Regency Entertainment USA, Inc. All rights reserved                                                21
Table 12.1 Leading VoD film services in the UK, March 2010
Service                Network                    Catalogue                   Prices                     Content providers          Business model

4oD                    Internet,                  Selection of Film4 and      Rental VoD                 Film4, 20th Century Fox    Rental VoD
                       IPTV                       20th Century Fox titles     from £1.99
Apple                  Internet,                  2000+ films                 £10.99 for new releases;   Disney, Paramount,         VoD, DTO
iTunes Store           iPhone/iPod                (500+ in HD)                £6.99 for library titles   Warner Bros and
                                                                              (£1 extra for HD films);   Lions Gate
                                                                              rental VoD from £2.49
The Auteurs            Internet                   8,500 films                 Free – £3.00               Independents and           Streaming
                                                                                                         some major studios
BabelGum               Internet                   n/a                         Free (advert-supported)    Independents               Advert-supported
                                                                                                                                    streaming
BBC iPlayer            Internet,                  Varied selection of films   Free (funded by            BBC acquired titles        Free
                       TV and mobile              broadcast on BBC TV         licence fee)
BlinkBox               Internet                   3,500 films                 Rental VoD                 All major studios          Rental VoD and DTO
                                                                                                         except Disney
Bollywood.tv           Internet                   1,000 films                 US$3.99                    Indian distributors        Rental VoD and DTO
Brightwide             Internet                   8 films                     Rental VoD £2.99           Independents               Rental VoD
BT Vision              IPTV                       400 major studio films      £1.99 – £3.95 per film     All majors except Fox      Rental VoD, SVoD
Channel Films          Internet                   500 features                Download to rent from      Independents               DTO, Rental,
                                                  and shorts                  £1.99; DTO from £4.99                                 streaming
Cinebox on             Internet                   1,000 films                 Rental VoD £2.99;          Independents               Rental VoD and DTO
MovieMail online                                                              DTO £7.99
Coolroom               Internet                   500 films                   Rental VoD from £1.99;     Major studios              Rental VoD, DTO
                                                                              DTO from £4.99             and independents
FilmIsNow.eu           Internet                   1,500 films                 €3.99–€9.99                Independents               DTO and Rental VoD
Filmflex via           Cable TV                   500 films                   £2.50–£3.50 for new        All major studios except   Rental VoD
Virgin Media                                                                  releases; 50p–£2.00        Fox. Independent
                                                                              for library titles         distributors including
                                                                                                         Icon and Pathé
Go! View               Internet for PSP           Monthly selection           Rental VoD from            Universal                  Rental VoD
                                                                              £2.50 per title
iLoaded                Internet                   200 films                   From £5.00 for             Major studios              DTO
                                                                              library titles; £10.00     and independents
                                                                              for new releases
IndieMoviesonline      Internet                   130 films                   Free (advert-supported)    Independents               Advert-supported
                                                                                                                                    streaming
ITV Player             Internet                   Selection of films          Free (advert-supported)    ITV acquired titles        Advert-supported
                                                  broadcast on ITV channels                                                         streaming
Jaman                  Internet                   1,000 films                 From £1.99 for             Independent                Rental VoD, DTO,
                                                                              rental VoD                 distributors               Free and streaming
Joiningthedocs.tv      Internet                   100 titles                  SVoD £10.00 per month;     Independent                VoD streaming
                                                                              Rental VoD £4.00           documentaries
Joost                  Internet and iPhone        1,200 features              Free (advert-supported)    Paramount, Eros            Advert-supported
                       application                and shorts                                             and independents           streaming
Lovefilm               Internet                   3,500 films                 Rental VoD                 Three major studios plus   Rental VoD
                                                                              £2.99–£3.49                independent distributors
Picturebox on          DTT                        28 films per month;         £5.00 per month            Universal                  SVoD
Top-Up TV                                         7 rotated weekly
Playstation Store      Internet/PlayStation       n/a                         n/a                        n/a                        Rental VoD and DTO
Projector.tv           Internet                   100+ films                  n/a                        Independents               Rental VoD and DTO
Samsung Movies         Internet                   n/a                         Rental VoD 99p–£2.99;      Independents and           Rental VoD and DTO
                                                                              DTO £4.99–£13.99           major studios
Sky Anytime            Satellite/Internet TV      400 films                   £3.99 per film;            All major                  VoD, nVoD
                                                  (including HD)              £16 per month for SVoD     US studios
                                                                              Premium Sky Movies
Sky Player             Internet                   400 films                   Subscription               All major studios          Streaming
Talk Talk TV           IPTV                       Over 1,000 films            From £1.99–£3.49           All major studios          Rental VoD, SVoD
                                                                              per rental


102 – UK Film Council Statistical Yearbook 2010
1


                                                                                                                                                                          2


                                                                                                                                                                          3

Service                 Network                   Catalogue                      Prices                         Content providers            Business model

Tesco                   Internet                  2,500 films                    £1–£20;                        Major studios                VoD, DTO
Digital                                                                          New releases £9.97                                                                       4

The Vid Store           Internet                  100 films                      DTO £7.99; rental VoD          Major studios                Rental VoD, DTO
Xbox Live               Internet/IPTV             80 films (16 in HD)            £2.13–£4.08                    Paramount,                   Rental VoD
Marketplace                                                                      per film                       Warner Bros, Disney                                       5
Source: UK Film Council.


                                                                                                                                                                          6
12.3 Future prospects for the VoD market
Although the number of VoD services has increased markedly over the last two years, the aggregate size of the
market remains small. Key factors behind the relatively modest growth of the sector remain the following – barriers                                                       7

to delivery to the television screen, pricing and availability of titles, and download speeds.
Research conducted by Ipsos Media CT in 20091 found a high level of interest in downloading newly released films
                                                                                                                                                                          8
at the same time as the DVD release, and increasingly the VoD window is being brought forward in line with DVD
release dates. Television-based nVoD is typically no later than six months after theatrical release.
The same research revealed that lack of connectivity between internet and television was a key barrier to consumer                                                        9
uptake of film VoD, so any solution which enables internet access through a main household television (via the
proposed Project Canvas or similar) could well make a significant contribution to the development of this market.
Other key factors to be addressed over the coming years include improving the user interface (via better menu                                                             10
options and recommendation engines), increasing broadband speed and capacity, finding price points that work
for both the industry and the consumer and increasing the size of VoD film catalogues so that a wider choice of
material is available.                                                                                                                                                    11

1.  pportunities for digital distribution – assessing models in the music, film and games markets, Ipsos Media CT, May 2009
   O


                                                                                                                                                                          12


                                                                                                                                                                          13


                                                                                                                                                                          14


                                                                                                                                                                          15


                                                                                                                                                                          16


                                                                                                                                                                          17


                                                                                                                                                                          18


„
 3F
   or more information on film on video see Chapter 10 (page 80)                                                                                                        19
 3F
   or more information on film on television see Chapter 11 (page 90)
 3F
   or an overview of the film market as a whole see Chapter 13 (page 104)
                                                                                                                                                                          20


                                                                                                                                      Chapter 12: Video on Demand – 103
                                                                                                                                                                          21
Chapter 13:
The UK film market as a whole


New films typically                Facts in focus

establish their reputation in      •  he total filmed entertainment market in the UK in
                                     T
                                     2009 is estimated to have been £3.7 billion, unchanged
the cinema, but only a quarter       from 2008.
of the industry’s UK revenues      • n 2009, the UK had the third-largest filmed
                                     I
                                     entertainment market in the world after the USA
come from cinema exhibition.         and Japan.
Physical video sales and           • n 2009, sell-through video on physical media was the
                                     I
rentals account for 41% of the       largest single revenue source for film in the UK market,
                                     accounting for 35% of total revenues.
market, while film on television   • n 2009, theatrical revenues and pay-TV revenues
                                     I
generates significant revenue.       from film and Video on Demand all recorded increases,
                                     but sell-through and rental video and free-to-air TV
                                     revenues declined.
1


                                                                                                                                                                                    2


13.1 The UK filmed entertainment market as a whole                                                                                                                                  3

‘Video’ is used in this chapter as the generic description of all physical video formats, including DVD, UMD
(Universal Media Disc), high-definition DVD (HD-DVD) and Blu-ray.
                                                                                                                                                                                    4
In 2008 and 2009, physical video retail was the largest single revenue source (Table 13.1), accounting for 35%
of total revenues in 2009 (£1.3 billion). Theatrical revenues increased by 11% to £944 million, while physical video
rental revenues fell slightly from £202 million to £199 million. Gross television revenues increased by 4% from
                                                                                                                                                                                    5
£1,067 million to £1,108 million, thanks to film on pay-TV, though much of this accrued to the television industry
rather than to the suppliers of film.
The market share for UK films was highest for terrestrial television (24%) and lowest for film on pay-TV where it                                                                   6
was 16%.

Table 13.1 UK filmed entertainment market, 2008 and 2009                                                                                                                            7

                                                                                                                Attributable to                                  Attributable to
                                                                                      Total gross value                UK films        Total gross value                UK films
                                                                                             (£ million)             (£ million)              (£ million)             (£ million)
Platform                                                                                          2008                    2008                     2009                    2009     8

Theatrical                                                                                      850                      261                     944                      160
Video rental (physical)                                                                         202                       48                     199                       41       9
Video retail (physical)                                                                       1,454                      349                   1,311                      275
Pay-TV                                                                                          521                       76                     585                       93
Terrestrial television                                                                          257                       60                     240                       58       10

‘Free’ multi-channel television                                                                 289                       57                     283                       59
nVoD and VoD                                                                                    120                       29                     124                       26
                                                                                                                                                                                    11
Total UK                                                                                      3,693                      880                   3,686                      712
Sources: Rentrak EDI, BVA, Official Charts Company, Attentional, Screen Digest, RSU analysis.
Notes:
                                                                                                                                                                                    12
‘Theatrical’ is the total gross UK theatrical revenues (including VAT) in the calendar year 2009 for all films exhibited in the UK. See Chapter 1.
‘Video rental (physical)’ is the total revenue from physical video rental (DVD, Blu-ray, etc) transactions in the calendar years 2008 and 2009. See Chapter 10.
‘Video retail (physical)’ is the total revenue from physical video retail transactions in the calendar years 2008 and 2009. See Chapter 10.
The television values are retail equivalent values calculated from the dataset of films shown on UK television. Values are estimated by multiplying the film share of the total
                                                                                                                                                                                    13
channel time by the total revenue applicable to that channel (licence fee, subscription or advertising revenue). Television values cover terrestrial, subscription and free
multi-channel. See Chapter 11. An estimate for pay-per-view is included in nVoD.
Video on Demand and near-Video on Demand revenues are derived from Screen Digest estimates of the combined size of the television and internet-based markets.
UK share is based on an estimate derived from knowledge of UK film share in the pay-TV and video markets.
The above values are gross values and include exhibitor and distributor margins, VAT, prints and advertising costs, DVD/video retail margins, broadcaster and multi-channel         14
television operator margins in addition to net returns to the film production sector and film investors.
The revenues shown here are revenues earned by film in the UK market, whether UK or foreign films. The table does not include export revenues for the UK film industry.
See Chapter 20 for UK film export revenues.
                                                                                                                                                                                    15


                                                                                                                                                                                    16


                                                                                                                                                                                    17


                                                                                                                                                                                    18


                                                                                                                                                                                    19


                                                                                                                                                                                    20


Image: Brighton Rock courtesy of Optimum Releasing                                                                            Chapter 13: The UK film market as a whole – 105
                                                                                                                                                                                    21
13.2 The UK market in the global context
In 2009, the UK had the third-largest filmed entertainment market in the world, after the USA and Japan (Table
13.2). The USA accounted for 40% of the world market. The next biggest individual territories after the UK were
France, Germany, Canada, Australia and Italy.
The world filmed entertainment market is still dominated by the largest developed economies. Although the
Indian market is vast in terms of admissions and both India and China have huge populations and are growing
fast economically, their filmed entertainment markets still count in US dollar terms below Australia (population
22 million) and Italy (population 60 million).

Table 13.2 Filmed entertainment revenues by country/region, US$ million, 2009
                                                                                                                                       Revenue in              Percentage
Country/region                                                                                                                         US$ million                 of total

USA                                                                                                                                     34,431                    40.4
Japan                                                                                                                                   11,061                    13.0
UK                                                                                                                                       5,599                     6.6
Other Western Europe                                                                                                                     5,151                     6.1
France                                                                                                                                   3,763                     4.4
Germany                                                                                                                                  3,646                     4.3
Canada                                                                                                                                   3,330                     3.9
Other Asia Pacific                                                                                                                       2,681                     3.1
Australia                                                                                                                                2,562                     3.0
Latin America                                                                                                                            2,431                     2.9
Italy                                                                                                                                    2,087                     2.5
Central and Eastern Europe                                                                                                               1,982                     2.3
India                                                                                                                                    1,899                     2.2
Spain                                                                                                                                    1,688                     2.0
South Korea                                                                                                                              1,275                     1.5
China                                                                                                                                    1,206                     1.4
Middle East and Africa                                                                                                                     345                     0.4
Total                                                                                                                                   85,137                   100.0
Source: PricewaterhouseCoopers, Global Entertainment and Media Outlook 2010–2014, June 2010
Note: ‘Filmed entertainment revenue’ includes box office receipts, home DVD/video (rental and retail) and online download and streaming revenues. It does not include
TV revenues.

According to PricewaterhouseCoopers, the situation is forecast to change by 2014 (Table 13.3), with India becoming
the eighth-largest individual territory, ahead of Italy and Spain. The USA is forecast to remain the largest single film
territory (by a factor of three). The value of the Chinese market is expected to double, with China’s forecast share of
the global filmed entertainment market increasing to 2.4%.


106 – UK Film Council Statistical Yearbook 2010
1


                                                                                                                                                                                2


Table 13.3 Filmed entertainment revenues by country/region, US$ million, forecast for 2014                                                                                      3
                                                                                                                                         Revenue in              Percentage
Country/region                                                                                                                           US$ million                 of total

USA                                                                                                                                      41,162                      38.3       4
Japan                                                                                                                                    15,053                      14.0
UK                                                                                                                                        7,159                       6.7
                                                                                                                                                                                5
Other Western Europe                                                                                                                      6,024                       5.6
France                                                                                                                                    4,483                       4.2
Germany                                                                                                                                   4,411                       4.1       6
Canada                                                                                                                                    4,139                       3.8
Australia                                                                                                                                 3,417                       3.2
India                                                                                                                                     3,400                       3.2       7

Other Asia Pacific                                                                                                                        3,255                       3.0
Latin America                                                                                                                             3,129                       2.9
                                                                                                                                                                                8
Central and Eastern Europe                                                                                                                2,872                       2.7
China                                                                                                                                     2,549                       2.4
Italy                                                                                                                                     2,527                       2.3       9

Spain                                                                                                                                     1,935                       1.8
South Korea                                                                                                                               1,592                       1.5
                                                                                                                                                                                10
Middle East and Africa                                                                                                                      424                       0.4
Total                                                                                                                                   107,531                     100.0
Source: PricewaterhouseCoopers, Global Entertainment and Media Outlook 2010–2014, June 2010.                                                                                    11
Notes:
‘Filmed entertainment revenue’ includes box office receipts, home DVD/video (rental and retail) and online download and streaming revenues. It does not include TV revenues.
Forecasts are in nominal US dollars at the average 2009 exchange rate and therefore do not estimate the impact of any changes in exchange rates between 2009 and 2014.
                                                                                                                                                                                12


13.3 The evolution of UK film revenues, 1998–2009
                                                                                                                                                                                13
After strong growth in the early 2000s, aggregate film revenues fell in 2005 and 2006 (Figure 13.1). The chart
shows a resumption of growth in 2007, as a result of increases in theatrical revenues and film on retail video.
Since then, revenues have stabilised, with growth in the theatrical and pay-TV markets compensating for a decline
in the physical rental and retail video markets. The VoD and nVoD markets remain a small component of the overall                                                               14

film value chain.

                                                                                                                                                                                15


                                                                                                                                                                                16


                                                                                                                                                                                17


                                                                                                                                                                                18


                                                                                                                                                                                19


                                                                                                                                                                                20


                                                                                                                           Chapter 13: The UK film market as a whole – 107
                                                                                                                                                                                21
Figure 13.1 Gross film revenues, all platforms, 1998–2009
£ million
4,500

4,000

3,500

3,000

2,500

2,000

1,500

1,000

  500

    0                           1998       1999        2000         2001         2002        2003         2004        2005         2006         2007        2008         2009
    Theatrical                   547        563          583         645          755          742         770          770          762         821          850         944
    Rental video (physical)      437        408          444         494          492          457         458          390          327         280          202         199
    Retail video (physical)      453        451          601         821        1,175        1,392       1,557        1,399        1,302       1,440        1,454       1,311
    Film on television           726        755          826         954        1,066        1,182       1,119        1,089        1,066         994        1,067       1,108
    Film on VoD                   17          19          32           44           49          58           60          64           72          92          119         124
    Total                      2,180      2,196        2,486       2,958        3,537       3,830        3,964        3,712       3,528        3,627        3,692       3,686

Source: Rentrak EDI, MRIB, BVA, Official Charts Company, Attentional, Screen Digest, RSU analysis.
Notes: ‘Film on television’ covers terrestrial, subscription and free multi-channel. TV-based nVoD and VoD are included within the VoD total.
Retail video values for 2007 and earlier years have been re-estimated on the basis of improved title-by-title video retail value data that became available in 2008.
Rental video values are now based on Screen Digest data.


The revenues shown in Figure 13.1 are the actual figures. If adjusted for inflation using the recreational and
cultural services price index (Figure 13.2), the decline in revenues in 2005 and 2006 is more marked. Real revenues
in 2006 were 18% below the level of 2004. Real revenues dropped marginally between 2006 and 2008, with a 4%
decline in 2009.


Figure 13.2 Gross inflation-adjusted film revenues, all platforms, 1998–2009, expressed in 2005 pounds
£ million in 2005 pounds
4,500

4,000

3,500

3,000

2,500

2,000

1,500

1,000

  500

     0                          1998       1999        2000         2001         2002        2003         2004        2005         2006         2007        2008         2009
    Theatrical                 688.9      687.4        695.7       752.6        829.7        788.5        798.8       770.0        728.5       754.6        758.3       811.0
    Rental video (physical)    550.4      498.2        529.8       576.4        540.7        485.7        475.1       390.0        312.6       257.4        180.2       171.0
    Retail video (physical)    570.5      551.1        717.7       957.9      1,291.4      1,478.9      1,615.1     1,399.1      1,244.3     1,323.6      1,297.1      1,126.3
    Film on television         914.4      921.9        985.7     1,113.2      1,171.4      1,256.1      1,160.8     1,089.0      1,019.1       913.6        951.8       951.9
    Film on VoD                  21.4      23.2         37.9         51.5         53.5        61.2         62.1        63.8         68.6        84.7        106.5       106.5
    Total                     2,746.0   2,682.0      2,967.0     3,452.0      3,887.0      4,070.0     4,112.0      3,712.0      3,373.0     3,334.0      3,294.0      3,167.0

Source: Rentrak EDI, MRIB, BVA, Official Charts Company, Attentional, ONS, Screen Digest, RSU analysis.
Notes: Actual revenues deflated by the UK recreational and cultural services price index, using the year to December 2005 as the base.
‘Film on television’ covers terrestrial, subscription and free multi-channel. Television-based nVoD and VoD are included in the VoD total.
Rental video values are now based on Screen Digest data.


108 – UK Film Council Statistical Yearbook 2010
1


                                                                                                                                         2


Previous UK Film Council research has identified film theft and competition from new media entertainments as two                         3
factors influencing the revenue decline in 2005 and 2006 (see 2006/07 Statistical Yearbook, Chapter 13). In 2009, the
theatrical market was boosted by several high grossing 3D releases while HD TV was seen as the key driver of growth
in the pay-TV sector.
                                                                                                                                         4


13.4 The impact of recession
                                                                                                                                         5
There are two ways recession might influence the film industry – by affecting the demand for filmed entertainment
and, on the supply side, by diminishing the availability of film finance.
On the demand side, there is evidence that the theatrical film market is recession resistant. In each of the UK                          6
recessions of 1974–76, 1980–82 and 1990–92 cinema admissions stayed close to the long-term trend of the period
in question. UK cinema ticket sales increased by 6% in 2009 (Figure 13.3), despite the sharpest recession since the
Second World War. This growth has been attributed to several factors – a good selection of films coming to market,                       7
the success of 3D and a substitution effect as people scaled back expenditure on expensive consumer durables and
foreign travel in favour of cinema entertainment.
                                                                                                                                         8
Figure 13.3 UK cinema admissions, 1970–2009
Millions
200                                   R1            R2                  R3                                                  R4
                                                                                                                                         9


150                                                                                                                                      10


                                                                                                                                         11
100


                                                                                                                                         12
 50               1970              1975     1980        1985    1990         1995          2000             2005             2010

      Cinema admissions
      Cinema admissions trend                                                                                                            13

Source: CAA, UK Film Council RSU.
Note: R1 to R4 = Recession periods 1 to 4.

                                                                                                                                         14
However, the ‘credit crunch’ of 2008/09 is reported to have had an impact on film financing. Hollywood experienced
a decline in some of its sources of financing (eg hedge fund money) and the UK independent sector found it harder
to raise finance for film production. Judging by UK production data (see Chapter 16) financing challenges have
                                                                                                                                         15
exerted downward pressure on UK independent film budgets but have not affected the flow of US studio product.
It is unlikely, therefore, that the overall size of the film market will be negatively affected.
The main uncertainties are film quality and the pace of the digital revolution. 3D films were the big success story of                   16
2009 and the 3D roll-out continues in 2010. Film revenues depend on a relatively small number of hits, so if the right
creative choices are made, the theatrical market should continue to grow.
Regarding video, the physical market is clearly experiencing downward pressure on both prices and volume. The main                       17
question is how fast Video on Demand and its competitor, film theft, will develop. If moves to limit film theft prove a
success, we will hopefully see a large new legal Video on Demand market develop over the next few years.
                                                                                                                                         18


„                                                                                                                                        19

 3F
   or information on the export revenues of the UK film industry, see Chapter 20 (page 171)
 3F
   or more information on the Video on Demand market, see Chapter 12 (page 100)
                                                                                                                                         20


                                                                                       Chapter 13: The UK film market as a whole – 109
                                                                                                                                         21
Chapter 14:
Audiences


Watching films is one of            Facts in focus

the UK’s favourite pastimes.        • n 2009, 60% of the UK population said they went to
                                      I
                                      the cinema at least once a year, the same percentage
On average almost seven films         as 2008.
are seen per person per month,      •  8% went to the cinema once a month or more.
                                      1

either in the cinema, on video      •  he cinema audience for the top 20 films in 2009 was
                                      T
                                      predominantly young, with the 7–34 age group (40%
or television, or increasingly        of the population) making up 64% of the audience.
online and via portable devices.    •  inority ethnic groups were equally or over-represented
                                      M
Age, gender, ethnicity and socio-     in the film audience, except for viewing pay-per-view
                                      films where they were under-represented.
economic status influence film      •  isabled people were under-represented in the
                                      D
preferences and the tendency          film audience.

to watch films at home or           •  otal ‘film viewing occasions’ numbered over 4.5 billion,
                                      T
                                      which means an average of 81 film viewings per person
on the big screen – and to            in 2009.
download films illicitly.
1


                                                                                                                                                                                 2


14.1 Cinema audience by gender                                                                                                                                                   3

Six out of 10 of us went to the cinema at least once in 2009, the same level as 2008. Almost one person in five,
18% (18% in 2008), went to the cinema once a month or more (Table 14.1).
                                                                                                                                                                                 4
The overall UK cinema audience in 2009 was evenly split between male and female, in contrast to the slight female
bias reported in 2008 due largely to the success of Mamma Mia! and Sex and the City (Table 14.2).
                                                                                                                                                                                 5
Table 14.1 Frequency of cinema visits by gender, 2009
                                                                                                                                Male %           Female %            Overall %
                                                                                                                                                                                 6
Go to the cinema at least once per year (proportion of population 7+)                                                               60                 61                 60
Go to the cinema at least once a month (proportion of population 7+)                                                                19                 17                 18
Source: CAA Film Monitor Jan–Dec 2009.                                                                                                                                           7


Table 14.2 Cinema audience by gender 2009	
                                                                                                                                                                                 8
                                                                                                                                2008                                     2009

                                                                                                           Male %           Female %               Male %            Female %

Top 20 films (proportion of audience)                                                                         49                  51                   51                  49    9

Top UK films (proportion of audience)*                                                                        46                  54                   49                  51
Total survey population 7+                                                                                    49                  51                   50                  50
                                                                                                                                                                                 10
Source: CAA Film Monitor.
Notes:
*Audience data were only available for 17 of the top 20 UK films released in 2009.
‘Audience’ in this table and throughout this chapter refers to film-going occasions. That is, if a person went to the cinema to see 10 films in 2009, that person would have     11
contributed 10 film-going occasions to the audience figures above, unless otherwise stated. Repeat visits to the same films are not recorded in CAA Film Monitor.
CAA Film Monitor included 115 film titles (mostly popular) of the 503 theatrical releases in 2009. These 115 film titles accounted for 80% of the gross box office of the UK
and Republic of Ireland of the year. Film Monitor results are derived from a weekly nationally representative sample survey of 2,000 adults aged 15+ across Great Britain,
conducted for the CAA by BMRB.
                                                                                                                                                                                 12


14.2 Film preferences by gender
                                                                                                                                                                                 13
Although the overall cinema audience in 2009 was split almost evenly between men and women, some films
attracted substantially more of one gender than the other (Table 14.3). Men preferred action (Terminator Salvation,
X-Men Origins: Wolverine), comedy (Brüno, Lesbian Vampire Killers), and science fiction (Avatar, Star Trek). Comedy                                                              14
(Marley  Me), romance/fantasy (The Twilight Saga: New Moon) and animation (A Christmas Carol) figured highly
in the list of films with large female audience shares (Table 14.3).
                                                                                                                                                                                 15


                                                                                                                                                                                 16


                                                                                                                                                                                 17


                                                                                                                                                                                 18


                                                                                                                                                                                 19


                                                                                                                                                                                 20


Image: The Imaginarium of Dr Parnassus courtesy of Lions Gate Films                                                                             Chapter 14: Audiences – 111
                                                                                                                                                                                 21
Table 14.3 Audience gender split of top performing films released in the UK and Republic of Ireland, 2009
Top 20 films and top UK films
Greater female audience share                                                                                               Male %       Female %

Marley  Me                                                                                                                    22             78
The Twilight Saga: New Moon                                                                                                    34             66
A Christmas Carol                                                                                                              39             61


Greater male audience share                                                                                                 Male %       Female %

Terminator Salvation                                                                                                           72             28
Brüno                                                                                                                          67             33
Planet 51 (UK)                                                                                                                 67             33
Lesbian Vampire Killers (UK)                                                                                                   67             33
X-Men Origins: Wolverine                                                                                                       66             34
Avatar                                                                                                                         65             35
The Imaginarium of Dr Parnassus (UK)                                                                                           64             36
Star Trek                                                                                                                      62             38


Gender difference not statistically significant                                                                             Male %       Female %

Dorian Gray (UK)                                                                                                               51             49
Slumdog Millionaire (UK)                                                                                                       50             50
G-Force                                                                                                                        49             51
Angels and Demons                                                                                                              49             51
Alvin and the Chipmunks 2: The Squeakquel                                                                                      48             52
Bolt                                                                                                                           48             52
Harry Potter and the Half-Blood Prince (UK)                                                                                    48             52
Up                                                                                                                             48             52
Source: CAA Film Monitor.
Note: Audience demographic data were available for 17 of the top 20 UK films released in 2009.


14.3 Cinema audience by age
Teenagers and young adults were the most frequent cinema-goers in 2009 (Table 14.4), a pattern common to
previous years. The 40% of the population in the 7–34 age group provided 64% of the top 20 film audience and
53% of the top UK film audience (Table 14.5).

Table 14.4 Frequency of cinema visits by age group, 2009
                                                               Age 7–14 % Age 15–24 % Age 25–34 % Age 35–44 % Age 45–54 %   Age 55+ %    Overall %

Go to the cinema at least once per year
(proportion of population 7+)                                          88              81        67      66           58          35          60
Go to the cinema at least once a month
(proportion of population 7+)                                          32              40        21      15           11             6        18
Source: CAA Film Monitor.


112 – UK Film Council Statistical Yearbook 2010
1


                                                                                                                                                                                   2


Table 14.5 Cinema audience by age group, 2009                                                                                                                                      3
                                                                  Age 7–14 % Age 15–24 % Age 25–34 % Age 35–44 % Age 45–54 %                        Age 55+ %           Total %

Top 20 films (proportion of audience)                                        22            25              17              18               10               8            100
                                                                                                                                                                                   4
Top UK films (proportion of audience)                                        15            23              15              19               14              15            100
Total survey population aged 7+                                              11            14              15              17               14              30            100
Source: CAA Film Monitor.                                                                                                                                                          5
Totals may not sum to 100 due to rounding. See notes to Table 14.2.


Table 14.6 Cinema audience by gender and age group, 2009                                                                                                                           6

                                                                  Age 7–14 % Age 15–24 % Age 25–34 % Age 35–44 % Age 45–54 %                        Age 55+ %           Total %

Male                                                                          9            15              11               8                 4               3            50      7

Female                                                                        9            16               7               8                 5               5            50
Total                                                                        18            31              18              16                 9               8           100
                                                                                                                                                                                   8
Source: CAA Film Monitor.
Note: Figures include audiences for 115 film titles (mostly high grossing) of the 503 theatrical releases in 2009. These 115 film titles accounted for 80% of the gross box
office of the UK and Republic of Ireland for the year.

Figure 14.1 shows the age trends of cinema-goers from 1997 to 2009. The proportion of people aged 35 or above                                                                      9
going to the cinema increased gradually at the expense of younger cinema-goers from 1997 to 2008. However, last
year saw an increase in the number of 25- to 44-year-old cinema-goers at the expense of the over 45s which may
reflect the number of animated family films in the top 20 last year and also the absence of a major hit with particular                                                            10
appeal to the over 45 audience, as was the case with Mamma Mia! in 2008.

Figure 14.1 Age distribution of cinema-goers, 1997 to 2009                                                                                                                         11
%
100
 90                                                                                                                                                                                12
 80
 70
 60                                                                                                                                                                                13
 50
 40
 30                                                                                                                                                                                14

 20
 10
    0               1997         1998        1999         2000        2001         2002         2003        2004        2005         2006         2007       2008         2009     15
        15–24         43          40           39          40           36          35           36          30          38           38          34           36             35
        25–34         29          29           29          27           25          27           26          27          19           21          20           18             21
        34–44         14          16           15          17           20          20           16          18          18           17          19           16             18   16
        45+           14          15           17          16           19          18           22          25          25           24          27           30             25

Source: CAA, National Readership Survey (NRS), CAA Film Monitor.
Note: Cinema-goers are defined as those who reported to have ‘ever gone’ the cinema in the surveys. Figures for any given year may have included audiences
for a small number of titles released in the latter part of the previous year.                                                                                                     17


                                                                                                                                                                                   18


                                                                                                                                                                                   19


                                                                                                                                                                                   20


                                                                                                                                                  Chapter 14: Audiences – 113
                                                                                                                                                                                   21
14.4 Film preferences by age
Animations, comedies and family films such as Bolt, G-Force, Planet 51 and Up appealed to the 7–14 audience (Table
14.7). Action, comedies and romance/fantasy films appealed to the 15–24 age group (Table 14.8). Brüno and Avatar
were of particular appeal to the 25–34 audience (Table 14.9). Besides Dorian Gray, family animated features
appealed to the 35–44 audience (Table 14.10), some of whom would be parents accompanying their children.
UK-produced Last Chance Harvey and The Boat That Rocked attracted a greater proportion of cinema-goers in the
45–54 age group (Table 14.11). UK films continued to appeal strongly to the over 55 audience (Table 14.12) with
The Young Victoria, Last Chance Harvey, Dorian Gray and Slumdog Millionaire all featuring in the list.

Table 14.7 Films with an above-average audience in 7–14 age group, 2009 top 20 films and top UK films
Title 	                                                                                 Age group % of the film’s total audience

G-Force                                                                                                                     47
Bolt                                                                                                                        41
Planet 51 (UK)                                                                                                              39
Up                                                                                                                          38
Marley  Me                                                                                                                 37
Fantastic Mr. Fox (UK)                                                                                                      36
Monsters vs. Aliens                                                                                                         36
Alvin and the Chipmunks 2: The Squeakquel                                                                                   34
Night at the Museum 2                                                                                                       33
Ice Age III                                                                                                                 33
7–14 age group in top 20 and top UK audience (%)                                                                            22
7–14 age group in total survey population (%)                                                                               11
Source: CAA Film Monitor.


Table 14.8 Films with an above-average audience in 15–24 age group, 2009 top 20 films and top UK films
Title 	                                                                                 Age group % of the film’s total audience

Brüno                                                                                                                       60
The Hangover                                                                                                                55
Fast  Furious                                                                                                              48
The Boat That Rocked (UK)                                                                                                   48
Lesbian Vampire Killers (UK)                                                                                                47
The Twilight Saga: New Moon                                                                                                 45
Transformers: Revenge of the Fallen                                                                                         38
Terminator Salvation                                                                                                        36
X-Men Origins: Wolverine                                                                                                    35
The Imaginarium of Dr Parnassus (UK)                                                                                        35
15–24 age group in top 20 and top UK audience (%)                                                                           25
15–24 age group in total survey population (%)                                                                              14
Source: CAA Film Monitor.


114 – UK Film Council Statistical Yearbook 2010
1


                                                                                                                                    2


Table 14.9 Films with an above-average audience in 25–34 age group, 2009 top 20 films and top UK films                              3
Title 	                                                                                  Age group % of the film’s total audience

Brüno                                                                                                                        29
                                                                                                                                    4
Avatar                                                                                                                       27
25–34 age group in top 20 and top UK audience (%)                                                                            17
25–34 age group in total survey population (%)                                                                               15     5
Source: CAA Film Monitor.


                                                                                                                                    6
Table 14.10 Films with an above-average audience in 35–44 age group, 2009 top 20 films and top UK films
Title 	                                                                                  Age group % of the film’s total audience

Dorian Gray (UK)                                                                                                             31     7

Monsters vs. Aliens                                                                                                          28
Planet 51 (UK)                                                                                                               27
                                                                                                                                    8
35–44 age group in top 20 and top UK audience (%)                                                                            18
35–44 age group in total survey population (%)                                                                               17
Source: CAA Film Monitor.                                                                                                           9


Table 14.11 Films with an above-average audience in 45–54 age group, 2009 top 20 films and top UK films
                                                                                                                                    10
Title 	                                                                                  Age group % of the film’s total audience

Last Chance Harvey (UK)                                                                                                      17
The Boat That Rocked (UK)                                                                                                    16     11

45–54 age group in top 20 and top UK audience (%)                                                                            10
45–54 age group in total survey population (%)                                                                               14
                                                                                                                                    12
Source: CAA Film Monitor.


                                                                                                                                    13
Table 14.12 Films with an above-average audience in 55+ age group, 2009 top 20 films and top UK films
Title 	                                                                                  Age group % of the film’s total audience

The Young Victoria (UK)                                                                                                      49     14
Last Chance Harvey (UK)                                                                                                      40
Dorian Gray (UK)                                                                                                             20
                                                                                                                                    15
Slumdog Millionaire (UK)                                                                                                     20
55+ age group in top 20 and top UK audience (%)                                                                               8
55+ age group in total survey population (%)                                                                                 30     16
Source: CAA Film Monitor.


                                                                                                                                    17
14.5 Cinema audience by social group
The cinema audience for both the top 20 films and top UK films had a higher incidence of people in professional
and higher-skilled manual occupations than in the population as a whole (Tables 14.13 and 14.14).                                   18


                                                                                                                                    19


                                                                                                                                    20


                                                                                                    Chapter 14: Audiences – 115
                                                                                                                                    21
Table 14.13 Frequency of cinema visits by social group, 2009
                                                                                                                       AB %         C1 %        C2 %        DE %    Overall %

Go to the cinema at least once per year (proportion of population 7+)                                                   73           65          57           46          60
Go to the cinema at least once a month (proportion of population 7+)                                                    21           21          15           13          18
Source: CAA Film Monitor.


Table 14.14 Cinema audience by social group, 2009
                                                                                                                       AB %        C1 %         C2 %        DE %      Total %

Top 20 films (proportion of audience)                                                                                   29           34          19           19        100
Top UK films (proportion of audience)                                                                                   34           35          16           15        100
Total survey population 7+                                                                                              25           29          21           25        100
Source: CAA Film Monitor.
Notes:
AB: Professional, business and white collar, C1: Higher-skilled manual, C2: Lower-skilled manual, DE: ‘Semi-’ and ‘Un-skilled’ manual.
Percentages may not add to 100 due to rounding.


14.6 Film preferences by social group
Four films including UK biopic The Young Victoria had a strong appeal to the AB audience in 2009 (Table 14.15).
Three films Planet 51, Marley  Me and Monsters vs. Aliens appealed to the DE audience (Table 14.16), while only
one film was found to have a significantly strong appeal to the C1 audience group, which was Lesbian Vampire
Killers (54% of total audience).

Table 14.15 Films with above-average AB audience share, 2009 top 20 films and top UK films	
Title	                                                                                                                                     AB group % of film’s total audience

The Young Victoria (UK)                                                                                                                                                   58
Last Chance Harvey (UK)                                                                                                                                                   43
The Boat That Rocked (UK)                                                                                                                                                 42
Star Trek                                                                                                                                                                 40
AB share of top 20 and top UK audience (%)                                                                                                                                30
AB in total survey population (%)                                                                                                                                         25
Source: CAA Film Monitor.


Table 14.16 Films with above-average DE audience share, 2009 top 20 films and top UK films
Title	                                                                                                                                     DE group % of film’s total audience

Planet 51 (UK)                                                                                                                                                            41
Marley  Me                                                                                                                                                               29
Monsters vs. Aliens                                                                                                                                                       27
DE share of top 20 and top UK audience (%)                                                                                                                                18
DE in total survey population (%)                                                                                                                                         25
Source: CAA Film Monitor.


116 – UK Film Council Statistical Yearbook 2010
1


                                                                                                                                                                             2


14.7 Film audiences by ethnicity                                                                                                                                             3

According to a survey of 15,000 people by Kantar Worldpanel, minority ethnic groups were over-represented among
buyers of cinema tickets and rental and sell-through video but were under-represented among viewers of pay-per-
view (PPV) (Table 14.17). For reference, the size of each of these markets as measured in the Kantar Worldpanel                                                              4
survey is shown in Table 14.18.

                                                                                                                                                                             5
Table 14.17 Ethnicity of audiences aged 12+ for cinema, rental and retail video, PPV, 2009
                                                                                                                                 Black, Asian,
                                                                                                                               Chinese, mixed
                                                                                                                                 and other %                     White %     6

Population aged 12+                                                                                                                       6.8                      93.2
Buyers of cinema, rental, retail and PPV film                                                                                             7.3                      92.7
                                                                                                                                                                             7
Cinema-goers                                                                                                                              7.5                      92.5
Video buyers                                                                                                                              7.4                      92.6
Video renters                                                                                                                             7.6                      92.4      8
PPV buyers                                                                                                                                5.1                      94.9
Source: Kantar Worldpanel.
Notes:                                                                                                                                                                       9
Fieldwork took place in July 2009. Purchase data for 52 weeks ending 3 January 2010.
‘Video’ includes all physical video formats, including DVD, UMD (Universal Media Disc), high-definition DVD (HD-DVD) and Blu-ray.

                                                                                                                                                                             10
Table 14.18 Size of cinema, rental, retail and PPV markets for 12+ age groups, 2009
                                                                                                                                                                   Market
                                                                                                                                    Number of                     volume     11
                                                                                                                                      persons/                 (individual
                                                                                                                                       buyers                  purchases,
                                                                                                                                      (million)                   million)

Population aged 12+                                                                                                                     48.7                       n/a       12

Total buyers: cinema, rental, retail and PPV film                                                                                       34.1                     523.3
Cinema-goers                                                                                                                            24.0                     190.2
                                                                                                                                                                             13
Video buyers                                                                                                                            24.4                     226.2
Video renters                                                                                                                            8.9                      96.2
PPV                                                                                                                                      2.9                      10.8       14

Source: Kantar Worldpanel.
See notes to Table 14.17.
                                                                                                                                                                             15


                                                                                                                                                                             16


                                                                                                                                                                             17


                                                                                                                                                                             18


                                                                                                                                                                             19


                                                                                                                                                                             20


                                                                                                                                              Chapter 14: Audiences – 117
                                                                                                                                                                             21
14.8 Film audiences by disability
As in the previous five years, disabled people were under-represented among those who paid to watch films.
Pay-per-view was the only market segment in which disabled purchasers came close to their overall population
percentage (Table 14.19). The share of audiences with disabilities across all markets was up from 12% in 2008
to 16% in 2009.

Table 14.19 Disabled audiences aged 12+ for cinema, rental and retail video, PPV, 2009
                                                                                                 Disabled %    Not disabled %

Population aged 12+                                                                                  15.8               84.2
Buyers of cinema, rental, retail and PPV film                                                        12.8               87.2
Cinema-goers                                                                                         12.1               87.9
Video buyers                                                                                         11.5               88.5
Video renters                                                                                        13.8               86.2
PPV buyers                                                                                           14.8               85.2
Source: Kantar Worldpanel.
See notes to Table 14.17.


14.9 Film preferences by nation or region
The national/regional distribution of audiences for most top 20 and top UK films was close to that of the top 20
audience as a whole. Seven titles had unusually high audience shares in particular nations or regions: X-Men Origins:
Wolverine and Slumdog Millionaire in London (Table 14.20), Marley  Me and Planet 51 in the South East (Table
14.21), Last Chance Harvey and Nativity in the Midlands (Table 14.22) and The Hangover in Scotland (Tale 14.23).

Table 14.20 Films with above-average London audience share, 2009 top 20 films and top UK films
	                                                                                                                    London %
Title	                                                                                                 of film’s total audience

X-Men Origins: Wolverine                                                                                                   33
Slumdog Millionaire (UK)                                                                                                   32
London share of top 20 and top UK audience (%)                                                                             23
London percentage of total survey population (%)                                                                           24
Source: CAA Film Monitor.


118 – UK Film Council Statistical Yearbook 2010
1


                                                                                                                                2


Table 14.21 Films with above-average South East audience share, 2009 top 20 films and top UK films                              3
	                                                                                                               South East %
Title	                                                                                               of film’s total audience

Marley  Me                                                                                                              29     4
Planet 51 (UK)                                                                                                           28
South East share of top 20 and top UK audience (%)                                                                       17
                                                                                                                                5
South East percentage of total survey population (%)                                                                     17
Source: CAA Film Monitor.

                                                                                                                                6

Table 14.22 Films with above-average Midlands audience share, 2009 top 20 films and top UK films
	                                                                                                                Midlands %
Title	                                                                                               of film’s total audience   7

Last Chance Harvey (UK)                                                                                                  32
Nativity (UK)                                                                                                            30
                                                                                                                                8
Midlands share of top 20 and top UK audience (%)                                                                         16
Midlands percentage of total survey population (%)                                                                       15
Source: CAA Film Monitor.                                                                                                       9


Table 14.23 Films with above-average Scotland audience share, 2009 top 20 films and top UK films                                10
	                                                                                                                 Scotland %
Title	                                                                                               of film’s total audience

The Hangover                                                                                                             30     11
Scotland share of top 20 and top UK audience (%)                                                                          9
Scotland percentage of total survey population (%)                                                                       10
                                                                                                                                12
Source: CAA Film Monitor.


14.10 Film downloads                                                                                                            13

In 2009, the Cinema Advertising Association (CAA) continued to commission an annual online survey of 3,500 people
who had been to the cinema in the six months prior to the survey. Known as FAME (Film Audience Measurement
                                                                                                                                14
and Evaluation), the survey included questions about film downloads from the Internet.
The age breakdown of respondents who regularly or occasionally watched downloaded or shared films is shown in
Figure 14.2. One in three 15- to 24-year-olds surveyed said they regularly or occasionally watched downloaded/                  15
shared films. This declined to one in four of the 25–34 age group. In total, just 5% of respondents claimed to be
regular viewers of downloaded or shared film files.
                                                                                                                                16


                                                                                                                                17


                                                                                                                                18


                                                                                                                                19


                                                                                                                                20


                                                                                                Chapter 14: Audiences – 119
                                                                                                                                21
Figure 14.2 Frequency of cinema-goers watching downloaded/shared films by age, 2009
%
35.0

30.0

25.0

20.0

15.0

10.0

 5.0

 0.0                                    7–14               15–24                   25–34   35–44    45–54    55+    Total

    % who regularly
    watch downloaded
    or shared films                       2.5                11.3                   10.1      3.5      0.8    0.3     5.1
    % who occasionally
    watch downloaded
    or shared films                       3.9                18.8                   15.2      5.0      4.2    1.2     8.5

Source: FAME 2010.
Note: Figures refer to the cinema-going audience only, not the total population.


A smaller proportion of respondents (4.5%) claimed to be regular viewers of films shared via internet discussion
boards and forums. Again, the most active age category was the 15–24 group followed by the 25–34 group (Figure
14.3).


Figure 14.3 Frequency of cinema-goers watching movies via link on discussion board/forum by age, 2009
%
25.0


20.0


15.0


10.0


 5.0


 0.0                                    7–14               15–24                   25–34   35–44    45–54    55+    Total

    % who regularly
    watch films via link on
    discussion board/forum               3.1                 12.1                    8.0     1.7      0.1    0.1      4.5
    % who occasionally
    watch films via link on
    discussion board/forum               2.6                 11.1                   13.3     3.9      2.3    0.5      6.1

Source: FAME 2010.
See note to Figure 14.2.


120 – UK Film Council Statistical Yearbook 2010
1


                                                                                                                                    2


When respondents were asked about frequency of viewing films downloaded from authorised sources, the figures                        3
drop further to 2% who regularly watch and 6% who occasionally watch, which suggests that a high proportion
of reported film downloading is from illicit sources (Figure 14.4). Again, the most active age groups are the 25–34
range (almost 14% regularly or occasionally watch films downloaded from authorised sources) and 15- to 24-year-
                                                                                                                                    4
olds (13% regularly or occasionally watch).

Figure 14.4 Frequency of cinema-goers watching films downloaded from authorised sources by age, 2009                                5
%
16.0

14.0                                                                                                                                6

12.0

10.0
                                                                                                                                    7
 8.0

 6.0

 4.0                                                                                                                                8

 2.0

 0.0                       7–14            15–24            25–34            35–44            45–54                  55+
                                                                                                                                    9
    % regularly watch       1.4              4.7              3.3              1.5              0.6                    0.3
    % occasionally watch    4.5              8.1             10.4              5.2              4.1                    1.6
                                                                                                                                    10
Source: FAME 2010.
See note to Figure 14.2.


                                                                                                                                    11
14.11 Comparative profiles of cinema audiences and audiences for film on television
Table 14.24 compares the audience profiles for film at the cinema and film on television. Although the gender split
is roughly equal in each case, there is a dramatic difference in the age and social group profiles of the two audiences.            12

The film on television audience is much older (40% over the age of 55) and skewed towards the DE social group and
away from the AB group. The cinema audience is relatively youthful (67% under the age of 35) and skewed towards
the AB and C1 social groups. Given the 3.5 billion size of the audience for film on television (Chapter 11), Table 14.24            13
demonstrates how film reaches all ages and social groups through its successive release windows.

                                                                                                                                    14


                                                                                                                                    15


                                                                                                                                    16


                                                                                                                                    17


                                                                                                                                    18


                                                                                                                                    19


                                                                                                                                    20


                                                                                                      Chapter 14: Audiences – 121
                                                                                                                                    21
Table 14.24 Profile of cinema audience and audience for film on television, 2009
                                                                                                                             Cinema audience     Share of audience for
                                                                                                                                     share %      film on television %

Male                                                                                                                                    50                         49
Female                                                                                                                                  50                         51
Age 7–14 (cinema) and 4–15 (TV)                                                                                                         18                          7
15–24 (cinema) and 16–24 (TV)                                                                                                           31                          8
25–34                                                                                                                                   18                         11
35–44                                                                                                                                   16                         16
45–54                                                                                                                                    9                         18
55+                                                                                                                                      8                         40
AB                                                                                                                                      29                         16
C1                                                                                                                                      34                         24
C2                                                                                                                                      18                         21
DE                                                                                                                                      19                         39
Source: Attentional, CAA Film Monitor, RSU analysis.
Note: Television audience is total viewing occasions and includes those of the five terrestrial TV channels only.


14.12 Cinema-goers’ preferences by age for cinema, DVD and television
Table 14.25 shows the frequency with which cinema-goers visited the cinema as compared with watching television
and videos. The results shown here are based on the FAME 2010 online survey whose respondents had all been
to the cinema in the six months prior to the survey. Just over three-quarters (76%) of respondents watch DVDs or
Blu-rays once a month or more, with 7- to 14-year-olds the heaviest consumers. Television viewing is skewed to an
older audience, with 79% of the over 55s watching 15 hours or more per week.

Table 14.25 Frequency by age of cinema-goers watching DVDs and Blu-ray,
going to the cinema and watching television, 2009
Age                                                                              7–14 %        15–24 %        25–34 %    35–44 %    45–54 %      55+ %        Total %

Watch DVD or Blu-ray once a month or more                                            87             83              77       79         71          59             76
Watch DVD or Blu-ray once a week or more                                             57             50              46       40         29          23             42
Go to cinema once a month or more                                                    54             63              54       36         34          34             47
Go to cinema once a week or more                                                      6             14              12        3          2           3              7
Watch TV 35 hours or more per week                                                   13             23              22       19         16          23             19
Watch TV 15 hours or more per week                                                   69             61              67       70         74          79             69
Source: CAA Film Audience Measurement and Evaluation (FAME) 2010.
Note: The figures in Table 14.25 are based on the online panel survey FAME which represents the UK online population aged 15 or above who had been to the cinema
in the previous six months. Hence, the figures in this table are not the same as those for the whole UK population shown in Table 14.1.


122 – UK Film Council Statistical Yearbook 2010
1


                                                                                                                                                                            2


14.13 Total size of film audience in the UK                                                                                                                                 3

The total size of the film audience in the UK in 2009 was estimated to be 4.5 billion, calculated from all the sources
available (Table 14.27). Television accounted for 75% of the total film audience, followed by video (20%) and cinema
at 4%. Film watching via pay-per-view or other Video on Demand formats represented a small fraction of the total                                                            4
audience in the year (1%). The figures do not include watching film from illicit sources.

                                                                                                                                                                            5
Table 14.26 Estimated total audience for film in the UK, all modes, 2009
                                                                                                                                   Audience size          % of total film
Mode
                                                                                                                                        (million)              audience
                                                                                                                                                                            6
Cinema                                                                                                                                    173                       4
DVD/video                                                                                                                                 930                      20
VoD (including pay-per-view)                                                                                                               41                       1       7
Film on television                                                                                                                      3,402                      75
Total                                                                                                                                   4,546                     100
                                                                                                                                                                            8
Sources: CAA, Rentrak EDI, FAME, Kantar Worldpanel, Screen Digest, Attentional, RSU analysis.
Notes:
‘DVD/video’ includes occasions watching previously-purchased feature film DVD/videos as well as current purchases. The DVD/video estimate is derived from FAME survey
information on the DVD-watching habits of cinema-goers with an additional estimate for the population not covered by FAME.
                                                                                                                                                                            9
‘Film on television’ includes terrestrial, subscription and free-to-air multi-channel.

Taking the total film viewing figure of 4.5 billion occasions and dividing it by an estimated viewing population
(excluding the very young), there were 81 film viewing occasions per person in 2009, an average of just under                                                               10
seven films per month.

                                                                                                                                                                            11


                                                                                                                                                                            12


                                                                                                                                                                            13


                                                                                                                                                                            14


                                                                                                                                                                            15


                                                                                                                                                                            16


                                                                                                                                                                            17


„                                                                                                                                                                           18


 3F
   or more information about top films at the box office in 2009 see Chapter 2 (page 15)
 3F
   or further details about film on video see Chapter 10 (page 80)                                                                                                        19

 3F
   or further information about film on television see Chapter 11 (page 90)
 3F
   or more information about film exhibition regionally see Chapter 9 (page 65)
                                                                                                                                                                            20


                                                                                                                                           Chapter 14: Audiences – 123
                                                                                                                                                                            21
Chapter 15:
Films certified as British 1998 – 2009


To access UK film tax relief,       Facts in focus

a film must be certified as         •  total of 152 UK films (105 in 2008) received final
                                      A
                                      certification as British films in 2009. Of these, 144
‘British’. To qualify as British,     were Schedule 1 films and eight were co-productions.
a film must either pass the         •  he total production budget of finally certified Schedule 1
                                      T
                                      films was £604 million in 2009 (£935 million in 2008).
Cultural Test under Schedule 1
                                    •  here were 149 interim Schedule 1 approvals in
                                      T
of the Films Act 1985, or be          2009, with a total anticipated production budget
certified under one of the            of £1,591 million.

UK’s bilateral co-production        •  he median co-production budget rose over the last
                                      T
                                      decade, while since 2005 that of Schedule 1 films
agreements or the European            dropped to only £1 million.

Convention on Cinematographic
Co-production.
1


                                                                                                                                                   2


15.1 Qualifying as an official British film                                                                                                        3

The Secretary of State for Culture, Media and Sport (DCMS) is responsible for issuing British Film Certificates on
the basis of recommendations made by the UK Film Council’s Certification Unit. Makers of certified British films
can apply for tax relief on qualifying films or apply for Lottery funding from the UK Film Council and other sources.                              4
(There is more information about public investment in film in Chapter 17.)
Schedule 1 films are films certified as British under Schedule 1 of the Films Act 1985. To qualify, films starting
                                                                                                                                                   5
principal photography on or after 1 January 2007 must pass a UK Cultural Test. Points are awarded for UK
elements in the story, setting and characters and for where and by whom the film was made (see the links at the
end of the chapter for details of the Cultural Test). A wide variety of films qualified as British under the Cultural
                                                                                                                                                   6
Test in 2009, from The Dark Knight and Sweeney Todd: The Demon Barber of Fleet Street to The Young Victoria
and The Damned United.
Films can also qualify as British if they are certified under the various official UK co-production agreements.                                    7
Official co-productions must be certified by the competent authorities in each country as meeting the certifying
criteria, which include the creative, artistic, technical and financial input from each co-producer. Once certified,
a film counts as a national film in each of the territories and may qualify for public support on the same basis as
                                                                                                                                                   8
national films in that territory. On the basis of recommendations made by the UK Film Council, the Secretary of
State grants ‘interim approval’ prior to the start of principal photography to those films that meet the criteria and
‘final certification’ once the film has been completed and final documents submitted. British films made as official
                                                                                                                                                   9
co-productions are not required to pass the Cultural Test.
At the end of 2009, the UK had seven active bilateral treaties in place, with Australia, Canada, France, India,
Jamaica, New Zealand and South Africa. Four others were under negotiation in mid-2010. Official UK                                                 10
co-productions can also be certified under the European Convention on Cinematographic Co-production
of which the UK is one of 42 signatories.
                                                                                                                                                   11
15.2 Schedule 1 cultural test certifications, 2008 and 2009
In 2009, a total of 144 films (97 in 2008) were finally certified as British under the Schedule 1 Cultural Test
                                                                                                                                                   12
(Table 15.1). The total budget of finally certified films fell from £935 million to £604 million. This reflects the
smaller number of big budget inward investment films made in 2008 feeding through to a smaller value of final
certifications in 2009. Interim Schedule 1 approvals rose from 122 to 149 with the aggregate budget increasing
                                                                                                                                                   13
from £859 million to £1,591 million. The growth in the number of interim approvals reflects an increase in the
number of very low budget films while the increase in aggregate budget is due to a number of high value inward
investment productions.
                                                                                                                                                   14

Table 15.1 Schedule 1 cultural test certifications, 2008 and 2009
                                                                                 2008                                                     2009     15
Type of certification                                     Number     Budget (£ million)               Number                  Budget (£ million)

Interim approval                                            122               858.8                     149                         1,591.1
                                                                                                                                                   16
Final certification                                          97               935.4                     144                           603.9
Source: DCMS, UK Film Council.

                                                                                                                                                   17


                                                                                                                                                   18


                                                                                                                                                   19


                                                                                                                                                   20


Image: Robin Hood © 2010 Universal Studios. Photo by David Appleby                        Chapter 15: Films certified as British 1998–2009 – 125
                                                                                                                                                   21
15.3 Co-production certifications, 2008 and 2009
In 2009, official co-productions remained at the low level of 2008 with eight final certifications (£48 million) and
19 interim approvals (£102 million). The decline in co-productions from the much higher levels of the early 2000s
has been influenced by the closing of tax loopholes and the redesign of the post-2006 tax relief to relate to UK
spend rather than the total film budget.

Table 15.2 Co-production certifications, 2008 and 2009
                                                                                   2008                                          2009

Type of certification                                   Number         Budget (£ million)            Number          Budget (£ million)

Interim approval                                           16                    108.9                   19                   102.1
Final certification                                         8                     45.2                    8                    48.0
Source: DCMS, UK Film Council.

In 2009, five of the eight final co-production certifications were under the European Convention on Cinematic
Co-production, one was under the UK-Australia agreement, one under the UK-Canada agreement and one under
the UK-South Africa agreement.
Of the 19 interim co-production approvals, 10 were under the European Convention, two were under the UK-New
Zealand agreement, five were under the UK-Canada agreement, one was under the UK-Australia agreement and one
under the UK-South Africa agreement.


15.4 Finally certified British films, 1998–2009
The number of UK films (Schedule 1 and co-productions) receiving final certification rose gradually from 56 in 1998
to a peak of 172 in 2005 (Figure 15.1). The numbers then fell to 105 in 2008 before picking up again to 152 in 2009.
At the peak in 2003–2005 the majority of final certifications were co-productions, but these have since dropped
away to the very low levels of 2008 and 2009.


Figure 15.1 Number of finally certified (Schedule 1 and co-production) UK films, certification years 1998–2009
No. certifications (final)
200


150


100


 50


   0                         98           99       00      01     02        03          04    05   06         07    08          09


  Schedule 1                 40           70      108      75     77        76          72    66    74         98    97        144
  Co-production              16           13       22      41     56        84          99   106    68         56     8           8
  Total                      56          83       130     116    133       160         171   172   142        154   105        152

Source: DCMS, UK Film Council.


126 – UK Film Council Statistical Yearbook 2010
1


                                                                                                                                                                             2


The total production budget of finally certified British films peaked at £1,822 million in 2004 (Figure 15.2).                                                               3
The rise was mainly due to the surge in official UK co-productions in the early 2000s. In 2004/05 a series of cooling
measures designed to restore balance in co-production relations were introduced by the DCMS and Her Majesty’s
Revenue and Customs (HMRC) and in 2007 the basis of tax relief was shifted from total budget to UK spend,
                                                                                                                                                                             4
reducing the incentive to structure films as co-productions as these films generally have lower levels of UK
spend than Schedule 1 films. The value of official co-productions has since fallen back to the pre-2000s level.
                                                                                                                                                                             5

Figure 15.2 Total production budget of finally certified (Schedule 1 and co-production) UK films,
calendar years 1998–2009
Total production budget (£ million)                                                                                                                                          6
2,000


                                                                                                                                                                             7
1,500


1,000                                                                                                                                                                        8


  500
                                                                                                                                                                             9


    0                         98          99          00           01          02           03          04         05          06          07          08          09
                                                                                                                                                                             10
  Schedule 1              232.1        421.5       361.2       538.5        585.4       330.0        643.5      757.7      402.0        561.4       935.4       603.9
  Co-production             59.5        66.3        95.5       277.7        462.2       427.6      1,178.2      877.1      459.5        356.7        45.2        48.0
  Total                   291.6       487.8        456.7       816.1     1,047.5        757.6     1,821.7      1,634.8     861.6       918.1        980.6       651.8        11

Source: DCMS, UK Film Council.
Notes: Total production budget is total budget for Schedule 1 films and total investment for co-productions.
Due to rounding, totals may differ slightly from the sum of the separate rows.                                                                                               12

Figure 15.3 shows the levels of UK spend over the same period. UK spend is generally that part of the production
budget spent in the UK (see notes to Figure 15.3). At its peak in 2005, UK spend reached £1,023 million whereas
in 2009 it was £445 million. Although over half the total production budget was contributed by co-productions                                                                13

at the peak in 2004–2005, the UK spend of co-productions was less than that of the Schedule 1 films. Since then,
their contribution has continued to fall. In 2009, Schedule 1 films accounted for 95% of the UK spend of finally
certified films.                                                                                                                                                             14


                                                                                                                                                                             15


                                                                                                                                                                             16


                                                                                                                                                                             17


                                                                                                                                                                             18


                                                                                                                                                                             19


                                                                                                                                                                             20


                                                                                                                    Chapter 15: Films certified as British 1998–2009 – 127
                                                                                                                                                                             21
Figure 15.3 UK spend of finally certified (Schedule 1 and co-production) UK films, calendar years 1998–2009
UK spend (£ million)
1,200


1,000


  800


  600


  400


  200


    0                         98           99           00            01           02            03             04             05         06         07         08        09


  Schedule 1               151.4       277.7        292.4        459.3         522.5           293.3          560.2          685.4      341.1      442.4      588.5     422.9
  Co-production             22.9         21.6          37.8          88.2      132.2           127.3          442.7          337.4      183.1      123.1       34.0      21.6
  Total                    174.4       299.3        330.3        547.5         654.7       420.6         1,002.9        1,022.8         524.2      565.5      622.5     444.6

Source: DCMS, UK Film Council.
Notes: ‘UK spend’ is the ‘value of the production activities in the UK’ for Schedule 1 films and ‘UK expenditure’ for co-productions (bilateral and European
Convention). UK spend for co-productions may include some expenditure on UK goods and services which took place outside the UK.
Due to rounding, totals may differ slightly from the sum of the separate rows.


UK spend as a percentage of total budget is typically lower for co-productions than for Schedule 1 films (Table 15.3).
The co-production UK spend share is usually around one-third, though it has risen in the last two years as the
number of co-productions has fallen away. The UK spend share of Schedule 1 films has averaged between 63%
and 91% and in 2009 was 70%. Tax relief for British films is based on UK spend up to a maximum of 80% of the
qualifying budget.

Table 15.3 UK spend as % of total production budget, 1998–2009
                                   1998         1999          2000          2001        2002           2003           2004       2005       2006       2007      2008      2009

Schedule 1                         65.2         65.9          81.0      85.3        89.3           88.9          87.1           90.5       84.8      78.8       62.9      70.0
Co-production                      38.5         32.5          39.6      31.8        28.6           29.8          37.6           38.5       39.8      34.5       75.2      45.0
Total                              59.8         61.4          72.3      67.1        62.5           55.5          55.1           62.6       60.8      61.6       63.5      68.2
Source: UK Film Council.


15.5 Median budgets, 1998–2009
Median budgets for final certifications are shown in Figure 15.4. From 1998 to 2005 the median budget for
co-productions was on a rising trend, increasing to £4.9 million. This was followed by a drop in 2006–2008 to
£3.8 million then a steep rise in 2009 to £6.3 million. However, the numbers of co-productions were very low
in 2008 and 2009, so the median is more susceptible to the effect of individual titles.
A decade ago, the median budget of Schedule 1 films was £3 million. This dipped in 2002–2003 to around
£2 million, but then rose to over £3 million in 2004 and 2005. Since then, as the number of Schedule 1 films
has increased, the median budget has fallen steeply to only £1 million.


128 – UK Film Council Statistical Yearbook 2010
1


                                                                                                                                                                                  2


Figure 15.4 Median budget of final certifications, 1998–2009                                                                                                                      3
Median budget (£ million)
7.0

6.0                                                                                                                                                                               4

5.0

4.0                                                                                                                                                                               5

3.0

2.0
                                                                                                                                                                                  6

1.0

 0                      1998        1999        2000         2001         2002             2003          2004          2005        2006        2007         2008         2009
                                                                                                                                                                                  7
      Schedule 1            3.1       2.9         2.8            2.9          2.0           1.8           3.2           3.5         2.0          1.2          1.0          1.0
      Co-production         2.5       3.5         3.3            3.4          4.7           3.6           4.3           4.9         4.4          4.4          3.8          6.3

Source: UK Film Council.
Note: The median is the middle value, ie there are equal numbers of films above and below the median.                                                                             8


15.6 Final certifications by budget band, 2007–2009                                                                                                                               9

Table 15.4 shows that the reason for the decline in the Schedule 1 median budget is the growth in the number
of very low budget (under £2 million) films being certified. This growth has been particularly marked since 2006,
                                                                                                                                                                                  10
suggesting that UK tax relief has become more accessible to low budget filmmakers, following the introduction of
the new rules in 2007. The total number of medium and high budget Schedule 1 films has remained fairly consistent
from year to year over the last decade.
                                                                                                                                                                                  11

Table 15.4 Final Schedule 1 certifications by budget band, 1998–2009
Budget band £ million             1998        1999        2000         2001         2002          2003          2004      2005        2006        2007        2008       2009     12
30                                 2           3          1            3            2             2             5             5        2           3           9          4
10–30                               2           3          3           10           13             3             7             9        7           7           6          7
                                                                                                                                                                                  13
5–10                                5          14         14            7           10             5            13             7        9           9          11          8
2–5                                20          26         43           24           13            25            23            25       21          18           9         24
=2                                11          24         47           31           39            41            24            20       35          61          62        101      14
Total                              40          70        108           75           77            76            72            66       74          98          97        144
Source: DCMS, UK Film Council.
                                                                                                                                                                                  15
Table 15.5 shows the distribution of Schedule 1 budgets by budget band for the years 2007–2009. The 5% of films
with budgets over £30 million accounted for 60.1% of the aggregate budget, while the 66% of films with budgets
under £2 million accounted for only 7% of the aggregate budget. This reflects both the growth in the number of                                                                    16
low budget Schedule 1 films and the big budget inward investment UK/USA titles in the top budget band.

                                                                                                                                                                                  17


                                                                                                                                                                                  18


                                                                                                                                                                                  19


                                                                                                                                                                                  20


                                                                                                                         Chapter 15: Films certified as British 1998–2009 – 129
                                                                                                                                                                                  21
Table 15.5 Final Schedule 1 certifications, budget distribution by budget band, 2007–2009
Budget band                                                                             Total budget
£ million                                                                   Number          £ million          % number          % budget

30                                                                           16            1,261.8               4.7             60.1
10–30                                                                         20              339.5               5.9             16.2
5–10                                                                          28              195.0               8.3              9.3
2–5                                                                           51              158.6              15.0              7.6
=2                                                                          224              145.8              66.1              6.9
Total                                                                        339            2,100.7             100.0            100.0
Source: DCMS, UK Film Council.

For co-productions the pattern is different. The rise and fall in co-production numbers is clear from Table 15.6, which
also shows a disproportionate increase in large budget co-production certifications in 2004–2005. This reflects the
structuring of some large budget UK/USA inward investment films as co-productions at that time, a practice that has
fallen away since the tax rules changed.

Table 15.6 Final co-production certifications by budget band, 1998–2009
Budget band
£ million                          1998       1999     2000   2001   2002     2003   2004      2005     2006       2007   2008      2009

30                                  –             –    –      1      1         –     8          4       2          2       –          –
10–30                                –             2    2      7     14        11    20         15       5          7       2          1
5–10                                 5             2    4      8     12        18    14         32      20         13       1          4
2–5                                  6             6   13     19     21        39    40         39      28         25       4          1
=2                                  5             3    3      6      8        16    17         16      13          9       1          2
Total                               16            13   22     41     56        84    99        106      68         56       8          8
Source: DCMS, UK Film Council.

The budget distribution for co-productions was much more even than for Schedule 1 films, with 81% of films having
budgets between £2 million and £30 million and accounting for 81% of the total budget, as shown in Table 15.7.


130 – UK Film Council Statistical Yearbook 2010
1


                                                                                                                                       2


Table 15.7 Final co-production certifications, budget distribution by budget band, 2007–2009                                           3
Budget band                                                             Total budget
£ million                                                  Number           £ million            % number                 % budget

30                                                            2             67.6                    2.8                    15.0       4
10–30                                                         10            125.9                   13.9                    28.0
5–10                                                          18            133.5                   25.0                    29.7
                                                                                                                                       5
2–5                                                           30            104.3                   41.7                    23.2
=2                                                           12             18.6                   16.7                     4.1
Total                                                         72            449.9                  100.0                   100.0       6
Source: DCMS, UK Film Council.


                                                                                                                                       7


                                                                                                                                       8


                                                                                                                                       9


                                                                                                                                       10


                                                                                                                                       11


                                                                                                                                       12


                                                                                                                                       13


                                                                                                                                       14


                                                                                                                                       15


                                                                                                                                       16


„                                                                                                                                      17

 3
  For more on UK film production, see Chapter 16 (page 132)
 3F
   or more on the UK film economy, see Chapter 20 (page 171)
                                                                                                                                       18
 3F
   or public investment in film in the UK see Chapter 17 (page 143)
 3F
   or quarterly updates on British film certification data, see www.ukfilmcouncil.org.uk/ukfilms
 3F
   or more information about British films, tax relief and the Cultural Test,
   see www.ukfilmcouncil.org.uk/qualifying                                                                                             19

 3F
   or more information on the European Convention on Cinematographic Co-production, see the Council of
   Europe website: http://conventions.coe.int (number 147 under the full list of treaties)
                                                                                                                                       20


                                                                              Chapter 15: Films certified as British 1998–2009 – 131
                                                                                                                                       21
Chapter 16:
Film production in 2009


2009 saw a substantial        Facts in focus

increase in production in     •  otal UK production activity in 2009 was £957 million,
                                T
                                compared with £613 million in 2008.
the UK, driven by a record    •  he UK spend associated with inward investment
                                T
level of inward investment.     features was £753 million, the highest yet recorded,
                                up 111% from £357 million in 2008.
However, the UK independent
                              •  here were 71 UK domestic features (77 in 2008)
                                T
sector remained under           and 22 co-productions (22 in 2008).
pressure, with the median     •  he median budget for UK domestic features was
                                T
budget of UK domestic films     £1.5 million, compared with £1.7 million in 2008
                                and £2.9 million in 2003.
falling to £1.5 million.      •  hirteen big budget films accounted for 69% of the
                                T
                                total UK production spend in 2009.
                              •  S studios were involved with 26 productions in the
                                U
                                UK in 2009, accounting for 76% of total UK spend.
1


                                                                                                                                                                                2


16.1 The value of UK production in 2009                                                                                                                                         3

UK production activity grew by 56% in 2009 to £956.9 million, from £613 million in 2008. The increase was due
to the surge in inward investment, which was encouraged by the decline in the pound-dollar exchange rate, the
bedding-in of the UK film tax relief and the resolution of the writers’ and actors’ disputes in the USA.                                                                        4

There were 32 inward investment productions in 2009, with a UK production value of £752.7 million (see Table 16.1
for definitions). Some of the big budget films contributing to this figure were Harry Potter and the Deathly Hallows
                                                                                                                                                                                5
Part I, Robin Hood, Gulliver’s Travels, Clash of the Titans, The Chronicles of Narnia: The Voyage of the Dawn Treader,
Your Highness, Inception, London Boulevard and Gnomeo and Juliet.
There were 71 UK domestic features in 2009, down slightly from 77 in 2008, with a UK production value of                                                                        6
£169.2 million which was 18% down from the 2008 figure. Domestic UK titles in 2009 included Nanny McPhee
and the Big Bang, Centurion, Blitz, Tamara Drewe, St Trinian’s 2: The Legend of Fritton’s Gold, It’s a Wonderful
Afterlife and Nowhere Boy.                                                                                                                                                      7
Co-productions remained steady at 22 with their UK spend falling from £48.9 million to £35 million. This continues
the downward trend established in 2005 and reflects a tightening of co-production qualification rules and the effect
of the new UK film tax relief, which applies to UK spend rather than the total budget of a film. Co-productions in                                                              8
2009 included Mr Nice, Route Irish, The Ghost (aka The Ghost Writer), Neds and Tracker.

Table 16.1 Feature film production activity, 2008 and 2009                                                                                                                      9

                                                                                           Number of                     Value              Number of                  Value
                                                                                          productions                 £ million            productions              £ million
                                                                                                2008                     2008                    2009                  2009     10
Inward investment feature films                                                                  27                   356.8                       32                752.7
Domestic UK feature films                                                                        77                   207.2                       71                169.2
                                                                                                                                                                                11
Co-productions                                                                                   22                    48.9                       22                 35.0
Total                                                                                           126                   613.0                      125                956.9
Source: UK Film Council.                                                                                                                                                        12
Notes:
Numbers have been revised on the basis of new information received since the publication of the 2009 Statistical Yearbook.
Inward investment includes nine films in 2008 (£17.7 million) and nine films in 2009 (£36.8 million) that involved only visual effects (VFX) work in the UK.
Inward investment feature films include three non-USA films in 2008 and three non-USA films in 2009.
                                                                                                                                                                                13
Definitions:
An inward feature is defined as a feature film which is substantially financed and controlled from outside the UK and where the production is attracted to the UK because
of script requirements, the UK’s infrastructure or UK tax incentives.
An inward feature co-production is an official co-production that originates from outside the co-production treaty countries (usually from the USA) and which is attracted      14
to the UK because of script requirements, the UK’s infrastructure or UK tax relief. None were made in 2008 and 2009.
A domestic (indigenous) UK feature is a feature made by a UK production company that is produced wholly or partly in the UK.
A co-production is a production (other than an inward co-production) involving various country partners usually under the terms of a bilateral co-production agreement
or the European Convention on Cinematographic Co-production.                                                                                                                    15

Measurement:
The above numbers include only the UK spend associated with productions shot or post-produced in whole or in part in the UK.
Spend is allocated to the year in which principal photography started or to the year in which the visual effects were undertaken in the case of VFX-only films.                 16

Exclusions:
Spending on films with budgets under £500,000 is not included.
                                                                                                                                                                                17


                                                                                                                                                                                18


                                                                                                                                                                                19


                                                                                                                                                                                20


Image: Nanny McPhee and the Big Bang © 2010 Universal Studios.                                                                     Chapter 16: Film production in 2009 – 133
ALL RIGHTS RESERVED. Photo by Liam Daniel                                                                                                                                       21
16.2 Inward, domestic and co-production features, 1994–2009
Figure 16.1 puts the 2009 figures in a longer time perspective. The decline in domestic features between 1997
and 2004 occurred alongside a substantial growth in co-production activity, suggesting it was easier at that time
to make films as official co-productions than as stand-alone UK productions. From 2005 to 2008 this trend was
reversed, reflecting a tightening in co-production certification requirements followed by the introduction of the
new UK film production tax relief based on UK spend rather than the whole production budget of the film.
Minority co-productions saw the greatest reduction.
After a decline from the peak of 2003 the total number of films has levelled out at around 125 per year, but
domestic UK productions have grown as a proportion of the total. Production numbers continued at the higher
level achieved after the introduction of tax relief and Lottery support for film in the mid–1990s.

Figure 16.1 Number of inward, domestic, co-production and total features, 1994–2009
Number of features
200


150


100


 50


  0                               94       95       96      97       98       99       00       01      02       03       04       05       06      07       08    09


  Inward                          13       14       25      20       16       22       28       23      16       45       28       48       28      29       27    32
  Domestic                        33       34       73      84       67       70       52       51      37       45       41       51       55      70       77    71
  Co-production                    –        –        –        –        –       –        –        –      66      106      105       65       51      28       22    22
  Of which…                        –        –        –        –        –       –        –        –        –      23       23       12       18      15       10     5
     majority and parity
     co-production
      minority                     –        –        –        –        –       –        –        –        –      83       82       53       33      13       12    17
      co-production
  Total                           46       48      98      104       83       92       80      74      119      196     174      164      134      127      126   125

Source: UK Film Council.
Notes:
Inward features include inward investment co-productions from 2002 and a small number of visual effects (VFX) only titles from 2007.
UK co-productions not available by shoot date prior to 2002.
Data for 2003–2008 updated since publication of the 2009 Yearbook.
Inward investment includes a spike in the number of non-USA (mainly Indian) inward investment films in 2005.
Majority co-production means a co-production in which the UK investment is the largest single national investment (not necessarily an absolute majority).
Parity co-production means a co-production in which the UK and at least one other country contributed equal largest investments.
Minority co-production means a co-production in which at least one other country made a larger investment than the UK.
Data for films with budgets greater than or equal to £500,000.


Table 16.2 distinguishes independent UK films from UK/USA studio films and non-UK films made partly or wholly in
the UK. In 2009, UK independent films were 75.2% of the total while UK films as a whole were 88%. In recent years
the share of UK independent films in the total has been as high as 89% (2004). The number of non-UK films
increased in 2008 and 2009, mainly as a result of an increase in VFX-only titles tracked. VFX-only titles are usually big
budget USA studio films which contract part of their visual effects to UK-based VFX companies. The number of UK
independent films with budgets greater than or equal to £500,000 has declined since 2003, reflecting the tougher
economic environment for independent production.


134 – UK Film Council Statistical Yearbook 2010
1


                                                                                                                                                                                 2


Table 16.2 Numbers of UK/USA studio and independent UK films, 2003–2009                                                                                                          3
                                                                   2003            2004            2005             2006              2007             2008               2009

UK/USA studio films                                             27                 14              15               21               17                13                 16
                                                                                                                                                                                 4
UK independent films                                           162                155             144              108              103               100                 94
Non-UK films                                                      7                  5               5                5                7               13                 15
Total                                                          196                174             164              134              127               126                125     5
% UK independent films                                         82.7               89.1            87.8             80.6             81.1              79.4               75.2
Source: UK Film Council.
Notes:                                                                                                                                                                           6
A UK/USA studio film is a UK film produced by or in association with one of the major US studios or one of the major US studios’ specialist production subsidiaries.
A UK independent film is a UK film made by an independent production company or group of independent production companies.
Data for films with budgets greater than or equal to £500,000.
                                                                                                                                                                                 7
The value of UK production in 2009 increased by 56% compared with 2008, making 2009 the second highest
production year on record after 2003 (Figure 16.2). The value of inward investment, at £753 million, was the highest
yet tracked. In 2009, inward investment accounted for 78.7% of UK spend demonstrating the importance of inward                                                                   8
investment to the UK film economy. Since 1997, the fluctuation in production value has principally been driven by
fluctuations in inward investment. In contrast, the combined UK spend of co-productions and UK domestic films
declined from £386 million in 2003 to £204 million in 2009, reflecting tougher economic conditions and changing
                                                                                                                                                                                 9
arrangements for film tax relief. The majority of the fall is due to the decline in co-productions, the UK spend of
which has fallen from £169 million in 2004 to £35 million in 2009.
                                                                                                                                                                                 10
Figure 16.2 Value of UK spend of inward, domestic, co-production and total features, 1994–2009
Value of UK spend £ million
1,200
                                                                                                                                                                                 11

1,000


  800                                                                                                                                                                            12


  600

                                                                                                                                                                                 13
  400


  200
                                                                                                                                                                                 14
    0                             94       95       96       97           98     99       00     01       02      03       04       05        06      07       08        09


  Inward                       182.7    216.5    387.1    261.9     214.2      336.4   366.6   198.5   265.9   732.9    583.8    306.5    558.7     595.1   356.8      752.7     15
  Domestic                      59.5     94.0    172.2    202.9     175.0      170.3   211.7   180.1   156.4   227.8    126.8    178.7    157.5     155.4   207.2      169.2
  Co-production                     –        –        –        –           –       –       –       –   128.2   158.3    169.2     97.3    109.2      74.1     48.9      35.0
  Of which…                         –        –        –        –           –       –       –       –       –    62.1     55.1     34.6       66.1    51.2     32.7      12.8     16
     majority and parity
     co-production
      minority                      –        –        –        –           –       –       –       –       –    96.2    114.2     62.6       43.1    22.9     16.2      22.2
      co-production                                                                                                                                                              17
  Total                        242.2    310.5    559.3    464.8     389.2      506.7   578.3   378.6   550.5 1,119.0    879.8    582.5    825.4     824.6   612.9      956.9

Source: UK Film Council.
See notes to Figure 16.1.                                                                                                                                                        18

Table 16.3 shows the split between UK/USA studio films, UK independent films and non-UK films. Over the period
as a whole UK independent films accounted for one-third of the UK spend with UK/USA studio films making up most
                                                                                                                                                                                 19
of the rest. In 2009, the UK spend of UK independent films was lower than average at 24% of the total, due to the
surge in studio films.
                                                                                                                                                                                 20


                                                                                                                                  Chapter 16: Film production in 2009 – 135
                                                                                                                                                                                 21
Table 16.3 Value of UK spend of UK/USA studio and independent UK films, 2003–2009, £ million
                                                     2003          2004            2005          2006              2007          2008              2009

UK/USA studio films                            750.0             558.4         236.2          588.6              557.3        348.5              689.7
UK independent films                           352.2             315.3         341.9          222.6              249.2        241.3              226.2
Non-UK films                                    16.9               6.2           4.3           14.2               18.0         23.2               41.0
Total                                        1,119.0             879.8         582.4          825.4              824.5        613.0              956.9
% UK independent films                          32.1              35.8          58.7           27.0               30.2         39.4               23.6
Source: UK Film Council.
See notes to Table 16.2.

The competitiveness of the UK as a destination for internationally mobile film production is significantly affected
by the UK pound-US dollar exchange rate. When the value of the pound in US dollars increases, film production in
the UK becomes more expensive and US producers may choose to stay at home or go to countries where costs and
exchange rates are more favourable. Conversely, if the value of the pound falls, the UK becomes more competitive.
Figure 16.3 shows the high value of the pound in 2007, peaking at a monthly average of $2.07 in November 2007.
The last time the dollar-pound rate was at or above $2.07 was in May 1981. The pound began depreciating
significantly from August 2008, bottoming out at $1.42 in March 2009, before recovering to $1.65 in August 2009.
In January 2010 the rate was $1.61. The average dollar-pound rate for the 30-year period 1980 to 2009 was $1.67.

Figure 16.3 Value of £ sterling in US dollars, 2007–2009
US$
2.5


2.0


1.5


1.0


0.5


0.0                 Jan-07      Apr-07      Jul-07      Oct-07   Jan-08   Apr-08     Jul-08   Oct-08    Jan-09     Apr-09   Jul-09      Oct-09    Jan-10
      £ Sterling in US$

Source: Bank of England.


136 – UK Film Council Statistical Yearbook 2010
1


                                                                                                                                                                               2


16.3 Productions by genre, 2007–2009                                                                                                                                           3

Table 16.4 shows a breakdown of production by genre for the years 2007–2009. Production in the UK is reasonably
well spread across genres and does not appear to be as over-concentrated on drama as sometimes supposed. Drama
accounted for 23% of the films, but only 7% of the budget. Comedy accounted for 19% of the films and 16% of the                                                                4
budget. The biggest spending genres were action, fantasy, comedy and adventure. After drama and comedy, the
most numerous genres were thrillers (9%) and action (8%).
                                                                                                                                                                               5

Table 16.4 Genre of production in the UK, 2007–2009
                                                                                                           Budget                              UK spend
Genre                                                       Number of films          % of total           £ million        % of total           £ million         % of total   6

Action                                                                 30               7.9            1,201.8                28.0             555.4                23.2
Adventure                                                               5               1.3              316.1                 7.4             257.3                10.7       7
Animation                                                               8               2.1              161.0                 3.7              83.3                 3.5
Biopic                                                                 20               5.3              114.9                 2.7              68.0                 2.8
Comedy                                                                 71              18.8              686.3                16.0             343.6                14.4       8

Crime                                                                  16               4.2               63.7                 1.5              52.9                 2.2
Documentary                                                            23               6.1               44.4                 1.0              23.2                 1.0
                                                                                                                                                                               9
Drama                                                                  88              23.3              286.7                 6.7             193.0                 8.1
Family                                                                  3               0.8                6.6                 0.2               6.0                 0.2
Fantasy                                                                11               2.9              625.3                14.6             386.0                16.1       10

Horror                                                                 24               6.3              118.6                 2.8             104.3                 4.4
Musical                                                                 7               1.9              121.7                 2.8              99.2                 4.1
                                                                                                                                                                               11
Romance                                                                23               6.1               86.6                 2.0              56.9                 2.4
Sci-fi                                                                  7               1.9              226.6                 5.3              48.8                 2.0
Thriller                                                               34               9.0              159.6                 3.7              68.2                 2.8       12

War                                                                     5               1.3               66.8                 1.6              45.5                 1.9
Other                                                                   3               0.8               10.7                 0.2               3.0                 0.1
                                                                                                                                                                               13
Total                                                                 378             100.0            4,297.6               100.0           2,394.4               100.0
Source: UK Film Council.
Notes:
The data have been presented for a three-year period to show as many genres as possible without disclosing the budgets of individual films. The category ‘other’ contains      14
mystery and war films, grouped because of their low numbers.
Percentages may not sum to 100.0 due to rounding.

                                                                                                                                                                               15
Looking at UK independent films alone (Table 16.5) the situation is somewhat different. The top three genres in
terms of numbers and budget were drama, comedy and thrillers. Drama accounted for 26% of the films and 22%
of the budget, but there was a reasonable representation of the minor genres, for example romance (7% of the
films, 8% of the budget), documentaries (7% of the films, 3% of the budget) and biopics (6% of the films, 8%                                                                   16
of the budget).

                                                                                                                                                                               17


                                                                                                                                                                               18


                                                                                                                                                                               19


                                                                                                                                                                               20


                                                                                                                                Chapter 16: Film production in 2009 – 137
                                                                                                                                                                               21
Table 16.5 Independent UK productions by genre, 2007–2009
                                                                                                          Budget                             UK spend
Genre                                                       Number of films         % of total           £ million          % of total        £ million         % of total

Action                                                                  11              3.7                56.2                5.5             33.3                4.6
Adventure                                                                3              1.0                22.8                2.2              7.2                1.0
Animation                                                                4              1.3                31.3                3.1             14.7                2.1
Biopic                                                                  18              6.1                80.2                7.8             58.4                8.1
Comedy                                                                  52             17.5               168.6               16.4            134.5               18.8
Crime                                                                   15              5.1                56.5                5.5             46.4                6.5
Documentary                                                             20              6.7                30.3                3.0             19.2                2.7
Drama                                                                   77             25.9               227.8               22.2            168.8               23.6
Family                                                                   3              1.0                 6.6                0.6              6.0                0.8
Fantasy                                                                  5              1.7                36.3                3.5             23.2                3.2
Horror                                                                  22              7.4                35.7                3.5             28.8                4.0
Musical                                                                  5              1.7                49.2                4.8             39.6                5.5
Romance                                                                 22              7.4                84.1                8.2             56.3                7.8
Thriller                                                                31             10.4                97.2                9.5             57.1                8.0
War                                                                      4              1.3                26.5                2.6             15.7                2.2
Other                                                                    5              1.7                15.8                1.5              7.6                1.1
Total                                                                  297            100.0             1,025.1              100.0            716.7              100.0
Source: UK Film Council.
Notes:
The category ‘other’ contains western, mystery and science fiction.
Percentages may not sum to 100.0 due to rounding.


16.4 Budget trends
The median budget of domestic UK features fell in 2009 to £1.5 million and is now only half the level it was in
2003 (£2.9 million). The co-production median also fell in 2009, to £2.6 million, though it had been stable in 2008.
In contrast, the median budget of inward investment features continued to rise, reaching £25 million in 2009.
This reflects the continuing upward movement in the budgets of US studio films, notwithstanding reports
of financial challenges facing Hollywood.

Table 16.6 Median feature film budgets £ million, 2003–2009
Production category                                             2003           2004              2005                2006           2007           2008             2009

Inward investment features                                     11.5             8.6              3.9*            18.6              10.3           23.1             25.0
Domestic UK productions                                         2.9             2.3              2.0              1.9               1.3            1.7              1.5
Co-productions                                                  3.3             4.0              4.2              4.0               3.7            3.6              2.6
Source: UK Film Council.
Notes:
Median budget is the middle value (ie there are equal numbers of films above and below the median). The median in this case is a better measure of central tendency than
the average as it avoids the upward skew of a small number of high budget productions.
Data for 2003–2008 updated since publication of the 2009 Yearbook.
*In 2005 there was an unusually high number of inward features from India (28), reducing the median budget for that year.


138 – UK Film Council Statistical Yearbook 2010
1


                                                                                                                                                     2


16.5 Size distribution of budgets                                Table 16.8 Size distribution of budgets, domestic UK                                3
                                                                 features, 2009
The budget size distribution for the three main
                                                                                                                             Total
categories of films made in 2009 is shown in Tables 16.7                                                                   budget               %
to 16.9. Thirteen features with budgets over £30 million                                                                  in band         of total   4
                                                                 Budget band                            Number         (£ million)        budget
accounted for 84% of the total budget for inward
investment features. Only four of 32 inward features             £5 million                                13          111.7             54.1
had budgets between £0.5 million and £5 million.                 £2–£5 million                              14           45.8             22.2       5

                                                                 £0.5–£2 million                            44           48.8             23.7
Table 16.7 Size distribution of budgets, inward                  Total                                      71          206.3            100.0
                                                                                                                                                     6
investment features, 2009
                                                                 Source: UK Film Council.
                                              Total              Note: There was one film with a budget above £10 million which is not shown
                                            budget          %    separately as the data would be disclosive.
                                           in band    of total                                                                                       7
Budget band                  Number     (£ million)   budget
                                                                 Co-production budgets tend to be more evenly
£30 million                    13     1,261.4         84.2      distributed than those of inward and domestic films,
£10–£30 million                 10       187.7         12.5      as shown in Table 16.9. The nine co-productions with                                8
£5–£10 million                   5        39.6          2.6      budgets in the £2–£5 million band accounted for 32%
                                                                 of the total budget. There was only one co-production
£0.5–£5 million                  4         9.9          0.7      with a budget above £10 million (not shown separately),                             9
Total                           32     1,498.6        100.0      while eight out of 22 had budgets between £0.5 million
Source: UK Film Council.                                         and £2 million, accounting for 10% of the total budget.
                                                                                                                                                     10
In contrast, the majority of domestic UK features
(44 out of 71) had budgets under £2 million (Table 16.8).        Table 16.9 Size distribution of budgets,
There was a rise in the number of domestic features              co-productions, 2009
with budgets above £5 million to 13 in 2009 compared                                                                         Total                   11
                                                                                                                           budget               %
with six in 2008. However, the combined budget of                                                                         in band         of total
these 13 films (£111.7 million) was no greater than the          Budget band                            Number         (£ million)        budget
combined budget of the six in 2008 (£111.8 million).             £5 million                                 5            54.1            58.0       12
(See 2009 Statistical Yearbook for details.)
                                                                 £2–£5 million                               9            29.8            32.0
                                                                 £0.5–£2 million                             8             9.4            10.0
                                                                                                                                                     13
                                                                 Total                                      22            93.3           100.0
                                                                 Source: UK Film Council.
                                                                                                                                                     14


                                                                                                                                                     15


                                                                                                                                                     16


                                                                                                                                                     17


                                                                                                                                                     18


                                                                                                                                                     19


                                                                                                                                                     20


                                                                                                        Chapter 16: Film production in 2009 – 139
                                                                                                                                                     21
16.6 Big budget productions, 2007–2009
The importance to UK spend of a small number of big budget productions – usually inward investment films –
is demonstrated in Table 16.10. In 2009, the 13 films with budgets greater than £30 million accounted for 68.9%
of UK production spend.

Table 16.10 Big budget films’ contribution to UK spend, 2007–2009
                                                                                              2007        2008        2009

Number of films with budgets £30 million                                                       8          11          13
Value of associated UK spend (£ million)                                                    475.1       341.8       659.2
Total UK spend (£ million)                                                                  824.5       613.0       956.9
Big budget film share of UK spend                                                          57.6%       55.8%       68.9%
Source: UK Film Council.
Note: Data for 2007–2008 updated since publication of 2009 Statistical Yearbook.


16.7 UK spend as percentage of total production budget
Table 16.11 shows UK spend as a percentage of production budget for inward investment films, domestic UK
productions and co-productions. Domestic UK productions had the highest UK spend percentage in 2009 (82.0%),
followed by inward investment films at 70.0%. Co-productions had the lowest UK spend percentage (37.5%) though
this was significantly higher than the 30% prevailing in 2003–2004, reflecting a fall in the number of low-UK-spend
co-productions after the introduction of the new film tax relief. The UK spend percentage for inward investment
films has fallen moderately. In 2003–2004 it was 75.5%, reflecting the requirement for a minimum 70% UK spend in
the pre-2007 criteria for tax relief. Under the new rules, films can qualify for UK tax relief providing they pass the UK
Cultural Test and have a minimum UK spend of 25% of the qualifying budget (and meet certain other criteria
specified in the regulations).

Table 16.11 UK spend as percentage of total production budget, 2007–2009
Production category                                                                           2007        2008        2009

Inward investment films                                                                      64.5        65.2        70.0
Domestic UK productions                                                                      84.0        84.6        82.0
Co-productions                                                                               47.5        43.7        37.5
Source: UK Film Council.
Notes:
Data for 2007–2008 updated since publication of 2009 Yearbook.
VFX-only films not included in ‘Inward investment films’.


140 – UK Film Council Statistical Yearbook 2010
1


                                                                                                                                                      2


16.8 UK domestic productions by territory                                    Table 16.13 UK domestic productions, shoots by                           3
of shoot                                                                     territory or region, 2009
                                                                             Territory of shoot                                   Number of shoots
Table 16.12 analyses UK domestic productions in 2009
according to whether they were wholly or partially shot                      UK                                                                67     4
in the UK, or wholly shot abroad. The majority (52 out                       USA                                                                7
of 71) were shot exclusively in the UK, while 14 films
                                                                             India                                                              3
were shot partly abroad. Five UK domestic films were                                                                                                  5
shot wholly abroad. The non-UK spend as a proportion                         Other Africa                                                       3
of budget (18.0%) was higher than in 2008.                                   Isle of Man                                                        2
                                                                             South Africa                                                       2     6

Table 16.12 UK domestic productions by territory                             Germany                                                            2
of shoot, 2009                                                               Other                                                              7
                                                                                                                                                      7
                                                                  Non-UK     Total shoots                                                      93
                                                                   spend
                                                      Non-UK         as %    Source: UK Film Council.
                           Number        Budget         spend     of total
Shooting in                of films   (£ million)   (£ million)   budget                                                                              8

UK only                        52      152.6           11.6         7.6      16.9 Co-productions by territory of shoot
UK and other                   14       32.5            7.2        22.2
                                                                             In contrast to UK domestic productions, co-productions                   9
Other only                      5       21.3           18.4        86.5      were usually shot partly or wholly abroad, as Table
Total UK                                                                     16.14 shows. Only two out of 22 films, with a total
domestic films                 71      206.3           37.2        18.0      budget of £5.6 million, were shot wholly in the UK.                      10
Source: UK Film Council.                                                     Non-UK spend accounted for 62.5% of the total
                                                                             budget of co-productions in 2009.
Table 16.13 shows the number of shoots by territory
                                                                                                                                                      11
for UK domestic films. Because some films were shot in
                                                                             Table 16.14 Co-productions by territory of shoot, 2009
two or more territories, the total number of shoots was
greater than the total number of films. Compared to                                                                                        Non-UK
                                                                                                                                            spend     12
2008, the range of countries and number of non-UK                                                                              Non-UK         as %
shoots was larger. There were seven shoots in the USA,                                                  Number      Budget       spend     of total
                                                                             Shooting in                of films (£ million) (£ million)   budget
three in India, three in ‘Other Africa’ and two each in
the Isle of Man, South Africa and Germany.                                   UK only                         2        5.6         0.6       10.0      13

                                                                             UK and other                   11       57.2        35.2       61.5
                                                                             Other only                      9       30.4        22.5       73.8
                                                                                                                                                      14
                                                                             Total co-productions           22       93.3        58.2       62.5
                                                                             Source: UK Film Council.

                                                                                                                                                      15
                                                                             The country distribution of co-production shoots is
                                                                             shown in Table 16.15. The majority of shoots were in
                                                                             the UK or elsewhere in Europe. Of the non-European
                                                                                                                                                      16
                                                                             shoots, three were in India, two in New Zealand, two
                                                                             in Thailand and four elsewhere in the world.

                                                                                                                                                      17


                                                                                                                                                      18


                                                                                                                                                      19


                                                                                                                                                      20


                                                                                                          Chapter 16: Film production in 2009 – 141
                                                                                                                                                      21
Chapter 1:
Table 16.15 Co-productions, shoots by territory or
region, 2009
                                                                                        Table 16.16 Film production company activity, 2009
                                                                                        Number of features


The box office
                                                                                        per company                                                 Number of companies
Territory of shoot                                                 Number of shoots

UK                                                                               13     4                                                                              2
Other Europe                                                                      6     3                                                                              1
India                                                                             3     2                                                                             11
Bulgaria                                                                          2     1                                                                            199
Ireland                                                                           2     Total                                                                        213
New Zealand                                                                       2     Source: UK Film Council.
                                                                                        Notes:
Spain                                                                             2     Includes all production categories.
                                                                                        Further information on film production companies in the UK can be found in
Thailand                                                                          2     Chapter 19.
Other                                                                             4     Films frequently have several production companies associated with them (including
                                                                                        special purpose vehicle subsidiaries of parent companies), so the sum of (number
Total shoots                                                                     36     of features) x (number of companies) is substantially greater than the total number
                                                                                        of features involving the UK in 2009.
Source: UK Film Council.
Note: The majority of co-productions were shot in at least two territories. Hence the
total in Table 16.15 is more than the number of co-productions in 2009.
                                                                                        16.11 US studios’ involvement in film
                                                                                        production in the UK
16.10 Production company activity levels                                                The US studios were involved in the production of
UK film production in 2009 was, as usual, dispersed                                     26 films in the UK in 2009, nine of which were VFX-only
among a large number of production companies, as                                        (Table 16.17) accounting for £728.5 million in UK spend,
shown in Table 16.16. The UK Film Council recorded 213                                  76% of total UK spend.
production companies associated with films shot in the
UK or co-productions involving the UK in 2009. Of these,
                                                                                        Table 16.17 US studios’ involvement in film
199 companies were associated with a single feature.
                                                                                        production in the UK, 2009
These were a mixture of distinct production companies
and special purpose vehicles (that is, companies set up                                 Studio                                                            Number of films

to make a single film). The most prolific production                                    Universal                                                                       8
companies (Black and Blue Films and Film  Music                                        Walt Disney                                                                     6
Entertainment) were associated with four features each,
                                                                                        20th Century Fox                                                                5
followed by one company with three films (Matador
Pictures) and 11 companies with two films each.                                         Warner Bros                                                                     4
                                                                                        Columbia Pictures                                                               2
                                                                                        Sony                                                                            1
                                                                                        Total films                                                                    26
                                                                                        Source: UK Film Council.
                                                                                        Note: Nine of the above films involved only VFX in the UK. Two were UK domestic
                                                                                        films produced by Working Title under its output deal with Universal.


„
 3I
  nformation about film companies is given in Chapter 19 (page 161)
 3F
   or details about employment in the film production sector see Chapter 21 (page 182)
 3
  For more information about the UK film economy see Chapter 20 (page 171)
 3F
   or information on film production in the UK prior to 1992, see earlier editions of this Yearbook and the
   annual Film and Television Handbooks published by the British Film Institute or the Information Briefings
   on the BFI’s website – www.bfi.org.uk


142 – UK Film Council Statistical Yearbook 2010
Chapter 17:
Public investment in film in the UK


The UK Government provides           Facts in focus

financial support to film in         •  otal measured public funding for film in the financial
                                       T
                                       year 2008/09 was £256 million.
the UK through a variety of          •  he principal sources of public funding for UK film
                                       T
channels. This recognises              in 2008/09 were the film production tax relief, National
                                       Lottery and grant-in-aid from central government,
the value of film, both culturally     particularly via the Department for Culture, Media
and economically. Additional           and Sport.

funding comes from EU                •  he European Union provided £8.5 million in 2008/09.
                                       T

sources. The single biggest          •  er Majesty’s Revenue and Customs (HMRC) and the UK
                                       H
                                       Film Council were responsible for the largest gross spend
source of public funding in            (£110 million and £74.5 million respectively).

2008/09 was film tax relief,         •  ilm production took 56% of the total financial support,
                                       F
                                       but distribution and exhibition, training and skills,
followed by Lottery funding            education, and archives and heritage also received
and DCMS grant-in-aid.                 substantial allocations.
17.1 Public funding for film in the UK by source
Public funding for film in the UK comes from a number of UK Government, public sector and European sources,
including:
•	 The Department for Culture, Media and Sport (DCMS);
•	 Other central government departments;
•	 The governments of Scotland, Wales and Northern Ireland;
•	 The National Lottery;
•	 Her Majesty’s Revenue and Customs (HMRC);
•	 BBC Films;
•	 Film4;
•	 The European Union.
Public funding for film identified in Table 17.1 is estimated to have been £256 million in the financial year 2008/09,
slightly down on the £261 million in 2007/08. As in 2007/08, the estimate does not include some local authority,
research council, higher or further education funding, as indicated in the notes to Table 17.1.
The largest single source of public funding was the UK film tax relief, which provided £110 million in 2008/09, 43%
of the total. The second-largest source was the National Lottery (£45.9 million, 18% of the total) and the third-largest
was the DCMS grant-in-aid to the UK Film Council and National Film and Television School (£31.2 million, 12% of the
total). The National and Regional Development Agencies provided £17.1 million, BBC Films £12.7 million and Film4
£8.2 million. The European Union contributed £8.5 million, of which £3.9 million (£11.5 million in 2007/08) came
from the MEDIA Programme.


144 – UK Film Council Statistical Yearbook 2010                                               Image: Centurion courtesy of Pathé UK
1


                                                                                                                                             2


Table 17.1 Public funding for film in the UK by source, 2008/09                                                                              3
                                                     Amount            %
Source                                               £ million   of total   Notes

National Lottery Distribution Fund (DCMS) – Film       45.9      17.9       National Lottery allocations to the UK Film                      4
                                                                            Council, Scottish Screen and Northern Ireland
                                                                            Screen, plus Heritage Lottery Fund(1)
DCMS grant-in-aid to the                               31.2      12.2       Awards to the UK Film Council (of which                          5
UK Film Council and NFTS                                                    £17.4 million was awarded to the BFI) and
                                                                            National Film and Television School
National and Regional                                  17.1        6.7      Contributions to the National and Regional                       6
Development Agencies                                                        Screen Agencies
BBC Films                                              12.7        4.9      BBC Films’ production investment and
                                                                            contributions by the BBC to NFTS and N/RSA                       7
                                                                            projects – excludes acquisitions etc made by
                                                                            other BBC departments
Film4                                                    8.2       3.2      Film4 (Channel 4’s film production company)                      8
                                                                            investment in film development and
                                                                            production plus Channel 4 investment in
                                                                            NFTS and N/RSA projects                                          9

Department for Children, Schools and Families            6.8       2.7      DCSF investment in Mediabox and FILMCLUB.
                                                                            Match funding in individual FILMCLUB or
                                                                            Mediabox projects (and other First Light                         10
                                                                            projects) is not collated
Other European Union                                     4.6       1.8      European Regional Development Fund and
                                                                            European Social Fund                                             11

Scottish Government                                      4.3       1.7      Includes spend from all Scottish government
                                                                            agencies into strategic bodies/projects
                                                                                                                                             12
EU MEDIA Programme                                       3.9       1.5      European Union MEDIA Programme(2)
Higher Education Funding Council                         3.1       1.2      HEFC investment in Screen Academies and
                                                                            a small number of projects by strategic
                                                                                                                                             13
                                                                            agencies(3)
Welsh Assembly Government                                2.3       0.9      Includes spend from all Welsh government
                                                                            agencies into strategic film bodies/projects                     14
Northern Ireland Executive                               1.5       0.6      Includes spend from all Northern Ireland
                                                                            government agencies into strategic
                                                                            bodies/projects                                                  15
Ofcom                                                    1.0       0.4      Contribution to BFI National Archive
                                                                            for television
Department for Innovation, Universities and Skills       1.0       0.4      Awards to Screen Academies, Skillset                             16
                                                                            and N/RSAs

                                                                                                                                             17


                                                                                                                                             18


                                                                                                                                             19


                                                                                                                                             20


                                                                                     Chapter 17: Public investment in film in the UK – 145
                                                                                                                                             21
Table 17.1 Public funding for film in the UK by source, 2008/09 (continued)
                                                                                    Amount             %
Source                                                                              £ million    of total     Notes

Local Government                                                                        0.9         0.4       Investment by local authorities
                                                                                                              in N/RSA activities
Foreign and Commonwealth Office                                                         0.9         0.3       Funding for UK-originated British Council
                                                                                                              activity. Excludes partnership funding of
                                                                                                              ‘in country’ events (outside the UK)
Arts Councils                                                                           0.6         0.2       Awards from national Arts Councils to film
                                                                                                              agencies(4)
Other public sector                                                                   0.07          0.0       Very small awards (under £10,000) from
                                                                                                              a range of public sector agencies, mainly
                                                                                                              to N/RSAs
Department for Business, Enterprise and                                               0.05          0.0       Awards to RSAs for film export support
Regulatory Reform
Local authority direct spend                                                            n/a         n/a       Data on local government direct investments
                                                                                                              in cinemas, youth activity, film offices etc are
                                                                                                              not collated
Other education and research                                                            n/a         n/a       Figures not collated for investment in
                                                                                                              university courses not part of the Screen
                                                                                                              Academy network, further education film
                                                                                                              courses and film-related research awards
                                                                                                              from research councils
Total public sector selective investment                                            145.9         57.0        National Lottery and grant-in-aid from all
                                                                                                              sources as above
UK film production tax relief (HMRC)                                                110.0 43.0                Cost of film tax relief in 2008/09(5)
Total public sector selective                                                       255.9 100.0               Sum of all the above
and automatic investment
Source: UK Film Council, Northern Alliance.

Abbreviations:
BFI – British Film Institute.
DCMS – Department for Culture, Media and Sport.
HMRC – Her Majesty’s Revenue and Customs.
NFTS – National Film and Television School.
N/RSA – National and Regional Screen Agencies.

Names of government departments are shown as they were in the 2008/09 financial year. The Department for Children, Schools and Families is now the Department for
Education. The Department for Innovation, Universities and Skills and the Department for Business, Enterprise and Regulatory Reform are now part of the Department for
Business, Innovation and Skills.

Notes:
1.	 The National Lottery funding figure is for financial year 2008/09.
2.	 Investment for the MEDIA Programme is for awards made from 1 April 2008 to 31 March 2009.
3.	 Includes the Higher Education Funding Councils for England, Scotland and Wales, and investment from the Joint Information Systems Committee (JISC) which is HEFCE
		  funded. Comprises awards to the BFI, Screen Academies and other strategic agencies. Does not include payments from educational funding councils to other film
	 courses (film studies etc) in higher or further education.
4.	 Arts Council England, Arts Council of Wales, Arts Council Northern Ireland, Scottish Arts Council. Does not include Arts Councils’ direct investments in artists’ film and video.
5.	Film Tax Relief Summary, HMRC, September 2009.


146 – UK Film Council Statistical Yearbook 2010
1


                                                                                                                                                                              2


17.2 Film spend by organisation                                                                                                                                               3

The largest net spender on film was HMRC (£110 million for tax relief), followed by the BFI (£39.9 million), the UK
Film Council (£36.6 million) and BBC Films (£12 million). Putting aside HMRC tax relief, net spend decreased by 2%
from 2007/08 to 2008/09 (from £179 million to £175 million). Significant decreases were recorded for Film4,                                                                   4
Northern Ireland Screen, the Welsh agencies and the EU MEDIA Programme. On the other hand, increases were
recorded for Skillset, North West Vision and Media, Screen West Midlands, Screen East, Screen South and the
Heritage Lottery Fund. (See Table 18.2 in the 2009 Statistical Yearbook for comparable figures for 2007/08.)                                                                  5


Table 17.2 Net film spend by organisation, 2008/09
                                                                                                                                                                              6
                                                                                                                                   Net spend                     % of total
Organisation                                                                                                                        £ million(1)                 net spend

HM Revenue and Customs film tax relief                                                                                              110.0                          38.6
                                                                                                                                                                              7
BFI                                                                                                                                  39.9                          14.0
UK Film Council(2)                                                                                                                   36.6                          12.9
BBC Films                                                                                                                            12.0                           4.2       8

Skillset                                                                                                                              8.4                           3.0
Film4                                                                                                                                 8.0                           2.8
                                                                                                                                                                              9
National Film and Television School                                                                                                   7.4                           2.6
Scottish Screen                                                                                                                       7.4                           2.6
Northern Ireland Screen                                                                                                               7.1                           2.5       10
North West Vision and Media(3)                                                                                                        5.1                           1.8
Screen Yorkshire(4)                                                                                                                   5.0                           1.7
                                                                                                                                                                              11
First Light                                                                                                                           4.9                           1.7
Welsh agencies(5)                                                                                                                     3.9                           1.4
Screen West Midlands(6)                                                                                                               3.9                           1.4       12
Film London                                                                                                                           3.8                           1.3
EU MEDIA Programme                                                                                                                    3.7                           1.3
                                                                                                                                                                              13
Screen East(7)                                                                                                                        3.5                           1.2
FILMCLUB                                                                                                                              3.1                           1.1
EM Media                                                                                                                              3.1                           1.1       14
South West Screen(8)                                                                                                                  2.4                           0.8
Screen South(9)                                                                                                                       2.1                           0.7
Northern Film and Media(10)                                                                                                           2.0                           0.7       15

Heritage Lottery Fund                                                                                                                 1.0                           0.4
British Council                                                                                                                       0.9                           0.3
                                                                                                                                                                              16
Total public sector(11)                                                                                                             285.0                         100.0
Source: UK Film Council, Northern Alliance.
Notes:                                                                                                                                                                        17
1.	 Net spend means spend after deducting grants and awards to other organisations in this table. Figures are presented net to avoid double counting.
2.	 The UK Film Council gross spend in 2008/09 was £74.5 million. The UK Film Council made £37.9 million of grants and awards to other organisations such asn the BFI
	 (£17.4 million), Skillset, Regional Screen Agencies and First Light.
3.	 Includes the North West Film Archive.
                                                                                                                                                                              18
4.	 Includes the Yorkshire Film Archive.
5.	 Welsh agencies means Film Agency for Wales, Welsh Creative IP Fund (part of Finance Wales), Welsh Film Archive (part of the National Library of Wales) and Wales Screen
	 Commission (part of the Creative Industries Hub).
6.	 Includes the Media Archive for Central England (MACE) which provides film archive services for the East and West Midlands.
7.	 Includes the East Anglian Film Archive.                                                                                                                                   19
8.	 Includes the South West Film and Television Archive.
9.	 Includes the Wessex Film and Sound Archive and Screen Archive South East and investments in film made by Kent County Council’s Film Office/Kent Development Fund.
10.	ncludes film investments made by the Design and Creative Investment Fund operated by North East Finance.
    I                                                                            	
11.	 he spending tabulated above includes net transfers to and from reserves and spending financed by commercial income (eg from film rights) earned by agencies.
    T                                                                                                                                                                         20
	 For these reasons the total spending by agencies (£285 million) is 	 igher than total public funding for film in the 2008/09 year (£255.9 million, Table 17.1).
                                                                       h


                                                                                                                      Chapter 17: Public investment in film in the UK – 147
                                                                                                                                                                              21
17.3 Activities supported by public                                                      17.4 Large film production awards
spend on film                                                                            by agency, 2008/09
The various activities supported by public spend on                                      Major production awards (greater than £250,000)
film in the UK in 2008/09 are shown in Table 17.3.                                       given by National and Regional Screen Agencies to
As in previous years, film production took the largest                                   individual film projects in 2008/09 are shown in Table
share, accounting for £158.4 million (56% of the                                         17.4. In relation to the median British domestic film
total). Distribution and exhibition was second with                                      budget of £1.5 million (see Chapter 16) and the median
£31.6 million (11%), followed by administration and                                      co-production budget of £2.6 million, awards of this
services to the public (7%) and training and skills (7%).                                size can provide substantial assistance to UK films of
Of the remaining activities, film archives and heritage                                  distinctive national and regional character.
and script development registered significant increases
over 2007/08.
                                                                                         Table 17.4 Large film production awards (£250,000+)
                                                                                         by National/Regional Agency, 2008/09
Table 17.3 Activities supported by public spend on                                       Agency                       Project (total = 14)                   Amount £
film, 2008/09
                                                                                         Scottish Screen              Outcast                               447,655
                                                                Amount              %
Activity                                                        £ million     of total   Northern Ireland             Your Highness                         618,553
                                                                                         Screen
Production(1)                                                   158.4          55.6
                                                                                                                      Cherrybomb                            282,951
Distribution and exhibition                                      31.6          11.1
                                                                                                                      The Race                              250,000
Administration and services
                                                                  20.0           7.0                                  Five Minutes of Heaven                250,000
to the public
Training and skills(2)                                            19.5           6.9     Wales Creative IP            Skellig                               600,000
                                                                                         Fund
Education, young people and
                                                                  19.1           6.7                                  Mr Nice                               366,476
lifelong learning
Film archives and heritage(3)                                     14.6           5.1     EM Media                     Pelican Blood                         250,000
Script development                                                 9.9           3.5     Screen Yorkshire             The Damned United                     250,000
Export and inward investment                                                             Screen East                  Glorious 39                           425,000
                                                                    7.0          2.4
promotion(4)                                                                             Screen West                  Nativity                              500,000
Business support(5)                                               5.0          1.8       Midlands
Total public film expenditure(6)                                285.0        100.0                                    One Day                               380,000
Source: UK Film Council, Northern Alliance.                                                                           Soulboy                               368,000
Notes:                                                                                                                The Tormented                         259,776
1.	 Non-tax break production spend in 2008/09 was £48.4 million.
2.	 Skills Investment Fund, National/Regional Screen Agency training investment,         Source: UK Film Council, DCMS, Northern Alliance, N/RSA reports.
	 Skills Academies.
3.	 National Film and Television Archive, National/Regional Screen Archives,
	 Heritage Lottery Fund investments.
4.	 UK Film Council International; British Council, locations services in the nations
	 and regions.
5.	 National/Regional Screen Agency investment: primary beneficiaries are
	 independent production companies.
6.	 2008/09 total expenditure (£285 million) was greater than total public
	 funding (£256 million, Table 17.1) as expenditure was supplemented by
	 earned/self-generated income, grants from trusts and foundations and transfers
	 from reserves.


148 – UK Film Council Statistical Yearbook 2010
1


                                                                                                                                                                     2


Table 17.5 shows the Lottery awards made by the UK                              Table 17.6 Large awards (£250,000+) made by UK                                       3
Film Council in 2009. There were 303 awards in total                            Film Council, 2009
(253 in 2008), to a combined value of £24.4 million                                                                                             Amount of award
(£15.6 million in 2008). Most of the awards were for                            Fund                Project (total = 20)                                      £
                                                                                                                                                                     4
relatively low amounts (£50,000 and under) made by                              Premiere    Centurion                                              1,200,000
the Development and Prints and Advertising funds.
                                                                                            Another Year                                           1,200,000
For a list of the individual project titles see
www.ukfilmcouncil.org.uk/awards.                                                            Attack the Block                                       1,085,788         5

                                                                                            The King’s Speech                                      1,000,000
Table 17.5 UK Film Council Lottery awards, 2009                                             StreetDance 3D                                         1,000,000
                                                                                                                                                                     6
                                                        Number    Total value
                                                                                            Brighton Rock                                          1,000,000
Fund                                                  of awards     £ million               Tracker                                                  971,291
Development                                               150          4.2                  Made in Dagenham                                         850,000         7
Prints and Advertising                                    112          4.2                  Tamara Drewe                                             780,000
New Cinema                                                 21          6.0                  Africa United                                            500,000
                                                                                                                                                                     8
Premiere                                                   20         10.0      New Cinema Chatroom                                                  700,000
Total large awards                                        303         24.4                  Sex  Drugs  Rock  Roll*                               700,000
Source: UK Film Council.                                                                    Submarine                                                700,000         9
Note: UK Film Council awards data are for calendar year 2009.
                                                                                            Neds                                                     650,000
The large awards (£250,000+) made by the UK Film                                            Slave                                                    610,000
Council in 2009 are shown in Table 17.6. The biggest                                        First Grader                                             600,000
                                                                                                                                                                     10
awards (£1.2 million) were for the Premiere Fund films
Centurion and Another Year. The largest New Cinema                                          Project Nim                                              510,095
Fund awards (£700,000) were for Chatroom, Sex                                              Cirkus Columbia                                          430,000         11
Drugs  Rock  Roll and Submarine. There was only                                           Self Made                                                250,000
one Prints and Advertising Fund award greater than                              Prints and  Fifty Dead Men Walking                                   250,471
£250,000, Fifty Dead Men Walking (£250,471).                                    Advertising                                                                          12

                                                                                Source: UK Film Council.
                                                                                Note: UK Film Council awards data are for calendar year 2009.
                                                                                *Sex  Drugs  Rock  Roll was noted in the 2009 Yearbook as a 2008 award,           13
                                                                                but the date of its award was amended to 4 February 2009.


                                                                                17.5 Leading public investors in British film                                        14

                                                                                production, 2007–2009
                                                                                Table 17.7 shows the leading public agency and public                                15
                                                                                service broadcaster investment in British films with
                                                                                budgets of £500,000+ for the calendar years 2007–
                                                                                2009. The most frequent public investor was the
                                                                                                                                                                     16
                                                                                UK Film Council with 54 projects (combined budget
                                                                                £216 million), followed by Film4/Channel 4 (38 projects,
                                                                                combined budget £128 million) and BBC Films (36
                                                                                                                                                                     17
                                                                                projects, £157 million). These budget figures are for
                                                                                the total budget of the films, including the share of
                                                                                the budget provided by private investors and pre-sales.
                                                                                                                                                                     18


                                                                                                                                                                     19


                                                                                                                                                                     20


                                                                                                              Chapter 17: Public investment in film in the UK– 149
                                                                                                                                                                     21
Table 17.7 Leading public investors in British film production, 2007–2009
                                                             Estimated
                                                                budget
Public funder                                  Number         £ million     Selected titles

UK Film Council                                     54           216
	 Of which...
	 Premiere Fund                                     29           170        Chéri, The Moon Princess, The King’s Speech, Centurion,
                                                                            Tamara Drewe, Nowhere Boy, Made in Dagenham, Another Year,
                                                                            Harry Brown
	 New Cinema Fund                                   25             46       Neds, Chatroom, In the Loop, Cirkus Columbia, Genova,
                                                                            Submarine, Sex  Drugs  Rock  Roll, Fish Tank
Film4/Channel 4                                     38           128        The Eagle of the Ninth, Never Let Me Go, Route Irish, Chatroom,
                                                                            The Unloved, Looking for Eric, the Red Riding trilogy, In Bruges,
                                                                            Nowhere Boy, She a Chinese
BBC Films                                           36           157        The Special Relationship, Creation, Brideshead Revisited,
                                                                            The Boys are Back, The Edge of Love, Tamara Drewe, Bright Star,
                                                                            Brighton Rock, The Damned United
Welsh Agencies                                      15             51       Ironclad, Submarine, Mr Nice, Valhalla Rising, Patagonia
Screen East                                         12             63       The Boat that Rocked, Easy Virtue, The Scouting Book for Boys
Scottish Screen                                     10             35       The Eagle of the Ninth, Neds, Outcast, The Last Word
Irish Film Board(1)                                 10             32       The Guard, Perrier’s Bounty, The Last Word
Screen Yorkshire                                    10             20       The Damned United, the Red Riding trilogy, A Passionate Woman
EM Media                                             9             16       Bronson, The Unloved, Pelican Blood
Northern Ireland Screen                              8             58       Hunger, Fifty Dead Men Walking, Your Highness
Screen West Midlands                                 8             10       Nativity, Clubbed, The Children
Source: UK Film Council production tracking. Includes films with budgets £500,000+ only. In some cases more than one public agency contributed funding to the same
film, so there is some double counting of budgets in the above table. Hence there is no ‘total budget’ row. Data in this table are for the calendar years 2007–2009.
Note:
1.	 The Irish Film Board was one of a number of overseas public agencies that part-funded British films during the period. Others included Screen Australia, Icelandic Film
	 Centre, Isle of Man Film, Filmburo Bremen, Medienboard Berlin-Brandenburg, Filmstiftung Nordrhein-Westfalen, Fonds Sud (France) and the New Zealand Film Fund.


„
 3F
   or more information on film production in the UK see Chapter 16 (page 132)
 3F
   or more information on the UK film economy see Chapter 20 (page 171)
 3
  For more information on UK film companies, see Chapter 19 (page 161)


150 – UK Film Council Statistical Yearbook 2010
Chapter 18:
Film education


Film education provides          Facts in focus

children and young people        •  lmost 68,000 students were entered for GCSE media
                                   A
                                   studies related subjects in 2008/09, up 95% in six years.
with a structured, systematic    •  ver 1.9 million children have attended National Schools
                                   O
opportunity to watch films,        Film Week screenings over the last decade.

to understand films and even     •  ver the last decade First Light has supported the
                                   O
                                   production of 878 short films involving over 13,000
to make films as part of their     children and young people.
preparation for adult life.      •  here were 3,815 students enrolled in higher
                                   T
For adults, film education         education film studies courses in 2008/09, an increase
                                   of 235% on 2002.
is a stimulating part of         •  here were 31,000 admissions to BFI Southbank
                                   T
lifelong learning.                 education events in 2009, and 172,000 video streaming
                                   requests were made via the Screenonline website.
                                 •  here is evidence that 355 moving image education
                                   T
                                   providers were operating in the UK in 2009, with over
                                   one-fifth production companies and one-fifth venues.
18.1 Introduction
Learning and participation are at the heart of an imaginative, diverse and vibrant film culture and can take many
different forms. Film education takes place in both formal and informal settings, from schools and colleges to
voluntary interest groups like youth clubs and film societies. There is a wide range of film education activity in the
UK but there has been little attempt to quantify this activity across the many types of provision. This chapter, a new
addition to the Statistical Yearbook, is intended as a first step in addressing the information gap and establishes
baseline data which can be built upon in the future. From this initial attempt, it is hoped that additional research
and data acquisition will enhance our understanding of the film education landscape.


18.2 Film education in formal education settings
In practice, film education activity involves watching and listening to a range of film texts, discussing and analysing
them; generating discursive and written work, storyboards and scripts; making films and re-purposing archive
material. Outside of dedicated film and media studies courses, film is also used in other parts of the curriculum
such as in English or modern languages. However, relatively little data exists on film education in the curriculum
before Key Stage 4.
There has been a 95% increase in the number of students entering GCSE media, film or TV studies in the UK (Table
18.1). Almost 68,000 students were enrolled in 2008/09, 1.2% of all GCSE entries. The WJEC (known previously as
the Welsh Joint Education Committee) offers a film studies GCSE. In 2009 there were 1,284 candidates across the
UK for this subject, rising to 3,286 in 2010.

Table 18.1 Entries for GCSE media/film/TV studies in England, Wales and Northern Ireland, 2003–2009
Number of
media/film/TV                                                                                                                                     % change
studies entries                                           2003/04        2004/05     2005/06     2006/07         2007/08          2008/09        2004–2009

England                                                36,829    42,483    54,126    62,683    65,693    63,685                                       +73
Northern Ireland                                          772       785       780       868       842       849                                       +10
Wales                                                   2,219     2,415     2,615     2,874     3,288     3,438                                       +55
Total                                                  39,820    45,683    57,521    66,425    69,623    67,972                                       +95
All GCSE entries                                    5,875,373 5,736,505 5,752,152 5,827,319 5,669,077 5,469,260                                        –7
Source: Joint Council for Qualifications (JCQ).
Note: Scotland not included because of separate examinations system.

The number of students taking GCE A Level media/film or TV studies in the UK has risen by 40% since 2003
(Table 18.2). There were almost 34,000 entries in 2008/09, 4% of all A Level entries.

Table 18.2 Entries for GCE A Level media/film/TV studies in England, Wales and Northern Ireland, 2002–2009

Number of                                                                                                                                         % change
media/film/TV studies entries             2002/03         2003/04        2004/05     2005/06     2006/07         2007/08          2008/09        2003–2009

England                                 22,743         25,425           26,633      29,123      30,036        30,651           31,618                +39
Northern Ireland                           364            377              468         602         654           745              897               +146
Wales                                    1,072          1,092            1,160       1,239       1,252         1,353            1,307                +22
Total                                   24,179         26,894           28,261      30,964      31,942        32,749           33,822                +40
All GCE A Level entries                750,537        766,247          783,878     805,698     805,657       827,737          846,977                +13
Source: Joint Council for Qualifications (JCQ).
Note: Scotland not included because of separate examinations system.


152 – UK Film Council Statistical Yearbook 2010                                                    Image: Looking for Eric courtesy of Icon Film Distribution
1


                                                                                                                                                           2


The number of entries for Scottish Higher media studies has seen a 10% decline since 2003 (Table 18.3).                                                    3


Table 18.3 Entries for Scottish Higher media studies, 2003–2009
                                                                                                                                             % change      4
                                                      2003           2004        2005        2006         2007        2008          2009    2003–2009

Number of media studies entries                    851     827     814     843     819     797     765                                           –10
                                                                                                                                                           5
All entries                                    166,885 165,575 164,142 159,140 161,081 162,576 167,792                                          +0.5
Source: Scottish Qualifications Authority.

The WJEC offers a dedicated film studies qualification available to schools throughout the UK. In 2009 there were                                          6

6,674 A Level candidates completing (up 109% since 2003) and 11,800 AS Level candidates completing (Table 18.4).

                                                                                                                                                           7
Table 18.4 Candidates completing GCE A and AS Level film studies, 2003–2009
                                                                                                                                              % change
                                               2003           2004            2005        2006          2007         2008          2009      2003–2009
                                                                                                                                                           8
A Level film studies entries                  3,197          4,162           4,907       5,965        6,598        6,552       6,674           +109
AS Level film studies entries                 7,200          8,249           9,405       9,908        9,915       11,052      11,800            +64
Source: WJEC.                                                                                                                                              9


Film Education is an organisation funded by the film industry to provide structured programmes for the teaching
of film criticism and appreciation and offers professional development opportunities and resources for teachers.                                           10
Film Education has 15,817 primary schools (69% of the total) and 5,012 secondary schools (88% of the total) on
its database – these figures represent any school that has taken students to a cinema-based event, has teachers
that have used resources or paid to send a teacher to a training event. With almost 67,000 teacher contacts on the
                                                                                                                                                           11
database, the reach of Film Education is estimated to be 2.2 million pupils and students annually. Its flagship festival,
National Schools Film Week, is the largest event of its kind in the world. In 2009, over 392,000 schoolchildren visited
the cinema for free as part of the event (Table 18.5).
                                                                                                                                                           12


Table 18.5 Attendances at National Schools Film Week and other Film Education screenings, 2001–2009
                                     2001      2002           2003            2004        2005          2006         2007          2008           2009     13

National Schools
Film Week
attendances                   102,880        75,490     105,392        125,761       213,794        259,964      298,586     335,733        392,452        14

Other Film
Education
screenings                            n/a       n/a      25,755             24,803      12,737       35,756       34,188      23,754          13,481       15

Source: Film Education.

                                                                                                                                                           16


                                                                                                                                                           17


                                                                                                                                                           18


                                                                                                                                                           19


                                                                                                                                                           20


                                                                                                                        Chapter 18: Film Education – 153
                                                                                                                                                           21
Media studies in general, and film studies in particular, also has a strong presence in UK higher education.
Over 28,000 students were enrolled on media studies related courses in 2008/09, up 26% in six years (Table 18.6).
The film studies subject area saw a 235% increase in numbers over the same period, from 1,140 first degree and
postgraduate students in 2003 to 3,815 in 2009.

Table 18.6 Higher education students in the subject area media studies, 2002–2009
                                                                                                                                                                  % change
                                                   2002/03        2003/04         2004/05         2005/06          2006/07         2007/08         2008/09       2002–2009

All media studies
related courses                                   22,495        26,135          26,495          26,665           27,010          28,085          28,245             +26
Media studies                                     17,300        20,215          20,205          19,785           18,995          17,860          17,595              +2
Film studies                                       1,140         1,490           1,840           2,155            2,540           3,610           3,815            +235
Film production                                      100           135             165             420              545             520             530            +430
Source: HESA Student Record 2002/03–2008/09.
© Higher Education Statistics Agency Limited 2010. HESA cannot accept responsibility for any inferences or conclusions derived from the data by third parties.
Notes:
Includes first degree, postgraduate and other degrees.
Media studies related courses include media, film, television, radio, electronic and print-based media studies courses.

In the last few years Skillset, the Sector Skills Council for Creative Media, together with the film industry, has worked
closely with further and higher education institutions to identify and establish a network of Skillset Screen Academies
recognised as existing centres of excellence in film education in the UK. Members of the network are endorsed by
the film industry as providers of the highest standard of relevant vocationally orientated education, training and
development at a further, higher and postgraduate level. In 2009/10 the network offered 51 courses (diploma,
undergraduate and postgraduate qualifications) with 2,240 students enrolled.


18.3 National and regional film education providers
The British Film Institute (BFI) is the main UK-wide agency for promoting understanding and appreciation of moving
image culture, education and cinema heritage. It runs programmes for learners of all ages at BFI Southbank, as well
as providing resources via telephone, in print and online to support film education and research across the UK.
Table 18.7 provides details of some of the BFI’s main education activities.
In 2008/09 there were 30,999 admissions to BFI Southbank education events (up 53% on 2004/05) and 5,698
education admissions to BFI Festivals (up 5% on 2004/05). Visits to the BFI National Library have remained largely
unchanged over the last five years (around 12,000 visits per year) and there were almost 20,000 BFI information
service enquiries in 2008/09. The BFI Screenonline website (www.screenonline.org.uk) is a web-based encyclopaedia
of British film and television featuring hundreds of hours of clips from the BFI National Archive, supplemented by
contextual material, stills, posters and press books. Users in UK schools, colleges, universities and libraries can access
the entire site for free, and in 2008/09 there were over 172,000 video streaming requests.


154 – UK Film Council Statistical Yearbook 2010
1


                                                                                                                                      2


Table 18.7 BFI education activity, 2004–2009                                                                                          3
                                                                2004/05    2005/06      2006/07          2007/08         2008/09

BFI Southbank education event admissions                       19,625     15,149       12,648          33,945         30,000
                                                                                                                                      4
BFI Festivals – education admissions                            5,451      4,881        4,106           3,733          5,698
BFI National Library visits                                        n/a    12,331       11,919          11,905         12,024
BFI information service enquiries                                  n/a    27,044       25,655          25,711         19,539          5
BFI Screenonline video streaming requests                          n/a        n/a          n/a             n/a       172,142*
Sales of BFI education resources of which…
	 copies of short film resources**                                 n/a         n/a         n/a               n/a         3,618        6
	 copies of other resources                                        n/a         n/a         n/a               n/a         1,301
Source: BFI.
*80% of requests from schools and colleges outside London.                                                                            7
**Each resource reaches an average of 50 students or pupils.

Over many years, schools have organised and run film clubs for their pupils on an ad hoc basis, showing films either
for enjoyment or as part of curriculum-based activity. Unfortunately, historical data showing the number of such                      8

clubs operating in the UK is unavailable.
In 2007, FILMCLUB was established with the intention of setting up a UK-wide school-based network of film clubs
                                                                                                                                      9
that would allow young people the chance to experience characters, images, cultures and stories they would never
normally be exposed to. A pilot scheme involving 800 children and young people from 25 schools in England ran
between January and March 2007, during which schools held 152 screenings of 89 films for different age groups
                                                                                                                                      10
between 5 and 18.
By the end of 2009, there were 2,901 school film clubs in England (2,978 across the whole UK) with an estimated
90,000 pupils involved (92,000 in the UK). A total of 3,040 schools and 3,700 staff members have taken part in the                    11
initiative and 35,837 films (1,876 unique titles) have been supplied to film clubs. The range of films ordered by the
film clubs are diverse – in 32 languages and set in over 100 countries. Table 18.8 outlines the regional distribution
of film clubs in England.
                                                                                                                                      12


Table 18.8 Regional distribution of FILMCLUB schools in England, 2009
                                                                                                                             % of     13
                                                                                % of                         % of         pupils in
                                                                          FILMCLUB          % of         pupils in         general
Region                                                                       schools     schools   online schools       population
                                                                                                                                      14
East Midlands                                                                10.6         9.3              9.5               8.5
East of England                                                               9.3        11.6             10.0              11.1
London                                                                       15.4         9.8             16.8              15.0      15
North East                                                                    8.1         4.9              6.3               4.9
North West                                                                   11.3        15.3             10.9              13.8
South East                                                                   17.5        16.5             17.3              16.0      16

South West                                                                   10.2         9.4             10.3               9.6
West Midlands                                                                 7.0        11.9              7.8              11.1
                                                                                                                                      17
Yorkshire and Humber                                                         10.6        11.3             11.0              10.0
Source: FILMCLUB.
                                                                                                                                      18


                                                                                                                                      19


                                                                                                                                      20


                                                                                                   Chapter 18: Film Education – 155
                                                                                                                                      21
Learning about film can be enhanced by practical involvement in filmmaking activity, which gives learners the
opportunity to see for themselves how images and sounds are recorded and combined to create meaningful stories.
There are a number of opportunities to gain filmmaking experience outside of professional film production. One of
these, First Light, was established to fund and mentor children and young people aged five to 19 to make short
digital films. Over the last decade it has supported the production of 878 films involving over 13,000 children and
young people (Table 18.9).
First Light is also the lead partner for the Mediabox consortium, funded by the Department for Education (formerly
Department for Children, Schools and Families), which offers disadvantaged 13- to 19-year-olds the opportunity
to develop and produce creative media projects, using film, television, print, radio, games, interactive or online
platforms. During 2007/08 and 2008/09, Mediabox enabled over 9,400 young people to participate in the making
of 317 films.

Table 18.9 First Light projects, 2001–2009
Year                                              2001/02   2002/03   2003/04   2004/05   2005/06   2006/07   2007/08   2008/09

Number of films made                                 10       155       121       150       114       121       117        90
Number of young people participating                143     2,178     1,988     2,470     1,694     1,644     1,840     1,291
Source: First Light.


18.4 Public investment in film education
A total of £19.1 million was spent on education, young people and lifelong learning in 2008/09 by the national
agencies described above and the screen agencies of the nations and regions (Table 18.10). However, this analysis
does not include all film education spend, particularly investments in film-based learning activities made by local
authorities, schools, further and higher education institutions and some of the third-party providers described in
section 18.5.

Table 18.10 Public expenditure on film education by agency, 2008/09
Agency                                                                                                                       £

BFI                                                                                                                9,317,000
First Light (including Mediabox)                                                                                   3,418,502
FILMCLUB                                                                                                           3,100,000
Northern Ireland Screen                                                                                              680,878
Scottish Screen                                                                                                      589,000
UK Film Council                                                                                                      461,315
Screen East                                                                                                          273,323
Screen West Midlands                                                                                                 223,695
EM Media                                                                                                             211,212
North West Vision and Media                                                                                          142,180
Screen South                                                                                                         136,915
Northern Film and Media                                                                                              133,894
South West Screen                                                                                                    125,773
Film Agency for Wales                                                                                                 89,856
Screen Yorkshire                                                                                                      86,342
Film London                                                                                                           70,680
Total                                                                                                             19,060,564
Source: UK Film Council, Northern Alliance.


156 – UK Film Council Statistical Yearbook 2010
1


                                                                                                                                    2


18.5 Moving image education providers in the UK                                                                                     3

In addition to the activity described above, there are a number of other organisations involved in the delivery of
film education in the UK. The UK Film Council has undertaken some primary research on moving image education
providers and has compiled a database from information supplied by the national and regional screen agencies,                       4
First Light, Media Education Wales, Screen West Midlands REd REx network, the MovIES network, Arts Council
England’s national and regional offices and others. It includes details of organisations actively engaged in providing
moving image education directly to learners as part of their core activity. It does not include organisations which                 5
fund such activity or support it through the provision of learning resources, nor does it include schools, colleges
or universities (although many of the organisations in the database work with formal education institutions).
Neither does it include organisations that solely deliver industry training, but it does include training bodies that               6
operate non-vocational educational programmes alongside their training activity. Finally, it does not include
organisations that solely provide teacher training and Continuing Professional Development (CPD).
The database is intended to help the UK Film Council and its partners to better understand the range and nature                     7
of moving image education provision across the UK.
There is evidence that 355 moving image education providers were operating in the UK as at 24 February 2010
                                                                                                                                    8
(Table 18.11). The largest proportion of moving image education providers is found in London (15% of the total).
The East Midlands, Yorkshire, the North East, Scotland, Wales and Northern Ireland all have a higher proportion
of providers than their UK population share. The reverse is true for the West Midlands, South East, South West,
                                                                                                                                    9
North West and the East of England.

Table 18.11 Number of moving image education providers by nation/region, 2010                                                       10
                                                                                                                              %
Nation/region                                                                           Number              %      UK population

London                                                                                    54           15.2              12.4       11
East Midlands                                                                             37           10.4               7.2
Yorkshire and Humber                                                                      33            9.3               8.5
                                                                                                                                    12
West Midlands                                                                             28            7.9               8.8
South East                                                                                27            7.6              13.6
South West                                                                                26            7.3               8.5       13
North West                                                                                24            6.8              11.3
North East                                                                                20            5.6               4.2
East of England                                                                           12            3.4               9.3       14

England sub-total                                                                        261           73.5              83.8
Scotland                                                                                  38           10.7               8.4
                                                                                                                                    15
Northern Ireland                                                                          30            8.5               2.9
Wales                                                                                     26            7.3               4.9
UK total                                                                                 355          100.0             100.0       16

Source: UK Film Council Moving Image Education Providers Database.

Just over one-fifth (22%) of all moving image education providers are production companies, and one in five (19%)                   17
are venues (Table 18.12). Arts organisations make up 17% of providers while education/training organisations
contribute to a further 14%.
                                                                                                                                    18


                                                                                                                                    19


                                                                                                                                    20


                                                                                                 Chapter 18: Film Education – 157
                                                                                                                                    21
Table 18.12 Number of moving image education providers by type, 2010
Type                                                                                                                                            Number      %

Production company/corporate video                                                                                                                77      21.7
Venue                                                                                                                                             66      18.6
Arts organisation                                                                                                                                 59      16.6
Education/training                                                                                                                                49      13.8
Participatory media                                                                                                                               35       9.9
Festival                                                                                                                                          26       7.3
Archive                                                                                                                                           20       5.6
Community Group                                                                                                                                   17       4.8
Other                                                                                                                                              6       1.7
Total                                                                                                                                            355     100.0
Source: UK Film Council Moving Image Education Providers Database.
Notes:
‘Production company/corporate video’ includes feature and short film production companies and businesses offering corporate video services.
‘Venue’ includes cinemas, film clubs and local authority-run mixed arts venues that offer in-house education activities.
‘Arts organisation’ includes community arts projects, artist collectives and art galleries that offer moving image based activity.
‘Education/training’ includes dedicated education and/or training providers, often working in partnership with formal education institutions.
‘Participatory media’ includes non-profit, community-based filmmaking enterprises.
‘Festival’ includes film festivals that offer a dedicated education strand.
‘Archive’ includes moving image archives offering dedicated education activities.
‘Community group’ includes youth clubs and other local groups that offer filmmaking opportunities as part of their core activity.
‘Other’ includes membership based organisations that offer education opportunities (eg professional networks) and museums.

Over six out of 10 (64%) moving image education providers offer production-based learning opportunities, and
a further 17% offer a mix of production- and exhibition-based education (Table 18.13). Learning activity through
watching films (exhibition-based) is offered by 14% of providers, while 6% offer archive-based learning.

Table 18.13 Type of provision given by moving image education providers, 2010
Type                                                                                                                                            Number      %

Production-based                                                                                                                                 227      63.9
Mixed                                                                                                                                             60      16.9
Exhibition-based                                                                                                                                  48      13.5
Archive-based                                                                                                                                     20       5.6
Total                                                                                                                                            355     100.0
Source: UK Film Council Moving Image Education Providers Database.
Notes:
‘Production-based’ provision involves learning through making films or animation.
‘Exhibition-based’ provision involves learning through watching films.
‘Mixed’ provision involves learning through making and watching films (although not necessarily within the same course or workshop).
‘Archive-based’ provision involves learning through watching archive films and/or using them in creative activity.


158 – UK Film Council Statistical Yearbook 2010
1


                                                                                                                                                                                 2


Two-thirds (67%) of moving image education providers offer learning opportunities to all age groups (Table 18.14).                                                               3
A sizeable minority (30%) specialise in providing learning opportunities for children and young people.

Table 18.14 Learner age group of moving image education providers, 2010                                                                                                          4

Type                                                                                                                                               Number                    %

All ages                                                                                                                                              237              66.8
                                                                                                                                                                                 5
Children and young people                                                                                                                             105              29.6
Adults                                                                                                                                                 13               3.7
Total                                                                                                                                                 355             100.0      6

Source: UK Film Council Moving Image Education Providers Database.
Notes:
‘All ages’ – the provider offers learning opportunities for all ages.
                                                                                                                                                                                 7
‘Children and young people’ – the provider specialises in learning opportunities for children and young people (commonly aged up to 19 years, but can include up to 25 years).
‘Adults’ – the provider specialises in learning opportunities for adults (commonly aged 19+).

Table 18.15 provides a breakdown of the type of provision by learner age group. Production-based activity accounts                                                               8
for 84% of child-focused learning activity, 77% of adult opportunities and 54% of opportunities for all ages.

Table 18.15 Type of moving education provision by learner age group, 2010                                                                                                        9

                                                                                                   Production-based    Exhibition-based      Archive-based               Mixed

Children                                                                                                        88                   9                   0                  8
                                                                                                                                                                                 10
Adults                                                                                                          10                   1                   0                  2
All                                                                                                            129                  38                  20                 50
Total                                                                                                          227                  48                  20                 60    11

Source: UK Film Council Moving Image Education Providers Database.

Finally, Table 18.16 shows the national and regional breakdown of type of moving image education provision.                                                                      12
Exhibition-based activity plays a proportionally greater role in Yorkshire (27%), North West and West Midlands (both
21%) and London (17%). Archive-based activity is a key feature of moving image education provision in Northern
Ireland, accounting for 47% of all activity.                                                                                                                                     13


                                                                                                                                                                                 14


                                                                                                                                                                                 15


                                                                                                                                                                                 16


                                                                                                                                                                                 17


                                                                                                                                                                                 18


                                                                                                                                                                                 19


                                                                                                                                                                                 20


                                                                                                                                             Chapter 18: Film Education – 159
                                                                                                                                                                                 21
Table 18.16 Type of moving education provision by nation/region, 2010
                                                                     Production-based   Exhibition-based   Archive-based   Mixed   Total

East Midlands                                                                    27                   4              1       5      37
East England                                                                      7                   1              0       4      12
London                                                                           39                   9              0       6      54
North East                                                                       17                   1              0       2      20
North West                                                                       15                   5              1       3      24
Northern Ireland                                                                  6                   3             14       7      30
Scotland                                                                         29                   3              1       5      38
South East                                                                       19                   3              1       4      27
South West                                                                       17                   3              0       6      26
Wales                                                                            14                   1              1      10      26
West Midlands                                                                    16                   6              0       6      28
Yorkshire                                                                        21                   9              1       2      33
Source: UK Film Council Moving Image Education Providers Database.


„
 3F
   or more information on public investment in film in the UK see Chapter 17 (page 143)
 3T
   o access the UK Film Council Moving Image Education Database please go to:
   www.21stcenturyliteracy.org.uk/resources.php?type=film_making
 3 For
   more information on the film education providers described in this chapter, please see the following links:
   www.21stcenturyliteracy.org.uk
   www.bfi.org.uk
   www.filmclub.org
   www.filmeducation.org
   www.firstlightonline.co.uk
   www.media-box.co.uk
   www.skillset.org


160 – UK Film Council Statistical Yearbook 2010
Chapter 19:
Film industry companies


In the UK the film sectors        Facts in focus

with the largest numbers of       • n 2009, there were nearly 5,000 film production
                                    I
                                    companies and 2,500 post-production companies
companies are production and        in the UK.
post-production, though the       •  here were 420 film distributors and 225 exhibitors.
                                    T

largest companies are found       •  he majority of companies were small (turnover under
                                    T
                                    £250,000) but more than 70% of turnover was accounted
in distribution and exhibition.     for by the 170 companies with turnover over £5 million.
Across Europe, the US majors      •  he production, post-production and distribution sectors
                                    T
are prominent but so also are       were concentrated in London and the South East, while
                                    the exhibition sector was more dispersed.
British exhibitors, French and    •  utside London and the South East there were significant
                                    O
German production companies         production and post-production clusters in the North
                                    West, South West, East of England and Scotland.
and French distributors.
                                  •  S majors, video distributors and exhibitors were
                                    U
                                    prominent in the top 14 UK film companies in 2008
                                    (the most recent year for which comparable data
                                    are available).
19.1 Number of companies in the film and video industries
The number of companies involved in the film and video industries has grown rapidly in the last 13 years, particularly
in the production sector where the number of companies increased by 356% between 1996 and 2009, compared
with the UK average of 56% (Table 19.1). Part of this growth reflects the improvement in coverage in 2008 when
companies registered for PAYE but not VAT were added to the totals. In 2009, there were 7,965 film and video
production companies, 460 film and video distributors and 225 exhibitors.

Table 19.1 Number of companies by industry group, 1996–2009
                                                                                       Film and video          Film and video
Year                                                                                       production             distribution         Film exhibition        UK all industries

1996                                                                                         1,745                      355                     155            1,380,695
1997                                                                                         2,460                      360                     160            1,547,175
1998                                                                                         3,065                      370                     160            1,573,935
1999                                                                                         3,460                      380                     165            1,595,705
2000                                                                                         3,900                      425                     165            1,616,835
2001                                                                                         4,185                      485                     190            1,623,025
2002                                                                                         4,605                      515                     195            1,619,195
2003                                                                                         5,065                      530                     205            1,623,715
2004                                                                                         5,275                      455                     200            1,611,535
2005                                                                                         5,785                      445                     200            1,631,540
2006                                                                                         6,210                      415                     200            1,646,280
2007                                                                                         6,575                      400                     200            1,673,835
2008                                                                                         7,970                      435                     230            2,161,555
2009                                                                                         7,965                      460                     225            2,152,400
Growth 1996–2009 (%)                                                                         356.4                     29.6                    45.2                 55.9
Source: Office for National Statistics.
Notes:
From 1996 to 2007, data include only companies registered for VAT.
For 2008 and 2009, data include in addition companies registered for PAYE but not registered for VAT, so give improved coverage of the company population.
For 1996–2008 data are for 2003 Standard Industrial Classifications (SICs) 9211 (film and video production), 9212 (film and video distribution) and 9213 (film exhibition).
For 2009, film and video production is the sum of 2007 SICs 59111 (film production), 59112 (video production) and 5912 (film, video and TV post-production), film and
video distribution is the sum of 59131 (film distribution) and 59132 (video distribution) and film exhibition is 5914 (film exhibition).

The introduction of the 2007 Standard Industrial Classifications makes possible a more detailed breakdown of the
sector, as shown in Tables 19.2 and 19.3. This gives, for the first time, a view of film production and distribution
separately from video production and distribution, and confirms that film production and distribution make up the
majority of the sector. However, it is interesting to note the size of the post-production sector – 29% of companies
and 16% of turnover – previously included in the film and video production total.


162 – UK Film Council Statistical Yearbook 2010                                                                    Image: The King’s Speech courtesy of Momentum Pictures
1


                                                                                                                                                                              2


Table 19.2 Number of film and video companies by sub-sector, 2009                                                                                                             3
Sub-sector                                                                                                                   Number of companies                 % of total

Film production                                                                                                                            4,905                   56.7
                                                                                                                                                                              4
Video production                                                                                                                             590                    6.8
Film, video and TV post-production*                                                                                                        2,470                   28.6
Film distribution                                                                                                                            420                    4.9       5
Video distribution                                                                                                                            40                    0.5
Film exhibition                                                                                                                              225                    2.6
Total                                                                                                                                      8,650                  100.0       6

Source: Office for National Statistics.
*Companies in the post-production sector usually work on films, commercials, videos and television programmes, and therefore have a combined statistical classification.
Data as at March 2009.                                                                                                                                                        7
Percentages may not sum to 100.0 due to rounding.

Although film distributors were only 5% of the companies, they accounted for 36% of the turnover (Table 19.3)
in 2009. This reflects the dominant position of the UK subsidiaries of the major Hollywood studios in the film                                                                8

value chain.

                                                                                                                                                                              9
Table 19.3 Turnover of film and video companies by sub-sector, 2009
Sub-sector                                                                                                                          Turnover £000s               % of total

Film production                                                                                                                     2,471,123                      30.8       10

Video production                                                                                                                      204,281                       2.5
Film, video and TV post-production*                                                                                                 1,267,039                      15.8
                                                                                                                                                                              11
Film distribution                                                                                                                   2,872,355                      35.8
Video distribution                                                                                                                    188,624                       2.4
Film exhibition                                                                                                                     1,019,372                      12.7       12
Total                                                                                                                               8,022,794                     100.0
Source: Office for National Statistics.
*See note to Table 19.2.                                                                                                                                                      13
Data as at March 2009.


                                                                                                                                                                              14
19.2 Size distribution of film companies
The size distribution of film companies is shown in Tables 19.4 to 19.7. While the majority of companies were very
small (turnover less than £250,000 per year) over 70% of turnover was accounted for by the 170 companies with                                                                 15
turnover greater than £5 million. The concentration was particularly high in film distribution (Table 19.6) where the
30-largest companies accounted for 94% of turnover. In exhibition the large company turnover concentration was
close to 90% (Table 19.7), though the Office for National Statistics was not able to release the precise number for                                                           16
confidentiality reasons.

                                                                                                                                                                              17


                                                                                                                                                                              18


                                                                                                                                                                              19


                                                                                                                                                                              20


                                                                                                                                Chapter 19: Film industry companies – 163
                                                                                                                                                                              21
Table 19.4 Size distribution of film production companies, 2009
Turnover size band £000s                                     Number      %       Turnover      %

5,000 +                                                         85      1.7   1,338,074      54.1
1,000 – 4,999                                                  290      5.9     545,204      22.1
500 – 999                                                      230      4.7     149,376       6.0
250 – 499                                                      440      9.0     148,086       6.0
100 – 249                                                    1,165     23.8     169,223       6.8
50 – 99                                                      1,255     25.6      87,476       3.5
0 – 49                                                       1,440     29.4      33,684       1.4
Total                                                        4,905    100.0   2,471,123     100.0
Source: Office for National Statistics.
Data as at March 2009.
Percentages may not sum to 100.0 due to rounding.


Table 19.5 Size distribution of post-production companies, 2009
Turnover size band £000s                                     Number      %       Turnover      %

5,000 +                                                         45      1.8     754,053      59.5
1,000 – 4,999                                                  115      4.7     233,510      18.4
500 – 999                                                      105      4.3      69,984       5.5
250 – 499                                                      170      6.9      61,129       4.8
100 – 249                                                      470     19.0      70,813       5.6
50 – 99                                                        830     33.6      59,013       4.7
0 – 49                                                         735     29.8      18,537       1.5
Total                                                        2,470    100.0   1,267,039     100.0
Source: Office for National Statistics.
Data as at March 2009.
Percentages may not sum to 100.0 due to rounding.


Table 19.6 Size distribution of film distribution companies, 2009
Turnover size band £000s                                     Number      %       Turnover      %

5,000 +                                                        30       7.1   2,709,356      94.3
1,000 – 4,999                                                  50      11.9      98,396       3.4
500 – 999                                                      45      10.7      29,854       1.0
250 – 499                                                      50      11.9      15,815       0.6
100 – 249                                                      85      20.2      11,826       0.4
50 – 99                                                        75      17.9       5,448       0.2
0 – 49                                                         85      20.2       1,660       0.1
Total                                                         420     100.0   2,872,355     100.0
Source: Office for National Statistics.
Data as at March 2009.
Percentages may not sum to 100.0 due to rounding.


164 – UK Film Council Statistical Yearbook 2010
1


                                                                                                                                                                                 2


Table 19.7 Size distribution of film exhibition companies, 2009                                                                                                                  3
Turnover size band £000s                                                                        Number                        %                  Turnover                   %

5,000 +                                                                                           10                     4.4                     c                       –
                                                                                                                                                                                 4
1,000 – 4,999                                                                                     35                    15.6                76,010                     7.5
500 – 999                                                                                         40                    17.8                     c                       –
250 – 499                                                                                         25                    11.1                     c                       –       5
100 – 249                                                                                         45                    20.0                 7,221                     0.7
50 – 99                                                                                           30                    13.3                     c                       –
0 – 49                                                                                            40                    17.8                 1,554                     0.2       6

Total                                                                                            225                   100.0             1,019,372                   100.0
Source: Office for National Statistics.
                                                                                                                                                                                 7
‘c’ Indicates the data have been made confidential by the Office for National Statistics to avoid disclosing details of individual companies.
Data as at March 2009.


                                                                                                                                                                                 8
19.3 National/regional distribution of film companies in the UK
Tables 19.8 and 19.9 show the national/regional distribution of film companies and film company turnover in 2009.
Overall, 68% of film companies were concentrated in London and the South East and over 85% of turnover was                                                                       9
generated by companies located in these two regions. The London concentration was particularly strong for
distribution (55% of companies and 97% of turnover) but the exhibition sector was more evenly distributed
across the UK, with 71% of companies and 48% of turnover associated with companies based outside London.                                                                         10

While London and the South East dominate in production and post-production, there are significant national and
regional centres, particularly in the North West, the East of England, the South West and Scotland (Table 19.9).
                                                                                                                                                                                 11


Table 19.8 National/regional distribution of film companies, 2009
                                                  Film production             Post-production            Film distribution             Film exhibition           Total UK Film   12
                                             Number              %       Number             %        Number             %         Number            %       Number          %

London                                       2,685         54.7          1,270        51.4             230        54.8              65           28.9       4,250     53.0
                                                                                                                                                                                 13
South East                                     675         13.8            440        17.8              75        17.9              20            8.9       1,210     15.1
East of England                                285          5.8            160         6.5              30         7.1              30           13.3         505      6.3
South West                                     285          5.8            170         6.9              15         3.6              15            6.7         485      6.0       14
North West                                     210          4.3            105         4.3              20         4.8              10            4.4         345      4.3
Scotland                                       170          3.5             75         3.0              10         2.4              15            6.7         270      3.4
                                                                                                                                                                                 15
West Midlands                                  130          2.7             55         2.2              15         3.6              10            4.4         210      2.6
Yorkshire and The Humber                       130          2.7             55         2.2              10         2.4              15            6.7         210      2.6
Wales                                          115          2.3             45         1.8               5         1.2              10            4.4         175      2.2       16
East Midlands                                  105          2.1             40         1.6               5         1.2              15            6.7         165      2.1
North East                                      70          1.4             30         1.2               5         1.2               5            2.2         110      1.4
                                                                                                                                                                                 17
Northern Ireland                                45          0.9             25         1.0               0         0.0              15            6.7          85      1.1
Total UK                                     4,905        100.0          2,470       100.0             420       100.0             225          100.0       8,020    100.0
Source: Office for National Statistics.                                                                                                                                          18
Data as at March 2009, for business enterprises.
Percentages may not sum to 100.0 due to rounding.


                                                                                                                                                                                 19


                                                                                                                                                                                 20


                                                                                                                                     Chapter 19: Film industry companies – 165
                                                                                                                                                                                 21
Table 19.9 National/regional distribution of film company turnover, 2009
                                     Film production               Post-production              Film distribution              Film exhibition                Total UK Film

                                  Turnover         %           Turnover          %           Turnover         %           Turnover          %           Turnover          %

London                      1,628,593         65.9          954,103         75.3       2,774,962          96.6         529,791         52.0       5,887,449             77.2
South East                    445,914         18.0          150,619         11.9          48,811           1.7               c            c               c                c
South West                     77,038          3.1           28,362          2.2           2,335           0.1               c            c               c                c
North West                     76,356          3.1           24,118          1.9           6,957           0.2               c            c               c                c
East of England                71,910          2.9           29,730          2.3          26,961           0.9          27,571          2.7         156,172              2.0
Scotland                       61,294          2.5           15,858          1.3           2,250           0.1           7,357          0.7          86,759              1.1
Yorkshire and
The Humber                    31,088   1.3                  12,284   1.0                      c     c                   9,166   0.9                      –     –
Wales                         19,380   0.8                  12,653   1.0                      c     c                       c     c                      c     c
East Midlands                 18,361   0.7                   6,467   0.5                      c     c                       c     c                      c     c
West Midlands                 16,543   0.7                   6,735   0.5                  4,708   0.2                       c     c                      c     c
Northern Ireland              13,966   0.6                   3,931   0.3                      c     c                  28,562   2.8                      c     c
North East                    10,680   0.4                  22,179   1.8                      c     c                       c     c                      c     c
Total UK                   2,471,123 100.0               1,267,039 100.0              2,872,355 100.0               1,019,372 100.0              7,629,889 100.0
Source: Office for National Statistics.
‘c’ Indicates the data have been made confidential by ONS to avoid disclosing details of individual companies.
The geographic distribution of turnover is given by the location of the company, not its local units, so London concentration may be overstated for companies such as
cinema chains that have local units around the UK.
Data as at March 2009, for business enterprises.


166 – UK Film Council Statistical Yearbook 2010
1


                                                                                                                                                                            2


19.4 Leading film companies in the UK and Europe                                                                                                                            3

Table 19.10 shows the top 14 film companies in the UK in 2008 as identified by the European Audiovisual
Observatory. Several features stand out – the prominence of the US majors, the importance of undertaking multiple
activities (production, distribution, rights, video) and the relatively high position of companies specialising in video                                                    4
and exhibition. There is only one UK theatrical distributor on the list (Entertainment), one UK film finance company
(Ingenious) and no stand-alone UK film production companies.
                                                                                                                                                                            5

Table 19.10 Top 14 film companies in the UK, 2008
Rank     Company                                                                                                                     Activities   Operating revenues €000
                                                                                                                                                                            6
 1       Walt Disney International                                                                   DISFILM, DISTV, RIGHTS, VID                          *1,535,974
 2       Odeon and UCI Cinemas Group                                                                                         EXH                             574,134
 3       Cineworld Group                                                                                                     EXH                             313,725        7

 4       VUE Entertainment Holdings (UK)                                                                                     EXH                             298,006
 5       20th Century Fox Home Entertainment                                                                                  VID                           *287,728
                                                                                                                                                                            8
 6       Warner Bros Entertainment UK                                                                        DISFILM, PRODFILM                               267,214
 7       2 Entertain                                                                                                          VID                            258,565
 8       Universal Pictures Productions                                                              RIGHTS, DISFILM, PRODFILM                               251,981        9

 9       Ingenious Film Partners                                                                             PRODFILM, INVFILM                              *202,882
10       Paramount Home Entertainment (UK)                                                                                    VID                            159,259
                                                                                                                                                                            10
11       The Entertainment Group of Companies                                                                       DISFILM, VID                            *145,153
12       Sony Pictures Home Entertainment                                                                                     VID                           *124,836
13       Universal Pictures International                                                                                     VID                            100,014        11

14       20th Century Fox Film Company                                                                                   DISFILM                             *92,985
Source: European Audiovisual Observatory, 2009 Yearbook.
*Indicates 2007 revenues.                                                                                                                                                   12

Definitions:
DISFILM = film distribution; DISTV = television distribution, RIGHTS = trade in television rights; VID = video; EXH = exhibition; PRODFILM = film production; INVFILM =
film investment.                                                                                                                                                            13

Across Europe, the US majors were prominent. They were joined by four French companies (Pathé, Europalaces,
Canal+ and UGC), indicating the continued corporate strength of the French film industry, three British-based
                                                                                                                                                                            14
exhibitors (Odeon, Cineworld and VUE), a Swedish distributor (Egmont Nordisk), an Italian producer (RAI), a Dutch
producer/distributor (Embassy Eagle), a British video distributor (2 Entertain) and a German producer/distributor
(Constantin Film/AG) (Table 19.11).
                                                                                                                                                                            15


                                                                                                                                                                            16


                                                                                                                                                                            17


                                                                                                                                                                            18


                                                                                                                                                                            19


                                                                                                                                                                            20


                                                                                                                                Chapter 19: Film industry companies – 167
                                                                                                                                                                            21
Table 19.11 Top 20 film companies in Europe, 2008
                                                                                                                                                         Operating revenues
Rank     Company                                                                                                             Activities     Country                    €000

 1       Walt Disney International                                                  DISFILM, DISTV, RIGHTS, VID                                 UK          *1,535,974
 2       Groupe Pathé                                                   EXH, DISFILM, VID, RIGHTS, PRODFILM, TV                                 FR             770,000
 3       Odeon and UCI Cinemas Group                                                                         EXH                                UK             574,134
 4       Egmont Nordisk Film                                                                        DISFILM, VID                                SE             472,000
 5       Europalaces                                                                                         EXH                                FR             468,000
 6       Warner Bros Entertainment Spain                                                                 DISFILM                                ES            *407,571
 7       Groupe Canal+                                                               PROD, DISFILM, RIGHTS, VID                                 FR           **394,000
 8       UGC                                                              EXH, DISFILM, VID, RIGHTS, PRODFILM,                                  FR             384,092
 9       RAI Cinema                                                                            PRODFILM, RIGHTS                                  IT            373,851
10       Warner Bros Entertainment Germany                                                               DISFILM                                DE             338,843
11       Universal Pictures International                                                           VID, DISFILM                                NL            *335,872
12       Cineworld Group                                                                                     EXH                                UK             313,725
13       VUE Entertainment Holdings (UK)                                                                     EXH                                UK             298,006
14       Embassy Eagle Holdings                                                               PRODFILM, DISFILM                                 NL            *289,894
15       20th Century Fox Home Entertainment                                                                  VID                               UK            *287,728
16       Warner Bros Entertainment UK                                                                    DISFILM                                UK            *267,214
17       2 Entertain                                                                                          VID                               UK             258,565
18       United International Pictures                                                                   DISFILM                                NL             268,458
19       Universal Pictures Productions                                              RIGHTS, DISFILM, PRODFILM                                  UK             251,981
20       Constantin Film                                                             PRODFILM, DISFILM, RIGHTS                                  DE             251,324
Source: European Audiovisual Observatory, 2009 Yearbook, Table T.16.1.
*Indicates 2007 revenues.
**Indicates 2004 revenues.

Definitions:
DISFILM = film distribution; DISTV = television distribution, RIGHTS = trade in television rights; VID = video; EXH = exhibition; PRODFILM = film production;
TV = television.


19.5 Leading film production companies in the UK and Europe
Looking at film production only, we see that 11 out of the top 20 European independent production companies
in 2008 were French (up from nine in 2007), four Italian, two German, two Nordic, and one British. As in previous
years, the list was topped by Constantin Film AG of Germany, the maker of Perfume, Downfall and the Fantastic Four
and Resident Evil films. Europacorp (France) and Filmauro (Italy) came second and third. The UK is under-represented
in this table due to the frequent use of special purpose vehicles (companies set up to make a single film) and the US
studio connections of a number of the UK’s leading production companies.


168 – UK Film Council Statistical Yearbook 2010
1


                                                                                                                                  2


Table 19.12 Top 20 independent film production companies in Europe, 2008                                                          3
                                                                                                            Operating revenues
Rank     Company                                                                              Nationality                 €000

 1       Constantin Film AG                                                                         DE            248,500         4
 2       EuropaCorp                                                                                  FR           207,318
 3       Filmauro                                                                                     IT         *121,994
                                                                                                                                  5
 4       Gaumont                                                                                     FR           105,100
 5       Nordisk Film AS                                                                            NO            *98,700
 6       Ingenious Film Partners LLP                                                                UK            *97,930         6
 7       Pathé Production                                                                            FR           *90,357
 8       Odeon Film AG                                                                              DE             89,768
 9       AB Svensk Filmindustri                                                                      SE            78,890         7

10       Cattleya                                                                                     IT           62,979
11       Fidélité Films                                                                              FR           *62,202
                                                                                                                                  8
12       La Petite Reine                                                                             FR           *56,840
13       Galatée Films                                                                               FR            54,570
14       Fandango                                                                                     IT          *40,227         9

15       Pan Européenne Production                                                                   FR          **37,301
16       Produire à Paris                                                                            FR            36,518
                                                                                                                                  10
17       MK2 SA                                                                                      FR            36,335
18       Melampo Cinematografica                                                                      IT           36,034
19       UGC YM                                                                                      FR            35,765         11

20       Pulsar Productions                                                                          FR            33,649
Source: European Audiovisual Observatory, 2009 Yearbook, Table T.16.3.
*Indicates 2007 revenues.                                                                                                         12
**Indicates 2006 revenues.

Drawing on the UK Film Council’s production database and public information, Table 19.13 presents the top
                                                                                                                                  13
16 production companies involved in the production of films in the UK over the three-year period 2007 to 2009.
Film and Music Entertainment came top of the list with 10 films, followed by Matador Pictures with eight and
Working Title and Revolution Films with seven each.
                                                                                                                                  14
Table 19.13 also illustrates the range of budgets for UK films. At the low end, Warp X and Slingshot were each
involved in the production of four films with an estimated combined budget of £4 million. At the upper end, Heyday
Films, working with Warner Bros (UK) on the Harry Potter films, was involved in four productions with a combined                  15
budget of several hundred million pounds.


                                                                                                                                  16


                                                                                                                                  17


                                                                                                                                  18


                                                                                                                                  19


                                                                                                                                  20


                                                                                      Chapter 19: Film industry companies – 169
                                                                                                                                  21
Table 19.13 Top 16 production companies involved in UK production, 2007–2009
                                                          Estimated
                                                          combined
                                                             budget
Production company                     Number of films     £ million                                                                                     Selected titles

Film and Music                                    10            12                                   White Lightnin’, Donkey, Mission London,
Entertainment                                                                            Reykjavik Whale Watching Massacre, The Italian Key
Matador Pictures                                    8           17                      Book of Blood, The Last Princess, Wild Target, Dread,
                                                                                                                         Jackboots on Whitehall
Working Title Films                                 7         170                         Green Zone, The Soloist, Wild Child, Nanny McPhee
                                                                                                       and the Big Bang, The Boat That Rocked
Revolution Films                                    7           20                             The Killer Inside Me, Genova, Red Riding 1974,
                                                                                                                   1980 and 1983, The Unloved
Vertigo Films                                       6           13                             Bronson, The Firm, StreetDance 3D, The Heavy
Palm Tree Entertainment                             6            5                     Sisters Grimm, Back Burner, Inside Out, Seven Crosses
Fragile Films                                       5           30                                                      Easy Virtue, Dorian Gray,
                                                                                                   St Trinian’s 2: The Legend of Fritton’s Gold,
Celador Films                                       5           20                Slumdog Millionaire, Centurion, The Scouting Book for Boys
Black and Blue Films Ltd                            5            8                          Devil’s Playground, Dead Cert, Just for the Record
Heyday Films Ltd                                    4            *                       The Boy in the Striped Pyjamas, Harry Potter and the
                                                                                      Half-Blood Prince, Harry Potter and the Deathly Hallows
The Weinstein Company                               4           90                                           Nine, The King’s Speech, Shanghai
Potboiler Productions                               4           24                                            Blindness, Happy-Go-Lucky, Slave
Ruby Films                                          4           14                                         Tamara Drewe, Chatroom, Fish Tank
Sixteen Films                                       4           14                                        Route Irish, Looking for Eric, Summer
Warp X Films                                        4            4                                          Hush, Donkey Punch, She a Chinese
Slingshot Productions                               4            4                                          Tormented, French Film, Faintheart
Source: UK Film Council.
Companies ranked by number of films produced, then by estimated combined budget.
‘Estimated combined budget’ is the sum of the estimated budgets of all the films associated with the named company. It is not a measure of that company’s contribution
to the budget. Most films had a number of production companies associated with them and funding came from a variety of sources including equity investment, US studio
investment, distributor minimum guarantees and television pre-sales.
The table includes all those companies associated with four or more films over the three-year period.
*The estimated combined budget of Heyday’s films is in the order of several hundred million pounds, but the estimate has been omitted to avoid disclosing the budgets
of individual Harry Potter films.


„
 3F
   or Film4 and BBC Films see Chapter 17 (page 143)
 3F
   or film production company activity levels in 2009 see Chapter 16 (page 132)
 3
  For US studio involvement in UK film production in 2009 see Chapter 16 (page 132)
 3
  For leading film distributors in the UK in 2009 see Chapter 8 (page 60)
 3F
   or leading film exhibitors in the UK in 2009 see Chapter 9 (page 65)
 3F
   or numbers and size distribution of film workplaces in 2008 see Chapter 21 (page 182)


170 – UK Film Council Statistical Yearbook 2010
Chapter 20:
The UK film economy


The film industry is significant   Facts in focus

in the UK economy, making          • n 2008, the UK film industry had a total turnover
                                     I
                                     of £6.8 billion.
a substantial contribution to      • ts direct contribution to UK GDP was £3.1 billion,
                                     I
Gross Domestic Product (GDP)         0.2% of the total.

and the balance of payments.       •  he core UK film industry (film production plus
                                     T
                                     distribution and exhibition of UK films) contributed
Film exports hit an all time         £1.6 billion directly to GDP and £4.6 billion including
high of £1.3 billion in 2008,        all indirect effects.

generating a trade surplus         •  he UK facilities sector had a turnover of £403 million
                                     T
                                     derived from film in 2008.
of £494 million.                   •  he industry exported £1,341 million worth of services
                                     T
                                     in 2008, made up of £792 million in royalties and
                                     £549 million in film production services.
                                   •  xports in 2008 were 92% higher than in 2001.
                                     E
                                   •  he UK film trade surplus in 2008 was £494 million.
                                     T
20.1 Film industry turnover, 1995–2008
Figure 20.1 shows the total turnover of the UK’s film sectors (production, distribution and exhibition) for the period
1995 to 2008. Each of the three sectors has shown strong growth over this period, with the total industry turnover
increasing from £2 billion in 1995 to £6.8 billion in 2008.

Figure 20.1 Total turnover of UK film industry by sector, 1995–2008
£ million
8,000

7,000

6,000

5,000

4,000

3,000

2,000

1,000

    0                 1995      1996      1997     1998     1999      2000      2001     2002      2003     2004      2005      2006     2007      2008         % change
                                                                                                                                                               1995–2008
    Film and            829    1,514     1,612    1,306     1,589    2,334     1,402    1,389     2,119     2,281    2,280     3,693     2,852    2,579            211.1
    video
    production
    Film and            895    1,385     1,328    1,521     1,555    1,494     1,271    1,721     1,718     2,030    2,450     2,125     2,105    3,069            242.9
    video
    distribution
    Film                329      420       527      485       485      519       828      871       987     1,065    1,065       976     1,022    1,143            247.4
    exhibition
    Total            2,053     3,319     3,467    3,312     3,629    4,347     3,501    3,981     4,824    5,376     5,795     6,794    5,979     6,791            230.8

Source: Office for National Statistics (ONS) Annual Business Inquiry.
Notes:
‘Total turnover’ is expressed in current values, ie not adjusted for inflation.
For 1995–2007 data are for 2003 SICs 9211 (film and video production), 9212 (film and video distribution) and 9213 (film exhibition).
For 2008, film and video production is the sum of 2007 SICs 59111 (film production), 59112 (video production) and 5912 (film, video and TV post-production),
film and video distribution is the sum of 59131 (film distribution) and 59132 (video distribution) and film exhibition is 5914 (film exhibition).
SIC stands for Standard Industrial Classification.


The introduction of the 2007 Standard Industrial Classifications (SICs) makes possible a more detailed breakdown
of the sector, as shown in Table 20.1. This gives an official measure of film production and distribution separate from
video production and distribution, and confirms that film production and distribution make up the majority of the
sector. However, it is interesting to note the size of the post-production sector (16% of turnover) previously included
in the film and video production total.


172 – UK Film Council Statistical Yearbook 2010                                                  Image: Harry Potter and the Deathly Hallows: Part I © 2010 Warner Bros.
                                                                                                                Entertainment Inc. Harry Potter Publishing Rights © J.K.R.
1


                                                                                                                                                                             2


Table 20.1 Total turnover of UK film industry by sector, 2008, £ million                                                                                                     3
Sub-sector                                                                                                                              Turnover                % of total

Film production                                                                                                                         1,197*                    17.6
                                                                                                                                                                             4
Video production                                                                                                                          304                      4.5
Film, video and TV post-production                                                                                                      1,078                     15.9
Film distribution                                                                                                                       2,895                     42.6       5
Video distribution                                                                                                                        174                      2.6
Film exhibition                                                                                                                         1,143                     16.8
Sector total                                                                                                                            6,791                    100.0       6

Source: ONS Annual Business Inquiry.
Notes:
Companies in the post-production sector usually work on films, commercials, videos and television programmes and therefore have a combined statistical classification.       7
*The turnover shown for film production is lower than the equivalent figure in Table 19.3 (£2.5 billion) taken from the Interdepartmental Business Register (IDBR). The
Annual Business Inquiry estimate is based on a relatively small sample of companies, whereas the IDBR number comes from HMRC data on VAT and PAYE. There is a case
therefore for preferring the higher IDBR estimate. This would add £1.3 billion to the above estimate of industry turnover.
                                                                                                                                                                             8
The total industry turnover expressed in real terms, ie with the effects of inflation removed, is shown in Figure 20.2.
The real increase has been large: 124% for film and video production, 147% for film and video distribution and
150% for film exhibition. Overall, the industry more than doubled in size in real terms over this period.
                                                                                                                                                                             9


Figure 20.2 Inflation-adjusted turnover of UK film industry by sector, 1995–2008
£ million (2008 pounds)                                                                                                                                                      10
8,000

7,000

6,000                                                                                                                                                                        11

5,000

4,000                                                                                                                                                                        12
3,000

2,000
                                                                                                                                                                             13
1,000

    0                  1995     1996      1997      1998      1999      2000    2001      2002      2003     2004      2005      2006     2007      2008      % change
                                                                                                                                                             1995–2008
                                                                                                                                                                             14
    Film and        1,152.6 2,031.4 2,104.3 1,667.8 1,987.5 2,885.2 1,697.0 1,630.8 2,413.7 2,534.3 2,482.8 3,912.4 2,936.8 2,579.0                                123.8
    video
    production
    Film and        1,244.3 1,858.3 1,733.5 1,942.4 1,945.0 1,846.8 1,538.4 2,020.6 1,956.9 2,255.5 2,667.9 2,251.3 2,167.6 3,069.0                                146.6
                                                                                                                                                                             15
    video
    distribution
    Film              457.4     563.5     687.9    619.4     606.6     641.6 1,002.2 1,022.6 1,124.3 1,183.3 1,159.7 1,034.0 1,052.4 1,143.0                       149.9
    exhibition
                                                                                                                                                                             16
    Total           2,854.3 4,453.3 4,525.8 4,229.6 4,539.1 5,373.5 4,237.7 4,674.0 5,494.9 5,973.1 6,310.4 7,197.6 6,156.9 6,791.0                                137.9

Source: ONS Annual Business Inquiry, HM Treasury.
Notes:
The deflator used to calculate real values is the UK whole economy deflator.                                                                                                 17
Values expressed in constant 2008 pounds.
For sector classifications, see notes to Figure 20.1.


                                                                                                                                                                             18


                                                                                                                                                                             19


                                                                                                                                                                             20


                                                                                                                                  Chapter 20: The UK film economy – 173
                                                                                                                                                                             21
20.2 Film industry contribution to GDP, 1995–2008
The contribution an industry makes to UK Gross Domestic Product is measured by its gross value added (GVA).
‘Value added’ is industry turnover minus the cost of inputs bought from other industries. The main components
of value added are wages and salaries, interest and company profits. Value added is therefore a measure of the
industry’s ability to generate income for its workers, company owners and investors.
The industry’s total value added increased from £956 million in 1995 to £3.1 billion in 2008. This is 0.2% of the
UK’s total GDP. All three sub-sectors showed substantial growth over the 14-year period, with the production sector
showing the biggest gain.
In 2008, production accounted for 34% of value added, distribution 53% and exhibition 13%.

Figure 20.3 UK film industry gross value added, 1995–2008
£ million
4,000

3,500

3,000

2,500

2,000

1,500

1,000

  500

    0                   1995      1996      1997      1998       1999      2000      2001   2002    2003    2004    2005    2006    2007    2008     % change
                                                                                                                                                    1995–2008
    Film and             299       663       758        525       805     1,032       514    562     983    1,032   1,035   1,957   1,172   1,051       251.5
    video
    production
    Film and             522       829       638        784       716       582       689    760     520     841    1,072   1,232    964    1,618       210.0
    video
    distribution
    Film                 135       208       264        260       266       250       354    504     592     592     600     407     403     403        198.5
    exhibition
    Total                956     1,700     1,660     1,569      1,787     1,864     1,557   1,826   2,095   2,465   2,707   3,596   2,539   3,072       221.3

Source: ONS Annual Business Inquiry.
Note: ‘Gross value added’ is expressed in actual values, ie not adjusted for inflation.


Table 20.2 shows the gross value added breakdown by 2007 SICs. Film accounted for the majority of the sector
contribution, with distribution particularly high at £1.5 billion, 49% of the total.


174 – UK Film Council Statistical Yearbook 2010
1


                                                                                                                                                                            2


Table 20.2 UK film and video industry gross value added, 2008, £ million                                                                                                    3
Sub-sector                                                                                                                              Turnover               % of total

Film production                                                                                                                           316                    10.3
                                                                                                                                                                            4
Video production                                                                                                                          198                     6.4
Film, video and TV post-production                                                                                                        537                    17.5
Film distribution                                                                                                                       1,518                    49.4       5
Video distribution                                                                                                                        100                     3.3
Film exhibition                                                                                                                           403                    13.1
Sector total                                                                                                                            3,072                   100.0       6

Source: Office for National Statistics, Annual Business Inquiry.
Note: Companies in the post-production sector usually work on films, commercials, videos and television programmes and therefore have a combined statistical
classification.                                                                                                                                                             7

Figure 20.4 shows the industry’s value added expressed in real terms, ie with the effects of inflation removed.
There was a sharp increase in real industry GVA in 1995–1996, followed by a plateau from 1996 to 2002. Real GVA
                                                                                                                                                                            8
then began to increase strongly again, reaching a peak of £3.7 billion in 2006. Real GVA was £3.1 billion in 2008,
131% higher than in 1995.

                                                                                                                                                                            9
Figure 20.4 UK film industry real gross value added, 1995–2008
£ million (2008 pounds)
4,500
                                                                                                                                                                            10
4,000

3,500

3,000                                                                                                                                                                       11
2,500

2,000
                                                                                                                                                                            12
1,500

1,000

  500
                                                                                                                                                                            13
    0                  1995     1996      1997      1998      1999      2000         2001   2002    2003    2004     2005      2006      2007      2008     % change
                                                                                                                                                           1995–2008
    Film and          415.7     889.6     989.5    670.5 1,006.9 1,275.7         622.2      659.8 1,119.7 1,146.6 1,127.1 2,073.3 1,206.9 1,051.0                152.8
    video                                                                                                                                                                   14
    production
    Film and          725.7 1,112.3       832.8 1,001.2      895.6     719.4     834.0      892.3   592.3   934.4 1,167.3 1,305.2       992.7 1,618.0            122.9
    video
    distribution                                                                                                                                                            15
    Film              187.7     279.1     344.6    332.0     332.7     309.0     428.5      591.7   674.3   657.7    653.4    431.2     415.0      403.0         114.7
    exhibition
    Total           1,329.1 2,281.0 2,166.9 2,003.7 2,235.2 2,304.2 1,884.6 2,143.8 2,386.3 2,738.8 2,947.8 3,809.6 2,614.5 3,072.0                              131.1
                                                                                                                                                                            16
Source: ONS Annual Business Inquiry, HM Treasury.
Note: The deflator used to calculate real values is the UK whole economy deflator.
Values expressed in constant 2008 pounds.

                                                                                                                                                                            17


                                                                                                                                                                            18


                                                                                                                                                                            19


                                                                                                                                                                            20


                                                                                                                                Chapter 20: The UK film economy – 175
                                                                                                                                                                            21
20.3 Economic impact of the film industry
In June 2010 the UK Film Council and Pinewood Shepperton plc published an updated report from Oxford Economics
on the economic impact of the UK film industry. This report, the third in a series, examined not only the direct impact
but also indirect contributions, such as those to supplier industries, tourism, culture, merchandising, trade and the
promotion of the UK internationally.
The study focused in particular on the ‘core UK film industry’, defined as film production in the UK plus the
distribution and exhibition of UK films. The analysis showed that the core UK film industry contributed £1.6 billion
directly to UK GDP in 2009, with a direct contribution to the Exchequer of £445 million. This GDP contribution rose
to £4.6 billion when all indirect effects were taken into account, as shown in Table 20.3.

Table 20.3 Economic contribution of the core UK film industry, 2009
                                                                                                                                         Total contribution
                                                                                                                Total contribution            to Exchequer              Employment
                                                                                                               to UK GDP in 2009          revenues in 2009                   impact
Channel of impact                                                                                                       (£ million)              (£ million)                in 2009

Direct                                                                                                                    1,594                      445                  36,000
Multiplier effects                                                                                                        1,714                      425                  36,000
British film box office effect                                                                                               59                       18                     350
Tourism                                                                                                                     950                      210                  20,000
Promotion/trade                                                                                                              20                        5                     700
Merchandising                                                                                                               237                      107                   6,600
Total                                                                                                                     4,574                    1,210                  99,650
Source: Oxford Economics.
Notes:
‘Multiplier effects’ means the effects on other industries such as suppliers.
‘British film box office effect’ is the amount that the total UK box office is raised by the presence of UK films. It is different from and less than the UK film box office share.

A copy of the report can be found on the UK Film Council’s website –
www.ukfilmcouncil.org.uk/media/pdf/i/r/The_Economic_Impact_of_the_UK_Film_Industry_-_June_2010.pdf


20.4 The UK facilities sector
The facilities sector provides essential inputs to film production, encompassing activities from provision of studio
space and equipment hire to visual effects and post-production. During 2008–2009, UK Screen, the facilities
sector trade body, carried out the first ever economic study of the sector, publishing the results in January 2010.
These showed that the UK facilities sector had a total turnover in 2008 of £2.2 billion, with equipment hire being
the largest sub-sector (21% of the total) followed by visual effects and graphics (17%) and picture post-production
(15%) as shown in Table 20.4.


176 – UK Film Council Statistical Yearbook 2010
1


                                                                                                                                      2


Table 20.4 Turnover of UK facilities sector, 2008                                                                                     3
Segment                                                                                        Turnover £000s            % of total

Hire (camera, lighting, equipment)                                                               461,010                    20.9
                                                                                                                                      4
Visual effects and graphics (VFX)                                                                376,360                    17.1
Picture post-production                                                                          333,650                    15.1
Transmission, network and support services                                                       305,940                    13.9      5
Studios                                                                                          188,890                     8.6
Audio post-production                                                                            157,990                     7.2
Outside broadcast                                                                                139,880                     6.3      6

Access services                                                                                   95,180                     4.3
Other                                                                                             77,520                     3.5
                                                                                                                                      7
Physical special effects (SFX)                                                                    68,120                     3.1
Total facilities sector                                                                        2,204,540                   100.0
Source: UK Screen, Trends Business Research (TBR), Olsberg SPI.                                                                       8


Table 20.5 shows that roughly half the activity of the facilities sector was television-related, but film provided the
second largest share of revenue (18.3%).                                                                                              9


Table 20.5 Turnover of facilities sector by market, 2008
                                                                                                                                      10
Segment                                                                                        Turnover £000s            % of total

Television                                                                                     1,142,580                    51.8
Film                                                                                             403,250                    18.3      11
Commercials                                                                                      401,140                    18.2
Corporate                                                                                        171,590                     7.8
                                                                                                                                      12
Promos                                                                                            56,580                     2.6
Other                                                                                             24,700                     1.1
Games                                                                                              4,600                     0.2      13
Total facilities sector                                                                        2,204,540                   100.0
Source: UK Screen, TBR, Olsberg SPI.
                                                                                                                                      14
Other findings were that inward investment features accounted for 68% of film facilities turnover in 2008 and that
31% of film facilities turnover was generated by exports, with the USA being the leading export market.
A full copy of the report can be obtained from UK Screen and a summary of findings can be found at the following                      15
link – www.ukfilmcouncil.org.uk/publications/facilities

                                                                                                                                      16


                                                                                                                                      17


                                                                                                                                      18


                                                                                                                                      19


                                                                                                                                      20


                                                                                              Chapter 20: The UK film economy – 177
                                                                                                                                      21
20.5 Film exports, 1995–2008
The UK film industry exported £1,341 million worth of services in 2008 (the latest year for which data are available),
£792 million of which came from royalties and £549 million from film production services. Compared with 2007, both
categories increased significantly. Film exports in 2008 were 92% higher than in 2001 as can be seen in Figure 20.5.

Figure 20.5 UK film exports, 1995–2008
£ million
1,600

1,400

1,200

1,000

  800

  600

  400

  200

    0                  1995       1996       1997        1998       1999       2000       2001       2002       2003       2004        2005       2006       2007       2008


    Royalties           560         686        438        427        508        487        468        434         400        399        660        582        646        792
    Film                227         202        212        154        145        210        232        222         233        444        307        330        403        549
    production
    services
    Total film          787        888         650        581        653        697        700        656        633         843        967        913      1,050      1,341
    company
    exports

Source: ONS.
Notes:
Data for 2009 will be available in December 2010.
The export data are derived from the ONS Film and Television Survey (2008) which is a sample survey with a high response rate (87%) of companies in the Inter
Departmental Business Register in the Standard Industrial Classification codes relating to film and television. The above chart shows the results for film companies only.


20.6 Film imports, 1995–2008
Film imports have been fairly constant since 2005, increasing by only £42 million, which is within the margin of
error of the survey. Until 2006, the vast majority of imports were royalties, with film production imports accounting
for only around 15% of total film imports. In 2007 and 2008, this pattern changed, with the royalty share dropping
to 60% and the production share increasing to 40%. The reasons for this are unclear as the reported level of
production imports is high in relation to total UK film production for these years (see Chapter 16). One possible
explanation could be the categorisation of the non-UK spend of UK/USA inward investment productions as imports
of production services. However, this explanation cannot be confirmed as the survey returns are confidential.


178 – UK Film Council Statistical Yearbook 2010
1


                                                                                                                                                                         2


Figure 20.6 UK film imports, 1995–2008                                                                                                                                   3
£ million
900

800
                                                                                                                                                                         4
700

600

500                                                                                                                                                                      5

400

300
                                                                                                                                                                         6
200

100

  0                    1995      1996       1997      1998       1999       2000       2001      2002       2003       2004      2005       2006       2007       2008
                                                                                                                                                                         7

      Royalties         489       507        419        374       317        497        405        403       430        616        704        698       573        510
      Film              192       145        106         63        58        113         50         67       108        136        100         86       245        336
      production                                                                                                                                                         8
      services
      Total film        681       652        525        437       375        610       455        470        538        752        804        784       818        846
      company
      imports
                                                                                                                                                                         9
Source: ONS.
See notes to Figure 20.5.

                                                                                                                                                                         10

20.7 The film trade balance, 1995–2008
The film industry has made a continuous positive contribution to the UK balance of payments since 1995, with                                                             11
a trade surplus (positive balance of exports over imports) in 2008 of £494 million, as Figure 20.7 shows. This is
significant at a time when the UK’s physical trade is showing a large deficit and helps explain the Government’s
support for creative industries such as film.                                                                                                                            12


Figure 20.7 Trade surplus of UK film industry, 1995–2008
£ million                                                                                                                                                                13
600


500
                                                                                                                                                                         14

400


300                                                                                                                                                                      15


200

                                                                                                                                                                         16
100


  0                    1995      1996       1997      1998       1999       2000       2001      2002       2003       2004      2005       2006       2007       2008
                                                                                                                                                                         17
      Balance           106       236        125        144       278         87        245        186         95        91        163        128       232        494

Source: ONS.
Note: ‘Trade surplus’ equals exports minus imports. Where a company (eg the UK subsidiary of a US major) receives income from another country on behalf of its parent
                                                                                                                                                                         18
company and subsequently passes it on to its parent company, this is recorded both as a receipt and a payment, leaving the measure of the trade surplus unaffected.


                                                                                                                                                                         19


                                                                                                                                                                         20


                                                                                                                                 Chapter 20: The UK film economy – 179
                                                                                                                                                                         21
20.8 Film export markets                                                       20.9 UK film exports compared with the
                                                                               global market for filmed entertainment
Figure 20.8 shows the geographic distribution of UK film
exports for the years 2004–2008. The leading export                            A useful comparison can be made between UK film
destinations were the USA (52%), followed by the                               export shares and the geographical distribution of
European Union (21%) and ‘other Europe’ (9%).                                  the global market for filmed entertainment (Figure
Asia took 5% and the rest of the world 12% of the total.                       20.9). For the EU, USA and ‘Rest of the world’ UK
                                                                               exports are roughly proportional to the size of the
                                                                               filmed entertainment market in each of those regions.
Figure 20.8 Destination of UK film exports
                                                                               The differences that stand out are:
as percentage of the total, 2004–2008
                                                                               •	  he higher proportion of UK exports to ‘other Europe’
                                                                                  T
   European Union                      21.0%                                      (9% against a 3% ex-UK global market share);
   Other Europe                         9.4%                                   •	  he lower proportion of UK exports to Asia (5%)
                                                                                  T
   USA                                 52.0%                                      compared with the Asian countries’ share of the
   Asia                                 5.4%                                      ex-UK global market (22%).
   Rest of the world                   12.2%                                   The latter discrepancy reflects the strength of the main
                                                                               Asian countries (Japan, China, South Korea and India)
                                                                               in their own markets and the consequent lower market
                                                                               shares for Hollywood and UK films.
Source: ONS.
Note: ‘Rest of the world’ cannot be disaggregated due to sampling variation
and disclosive data.


Figure 20.9 UK export shares 2004–2008 compared with the ex-UK global market for filmed entertainment, 2009
% share
60.0


50.0


40.0


30.0


20.0


10.0


   0                     European Union              Other Europe             USA                Asia          Rest of the world     Total


    % of total                  21.0                        9.4               52.0               5.4                 12.2          100.0
    UK film exports
    % of total ex-UK            20.1                        3.0               43.3              22.3                 11.4          100.0
    global filmed
    entertainment
    market

Sources: UK exports: ONS. Global market: PricewaterhouseCoopers.
Note: Totals may not sum to 100 due to rounding.


180 – UK Film Council Statistical Yearbook 2010
1


                                                                                                                                  2


20.10 The geographical distribution of the UK’s film trade surplus                                                                3

The geographical distribution of the UK’s film trade surplus was different from the export pattern, as shown in
Table 20.6. In the years 2004–2008, almost one-third of the surplus came from ‘Other Europe’ while Asia accounted
for 15%. In contrast with some earlier years, the UK ran large film trade surpluses with the USA in 2007 and 2008                 4
which led to the USA accounting for 46% of the UK’s film trade surplus in 2004–2008.

                                                                                                                                  5
Table 20.6 International transactions of the UK film industry by geographical area, annual average, 2004–2008
                                                               Exports         Imports            Balance                   %
                                                              £ million       £ million          £ million             balance
                                                                                                                                  6
European Union                                                214.6           194.8               19.8                   8.9
Other Europe                                                   96.4            30.6               65.8                  29.6
USA                                                           532.0           428.8              103.2                  46.4      7
Asia                                                           54.8            22.2               32.6                  14.7
Rest of the world                                             125.0           124.2                0.8                   0.4
                                                                                                                                  8
Total                                                       1,022.8           800.6              222.2                 100.0
Source: Office for National Statistics.

                                                                                                                                  9


                                                                                                                                  10


                                                                                                                                  11


                                                                                                                                  12


                                                                                                                                  13


                                                                                                                                  14


                                                                                                                                  15


                                                                                                                                  16


                                                                                                                                  17


„
                                                                                                                                  18


  3F
    or more information on the UK and global film market see Chapter 13 (page 104)
                                                                                                                                  19
  3F
    or more information on the performance of UK films internationally see Chapter 6 (page 46)
  3F
    or more information on inward investment in film production in the UK see Chapter 16 (page 132)
  3F
    or details of public investment in film see Chapter 17 (page 143)
                                                                                                                                  20


                                                                                          Chapter 20: The UK film economy – 181
                                                                                                                                  21
Chapter 21:
Employment in the film
and video industries


The film and video industries         Facts in focus

employ a high proportion of           •  2,543 people worked in the film and video industries
                                        4
                                        in 2009, of whom 25,556 worked in film and video
skilled people but it is a volatile     production. This was an increase on 2008.
sector, with unpredictable            •  roduction and distribution were concentrated in
                                        P
                                        London and the South East.
peaks and troughs in
                                      •  lmost 60% of people in film and video production
                                        A
employment levels. Despite              were freelance.
the recession, 2009 saw an            •  omen made up 17% (17% in 2008) of the
                                        W
increase in employment in               screenwriters of UK films released in the UK in 2009
                                        and 17% (12% in 2008) of the directors.
production, distribution and          •  ost businesses were small scale. For example,
                                        M
exhibition.                             55% of employees in film and video production
                                        were in workplaces with 10 or fewer people.
1


                                                                                                                                                                        2


21.1 The workforce                                                                                                                                                      3


21.1.1 Labour Force Survey
                                                                                                                                                                        4
According to the Labour Force Survey (LFS) conducted by the Office for National Statistics (ONS), a total of 42,543
people worked in film and video production, distribution and film exhibition in the year 2009 (October 2008 –
September 2009). The figures include workers whose main jobs are in film and video production, distribution and                                                         5
film exhibition, and those with second jobs in these sectors. They also include both full-time and part-time workers.
Table 21.1 shows the breakdown.
                                                                                                                                                                        6
Table 21.1 Film and video industry workforce, 2009
Sector                                                                                                                                       Number in employment
                                                                                                                                                                        7
Film and video production                                                                                                                                 25,556
Film and video distribution                                                                                                                                2,951
Film exhibition                                                                                                                                           14,036        8
Total                                                                                                                                                     42,543
Source: Labour Force Survey, ONS.
Notes:                                                                                                                                                                  9
Numbers in employment are averages of the four calendar quarters, Oct–Dec 2008, Jan–Mar, Apr–Jun and Jul–Sep 2009.
People in employment include people aged 16 or over who did paid work (as an employee or self-employed), those who had a job that they were temporarily away from,
those on government supported training and employment programmes, and those doing unpaid family work.
                                                                                                                                                                        10

Changes to Labour Force Survey estimates
The LFS estimate of the numbers employed in film and video production in 2009 shows an increase of 2,000 over the
                                                                                                                                                                        11
2008 figure, which reverses the recent trend which has seen employment numbers decrease every year since 2003.
However, there are two important differences between the estimates relating to the years up to 2006 and those for
2007 onwards. First, the Standard Industrial Classification (SIC) changed recently and the data to 2006 are based on
                                                                                                                                                                        12
the old classification while data for 2007 onwards are based on the new classification. For film exhibition the two
classifications are directly comparable, but for film and video production and distribution some people would be
included in the figures for the earlier years, but not in the later ones. Secondly, the LFS weighting has changed.
The LFS collects information from a sample of the population, and in order to make estimates and inferences about                                                       13

the whole population, the data must be ‘weighted’, with the weights depending on the size of the sample and the
size of the population. ONS has recently carried out a reweighting of LFS data to make them consistent with revised
(increased) population estimates. Not all of the older LFS data have yet been reweighted, however. Data referring to                                                    14
years up to 2006 are based on the old weights, and data referring to 2007 onwards are based on the new weights.
The new weights will, in most instances, result in higher estimates.
                                                                                                                                                                        15


Employment in film and video production and distribution and film exhibition generally decreased between 2003
and 2006. Because of the changes to the data explained in the box, it is difficult to compare the data for years up                                                     16
to 2006 with the data for 2007 onwards. However, for all three sectors, the LFS estimates (Figure 21.1) indicate a
decrease in employment from 2007 to 2008, then an increase in 2009 (with 2009 levels being higher than the 2007
levels in both film and video production and film exhibition).
                                                                                                                                                                        17


                                                                                                                                                                        18


                                                                                                                                                                        19


                                                                                                                                                                        20


Image: Nowhere Boy courtesy of Icon Film Distribution                                                   Chapter 21: Employment in the film and video industries – 183
                                                                                                                                                                        21
Figure 21.1 Size of film and video workforce, 1996–2009

Number in employment
35,000

30,000

25,000

20,000

15,000

10,000

 5,000

       0             1996       1997      1998       1999      2000       2001      2002       2003       2004       2005         2006              2007    2008      2009


   Film and        17,705    23,819     26,255     22,407    23,396     31,271    31,565     31,620     29,222     26,974    25,802               23,797   23,535   25,556
   video
   production
   Film and         3,296      3,188     4,622      2,277      4,205     3,918      4,527     5,261      2,826      3,379     2,862                4,514    2,752    2,951
   video
   distribution
   Film            10,427    11,585     14,121     16,917    13,328     11,844    16,667     20,004     22,670     15,581    17,368               13,032   12,361   14,036
   exhibition

Source: Labour Force Survey, ONS.
Notes: The employment figures are averages of the four ‘calendar quarters’ (Oct–Dec, Jan–Mar, Apr–Jun and Jul–Sep), referred to as ‘year to September’.
In 2006, the European Commission required all countries in the EU to base their labour force surveys on calendar quarters.


Most people working in the film distribution and exhibition sectors were employees, but the film production sector
had a higher proportion of freelance workers. In 2009, 60% of those engaged in film and video production, a total
of 15,278 people, were self-employed (Table 21.2 and Figure 21.2).

Table 21.2 Film and video production workforce, 1996–2009
                                                                                                                                                                     Unpaid
                                                                     Total in                                    Self-employed                  Unpaid        family worker
Year                                                             employment            Self-employed              as % of total          family worker         as % of total

1996                                                               17,705                    7,539                      42.6                    215                    1.2
1997                                                               23,819                    9,313                      39.1                    488                    2.0
1998                                                               26,255                   13,276                      50.6                      –                      –
1999                                                               22,407                   10,776                      48.1                    422                    1.9
2000                                                               23,396                   10,764                      46.0                    107                    0.5
2001                                                               31,271                   12,201                      39.0                    705                    2.3
2002                                                               31,565                   14,885                      47.2                    305                    1.0
2003                                                               31,620                   17,406                      55.0                    111                    0.4
2004                                                               29,222                   15,406                      52.7                    251                    0.9
2005                                                               26,974                   11,382                      42.2                  1,076                    4.0
2006                                                               25,802                   12,687                      49.2                    502                    1.9

2007                                                               23,797                   11,026                      46.3                         –                    –
2008                                                               23,535                   11,769                      50.0                         –                    –
2009                                                               25,556                   15,278                      59.8                         –                    –
Source: Labour Force Survey, ONS.
Notes:
Year means the year ending September. See note to Figure 21.1 for explanation.
An ‘unpaid family worker’ is defined as a person who is doing unpaid work for a business that they own or that a relative owns.


184 – UK Film Council Statistical Yearbook 2010
1


                                                                                                                                                                            2


The proportion of self-employed workers has fluctuated mainly in the 40%–50% band between 1996 and                                                                          3
2006. For 2007 onwards, the proportion has been slightly higher on average, reaching 60% in 2009 (though the
proportion was as high as 55% in 2003). The figures shown for 2007 onwards are based on the new Standard
Industrial Classification, and so the higher average percentages of freelancers in the industry since 2007 could be
                                                                                                                                                                            4
due to changes in industry practices, the change in the classification or a combination of both. In comparison, only
14% of the total UK workforce was self-employed in the year to September 2009.
                                                                                                                                                                            5
Figure 21.2 Self-employed and unpaid family workers as proportions of total workforce,
film and video production, 1996–2009
% total in employment                                                                                                                                                       6
60


50
                                                                                                                                                                            7

40


30                                                                                                                                                                          8

20


10                                                                                                                                                                          9


 0                   1996      1997      1998      1999       2000      2001      2002       2003      2004      2005       2006               2007      2008      2009
                                                                                                                                                                            10
     Self-employed   42.6      39.1       50.6      48.1      46.0       39.0      47.2      55.0       52.7      42.2      49.2               46.3      50.0      59.8
     as % of total

     Unpaid family      1.2      2.0         –       1.9        0.5       2.3       1.0        0.4       0.9       4.0        1.9                  –         –         –
                                                                                                                                                                            11
     worker as %
     of total

Source: Labour Force Survey, ONS.
Notes: Year means the year ending September. See note to Figure 21.1 for explanation.                                                                                       12
Data for unpaid family workers were unavailable for 1998, 2007, 2008 and 2009 due to sampling, but numbers were likely to be small.


                                                                                                                                                                            13
21.1.2 Skillset’s Labour Market Intelligence and Employment Census
In view of the limitations of official labour market data in providing workforce size at sub-sector level, Skillset,
the Sector Skills Council for Creative Media, compiles its own workforce employment statistics for a number of                                                              14
sub-sectors of the creative industries. The latest Labour Market Intelligence (LMI) Digest for Film, published in 2009,
includes data from Skillset’s 2006 Employment Census of the creative media industries and the joint Skillset/UK Film
Council Feature Film Production Workforce Survey from 2008. Skillset has also published its 2009 Employment                                                                 15
Census of the creative media industries.
According to Skillset’s latest LMI Digest for Film, the UK film industry had a total workforce of 27,800 people.
The majority were working in exhibition (62% of total, 17,200 people), with 34% in production (9,500 people)                                                                16
and 4% (1,100 people) in distribution. Results from the more recent Employment Census of the creative media
industries estimate that 1,200 people worked in film distribution and 17,650 people worked in film exhibition
in 2009 (an estimate of the total workforce for film production is not available from this census, as there is no                                                           17
estimate for the number of freelancers).
The LMI and Employment Census workforce estimates for film production and distribution are not directly
                                                                                                                                                                            18
comparable with those from the LFS due to differences between the methodologies used by ONS and Skillset.
The LMI estimates are 37% and 38% of their LFS counterparts, for 2006, for film and video production and
distribution respectively. The LMI estimate for film exhibition is directly comparable to that from the LFS, and,
at 17,200 people, is similar to the equivalent figure for 2006 from the LFS (17,368). For 2009, the Employment                                                              19

Census estimate for distribution is 41% of the LFS estimate and the film exhibition estimate from the Employment
Census (17,650) is 26% higher than the LFS estimate (14,036).
                                                                                                                                                                            20


                                                                                                            Chapter 21: Employment in the film and video industries – 185
                                                                                                                                                                            21
21.2 The feature film production workforce survey
The Skillset/UK Film Council feature film production surveys aim to obtain reliable statistics on working patterns,
skills development needs, existing provision, and barriers experienced to receiving training and development.
Following a survey conducted in 2002, a second feature film workforce survey was carried out in 2006 and its final
results published in 2008. Here we report and contrast the main results on demographics and work patterns between
the two surveys. Full reports of both surveys are available from the Skillset website (see the end of the chapter).
Two-fifths of the 2006 survey respondents were women, with the female percentage varying widely by occupational
group, from 85% in make-up and hairdressing to 3% in construction, as Table 21.3 shows. There appears to be some
variation in the gender profiles between the two surveys. There were more female assistant directors (39%) but fewer
women working in editing, post-production and visual effects (26%) in 2006. Five per cent of the respondents in the
sound/electrical occupations were women compared to zero in 2002.

Table 21.3 Occupational group by gender, film production workforce, 2002 and 2006
                                                                                                  Respondents 2002            Respondents 2006

Occupational group                                                                    Male %              Female %   Male %          Female %

Production/script development                                                            34                    66      36                 64
Assistant directors                                                                      74                    26      61                 39
Art/set decorating/props                                                                 68                    32      55                 45
Camera                                                                                   91                     9      85                 15
Sound/electrical                                                                        100                     –      95                  5
Costume                                                                                  30                    70      20                 80
Make-up/hairdressing                                                                     12                    88      15                 85
Editing/post-production/visual effects                                                   58                    42      74                 26
Construction                                                                             95                     5      97                  3
Locations                                                                                76                    24      78                 23
Others                                                                                   70                    30      65                 35
All occupations                                                                          67                    33      60                 40
Source: Skillset.
Note: The percentages for male and female in some occupational groups may not add up to 100 due to rounding.

The challenge of reflecting the UK’s ethnic diversity in the film production industry is evident in Tables 21.4 and 21.5.
The ethnic profile of the respondents in 2006 was identical to that in the previous survey. Overall only 5% of the film
workforce was from minority groups, below the UK all-sectors average of 7% and well below the London workforce
average of 24%, which is a relevant comparator for the film industry in view of its concentration in London.


186 – UK Film Council Statistical Yearbook 2010
1


                                                                                                                                          2


Table 21.4 Ethnicity of UK film production workforce, 2002 and 2006                                                                       3
                                                                                                                                 All UK
                                                                           Respondents            Respondents               workforce
                                                                                 2002                   2006               (LFS, 2004)
Ethnic group                                                                        %                      %                          %   4
White                                                                               95                     95                     93
Mixed                                                                                2                      2                      1
                                                                                                                                          5
Asian or Asian British                                                               1                      1                      3
Black or black British                                                               1                      1                      2
Chinese                                                                              –                      –                      –      6
Other                                                                                1                      1                      1
Source: Skillset; ONS Labour Force Survey, quarterly supplement 2004.
                                                                                                                                          7


Table 21.5 Ethnicity of London film production workforce, 2002 and 2006
                                                                                London                 London              All London     8
                                                                            respondents            respondents              workforce
                                                                                  2002                   2006              (LFS, 2004)
Ethnic group                                                                         %                      %                       %

White                                                                               94                     93                     76      9

Mixed                                                                                3                      2                      1
Asian or Asian British                                                               1                      1                     11
                                                                                                                                          10
Black or black British                                                               1                      1                      8
Chinese                                                                              –                      1                      1
Other                                                                                1                      1                      3      11

Source: Skillset; ONS Labour Force Survey, quarterly supplement 2004.

The disabled proportion of the film production workforce increased slightly from 2% to 3%, as shown in Table 21.6,                        12
but is still less than the UK average of 5%.

Table 21.6 Disability, film production workforce, 2002 and 2006                                                                           13

                                                                                                                                 All UK
                                                                           Respondents            Respondents               workforce
                                                                                 2002                   2006               (LFS, 2005)    14
Workers who consider themselves to have a disability                                %                      %                          %

Yes                                                                                  2                      3                      5
No                                                                                  98                     97                     95      15
Source: Skillset; ONS Labour Force Survey, quarterly supplement 2005.

The age profile of the respondents in 2006 was somewhat more youthful than in the previous survey. The film                               16
production workforce was predominantly young, with 84% aged 49 or under (Table 21.7). The female age profile
was significantly younger than the male, with 90% of women being under the age of 49.
                                                                                                                                          17


                                                                                                                                          18


                                                                                                                                          19


                                                                                                                                          20


                                                                         Chapter 21: Employment in the film and video industries – 187
                                                                                                                                          21
More of the respondents in 2006 were between 16 and 24 years (8% compared with 3% in 2002). People in film
production appeared younger than in the wider workforce, with more than a third falling into the 25 to 34 year age
band in comparison with a fifth of the UK workforce as a whole. The increase in the female percentage in the 16–24
and 25–34 age groups is consistent with the slight growth overall in the female percentage of the workforce,
suggesting increased entry of younger women into film production.

Table 21.7 Age distribution of film production workforce, 2002 and 2006
                                                                                                                                          All UK
                                                                        Respondents 2002                       Respondents 2006   workforce (LFS,
                                                                                                                                  Nov 06–Jan 07)
Age group                                    Male %          Female %              All %   Male %   Female %              All %            All %

16–24                                               3             4                 3         7          9                 8                14
25–34                                              26            41                31        27         45                34                21
35–49                                              46            42                45        46         37                42                38
50+                                                25            13                21        21         10                16                26
All ages                                          100           100               100       100        100               100               100
Source: Skillset; ONS Labour Force Survey, quarterly supplement March 2007.
Note: The percentages may not add up to 100 due to rounding.

As Table 21.8 shows, slightly fewer respondents were married or living as a couple in 2006 than in 2002
(57% compared with 61%). In addition, more were single (38% compared with 32%).

Table 21.8 Marital status of film production workforce, 2002 and 2006
                                                                                                                 Respondents        Respondents
                                                                                                                       2002               2006
Marital status                                                                                                            %                  %

Married or living as couple                                                                                              61                  57
Single and never married                                                                                                 32                  38
Divorced or separated                                                                                                     7                   5
Widowed                                                                                                                   –                   –
Source: Skillset.

Just over a quarter (27%) of respondents in 2006 reported living with at least one dependent child under 16 years,
which was a slight drop in comparison with the third in 2002 (Table 21.9). As in 2002 however, the proportion
of male respondents living with dependent children was considerably greater than the proportion of female
respondents (40% compared with 14%).


188 – UK Film Council Statistical Yearbook 2010
1


                                                                                                                                            2


Table 21.9 Family status of film production workforce, 2002 and 2006                                                                        3
                                                                            Respondents 2002                           Respondents 2006

                                                               Male %   Female %        All %         Male %     Female %           All %
                                                                                                                                            4
Living with dependent child(ren) under 16                         39        21            33             40            14            27
Source: Skillset.
                                                                                                                                            5
More results from the feature film production workforce surveys are available from the full reports, which can be
seen on the Skillset website.
                                                                                                                                            6
21.3 The gender of writers and directors of UK films
Since 2005, the UK Film Council has been studying the under-representation of women among screenwriters of UK
                                                                                                                                            7
films. This has been the subject of two reports Scoping Study into the Lack of Women Screenwriters in the UK (IES,
2006) and Writing British Films – who writes British films and how they are recruited (Susan Rogers, Royal Holloway
and UK Film Council, 2007). See the web-link at the end of the chapter.
                                                                                                                                            8
The combined conclusion of these reports is that female under-representation is an aspect of a commissioning
process that tends to recruit writers who:
•	 Are already known to the commissioning producers; and/or                                                                                 9

•	 Are members of the Writers Guild of America; and/or
•	 Have American agents (even if they are British).                                                                                         10

At the time these reports were commissioned, evidence suggested that around 10% of UK films had a female
director and around 15% of UK films had a female writer. Of the 139 identified writers of UK films in 2009, 23
(17%) were women (Table 21.10).                                                                                                             11


Table 21.10 Gender of writers of UK films released in the UK, 2009
                                                                                                                                            12
Year                                                                                                                               2009

Number of UK titles released in the UK                                                                                            113
Number of writers associated with these titles                                                                                    139       13

Number of male writers                                                                                                            116
Number of female writers                                                                                                           23
                                                                                                                                            14
% male                                                                                                                            83.5
% female                                                                                                                          16.5
Source: UK Film Council.                                                                                                                    15


While this is a low proportion, it is very similar to the 17.3% seen in 2008, but an increase on 2006 and 2007,
when only 15% and 12% of writers were women (see Chapter 21, 2009 Statistical Yearbook and Chapter 19,                                      16
2008 Statistical Yearbook).

                                                                                                                                            17


                                                                                                                                            18


                                                                                                                                            19


                                                                                                                                            20


                                                                            Chapter 21: Employment in the film and video industries – 189
                                                                                                                                            21
Although the percentage of female writers was similar in 2009 to that in 2008, the absolute number of female
writers associated with released UK films in 2009 was lower than the 29 seen in 2008, and similar to the levels of
the previous two years (23 and 20 respectively). Some of the female writers associated with UK films released in 2009
were: Lucy Shuttleworth (The Secret of Moonacre), Kari Skogland (Fifty Dead Men Walking) and Franny Armstrong
(The Age of Stupid). As well as being involved in the writing of films, many of the female writers also directed or
co-directed their films.
Table 21.11 shows directors by gender for UK films released in the UK in 2009.

Table 21.11 Gender of directors of UK films released in the UK, 2009
Year                                                                                                              2009

Number of UK titles released in the UK                                                                           113
Number of directors associated with these titles                                                                 122
Number of male directors                                                                                         101
Number of female directors                                                                                        21
% male                                                                                                           82.8
% female                                                                                                         17.2
Source: UK Film Council.

The proportion of female directors in 2009 (17%) was higher than the proportion in 2008 (12%), which itself was
higher than for 2006 (9%) and 2007 (6%). Some of the 21 female directors associated with UK films released in
2009 were: Lone Sherfig (An Education), Sam Taylor-Wood (Nowhere Boy), Debbie Isitt (Nativity) and Jane Campion
(Bright Star). Both Debbie Isitt and Jane Campion also wrote the screenplays of their films. Other notable female
writer/directors are Kim Longinotto, Havana Marking and Andrea Arnold, who all won awards for their directing in
2009. Kim Longinotto won the World Cinema Grand Jury Prize at the 2009 Sundance Festival for her documentary
Rough Aunties. Havana Marking won two awards at the same festival: the World Cinema Directing Award and the
World Cinema Audience Award for her documentary Afghan Star. Andrea Arnold won the Jury Prize at the 2009
Cannes Film Festival for her film Fish Tank.


21.4 The workplace location
The film production and distribution sectors are concentrated in London and the South East, as shown in
Table 21.12. The exhibition sector workforce is more concentrated in these regions than the overall industry
average, but less so than production and distribution.


190 – UK Film Council Statistical Yearbook 2010
1


                                                                                                                                                                             2


Table 21.12 London and South East employment as percentage of total, 2009                                                                                                    3
                                                                                                                                       London and             London and
                                                                                                                  Total UK              South East             South East
Sector                                                                                                         employment             employment          as % of UK total
                                                                                                                                                                             4
UK all industries                                                                                        29,950,249                 8,430,122                      28.1
Film and video production                                                                                    25,556                    18,716                      73.2
Film and video distribution                                                                                   2,951                     2,293                      77.7      5
Film exhibition                                                                                              14,036                     5,756                      41.0
Source: Labour Force Survey, ONS.
Notes:                                                                                                                                                                       6
The South East region wraps around London to include the major studios to the west of London.
Totals shown in this table are averages of the four calendar quarters from October 2008 to September 2009.

The London and South East share of the film and video production workforce was 73% in the year to September                                                                  7
2009 (79% in 2008). Figure 21.3 suggests that the share of the film and video production workforce in London and
the South East is close to the level prevailing in the early 2000s. The LFS estimate of the London and South East share
of the distribution workforce is erratic from year to year, mainly due to statistical error arising from the small sample                                                    8
size of the survey at industry sub-sector level.

Figure 21.3 London and South East percentage share of the film and video production and                                                                                      9
total workforce, 1999–2009

%                                                                                                                                                                            10
90

80
                                                                                                                                                                             11
70

60

50
                                                                                                                                                                             12
40

30

20                                                                                                                                                                           13
10

                        1999           2000          2001           2002          2003         2004          2005          2006          2007          2008         2009
                                                                                                                                                                             14

     Film and video      68.7          76.2           76.9          63.0           71.3        58.1           70.3           77.4        73.8          78.8          73.2
     production

     UK all              28.0          28.0           28.1          28.1           27.7        27.6           27.6           27.5        27.6          27.9          28.1    15
     industries

Source: Labour Force Survey, ONS.
Note: Year means the year to September of the year. See note to Figure 21.1 for explanation.                                                                                 16


                                                                                                                                                                             17


                                                                                                                                                                             18


                                                                                                                                                                             19


                                                                                                                                                                             20


                                                                                                             Chapter 21: Employment in the film and video industries – 191
                                                                                                                                                                             21
21.5 The scale of the workplace
Each year, the Office for National Statistics conducts a survey of businesses, called the Annual Business Inquiry (ABI),
which provides information on the number of employees in England, Scotland and Wales, by industrial sector.
The latest available data are for 2008 and those relating to the film industry are shown in Tables 21.13 to 21.15.
Figures reported in sections 21.1 and 21.4 are based on the LFS which counts the number of people employed,
and the figures reported in the present section are from the ABI, which is a survey of employers, and counts numbers
of jobs. The two things are not the same, and the data come from different sources, but the numbers arising from
the two surveys should be similar. However, this is not always the case. ONS has identified a number of reasons for
differences between the estimates, but the two most important ones when looking at particular industry sub-sectors
are likely to be: sampling error arising from small LFS sample size at industry sub-sector level and the fact that there
are two industry classification processes involved. In the LFS, individuals are classified by industry depending on
the industrial information they give, whereas in the ABI the industry classification is based on companies’ activities.
As people and companies often work across more than one industry (television and film for example) this gives
rise to unpredictable variations between the LFS and the ABI measures. Also, while the most recent LFS data use
the latest industrial classification (SIC07), the ABI data are available on the old classification (SIC92). The ABI data
presented here are based on SIC92, as this classification better captures those working just in film or video (at the
four-digit level of the classification for which ABI data are available – the latest years’ LFS data shown in Section
21.1 are compiled from the new SIC at the five-digit level).
Nomis (the official labour market statistics online database) provides ABI data for England, Scotland and Wales only.
Figures for Northern Ireland are reported separately by the Northern Ireland Department of Enterprise, Trade and
Investment (DETI) and are shown in Table 21.16. These data are from the Northern Ireland Census of Employment,
which is carried out every two years. The latest available data for Northern Ireland, therefore, refer to 2007.
The different characteristics of the three sectors stand out clearly in these tables.
The film and video production sector had a very high number of small workplaces (97% in the band of 1–10
employees), accounting for a majority of the sector’s total workforce (55%), as Table 21.13 shows. At the other
end of the scale, there were a small number of large workplaces. The 41 workplaces with 50 or more employees
accounted for 5,497 employees, an average of 134 each.

Table 21.13 Film and video production (SIC 9211) workplace size distribution (employees) for England,
Scotland and Wales, 2008
                                                               Number of                         Number of
                                                               workplaces        % of total      employees         % of total
Workplace size band                                               in band       workplaces         in band        employees

1–10                                                             7,785             97.2          11,478              55.2
11–49                                                              184              2.3           3,835              18.4
50+                                                                 41              0.5           5,497              26.4
Total                                                            8,010            100.0          20,811             100.0
Source: Annual Business Inquiry, ONS.

The distribution sector was not as concentrated in small workplaces as the production sector, with four-fifths of
the employees working in workplaces with 11 or more employees (Table 21.14).


192 – UK Film Council Statistical Yearbook 2010
1


                                                                                                                                         2


Table 21.14 Film and video distribution (SIC 9212) workplace size distribution (employees) for England,                                  3
Scotland and Wales, 2008
                                                            Number of                               Number of
                                                            workplaces        % of total            employees               % of total
Workplace size band                                            in band       workplaces               in band              employees     4

1–10                                                            433             88.9                    891                   18.3
11+                                                              54             11.1                  3,973                   81.7
                                                                                                                                         5
Total                                                           487            100.0                  4,864                  100.0
Source: Annual Business Inquiry, ONS.
                                                                                                                                         6
Workplace numbers for bands above 11 employees cannot be published for confidentiality reasons (too few
workplaces in the bands). More than 60% of distribution employees worked in workplaces of 50 employees or
more, while a small number of workplaces had 200-plus employees.
                                                                                                                                         7
Table 21.15 shows that the exhibition sector had a concentration that was the reverse of the production sector
with 59% of employees in workplaces of 50 or more and only 4% in workplaces in the 1–10 employee band.
                                                                                                                                         8

Table 21.15 Film exhibition (SIC 9213) workplace size distribution (employees) for England,
Scotland and Wales, 2008
                                                                                                                                         9
                                                            Number of                               Number of
                                                            workplaces        % of total            employees               % of total
Workplace size band                                            in band       workplaces               in band              employees

1–10                                                            195             35.3                   624                     3.5       10

11–49                                                           215             38.9                 6,613                    37.5
50+                                                             142             25.7                10,400                    59.0
                                                                                                                                         11
Total                                                           552            100.0                17,637                   100.0
Source: Annual Business Inquiry, ONS.

                                                                                                                                         12
Due to the ‘disclosive’ nature of workplace statistics reported for Northern Ireland (too few units in certain size
bands), the three SIC categories have been combined under the SIC code of 921, as shown in Table 21.16. The latest
available data are from the 2007 Census of Employment for Northern Ireland. Two-thirds (67%) of the workplaces
had 10 employees or fewer while 90% (88% in 2005) of the employees were in workplaces of 11 or more employees.                           13

The number of small workplaces (10 employees or fewer) in 2007 had increased by 10 percentage points from 57%
in 2005.
                                                                                                                                         14


                                                                                                                                         15


                                                                                                                                         16


                                                                                                                                         17


                                                                                                                                         18


                                                                                                                                         19


                                                                                                                                         20


                                                                          Chapter 21: Employment in the film and video industries– 193
                                                                                                                                         21
Chapter 1:
Table 21.16 Film and video industry (SIC 921) workplace size distribution (employees) for Northern Ireland, 2007
                                                                                         Number of                             Number of


The box office
                                                                                         workplaces          % of total        employees            % of total
Workplace size band                                                                         in band         workplaces           in band           employees

1–10                                                                                               43          67.2                 97                 9.8
11+                                                                                                21          32.8                890                90.2
Total                                                                                              64         100.0                987               100.0
Source: Northern Ireland Census of Employment, Department of Enterprise, Trade and Investment (DETI).

The declining trend in the proportion of employment in workplaces with 50 or more employees in the film and video
production sector in the early part of the last decade has been reversed in recent years. In contrast, the proportion of
employment in workplaces with 1–10 employees grew rapidly between 1996 and 2000, then remained at a level of
just below 60%, but appears to have declined between 2006 and 2008 (Figure 21.4).

Figure 21.4 Film and video production sector (SIC 9211) employees by workplace size band,
percentage of total, 1995–2008
% of sector workforce
70

60

50

40

30

20

10

0                     1995     1996        1997       1998       1999       2000        2001        2002   2003     2004    2005    2006    2007        2008


     1–10 employees 44.9        46.9       50.3        55.6       57.2       57.9       57.2        59.4   56.2      58.8   58.2     59.0   57.7         55.2
     50+ employees    30.0      28.3       25.7        25.6       21.3       22.9       17.3        17.4   23.7      21.5   25.3     21.9   24.2         26.4

Source: Annual Business Inquiry, ONS.
Notes:
These figures cover England, Scotland and Wales only.
Workforce data from 1995 to 1997 were re-scaled to be comparable with the current series of ABI.


In the exhibition sector the proportion of employees in the 50-plus category has increased over the past two years,
after decreasing in 2004–2006. The reverse is happening in the 11– 49 category where the proportion of employees
appears to be declining after seeing an increase between 2004 and 2006, as shown in Figure 21.5.


194 – UK Film Council Statistical Yearbook 2010
1


                                                                                                                                                                          2


Figure 21.5 Film exhibition sector (SIC 9213) employees by workplace size band, percentage of total, 1995–2008                                                            3
% of sector workforce
80

70                                                                                                                                                                        4

60

50
                                                                                                                                                                          5
40

30

20                                                                                                                                                                        6

10

                     1995      1996        1997       1998       1999       2000       2001        2002    2003       2004       2005       2006      2007       2008     7


     11–49 employees 63.1       56.8       40.5        25.1       36.6       51.8       36.1       34.2     41.1       32.1      39.5       44.3       41.1       37.5
     50+ employees   29.8       35.4       52.1        68.0       56.1       42.2       59.3       61.8     54.6       63.9      56.8       51.6       55.1       59.0    8

Source: Annual Business Inquiry, ONS.
Notes:
These figures cover England, Scotland and Wales only.
                                                                                                                                                                          9
Workforce data from 1995 to 1997 were re-scaled to be comparable with the current series of ABI.


                                                                                                                                                                          10


                                                                                                                                                                          11


                                                                                                                                                                          12


                                                                                                                                                                          13


                                                                                                                                                                          14


                                                                                                                                                                          15


„                                                                                                                                                                         16


   or the reports on under-representation of women among screenwriters of UK films, Scoping Study into the
 3F
   Lack of Women Screenwriters in the UK and Writing British Films – who writes British films and how they are                                                            17
   recruited, see www.ukfilmcouncil.org.uk/publications
 3 For
   more information about differences between LFS estimates of numbers of people in employment and
   ABI estimates of numbers of jobs, see the National Statistics Quality Review Series Report no. 44: Review of
                                                                                                                                                                          18
   Employment and Jobs Statistics, at www.ons.gov.uk/about-statistics/methodology-and-quality/quality/nat-stats-
   qual-revs/qual-revs-by-theme/labour-market/index.html
 3F
   or more information on film distribution, see Chapter 8 (page 60)
                                                                                                                                                                          19
 3F
   or details of the exhibition sector, see Chapter 9 (page 65)
 3F
   or more background on film production, see Chapter 16 (page 132)
 3S
   killset website: www.skillset.org
                                                                                                                                                                          20


                                                                                                          Chapter 21: Employment in the film and video industries – 195
                                                                                                                                                                          21
Glossary                                                   Country of origin
                                                           The nationality of a film. In the case of co-productions,
Asian programming                                          this may include more than one country
Films originating from South Asia, for example
Bollywood, and generally, though not exclusively,          DCMS
aimed at a South Asian audience and in a South             Department for Culture, Media and Sport.
Asian language                                             The government department that sponsors the
                                                           UK Film Council
BAFTA
British Academy of Film and Television Arts                Digital Cinema Initiatives
                                                           Digital Cinema Initiatives, LLC (DCI) was created in
BARB                                                       March 2002 and is a joint venture of Disney, Fox,
Broadcasters’ Audience Research Board Ltd.                 Paramount, Sony Pictures Entertainment, Universal and
The company that compiles audience figures for             Warner Bros Studios. Its primary purpose is to establish
UK television (www.barb.co.uk)                             and document voluntary specifications for an open
                                                           architecture for digital cinema that ensures a uniform
BBFC
                                                           and high level of technical performance, reliability and
British Board of Film Classification. Independent body
                                                           quality control (www.dcimovies.com)
responsible for classifying films and video (see Film
classification) (www.bbfc.org.uk)                          DLP Cinema
                                                           The trademark of Texas Instruments’ digital projection
Blu-ray disc (BD)
                                                           system. DLP stands for ‘digital light processing’
An optical disc format that can store up to 50 Gb of
data, almost six times the capacity of a dual layer DVD.   Digital projection
It uses a short wavelength blue-violet laser to read and   The projection of a film onto a cinema screen using a
write information to disc                                  digital master and a digital projector, ie using electronic
                                                           signals to direct light onto the screen rather than
Box office
                                                           passing light through a celluloid strip
Total value of ticket sales for a film screened
commercially at cinemas                                    Digital terrestrial television (DTT)
                                                           Multi-channel television delivered free to the consumer
Box office gross
                                                           by means of a signal decoder between the aerial and
Box office takings before deduction of Value Added
                                                           the television set
Tax (VAT)
                                                           Distributor
BVA
                                                           A person or company that acquires the right to exploit
British Video Association. The trade body
                                                           the commercial and creative values of a film in the
representing the interests of publishers and rights
                                                           theatrical, video and TV market. Also undertakes the
owners of pre-recorded home entertainment on
                                                           promotional and marketing activities to attract
video (www.bva.org.uk)
                                                           audiences to the film
CAA
                                                           Download
Cinema Advertising Association. The trade association
                                                           See ‘Film download’
of cinema advertising contractors operating in the
UK and Republic of Ireland                                 Download to Own (DTO)
                                                           The purchase of permanent film downloads for storage
Concession revenue
                                                           on hard drive, and in some cases to burn an additional
Revenue from sales of food, drink and merchandise
                                                           copy to DVD
at cinemas
                                                           DVD
Co-production
                                                           Digital versatile disc
A film made by companies from more than one
country, often under the terms of a bilateral              Exhibitor
co-production treaty or the European Convention            A cinema operator that rents a film from a distributor
on Cinematographic Co-production                           to show to a cinema audience


196 – UK Film Council Statistical Yearbook 2010
Feature film                                                 HD-DVD
A film made for cinema release, as opposed to                High-definition digital versatile disc. A high-density
a film made for television, and usually of at least          optical disc format designed for the storage of data and
80 minutes duration                                          high-definition video. Abandoned in February 2008 after
                                                             Blu-ray prevailed in the competition to become the next
Film classification                                          generation DVD format
Classification given to a film by the British Board of
Film Classification. Indicates the film’s suitability for    Higher (Scottish)
audiences according to their age                             In Scotland, the Higher is one of the national school-
                                                             leaving certificate exams and university entrance
Film download                                                qualifications of the Scottish Qualifications Certificate
A digital version of a film transferred (either officially   offered by the Scottish Qualifications Authority.
or unofficially) from the Internet to a personal computer
or mobile device. Downloads may also go directly to          HMRC
television sets via game consoles, internet protocol         Her Majesty’s Revenue and Customs. The government
television or dedicated set-top boxes                        department charged with collecting revenue on behalf
                                                             of the Crown
Film rental
The sum of money paid to the distributor by the              HMT
exhibitor in return for the right to show a particular       Her Majesty’s Treasury. The government department
film. Usually calculated as a percentage of net box office   responsible for formulating and implementing the
                                                             Government’s financial and economic policy
Franchise
A film series such as Harry Potter and the Philosopher’s     Inward features
Stone and its sequels                                        A term used by the UK Film Council to denote a film
                                                             which is substantially financed and controlled from
GCE – General Certificate of Education                       outside the UK and which is attracted to the UK by script
An academic qualification comprising Advanced Level          requirements (eg locations) and/or the UK’s filmmaking
(A Level) and Advanced Subsidiary Level (AS Level).          infrastructure and/or UK tax incentives
GCSE – General Certificate of Secondary Education            Internet Protocol Television (IPTV)
An academic qualification awarded in a specific subject,     Television connected to the internet that uses internet
generally taken by students aged 14-16 in secondary          digital protocols to communicate data
education in England, Wales and Northern Ireland
(Scottish equivalent is the Standard Grade).                 ISBA TV Regions
                                                             System for classifying regions developed by the
GDP – Gross Domestic Product                                 Incorporated Society of British Advertisers for use by
A measure of a country’s income and output. GDP is           the advertising industry
defined as the total market value of all final goods and
services produced within the country in a given period       Mainstream programming
of time. GDP is also the sum of the value added at each      Category of films aimed at the general audience
stage of the production process. ‘Gross’ refers to the
fact that GDP includes capital investment but does           Megaplex site
not subtract depreciation                                    Defined by Dodona Research as a purpose-built cinema
                                                             with 20 or more screens
Genre
A style or category of film defined on the basis of          Multiplex site
common story and cinematic conventions (eg action,           Dodona Research defines a multiplex as a purpose-built
crime, romantic comedy, drama etc)                           cinema with five or more screens

Government Office Regions                                    Multi-channel television
Classification of English regions used to establish the      Digital television programming carried by satellite, cable
boundaries of the Regional Development Agencies              or freeview delivery systems, in this case excluding the
and the Regional Screen Agencies                             five main network channels (BBC One, BBC Two, ITV1,
                                                             Channel 4 and Five)


                                                                                                                Glossary – 197
Near-Video on Demand (nVoD)                                Sites
A system which allows television viewers to purchase       Individual cinema premises
individual films to view. The film is shown at the same
time to everyone ordering it, as opposed to true-Video     Socio-economic group
on Demand, which allows the viewers to see the film        Section of the population defined by employment status
at any time. Films can be purchased via an on-screen       Specialised programming
guide, automated telephone or customer services line.      Generally, non-mainstream films. This category includes
Also referred to as pay-per-view                           foreign language and subtitled films, art-house
Net box office                                             productions and films aimed at niche audiences
Box office takings after deduction of VAT                  Terrestrial television
Online rental                                              The five main free-to-air channels: BBC One, BBC Two,
Selecting and renting DVDs via a website for postal        ITV1, Channel 4 and Five
delivery                                                   Traditional cinema
ONS                                                        A cinema generally with fewer than five screens and
Office for National Statistics                             that shows more mainstream product. Often an older
                                                           building located in city centres or suburbs
Out of town cinema
Cinema located on the outskirts of a town, typically       UK and Republic of Ireland
in a large shopping development                            The distribution territory comprising the UK and
                                                           Republic of Ireland. Where this publication indicates
PAYE                                                       a film has been released ‘in the UK and Republic of
Pay as you earn. A method of collecting income tax         Ireland’ it refers to the distribution territory and not
and national insurance where these are deducted            necessarily to an actual release in both countries
at source by the employer and remitted to HMRC
                                                           UMD
Pay-per-view                                               Universal Media Disc. An optical disc medium developed
See Near-Video on Demand                                   by Sony for use on the PlayStation Portable

Pay-TV                                                     VHS
A satellite or cable television system in which viewers    Video Home System. Standard format for cassette tapes
pay a subscription to access television content            containing recorded films and other audiovisual content

Personal computer (PC)                                     Video on Demand (VoD)
A lap-top or desk-top computer capable of operating        A system that allows users to select and watch films
independently of a network (although frequently            on television, PC or mobile device at the time they want
networked in office environments)                          over an interactive network. The user can buy or rent
                                                           films and download them before viewing starts or
Personal video recorder (PVR)                              stream content to be viewed in real time
A digital set-top box with hard drive capable of storing
large amounts of audiovisual content                       Video on physical media
                                                           See ‘physical media’
Physical media
Refers to the various physical formats on which video
can be distributed, such as VHS, DVD, Blu-ray etc.

PlayStation Portable (PSP)
A portable games console made by Sony that can
be used to view VoD content

Standard Industrial Classification (SIC)
A numbering system used by the Office for National
Statistics to identify different industries in the UK’s
official statistics


198 – UK Film Council Statistical Yearbook 2010
Acknowledgments                                        Please note that no material in this Yearbook may be
                                                       reproduced in any form without prior permission from
We would like to thank the following organisations     the authors or copyright owners.
for kindly allowing us to reproduce their data:
Attentional Ltd
                                                       Sources
Beacon Dodsworth
                                                       Chapters 1 to 9: Box office, top films, genre
British Board of Film Classification (BBFC)            and classification, specialised films, UK films
                                                       internationally, UK talent and awards, distribution
British Federation of Film Societies (BFFS)
                                                       and exhibition
British Film Institute (BFI)
                                                       •	  entrak EDI, weekly UK and international box
                                                          R
British Market Research Bureau (BMRB)                     office reports
British Video Association (BVA)                        •	 ndependent Film and Television Alliance (IFTA),
                                                          I
Broadcasters’ Audience Research Board Ltd (BARB)          international box office database

Cinema Advertising Association (CAA)                   •	  otion Picture Association of America, theatrical
                                                          M
                                                          market statistics
Department for Culture Media and Sport (DCMS)
                                                       •	 European Audiovisual Observatory Lumière database
Department for Environment, Food and Rural Affairs
(DEFRA)                                                •	 HM Treasury, GDP deflators

Dodona Research                                        •	 Dodona Research, Cinema-going 19, April 2010

European Audiovisual Observatory (EAO)                 •	 Screen Digest, Cinema Intelligence

FILMCLUB                                               •	  ritish Board of Film Classification (BBFC), database
                                                          B
                                                          of film classifications
Film Education
                                                       •	  ielsen Media Research, monthly media spend reports
                                                          N
First Light
                                                       •	 The Internet Movie Database (IMDb)
Higher Education Statistics Agency (HESA)
                                                       •	 Rentrak EDI, Filmsource database
HM Revenue and Customs (HMRC)
                                                       •	  eacon Dodsworth, UK population data by
                                                          B
HM Treasury (HMT)                                         ISBA TV region
Joint Council for Qualifications (JCQ)                 •	  inema Advertising Association, cinema admissions
                                                          C
Kantar Worldpanel                                         by ISBA TV region

Motion Picture Association of America (MPAA)           •	  ffice for National Statistics, UK population data
                                                          O
                                                          by Government Office Region
Northern Ireland Department of Enterprise, Trade and
Investment (DETINI)                                    •	  ritish Federation of Film Societies, Cinema for
                                                          B
                                                          All Survey results
Nielsen Media Research
                                                       Chapters 10 to 14: Film on video, television and
Office for National Statistics (ONS)                   VoD, the film market as a whole and audiences
Official UK Charts Company (OCC)                       Sources from previous chapters, plus:
PricewaterhouseCoopers                                 •	 British Video Association, BVA Yearbook 2010
Rentrak EDI                                            •	 Official UK Charts Company, video charts
Scottish Qualifications Authority (SQA)                •	  roadcasters’ Audience Research Board, Television
                                                          B
Screen Digest                                             Audience Measurement Service

Skillset                                               •	  ttentional Ltd, database of film on UK
                                                          A
                                                          television, 2009
WJEC


                                                                                        Acknowledgements and sources – 199
•	  creen Digest, Global Media Intelligence (monthly),
   S                                                           •	  killset, Film production workforce survey, 2008
                                                                  S
   Online Movie Strategies (report), Video Intelligence
                                                               •	  killset, Labour Market Intelligence Digest for
                                                                  S
   and Broadband Media Intelligence
                                                                  Film, 2009
•	  inema Advertising Association, 2009 Film Monitor
   C
                                                               •	  killset, Employment Census of the Creative Media
                                                                  S
   (Quarterly Reports) and FAME: Film Audience
                                                                  Industries, 2009
   Measurement and Evaluation report, 2010
•	  uropean Audiovisual Observatory, DDM and NPA
   E
   Conseil – Video on Demand and catch-up TV in
   Europe, October 2009
Chapters 15 to 21: British film certification, film
production, public investment in film in the UK,
film education, film companies, the UK film
economy and employment.
Sources from previous chapters, plus:
•	  epartment for Culture Media and Sport, British film
   D
   certification data
•	  K Film Council Film Certification Unit, British film
   U
   certification data
•	  orthern Alliance, public investment in film 2008/09,
   N
   March 2010
•	  ESA Student Record 2002/03 – 2009/10, Higher
   H
   Education Statistics Agency Limited
•	  oint Council for Qualifications (JCQ), National Results
   J
   2002–2009
•	  cottish Qualifications Authority, Pre-Appeals Data
   S
   2002–2009
•	  uropean Audiovisual Observatory, 2009 Yearbook,
   E
   Volume 3
•	  ffice for National Statistics, Annual Business
   O
   Inquiry, 2009
•	  ffice for National Statistics, Size Analysis of UK
   O
   Businesses (VAT and PAYE data), 2009
•	  ricewaterhouseCoopers, Global Entertainment and
   P
   Media Outlook 2010–14, June 2010
•	  ffice for National Statistics, International
   O
   transactions of the UK film and television industries
   2008, 9 December 2009
•	  xford Economics, The Economic Impact of the UK
   O
   Film Industry, June 2010
•	  ffice for National Statistics, Labour Force Survey,
   O
   Quarterly to September 2009
•	  orthern Ireland Department of Enterprise, Trade
   N
   and Investment, Northern Ireland Census of
   Employment, 2007


200 – UK Film Council Statistical Yearbook 2010
Statistical Yearbook 2010
UK Film Council
10 Little Portland Street
London W1W 7JG
T +44 (0)20 7861 7861
F +44 (0)20 7861 7862
This Statistical Yearbook
is available online at
www.ukfilmcouncil.org.uk

Ukfilmstats2010

  • 1.
    Statistical Yearbook 2010 UKFilm Council 10 Little Portland Street London W1W 7JG T +44 (0)20 7861 7861 F +44 (0)20 7861 7862 This Statistical Yearbook is available online at www.ukfilmcouncil.org.uk
  • 3.
    Welcome to the2010 UK Film Council Statistical Yearbook. This yearbook, the eighth we have published, is a rich source of industry data and analysis on film in the UK. This publication is one of the ways we deliver on our commitment to evidence- based film policy. We hope you enjoy this yearbook and find it useful.
  • 4.
    Contents Chief Executive Officer’sforeword. ................................ 5 . Chapter 8: Distribution................................................... 60 8.1 Distributors in 2009.............................................. 61 2009 – the year in review................................................. 6 . 8.2 Distributors 2004–2009........................................ 62 8.3 Weekend box office.............................................. 63 Chapter 1: The box office................................................. 8 8.4 Release costs......................................................... 64 . 1.1 Admissions.............................................................. 9 1.2 Box office earnings............................................... 11 . Chapter 9: Exhibition...................................................... 65 . 1.3 Film releases and box office revenues.................. 11 9.1 UK cinema sites..................................................... 66 1.4 Country of origin of film releases......................... 13 9.2 UK screens............................................................. 66 9.3 Screen location. .................................................... 67 . Chapter 2: Top films in 2009.......................................... 15 9.4 Screen density and admissions per 2.1 The top 20 films.................................................... 16 person – international comparisons..................... 68 2.2 The top 20 UK films.............................................. 17 9.5 Screen density and admissions 2.3 The top 20 UK independent films........................ 18 per person in the UK............................................. 68 2.4 The top 3D films................................................... 18 . 9.6 Type of cinema screens by nation 2.5 Best weekend performances of UK films............. 19 and region............................................................. 71 9.7 Mainstream, specialised and Chapter 3: Top films of all time South Asian programming................................... 72 at the UK box office........................................................ 20 . 9.8 Exhibitors. ............................................................. 73 . 3.1 All time top 20 films at the UK box office. .......... 21 . 9.9 Exhibitor revenues. ............................................... 74 . 3.2 Inflation-adjusted top 20 films at the 9.10 Digital projection.................................................. 74 . UK box office. ....................................................... 22 . 9.10.1 Digital Screen Network......................................... 74 3.3 All time top 20 UK films at the UK box office...... 23 9.10.2 Digital screens worldwide and in the UK............. 74 3.4 All time top 20 independent UK films at the 9.10.3 3D and alternative content programming........... 76 UK box office. ....................................................... 24 . 9.11 Community cinema in the UK.............................. 78 . Chapter 4: Genre and classification.............................. 25 Chapter 10: Film on video.............................................. 80 4.1 Genre..................................................................... 26 10.1 Film in the retail video market.............................. 81 4.1.1 Genre of all film releases...................................... 26 . 10.2 The relationship between film on video sales 4.1.2 Genre of UK and UK independent and theatrical box office takings.......................... 85 film releases.......................................................... 28 . 10.3 Film in the video rental market. ........................... 88 . 4.2 BBFC classification................................................. 32 10.4 Hardware.............................................................. 89 . 4.2.1 Releases and box office by classification.............. 32 4.2.2 Top films by classification..................................... 35 Chapter 11: Film on UK television................................. 90 11.1 Programming on network channels.................... 91 . Chapter 5: Specialised films........................................... 38 11.2 Peak time on network television.......................... 92 . 5.1 Specialised films at the 11.3 Audiences for film on network television............ 93 . UK box office in 2009........................................... 39 11.4 Top films on network television............................ 93 5.2 Foreign language films......................................... 41 11.5 Films on multi-channel television ........................ 95 5.3 Documentaries...................................................... 43 11.6 The audience for film on all 5.4 Re-releases of classic and archive films................ 44 . television channels, 2000–2009 .......................... 98 11.7 The value of feature film to broadcasters ........... 99 Chapter 6: UK films internationally............................... 46 6.1 UK films worldwide.............................................. 47 . Chapter 12: Video on Demand....................................100 6.2 UK films in North America.................................... 48 12.1 Current size of the UK market............................101 6.3 UK films in Europe................................................ 49 12.2 Video on Demand services in the UK.................101 6.4 UK films in Latin America..................................... 50 . 12.3 Future prospects for the VoD market.................103 6.5 UK films in Japan and South Korea...................... 51 6.6 UK films in Australasia.......................................... 51 Chapter 13: The UK film market as a whole..............104 13.1 The UK filmed entertainment market Chapter 7: UK talent and awards.................................. 52 as a whole...........................................................105 7.1 UK story material.................................................. 53 . 13.2 The UK market in the global context. ................106 . 7.2 UK actors............................................................... 54 13.3 The evolution of UK film revenues, 7.3 UK directors........................................................... 55 1998–2009..........................................................107 7.4 Awards for UK films and talent............................ 57 13.4 The impact of recession......................................109 2 – UK Film Council Statistical Yearbook 2010
  • 5.
    Chapter 14: Audiences..................................................110 Chapter 18: Film education..........................................151 14.1 Cinema audience by gender...............................111 18.1 Introduction........................................................152 14.2 Film preferences by gender................................111 . 18.2 Film education in formal 14.3 Cinema audience by age....................................112 . education settings..............................................152 . 14.4 Film preferences by age......................................114 18.3 National and regional film 14.5 Cinema audience by social group......................115 . education providers............................................154 14.6 Film preferences by social group........................116 18.4 Public investment in film education...................156 14.7 Film audiences by ethnicity. ...............................117 . 18.5 Moving image education providers 14.8 Film audiences by disability................................118 in the UK.............................................................157 . 14.9 Film preferences by nation or region.................118 . 14.10 Film downloads. .................................................119 . Chapter 19: Film industry companies.........................161 14.11 Comparative profiles of cinema audiences 19.1 Number of companies in the film and audiences for film on television..................121 . and video industries............................................162 14.12 Cinema-goers’ preferences by age for 19.2 Size distribution of film companies....................163 cinema, DVD and television................................122 19.3 National/regional distribution of film 14.13 Total size of film audience in the UK..................123 companies in the UK...........................................165 19.4 Leading film companies in the UK Chapter 15: Films certified as British 1998–2009......124 and Europe. ........................................................167 . 15.1 Qualifying as an official British film....................125 19.5 Leading film production companies 15.2 Schedule 1 cultural test certifications, in the UK and Europe.........................................168 . 2008 and 2009...................................................125 . 15.3 Co-production certifications, Chapter 20: The UK film economy..............................171 2008 and 2009...................................................126 . 20.1 Film industry turnover, 1995–2008....................172 15.4 Finally certified British films, 1998–2009...........126. 20.2 Film industry contribution to GDP, 15.5 Median budgets, 1998–2009.............................128 1995–2008..........................................................174 15.6 Final certifications by budget band, 20.3 Economic impact of the film industry................176 2007–2009..........................................................129 20.4 The UK facilities sector........................................176 20.5 Film exports, 1995–2008....................................178 Chapter 16: Film production in 2009..........................132 20.6 Film imports, 1995–2008...................................178 . 16.1 The value of UK production in 2009..................133 20.7 The film trade balance, 1995–2008...................179 16.2 Inward, domestic and co-production 20.8 Film export markets............................................180 features, 1994–2009. .........................................134 . 20.9 UK film exports compared with the global 16.3 Productions by genre, 2007–2009.....................137 market for filmed entertainment.......................180 . 16.4 Budget trends.....................................................138 . 20.10 The geographical distribution of the UK’s 16.5 Size distribution of budgets...............................139 . film trade surplus................................................181 16.6 Big budget productions, 2007–2009.................140 16.7 UK spend as percentage of total Chapter 21: Employment in the film production budget.............................................140 . and video industries......................................................182 16.8 UK domestic productions by 21.1 The workforce ....................................................183 territory of shoot.................................................141 21.1.1 Labour Force Survey............................................183 16.9 Co-productions by territory of shoot.................141 . 21.1.2 Skillset’s Labour Market Intelligence 16.10 Production company activity levels....................142 and Employment Census....................................185 16.11 US studios’ involvement in film production 21.2 The feature film production in the UK.............................................................142 . workforce survey . ..............................................186 21.3 The gender of writers and directors Chapter 17: Public investment in film in the UK.......143 of UK films..........................................................189 . 17.1 Public funding for film in the UK by source.......144 21.4 The workplace location . ....................................190 17.2 Film spend by organisation................................147 . 21.5 The scale of the workplace.................................192 17.3 Activities supported by public spend on film.................................................................148 Glossary..........................................................................196 . 17.4 Large film production awards by agency 2008/09..................................................148 . Acknowledgements......................................................199 . 17.5 Leading public investors in British film production, 2007–2009. ....................................149 . Sources............................................................................199 Contents – 3
  • 6.
    The UK FilmCouncil We do this by supporting the UK film industry, celebrating our film culture, and nurturing is the Government- our film talent. We fund film development and production, short backed lead agency filmmaking, distribution, film education, festivals, skills development, and digital innovation initiatives for film. for film in the UK and Our work also encourages inward investment into the UK film production sector, the export of British films to our aim is to ensure international markets and fosters UK co-production with international partners. We fund and support the British that audiences at Film Institute, the UK’s National and Regional Screen Agencies and the MEDIA Desk UK. Our work also extends to research, statistics and market intelligence to support home and abroad the development of the UK film sector and combating film theft. The Certification Unit for qualifying British can enjoy great films is also part of the UK Film Council. British films. We want to ensure that there are no barriers to accessing our publications. If you, or someone you know, would like a large print, audiotape or an alternative version of this report, please contact: Communications Department UK Film Council 10 Little Portland Street London W1W 7JG Email: info@ukfilmcouncil.org.uk Tel: +44 (0) 20 7861 7884 Fax: +44 (0) 20 7861 7863 www.ukfilmcouncil.org.uk http://www.ukfilmcouncil.org.uk 4 – UK Film Council Statistical Yearbook 2010
  • 7.
    Chief Executive Officer’sforeword The 2010 Statistical Yearbook, compiled by the UK Film Council’s Research and Statistics Unit, once again presents the most comprehensive picture of film in the UK. And this year, for the first time, the Yearbook moves fully online, making it an even more accessible, open and valuable resource, and one which, depending on your needs, can be explored online, downloaded or printed either in whole or in part. All aspects of the film sector are captured here, offering a compelling insight into the ways in which audiences across the UK are discovering, accessing and enjoying film and film culture, underlining the continued success that British films and filmmakers are enjoying both at home and on the world stage, and, perhaps most informatively of all, shedding light on the rapidly evolving patterns in the financing, production, exhibition and distribution of film. The sheer breadth and depth of statistics contained here mean that they can be analysed any number of ways. What is undeniable, however, is their ability to highlight once again the growing value of the UK film industry, the enduring strength of our creative talent and the vital role that films and film culture play in the life of millions of people up and down the UK. We must all continue to work hard, therefore, to ensure that the infrastructure, support and funding systems remain in place to allow British film to prosper and succeed in this digital age. John Woodward Chief Executive Officer UK Film Council Chief Executive Officer’s foreword – 5
  • 8.
    2009 – theyear in review 2009 was the year cinema bucked the recession. The UK appetite for specialised films seems to be rising. UK cinema visits of 174 million made 2009 the second As the total number of releases has risen over the last highest year for admissions since 1971, while the UK 10 years, the proportion of specialised films has increased box office grew to a record £944 million. The arrival from 58% to 69%, taking 15% of the box office in 2009. of 3D made a vital contribution. In its new consumer- This suggests a steady broadening of cinematic tastes. friendly form, 3D established itself as the viewing Documentaries, for example, have risen from negligible experience of choice for action, adventure, animation numbers and takings in 2000–2002 to 56 feature and fantasy films. documentary releases in 2009, earning £12 million at the box office, led by Michael Jackson’s This Is It. Avatar was the run-away box office success of 2009, generating more in 3D takings alone than the total 2009 was an excellent year overall for film production gross of any other 2009 film. Still on release in April in the UK, with studios busy with inward investment 2010, with UK box office takings of over £91 million, films such as Harry Potter and the Deathly Hallows, it displaced Titanic at the top of our inflation-adjusted Robin Hood, Gulliver’s Travels and Clash of the Titans. all-time top 20 UK box office chart. It was the only film The UK spend of inward investment films reached of 2009 to break into this chart. £753 million, the highest on record, while the total UK spend of £957 million was, after 2003, the second Three UK films had a particular impact at the UK and best year on record. However, within this positive scene, international box office in 2009: Harry Potter and the domestic UK films had a tougher time, finding it harder Half-Blood Prince continued the dominance of the to raise money and lowering their budgets as a result. schoolboy wizard franchise, while Slumdog Millionaire Co-productions have been most affected by changes hit the jackpot as the most successful-ever UK in the regulatory and economic environment. Only 22 independent film. The third most popular UK film of were made in 2009, with a combined UK spend of the year, Sherlock Holmes, confirmed the enduring £35 million. appeal of characters from classic British fiction. Public funding for the UK film sector fell slightly in Other UK independent films to win significant 2008/09, to £256 million, from £261 million the audiences in 2009 included St Trinian’s 2: The Legend previous year. Within this total, tax relief for UK film of Fritton’s Gold, Nativity, Harry Brown, Dorian Gray production again made the single biggest contribution, and In the Loop. at £110 million. UK producers have sometimes been criticised for producing too many ‘dramas’ rather than films in more popular genres, however our analysis of UK independent films in 2009 (Chapter 4) shows a genre range not too dissimilar from all films with only 24% being in the drama category. However, the proportion of the box office taken by different genres is strongly affected by the performance of particular titles. Amongst UK independent films in 2009, drama took 45% of the box office, due primarily to the success of Slumdog Millionaire. Specialised film’s share 15% of the UK box office UK box office £944m 6 – UK Film Council Statistical Yearbook 2010
  • 9.
    Amongst the filmactivities supported by public In television, though film audiences on the main investment is film education. This year, for the first broadcast channels continued to fall, strong growth time, we present data that show the wide reach of was recorded in both subscription film channels and film education in the UK – from 2009’s 6,674 A Level free-to-air digital multi-channel. The latter now film studies candidates to the 392,000 children who accounts for a third of all film watching on television. attended screenings as part of National Schools Film While cinema is key for new releases, it remains the Week. By the end of 2009 there were almost 3,000 case that most film watching in the UK takes place school film clubs across the UK (involving 92,000 on television. In 2009, we estimate that television pupils) and 355 providers of moving image education accounted for 75% of total film viewing occasions outside the school or university classroom. The rapid in the UK. expansion of film education and its extensive reach Regular readers of the Statistical Yearbook will notice shows the value of film as a tool to engage learners some additions this year: and its relevance in equipping students (both children and adults) to participate fully in the growing • etails of the production and/or performance D digital economy. of UK independent films (various chapters). This reflects requests from readers in our user Film and moving image education begins a process survey in August 2009 for more information that leads to audience appreciation for UK films and about UK independent films; Oscars® and BAFTAs for British talent. Brits continued their winning ways in 2009 with Slumdog Millionaire • 10-year time series of the performance of A taking six Oscars® including Best Picture and Best specialised films at the UK box office (Chapter 5); Achievement in Directing (Danny Boyle), while Kate • he box office performance of UK films in Japan T Winslet won Best Actress for her role in The Reader, and Korea (Chapter 6); Michael O’Connor took Best Achievement in Costume Design for The Duchess and James Marsh and Simon • chart of UK admissions going back 75 years A Chin won Best Documentary Feature for Man on Wire, (1935–2009 inclusive) for historical comparative the gripping story of Philippe Petit’s tightrope walk purposes (Chapter 1); between the twin towers of the New York World Trade • new chapter on film education, gathering for the A Centre in 1974. In total, British talent accounted for first time the available statistics on film education at 17% of the awards at the leading ceremonies and school, university and in the community. It is intended festivals we monitor – the Oscars®, the BAFTAs, Berlin, that this will serve as the basis for wider coverage of Sundance, Cannes, Venice and Toronto. the cultural aspects of film in the future. While admissions and box office were up in 2009, We welcome feedback on the Yearbook and we revenue for the film market as a whole was static thank those who gave us their ideas in 2009/10. compared with 2008, showing the challenges of both All of the information is available to view online the recession and the transition to digital. The physical at www.ukfilmcouncil.org.uk. video markets (rental and retail) shrank in 2009 while video on demand (VoD) grew. However, the potential David Steele of digital VoD has yet to be fully realised and the Head of Research and Statistics Unit growth in VoD was not enough to offset the decline Sean Perkins in physical video. Senior Research Executive Nick Maine Research Executive UK production spend £957m 2009 – the year in review – 7
  • 10.
    Chapter 1: The boxoffice Despite the recession the UK Facts in focus box office saw record receipts • K cinema admissions reached 173.5 million, up 6% U on 2008. and the highest admissions • ox office receipts were £944 million, up 11% on 2008. B since 2002. One of the main • 03 films were released for a week or more in the UK 5 drivers of this growth was the and Republic of Ireland. emergence of 3D cinema, with • K films, including co-productions, accounted for 23% U of releases and 17% of the market by value. a string of popular titles • he top 100 films earned over 91% of the gross T including Avatar, Ice Age III box office. and Up. • D films accounted for 16% of UK and Republic of 3 Ireland box office revenues in 2009 (£176 million), up from just 0.4% in 2008.
  • 11.
    1 2 1.1 Admissions The April release of another 3D animated title, Monsters 3 vs. Aliens and action thriller Fast Furious increased The 173.5 million cinema admissions recorded for the ticket sales by 41% compared with April 2008 and a raft UK in 2009 were up 5.6% on 2008 (Figure 1.1), the of major studio releases such as X-Men Origins: highest since 2002 and the second highest since 1971. Wolverine, Star Trek, Angels and Demons and Night at 4 Admissions also increased in most other European the Museum 2 continued to lift admissions in May. territories – German admissions rose by 13%, French Surprise hit comedy The Hangover and franchise films admissions by 6% and there were also increased ticket Terminator Salvation and Transformers: Revenge of the 5 sales in Spain (up 3%, the first increase in five years) Fallen contributed to the 6% increase in June and Russia (12%). admissions. Admissions across the summer months failed to match the levels of 2008, when Mamma Mia! 6 Figure 1.1 Annual UK admissions, 2000–2009 and The Dark Knight earned over £110 million between Million them, but the sixth instalment of the Harry Potter series, 200 Harry Potter and the Half-Blood Prince, was released in 7 July and went on to gross almost £51 million. Ice Age III 150 was also released in July and grossed over £35 million, with over half of that from 3D screens. The release of 8 another 3D animation, Up, and the second film in the 100 Twilight series, Twilight Saga: New Moon boosted autumn admissions and the year ended with the highest 9 50 December admissions for four years as Avatar became the widest released and most successful 3D film to date. 0 00 01 02 03 04 05 06 07 08 09 10 Source: CAA, Rentrak EDI. Table 1.1 Monthly UK cinema admissions, 2008–2009 2008 2009 % +/– Month (million) (million) on 2008 11 Total admissions January 13.5 14.5 +7.7 Year (million) February 12.9 15.0 +16.4 12 2000 142.5 March 12.2 11.9 –2.3 2001 155.9 April 9.8 13.8 +40.8 2002 175.9 May 12.7 15.8 +24.0 13 2003 167.3 June 11.8 12.5 +5.6 2004 171.3 July 21.4 20.0 –6.4 2005 164.7 August 20.4 15.5 –23.8 14 2006 156.6 September 10.7 9.7 –9.0 2007 162.4 October 13.0 13.5 +3.8 15 2008 164.2 November 13.5 14.9 +10.4 2009 173.5 December 12.3 16.3 +32.5 16 Source: CAA, Rentrak EDI. Total 164.2 173.5 +5.6 The year began strongly with January admissions up 8% Source: CAA, Rentrak EDI. Note: Figures may not sum to totals due to rounding. on the previous year, due mainly to the release of UK 17 film Slumdog Millionaire. The first major 3D animated Average weekly admissions ranged from 2.3 million in release of the year, Bolt, and the continued strong September to 4.5 million in July (Table 1.2). Average performance of Slumdog Millionaire following BAFTA weekly admissions in December were 3.7 million, up 18 and Academy Award® success helped to lift February from 2.8 million per week in December 2008. ticket sales by 16% (see Table 1.1). 19 20 Image: Slumdog Millionaire courtesy of Pathé UK Chapter 1: The box office – 9 21
  • 12.
    Table 1.2 Averageweekly admissions, 2008–2009 Table 1.3 Cinema admissions by region, 2009 2008 2009 Admissions weekly weekly Region (million) % average average Month (million) (million) London 41.7 24.0 January 3.0 3.3 Midlands 24.6 14.2 February 3.1 3.7 Lancashire 19.8 11.4 March 2.8 2.7 Southern 16.0 9.2 April 2.3 3.2 Yorkshire 14.6 8.4 May 2.9 3.6 Central Scotland 12.8 7.4 June 2.8 2.9 Wales and West 11.4 6.6 July 4.8 4.5 East of England 11.3 6.5 August 4.6 3.5 North East 6.5 3.7 September 2.5 2.3 Northern Ireland 5.7 3.3 October 2.9 3.1 South West 4.3 2.5 November 3.2 3.5 Northern Scotland 3.6 2.1 December 2.8 3.7 Border 1.3 0.8 Source: CAA, Rentrak EDI. Total 173.5 100.0 Source: CAA, Rentrak EDI. Table 1.3 shows how the 2009 admissions break down Note: Figures may not sum to totals due to rounding. by ISBA TV region, with London accounting for almost a quarter of UK admissions (24%). The pattern of national Figure 1.2 puts UK admissions in a longer term and regional admissions has remained largely perspective. Cinema-going increased rapidly during unchanged over the last decade. the Second World War, as audiences sought the latest news as well as escapism from the conflict. Ticket sales reached a peak of 1.64 billion in 1946 but then declined steeply throughout the late 1950s and early 1960s as television ownership became commonplace. The introduction of the VCR in the early 1980s had a further negative impact on admissions and the nadir was reached in 1984 with cinema-going levels down to an average of one visit per person per year. However, the introduction of multiplex cinemas to the UK from 1985 onwards reversed the trend and ushered in a decade and a half of steady growth. After a pause from 2003 to 2006, admissions grew again in 2007– 2009 returning to levels last seen in the early 1970s. 10 – UK Film Council Statistical Yearbook 2010
  • 13.
    1 2 Figure 1.2 Annual UK admissions, 1935–2009 3 Admissions (million) 1,800.0 1,600.0 4 1,400.0 1,200.0 5 1,000.0 800.0 6 600.0 400.0 7 200.0 0.0 1937 1943 1949 1955 1961 1967 1973 1979 1985 1991 1997 2003 2009 8 Admissions 946.0 1,541.0 1,430.0 1,181.8 449.1 264.8 134.2 111.9 72.0 100.3 138.9 167.3 173.5 Source: BFI, CAA, Rentrak EDI. Admissions Admissions Admissions Admissions Admissions Admissions Admissions 9 Year (million) Year (million) Year (million) Year (million) Year (million) Year (million) Year (million) 1935 912.3 1946 1,635.0 1957 915.2 1968 237.3 1979 111.9 1990 97.4 2001 155.9 1936 917.0 1947 1,462.0 1958 754.7 1969 214.9 1980 101.0 1991 100.3 2002 175.9 10 1937 946.0 1948 1,514.0 1959 581.0 1970 193.0 1981 86.0 1992 103.6 2003 167.3 1938 987.0 1949 1,430.0 1960 500.8 1971 176.0 1982 64.0 1993 114.4 2004 171.3 1939 990.0 1950 1,395.8 1961 449.1 1972 156.6 1983 65.7 1994 123.5 2005 164.7 1940 1,027.0 1951 1,365.0 1962 395.0 1973 134.2 1984 54.0 1995 114.6 2006 156.6 11 1941 1,309.0 1952 1,312.1 1963 357.2 1974 138.5 1985 72.0 1996 123.5 2007 162.4 1942 1,494.0 1953 1,284.5 1964 342.8 1975 116.3 1986 75.5 1997 138.9 2008 164.2 1943 1,541.0 1954 1,275.8 1965 326.6 1976 103.9 1987 78.5 1998 135.2 2009 173.5 12 1944 1,575.0 1955 1,181.8 1966 288.8 1977 103.5 1988 84.0 1999 139.1 1945 1,585.0 1956 1,100.8 1967 264.8 1978 126.1 1989 94.5 2000 142.5 13 1.2 Box office earnings According to the CAA/Rentrak EDI, the total UK box office for 2009 was £944 million, up 11% on 2008. This figure 14 covers all box office earnings during the calendar year 2009 for all films exhibited in the UK. The trends in box office takings from 2000 are shown in Table 1.4 and indicate growth of 62% in the period. 15 Table 1.4 UK box office trends, 2000–2009 1.3 Film releases and box office revenues Box office gross Cumulative Year (£ million) %+/– % In the UK and Republic of Ireland in 2009, 503 films were released for a week or more, down 5% on 2008. 16 2000 583 – – They generated £1,127 million in box office revenues – 2001 645 10.6 10.6 an increase of 21% on 2008. This figure differs from 2002 755 17.0 29.5 the £944 million in paragraph 1.2 because it includes 17 2003 742 –1.7 27.3 revenues generated in 2010 by films released in 2009 and covers the Republic of Ireland as well as the UK, 2004 770 3.8 32.1 which distributors treat as a single distribution territory. 18 2005 770 0.0 32.1 2006 762 –1.0 30.7 2007 821 7.7 40.8 19 2008 850 3.5 45.8 2009 944 11.1 61.9 20 Source: CAA, Rentrak EDI. Chapter 1: The box office – 11 21
  • 14.
    As can beseen in Table 1.5, the top 100 films took 91% of the box office, a slight increase on 2008’s figure. The remaining 403 films (80% of all releases) accounted for just 9% of gross revenues. A total of 14 films were released in the 3D format, up from six in 2008, and these films accounted for 16% of the UK and Republic of Ireland box office in 2009, up from 0.4% in 2008. Table 1.5 Summary of results at the UK and Republic of Ireland box office, 2005–2009 2005 2006 2007 2008 2009 Releases 467 505 516 527 503 Combined gross £ million 844.9 845.3 933.8 934.5 1,126.7 Top 20 films (% of box office) 54.7 48.1 51.2 49.6 48.6 Top 50 films (% of box office) 75.7 71.1 75.7 72.4 72.9 Top 100 films (% of box office) 91.5 88.6 91.0 90.3 91.1 Source: Rentrak EDI, RSU analysis. Note: Table 1.5 and all subsequent analysis of the theatrical market includes all titles released in 2009. The combined gross reflects the territorial gross (that is, including the Republic of Ireland), and includes those titles released in 2009 but also making money into 2010, up to and including 21 February 2010. Although the top 100 films have held their percentage of the box office, Figure 1.3 shows that the share of the top 50 films fell from 84% in 2001 to 73% last year. This reflects a relative strengthening in the performance of mid-box office films compared with the blockbusters, perhaps because the cinema audience has become gradually more diverse over these years. Figure 1.3 Market share percentage of top 50, Figure 1.4 Gross box office of top 50, top 51–150 and rest of films, 2000–2009 top 51–150 and rest of films, 2000–2009 % £ million 100 1,200 1,000 80 800 60 600 40 400 20 200 0 00 01 02 03 04 05 06 07 08 09 0 00 01 02 03 04 05 06 07 08 09 % share 3 2 2 2 3 3 5 4 4 3 Gross box 16 11 16 21 23 25 38 37 32 33 of rest office of rest % share of 17 14 16 20 22 21 24 20 24 24 Gross box office 106 105 132 160 179 182 206 190 226 273 top 51–150 top 51–150 % share of 81 84 82 78 75 76 71 76 72 73 Gross box office 514 628 680 634 622 641 600 707 676 821 top 50 of top 50 Source: Rentrak EDI, RSU analysis. Source: Rentrak EDI, RSU analysis. Note: Figures may not sum to 100 due to rounding. The number of films released in the UK in 2009 by the Figure 1.4 depicts the increase in box office revenue number of sites at the widest point of release is outlined over the last decade, with the top 50 films earning in Table 1.6. A total of 170 films were released at 100 £821 million in 2009, up 60% since 2000, while those sites or more (34%), while 196 films were released on ranked 51–150 earned £273 million in 2009, up 157% fewer than 10 sites (39% of all films released). Six out since 2000. of 10 films released in the UK went out on 49 prints or fewer, the same as 2008. 12 – UK Film Council Statistical Yearbook 2010
  • 15.
    1 2 Table 1.6 Number of releases and average box office gross by number of sites at widest point of release, 2009 3 Number of sites at WPR Number % of releases Average box office (£) 500 9 1.8 35,369,000 4 400–499 46 9.1 10,823,000 300–399 53 10.5 3,480,000 200–299 30 6.0 2,076,000 5 100–199 32 6.4 955,000 50–99 31 6.2 453,000 10–49 106 21.1 153,000 6 10 196 39.0 15,000 Total 503 100.0 2,240,000 7 Source: Rentrak EDI, RSU analysis. Note: Average box office rounded to nearest £1,000. Figures may not sum to totals due to rounding. 8 1.4 Country of origin of film releases As Table 1.7 indicates, of all films released in 2009, 42% (39% in 2008) were of USA origin (excluding UK 9 co-productions), and these films accounted for 81% of the total box office earnings (up from 65% in 2008). UK films, including co-productions, accounted for 23% of releases (up from 21% in 2008) and 16.7% of the box office, of which UK independent films earned over 8.2% and UK studio-backed titles 8.5%. 10 Films whose country of origin lies outside the UK and USA accounted for 35% of releases (down from 40% in 2008) but only 2.4% of earnings. European films represented 16% of all releases and 1.2% of revenues. Films from India 11 accounted for 1% of the box office from 12% of the releases and films from the rest of the world represented just 0.2% of the box office gross from 7% of releases. 12 Table 1.7 Country of origin of films released in the UK and Republic of Ireland, 2009 No. of releases % of 2009 box office 2009 box office Country of origin in 2009 all releases (£ million) share (%) 13 USA 212 42.1 912.5 81.0 UK independent films 100 19.9 92.4 8.2 UK studio-backed films* 13 2.6 95.6 8.5 14 All UK 113 22.5 188.0 16.7 Europe 82 16.3 13.8 1.2 15 India 59 11.7 10.8 1.0 Rest of the world 37 7.4 1.7 0.2 Total 503 100.0 1,126.7 100 16 Source: Rentrak EDI, RSU analysis. Box office gross = cumulative total up to 21 February 2010. *‘Studio-backed’ means backed by one of the major US film studios. 17 The changes in market share over time by country of origin of films are shown in Table 1.8. Overall, UK market share fell to its lowest level since 2003 but the UK independent component was the highest since our records began in 2002. US market share increased to 81%, almost level with the 2003 record figure. 18 19 20 Chapter 1: The box office – 13 21
  • 16.
    Table 1.8 Marketshare by country of origin, 2002–2009 2002 2003 2004 2005 2006 2007 2008 2009 USA 73.4 81.6 73.2 63.1 77.1 67.7 65.2 81.0 UK studio-backed 16.1 12.5 19.5 26.2 14.4 21.8 25.4 8.5 UK independent 6.5 3.4 3.9 6.9 4.7 6.8 5.7 8.2 All UK 22.6 15.9 23.4 33.1 19.1 28.6 31.1 16.7 Europe 0.7 0.9 0.6 1.6 1.2 1.8 2.3 1.2 India 1.0 1.0 1.1 1.5 1.8 1.6 1.4 1.0 Rest of the world 0.5 0.8 1.8 0.8 0.7 0.5 0.3 0.2 Total 100.0 100.0 100.0 100.0 100.0 100.0 100.0 100.0 Source: UK Film Council RSU. Table 1.9 compares the number of UK films across several gross box office bands with the non-UK output in 2009. The UK is better represented in the over £30 million gross category thanks to the success of Harry Potter and the Half-Blood Prince and Slumdog Millionaire. However, 62% of UK releases earned less than £100,000. Table 1.9 UK and non-UK releases by box office gross band, 2009 Non-UK releases UK releases Box office gross (£ million) Number % releases Number % releases 30 3 0.8 2 1.8 20 – 29.99 8 2.1 1 0.9 10 – 19.99 14 3.6 0 0 5 – 9.99 34 8.7 5 4.4 1 – 4.99 55 14.1 15 13.3 0.5 – 0.99 20 5.1 9 8.0 0.1 – 0.49 62 15.9 12 10.6 Less than 0.1 194 49.7 69 61.6 Total 390 100.0 113 100.0 Source: Rentrak EDI, RSU analysis. „ 3F or more information about top films in 2009 see Chapter 2 (page 15) 3F or further details of film distribution in 2009 see Chapter 8 (page 60) 3 For information about weekend/weekday box office performance see Chapter 8, section 8.3 (page 63) 3 For a review of the exhibition sector in 2009 see Chapter 9 (page 65) 14 – UK Film Council Statistical Yearbook 2010
  • 17.
    Chapter 2: Top filmsin 2009 The top film of 2009, Avatar, Facts in focus became the highest grossing • he biggest film of the year was Avatar, which earned T over £91 million to become the highest grossing film film of all time at the UK box of all time at the UK box office. office. It was one of a trio of 3D • hree UK films featured in the top 20 – Harry Potter T and the Half-Blood Prince, Slumdog Millionaire and releases in the top five films of Sherlock Holmes. the year, signalling the huge • here were nine sequels in the top 20, up from eight T popularity of the format. in 2008. • he top 20 UK films grossed £173 million at the UK T box office. • K independent film Slumdog Millionaire topped the U weekend box office charts for four weeks in 2009, more than any other film. • lumdog Millionaire was also the highest grossing S UK independent film, earning more than £31 million. • D film screenings accounted for 16% of the UK and 3 Republic of Ireland box office for films released in 2009 (£176 million).
  • 18.
    2.1 The top20 films In 2009 Avatar became the highest grossing film of all time at the UK box office, earning over £83 million up to 21 February 2010 and £91.4 million by 4 April, to surpass the previous record of £69.2 million set in 2008 by Mamma Mia!. Harry Potter and the Half-Blood Prince, the sixth in the Harry Potter franchise, grossed £51 million to claim the runner-up spot in the 2009 chart. Fourteen films earned more than £20 million, up from 10 in 2008, and all films in the top 20 earned more than £15 million (Table 2.1). Sequels and franchises accounted for nine of the top 20 films, up from eight in 2008. Three UK titles featured in the top 20 – Harry Potter and the Half-Blood Prince, Slumdog Millionaire and Sherlock Holmes. As in 2008, it was a good year for animation, with Ice Age III, Up, Monsters vs. Aliens, A Christmas Carol and Bolt earning just over £129 million between them. Table 2.1 Box office results for the top 20 films released in the UK and Republic of Ireland, 2009 Number Opening Country Box office of opening weekend Title of origin gross (£ million) cinemas gross (£ million) Distributor 1 Avatar* USA 83.27# 503 8.51 20th Century Fox 2 Harry Potter and the Half-Blood Prince UK/USA 50.72 584 19.78 Warner Bros 3 Ice Age III USA 35.02 526 7.64 20th Century Fox 4 Up USA 34.59 511 6.41 Disney 5 Slumdog Millionaire UK 31.66 324 1.83 Pathé 6 The Twilight Saga: New Moon USA 27.47 497 11.68 E1 Films 7 Transformers: Revenge of the Fallen USA 27.06 516 8.35 Paramount 8 Sherlock Holmes* UK/USA 25.71 476 3.08 Warner Bros 9 Alvin and the Chipmunks 2: USA 23.16 478 5.35 20th Century Fox The Squeakquel* 10 The Hangover USA 22.12 422 3.19 Warner Bros 11 Star Trek USA/Ger 21.40 499 5.95 Paramount 12 Monsters vs. Aliens USA 21.37 520 4.35 Paramount 13 A Christmas Carol USA 20.19 446 1.92 Disney 14 Night at the Museum 2 USA/Can 20.03 515 4.16 20th Century Fox 15 2012 USA 19.50 480 6.49 Sony Pictures 16 Angels and Demons USA 18.79 506 6.05 Sony Pictures 17 Bolt USA 17.94 496 5.46 Disney 18 X-Men Origins: Wolverine USA 16.28 488 6.66 20th Century Fox 19 Brüno USA 15.78 456 5.00 Universal 20 Marley and Me USA 15.25 467 4.41 20th Century Fox Source: Rentrak EDI, RSU analysis. Box office gross = cumulative total up to 21 February 2010. #At 4 April 2010 Avatar had grossed £91.4 million. Films with an asterisk (*) were still on release on 21 February 2010. 16 – UK Film Council Statistical Yearbook 2010 Image: Harry Potter and the Half-Blood Prince © 2009 Warner Bros. Entertainment Inc. Harry Potter Publishing Rights © J.K.R.
  • 19.
    1 2 2.2 The top 20 UK films 3 The top 20 UK films, shown in Table 2.2, had a combined gross of £173 million, which was 15% of the total UK box office. This was down from £266 million in 2008 (28% of gross box office). The top three films accounted for almost two-thirds of the top 20’s combined gross, a similar proportion to that in 2008, but 2008’s top three included the 4 record-breaking Mamma Mia!. Two of the top three were inward investment films, with Slumdog Millionaire at number two being the highest ranked independent UK film. While 54% of the top 20 films’ combined box office was from inward investment films, 15 of the 20 titles were independent films. The top 20 UK films encompassed a wide 5 range of genres including action, animation, fantasy, comedy, crime and drama. 6 Table 2.2 Box office results for the top 20 UK films released in the UK and Republic of Ireland, 2009 Country Box office Title of origin gross (£ million) Distributor 7 1 Harry Potter and the Half-Blood Prince UK/USA 50.72 Warner Bros 2 Slumdog Millionaire UK 31.66 Pathé 3 Sherlock Holmes* UK/USA 25.71 Warner Bros 8 4 Fantastic Mr. Fox* UK/USA 9.03 20th Century Fox 5 St Trinian’s 2: The Legend of Fritton’s Gold* UK 7.07 Entertainment 9 6 The Boat That Rocked UK/USA 6.23 Universal 7 Nativity UK 5.20 E1 Films 8 The Young Victoria UK/USA 5.11 Momentum 10 9 Planet 51* UK/Spa 4.91 Entertainment 10 Harry Brown* UK 4.56 Lions Gate 11 The Imaginarium of Dr Parnassus* UK/Can 3.94 Lions Gate 11 12 Nine* UK/USA 3.23 Entertainment 13 Dorian Gray UK 2.97 Momentum 12 14 The Damned United UK/USA 2.24 Sony Pictures 15 An Education* UK/USA 2.24 E1 Films 16 In the Loop UK 2.16 Optimum 13 17 Last Chance Harvey UK/USA 2.14 Momentum 18 Lesbian Vampire Killers UK 1.67 Momentum 14 19 Moon UK 1.32 Sony Pictures 20 Looking for Eric UK/Fra/Bel/Ita 1.31 Icon Source: Rentrak EDI, RSU analysis. 15 Box office gross = cumulative total up to 21 February 2010. Films with an asterisk (*) were still on release on 21 February 2010. 16 17 18 19 20 Chapter 2: Top films in 2009 – 17 21
  • 20.
    2.3 The top20 UK independent films The top 20 UK independent films, shown in Table 2.3, had a combined gross of £85 million, which was 8% of the total UK box office. Slumdog Millionaire was the highest earning film by far of the UK independent films. Its gross accounted for 37% of the combined gross of the top 20 UK independent films, and it was the only UK independent film to earn more than £10 million. Three other films, St Trinian’s 2: The Legend of Fritton’s Gold, the partly improvised comedy Nativity and the story of the early years of Queen Victoria’s reign, The Young Victoria, all grossed more than £5 million. Again, the top 20 UK independent films encompassed many genres and included four comedy films, and three biopics, The Young Victoria, Nowhere Boy and Bronson. Table 2.3 Box office results for the top 20 UK independent films released in the UK and Republic of Ireland, 2009 Country Box office Title of origin gross (£ million) Distributor 1 Slumdog Millionaire UK 31.66 Pathé 2 St Trinian’s 2: The Legend of Fritton’s Gold* UK 7.07 Entertainment 3 Nativity UK 5.20 E1 Films 4 The Young Victoria UK/USA# 5.11 Momentum 5 Planet 51* UK/Spa 4.91 Entertainment 6 Harry Brown* UK 4.56 Lions Gate 7 The Imaginarium of Dr Parnassus* UK/Can 3.94 Lions Gate 8 Nine* UK/USA# 3.23 Entertainment 9 Dorian Gray UK 2.97 Momentum 10 An Education* UK/USA# 2.24 E1 Films 11 In the Loop UK 2.16 Optimum 12 Last Chance Harvey UK/USA# 2.14 Momentum 13 Lesbian Vampire Killers UK 1.67 Momentum 14 Moon UK 1.32 Sony Pictures 15 Looking For Eric UK/Fra/Bel/Ita 1.31 Icon 16 Nowhere Boy* UK 1.27 Icon 17 Bright Star UK/Aus 1.07 Warner Bros 18 Love Aaj Kal UK/Ind 1.04 Eros 19 The Secret of Moonacre UK/Hungary/Fra 0.94 Warner Bros 20 Bronson UK 0.90 Vertigo Source: Rentrak EDI, RSU analysis. Box office gross = cumulative total up to 21 February 2010. Films with an asterisk (*) were still on release on 21 February 2010. #The Young Victoria, Nine, An Education and Last Chance Harvey were made with independent (non-studio) US support. 2.4 The top 3D films The development of digital 3D exhibition had a major impact on the box office in 2009. Fourteen 3D films were released in 2009, generating £175.8 million, up to 21 February 2010, from their 3D screenings (16% of the UK and Republic of Ireland box office). The top 10 3D releases are listed in Table 2.4. My Bloody Valentine was the first of these films to be released and, although it had the lowest 3D gross and the lowest total gross of all the listed films, its 3D gross as a percentage of total gross was the highest of 2009’s 3D films. This film was also shown at the lowest number of 3D sites. As the number of 3D sites increased through the year, so did the total gross and the 3D gross of 3D films. 18 – UK Film Council Statistical Yearbook 2010
  • 21.
    1 2 Avatar was the highest grossing film of the year, so it appears at the top of the 3D list, but its 3D takings of 3 £68.5 million (83% of its total gross) up to 21 February 2010, were greater than the total gross of any other 2009 film. This film was released in December and has played in the highest number of 3D sites of all films. The second and third highest grossing 3D films, Ice Age III and Up, are both in the top four of all films in 2009 (the only non-3D 4 film in the top four is Harry Potter and the Half-Blood Prince). Further, the top six 3D films appear in the top 20 films of the year, which indicates the popularity of 3D films and their increasing importance to the UK box office. 5 Table 2.4 Top 10 3D releases in the UK and Republic of Ireland, 2009 Total gross 3D gross 3D as % of Number of Title (£ million) (£ million) total gross 3D sites Distributor 6 1 Avatar* 83.27 68.52 82 302 20th Century Fox 2 Ice Age III 35.02 18.15 52 240 20th Century Fox 3 Up 34.59 20.77 60 266 Disney 7 4 Monsters vs. Aliens 21.37 9.37 44 169 Paramount 5 A Christmas Carol 20.19 14.27 71 281 Disney 8 6 Bolt 17.94 7.18 40 124 Disney 7 G-Force 13.58 9.36 69 228 Disney 8 The Final Destination 12.81 10.72 84 228 Entertainment 9 9 Coraline 7.43 5.46 73 124 Universal 10 My Bloody Valentine 6.95 6.20 89 118 Lions Gate 10 Source: Rentrak EDI. Box office gross = cumulative total up to 21 February 2010. Films with an asterisk (*) were still on release on 21 February 2010. Note: the 3D figures do not include IMAX screenings, although IMAX revenues contribute to the total gross. 11 2.5 Best weekend performances of UK films 12 A total of 36 films topped the UK weekend box office charts over the course of 2009 and two of those, Harry Potter and the Half-Blood Prince and Slumdog Millionaire, were UK titles. These two films spent a total of seven weeks at number one (Table 2.5). Slumdog Millionaire, a UK independent film, was the top film at the UK box office on four 13 weekends, which is more than any other film in 2009. Harry Potter and the Half-Blood Prince took £4.7 million on its opening day and £19.8 million on its opening weekend. However, this film opened on Wednesday 15 July, so the opening ‘weekend’ was extended to five days. Takings on the usual Friday to Sunday three-day weekend were 14 £11.9 million. Harry Potter and the Half-Blood Prince’s opening ‘weekend’ takings were 39% of the film’s final box office gross while Slumdog Millionaire’s opening weekend represented just 8% of its final box office gross. 15 Table 2.5 UK films at number one in the weekend box office charts, 2009 Weekend Box office No. of weeks Title First week at top gross (£ million) gross (£ million) Distributor at no. 1 16 Harry Potter and the Half-Blood Prince 17 July 2009 19.8 50.7 Warner Bros 3 Slumdog Millionaire 16 January 2009 2.6 31.7 Pathé 4 17 Source: Rentrak EDI, RSU analysis. „ 18 3F or more about the top films of all time see Chapter 3 (page 20) 3F or more on UK talent and awards see Chapter 7 (page 52) 19 3F or further information about film distribution in 2009 see Chapter 8 (page 60) 3F or information about weekend/weekday box office performance see Chapter 8, section 8.3 (page 63) 3F or an overview of the exhibition sector in 2009 see Chapter 9 (page 65) 20 Chapter 2: Top films in 2009 – 19 21
  • 22.
    Chapter 3: Top filmsof all time at the UK box office Avatar has entered the record Facts in focus books as the top earning film • he top 20 highest grossing films at the UK box office T include two films from 2009 – Avatar and Harry Potter of all time at the UK box office, and the Half-Blood Prince. surpassing the record held by • vatar has beaten Titanic to take the top spot in the A inflation-adjusted box office chart. Titanic for over a decade. Harry • arry Potter and Lord of the Rings films made up six and H Potter, with six out of the top three respectively of the top 20 films in the unadjusted 20 films, continues to cast his all time chart. James Bond titles scored two in the top 20. spell as the UK’s favourite hero. • equels and franchise films made up 16 of the top 20. S • leven of the top 20 films were UK/USA collaborations. E • hirteen of the top 20 films were based on stories and T characters created by UK writers.
  • 23.
    1 2 3.1 All time top 20 films at the UK box office 3 In the absence of admissions data on individual films, top films can only be measured in terms of earnings at the box office. Inflation is a key factor affecting earnings and this needs to be borne in mind against some of the figures quoted in this chapter (however, some figures are adjusted for inflation). Most of this chapter relates to actual box 4 office receipts from 1989 onwards so can be categorised as all time top films since it is unlikely that anything produced before 1989 will have earned more in nominal terms. 5 Avatar became the highest grossing film of all time at the UK box office, earning over £91 million by 4 April 2010. One other film released in 2009 appears in the list of the top 20 films of all time at the UK box office – Harry Potter and the Half-Blood Prince. The list, shown in Table 3.1, is dominated by franchise movies, including six Harry Potter 6 titles and the Lord of the Rings trilogy. In fact, only four of the top 20 are neither sequels nor franchise titles, namely Avatar, Mamma Mia!, Titanic and The Full Monty. Eleven of the top 20 films are UK/USA collaborations and the importance of UK creative talent to the global film industry is underlined by the presence of no fewer than 13 films based on stories and characters created by UK writers. 7 Table 3.1 All time top 20 films at the UK box office 8 UK box Country office total Year of Title of origin (£ million) UK distributor release 1 Avatar* USA 83.27 20th Century Fox 2009 9 2 Mamma Mia! UK/USA 69.17 Universal 2008 3 Titanic USA 69.03 20th Century Fox 1998 10 4 Harry Potter and the Philosopher’s Stone UK/USA 66.10 Warner Bros 2001 5 Lord of the Rings: The Fellowship of the Ring USA/NZ 63.00 Entertainment 2001 6 Lord of the Rings: The Return of the King USA/NZ 61.06 Entertainment 2003 11 7 Lord of the Rings: The Two Towers USA/NZ 57.60 Entertainment 2002 8 Casino Royale UK/USA/Czech 55.60 Sony Pictures 2006 12 9 Harry Potter and the Chamber of Secrets UK/USA 54.78 Warner Bros 2002 10 Pirates of the Caribbean: Dead Man’s Chest USA 52.52 Buena Vista 2006 11 The Full Monty UK/USA 52.23 20th Century Fox 1997 13 12 Star Wars Episode I: The Phantom Menace USA 51.06 20th Century Fox 1999 13 Quantum of Solace UK/USA 51.07 Sony Pictures 2008 14 14 Harry Potter and the Half-Blood Prince UK/USA 50.72 Warner Bros 2009 15 Harry Potter and the Order of the Phoenix UK/USA 49.43 Warner Bros 2007 16 Harry Potter and the Goblet of Fire UK/USA 49.20 Warner Bros 2005 15 17 The Dark Knight UK/USA 49.07 Warner Bros 2008 18 Shrek 2 USA 48.10 UIP 2004 16 19 Jurassic Park USA 47.89 UIP 1993 20 Harry Potter and the Prisoner of Azkaban UK/USA 46.08 Warner Bros 2004 Source: Rentrak EDI, RSU analysis. 17 Note: Figures have not been inflation adjusted. Box office gross = cumulative total up to 21 February 2010. At 4 April 2010 Avatar had grossed £91.4 million. Films with an asterisk (*) were still on release on 21 February 2010. Based on box office data for 1989–2009. The table is titled all time because, with price inflation, it is unlikely that any films before 1989 will have earned more in nominal terms. 18 19 20 Image: Avatar ©2009, Twentieth Century Fox. All rights reserved Chapter 3: Top films of all time at the UK box office – 21 21
  • 24.
    3.2 Inflation-adjusted top20 films at the UK box office Table 3.2 shows an inflation-adjusted box office chart based on films released in the UK since 1975 (when coverage of leading titles begins). Even after adjusting the figures for inflation, Avatar is the highest grossing film of all time at the UK box office with £91 million (up to 4 April 2010) in 2008/09 terms, with Titanic slipping to second place with £88 million. Avatar was still on release on 4 April 2010, so its final gross will be higher than shown in Table 3.2. The first of three Harry Potter films is at number three, with the franchise’s first outing Harry Potter and the Philosopher’s Stone earning the equivalent of £79.8 million. All three Lord of the Rings films make the chart, with The Fellowship of the Ring in fourth place (£76 million). In fifth place is Mamma Mia!, the highest grossing film of 2008, with an inflation-adjusted gross of £70.9 million. Three classic releases from the 1970s remain in the top 20: Steven Spielberg’s Jaws (1975) is at number six with adjusted revenues of £70 million, the original Star Wars (1977) appears at number 11 with £65.8 million and Grease (1978) is at 14 with £61 million. Table 3.2 Top 20 highest grossing films at the UK box office (inflation adjusted1) UK box office total Country (2008/09 Year of Title of origin £ million) UK distributor release 1 Avatar USA 91.4* 20th Century Fox 2009 2 Titanic USA 88.0 20th Century Fox 1998 3 Harry Potter and the Philosopher’s Stone UK/USA 79.8 Warner Bros 2001 4 Lord of the Rings: The Fellowship of the Ring USA/NZ 76.0 Entertainment 2001 5 Mamma Mia! UK/USA 70.9 Universal 2008 6 Jaws USA 70.0 UIP 1975 7 Lord of the Rings: The Return of the King USA/NZ 69.4 Entertainment 2003 8 Jurassic Park USA 69.3 UIP 1993 9 The Full Monty UK/USA 68.0 20th Century Fox 1997 10 Lord of the Rings: The Two Towers USA/NZ 67.3 Entertainment 2002 11 Star Wars USA 65.8 20th Century Fox 1977 12 Harry Potter and the Chamber of Secrets UK/USA 64.0 Warner Bros 2002 13 Star Wars Episode I: The Phantom Menace USA 63.8 20th Century Fox 1999 14 Grease USA 60.6 UIP 1978 15 Casino Royale UK/USA/Cze 58.6 Sony Pictures 2006 16 Pirates of the Caribbean: Dead Man’s Chest USA 55.4 Buena Vista 2006 17 E.T., The Extra-Terrestrial USA 55.2 UIP 1982 18 Toy Story 2 USA 54.7 Walt Disney 2000 19 Harry Potter and the Goblet of Fire UK/USA 53.4 Warner Bros 2005 20 Shrek 2 USA 53.4 UIP 2004 Source: UK Film Council RSU analysis of Rentrak EDI data. 1. The 2008/09 £ calculated using the UK GDP deflator (HMT). *The box office gross for Avatar is to 4 April 2010; it was still on release at that time. 22 – UK Film Council Statistical Yearbook 2010
  • 25.
    1 2 3.3 All time top 20 UK films at the UK box office 3 The list of the all time top 20 UK films is dominated by inward investment features, with British talent, infrastructure and locations supported by US studio investment (Table 3.3). All six Harry Potter films feature in the top 20, together with three titles from the James Bond franchise. 4 Table 3.3 All time top 20 UK films at the UK box office 5 UK box Country office total Year of Title of origin (£ million) UK distributor release 1 Mamma Mia! UK/USA 69.17 Universal 2008 6 2 Harry Potter and the Philosopher’s Stone UK/USA 66.10 Warner Bros 2001 3 Casino Royale UK/USA/Cze 55.60 Sony Pictures 2006 7 4 Harry Potter and the Chamber of Secrets UK/USA 54.78 Warner Bros 2002 5 The Full Monty UK/USA 52.23 20th Century Fox 1997 6 Quantum of Solace UK/USA 51.07 Sony Pictures 2008 8 7 Harry Potter and the Half-Blood Prince UK/USA 50.72 Warner Bros 2009 8 Harry Potter and the Order of the Phoenix UK/USA 49.43 Warner Bros 2007 9 9 Harry Potter and the Goblet of Fire UK/USA 49.20 Warner Bros 2005 10 The Dark Knight UK/USA 49.07 Warner Bros 2008 11 Harry Potter and the Prisoner of Azkaban UK/USA 46.08 Warner Bros 2004 10 12 Bridget Jones’s Diary UK/USA 42.01 UIP 2001 13 Charlie and the Chocolate Factory UK/USA 37.46 Warner Bros 2005 11 14 Love Actually UK/USA 36.80 UIP 2003 15 Die Another Day UK/USA 36.06 20th Century Fox 2002 16 Bridget Jones: The Edge of Reason UK/USA 36.00 UIP 2004 12 17 Wallace Gromit: The Curse of the Were-Rabbit UK/USA 32.01 UIP 2005 18 Slumdog Millionaire UK 31.66 Pathé 2009 13 19 Notting Hill UK/USA 31.01 Universal 1999 20 The Da Vinci Code UK/USA 30.51 Sony Pictures 2006 Source: Rentrak EDI, RSU analysis. 14 Note: Figures have not been inflation adjusted. Based on box office data for 1989–2009. The table is titled all time because, with price inflation, it is unlikely that any films before 1989 will have earned more in nominal terms. 15 16 17 18 19 20 Chapter 3: Top films of all time at the UK box office – 23 21
  • 26.
    3.4 All timetop 20 independent UK films at the UK box office Table 3.4 highlights the all time top earning independent (that is, made without US major studio involvement) UK titles. The highest grossing independent British film was Slumdog Millionaire (£31.7 million) followed by Four Weddings and a Funeral (£27.8 million) and Trainspotting (£12.4 million). Each of the top nine UK independent films earned more than £10 million at the UK box office, and all the top 20 UK independent films earned in excess of £5 million. Table 3.4 All time top 20 independent UK films at the UK box office UK box Country office total Year of Title of origin (£ million) UK distributor release 1 Slumdog Millionaire UK 31.66 Pathé 2009 2 Four Weddings and a Funeral UK 27.76 Carlton 1994 3 Trainspotting UK 12.43 Polygram 1996 4 St Trinian’s UK 12.28 Entertainment 2007 5 Gosford Park UK/USA# 12.26 Entertainment 2002 6 Bend it Like Beckham UK/Ger 11.55 Lions Gate 2002 7 Run, Fat Boy, Run UK/USA# 11.02 Entertainment 2007 8 Kevin Perry Go Large UK 10.46 Icon 2000 9 East is East UK 10.37 Film Four 1999 10 The Queen UK/Fra/Ita 9.42 Pathé 2006 11 Valiant UK/USA# 8.52 Entertainment 2005 12 The Duchess UK/Fra/Ita 7.12 Pathé 2008 13 St Trinian’s 2: The Legend of Fritton’s Gold UK 7.07 Entertainment 2009 14 Waking Ned UK/Fra/USA# 7.06 20th Century Fox 1999 15 Miss Potter UK/USA# 6.95 Momentum 2007 16 Stormbreaker UK/Ger/USA# 6.82 Entertainment 2006 17 The Constant Gardener UK/Ger/USA# 6.22 UIP 2005 18 The Magic Roundabout UK/Fra 5.96 Pathé 2005 19 Nativity UK 5.20 E1 Films 2009 20 Bride and Prejudice UK/USA# 5.18 Pathé 2004 Source: Rentrak EDI, RSU analysis. Note: Figures have not been inflation adjusted. Based on box office data for 1989–2009. The table is titled all time because, with price inflation, it is unlikely that any films before 1989 will have earned more in nominal terms. #Gosford Park, Run, Fat Boy, Run, Valiant, Waking Ned, Miss Potter, Stormbreaker, The Constant Gardener and Bride and Prejudice were made with independent (non studio) US support. „ 3F or top films in 2009 see Chapter 2 (page 15) 3F or more on UK talent see Chapter 7 (page 52) 24 – UK Film Council Statistical Yearbook 2010
  • 27.
    Chapter 4: Genre andclassification Cinema-goers enjoy a wide Facts in focus choice of styles, genres • omedy, traditionally popular with a broad spectrum C of audiences, accounted for 24% of releases and 20% and subjects. Comedy is of the box office. consistently the UK’s favourite • rama accounted for the second highest proportion D of releases (21%) but shared only 7% of the box office. genre, taking a fifth of the • cience fiction, including the record breaking Avatar, S box office in 2009. More films took more money per site on average than other genres. were classified ‘15’ than any • he genre pattern of UK films and UK independent films T other classification, but ‘12A’ was broadly similar to that of all films on release but there were differences in the patterns of box office by films took the largest single genre. Amongst UK independent films, drama took most at the box office. share of the box office. • ore films were released with a ‘15’ classification than M any other category (44% of all releases) though ‘12A’ films took the largest share of the box office (42% of total box office).
  • 28.
    4.1 Genre For statisticalpurposes, the Research and Statistics Unit assigns a primary genre to every film released in the UK in 2009. This is not meant to be prescriptive but helps gauge the relative popularity of different genres on a consistent basis from year to year. The list of genres is based on conventions commonly used within the industry and by published sources such as the British Board of Film Classification (BBFC) and the Internet Movie Database (IMDb). The full list of genres and classification of each title released in the UK and Ireland in 2009 is available on our website (www.ukfilmcouncil.org.uk/genre). 4.1.1 Genre of all film releases Table 4.1 indicates the relative popularity of different genres at the box office in the UK and Republic of Ireland in 2009. Comedy was once again the top grossing genre (earning £223.3 million), followed by animation (£160.0 million) and action (£147.2 million). The top two films of 2009 at the UK box office, the record breaking Avatar and the very successful Harry Potter and the Half-Blood Prince helped the science fiction and fantasy genres to fourth and sixth places in the list of highest grossing genres. Harry Potter and the Half-Blood Prince accounted for three-quarters of the total box office of all fantasy genre films. Despite having the second largest proportion of releases (21%), drama films shared only 7% of the box office gross. Table 4.1 Films released in the UK and Republic of Ireland by genre, 2009, ranked by gross box office Number % of all Gross box office % of total Genre of releases releases (£ million) box office Top performing title Comedy 121 24.1 223.3 19.8 The Hangover Animation 14 2.8 160.0 14.2 Ice Age III Action 55 10.9 147.2 13.1 Transformers: Revenge of the Fallen Sci-fi 9 1.8 133.8 11.9 Avatar Drama 104 20.7 77.9 6.9 Slumdog Millionaire Fantasy 6 1.2 67.6 6.0 Harry Potter and the Half-Blood Prince Horror 35 7.0 66.7 5.9 Final Destination Crime 32 6.4 40.6 3.6 Gran Torino Romance 10 2.0 38.0 3.4 The Twilight Saga: New Moon Family 2 0.4 36.7 3.3 Alvin and the Chipmunks 2: The Squeakquel Thriller 19 3.8 33.7 3.0 Angels and Demons Adventure 9 1.8 33.2 2.9 Night at the Museum 2 Biopic 19 3.8 22.7 2.0 The Young Victoria Musical 5 1.0 20.7 1.8 Fame War 5 1.0 12.5 1.1 Inglourious Basterds Documentary 57 11.3 12.0 1.1 Michael Jackson’s This Is It Western 1 0.2 0.1 0.1 Once upon a Time in the West Total 503 100.0 1,126.7 100.0 Source: Rentrak EDI, BBFC, IMDb, RSU analysis. Figures as at 21 February 2010. Three of the top performing films by genre originated in the UK, demonstrating the variety of story types of successful British films (Harry Potter and the Half-Blood Prince, Slumdog Millionaire and The Young Victoria). 26 – UK Film Council Statistical Yearbook 2010 Image: Inglourious Basterds © 2009 Universal Studios. ALL RIGHTS RESERVED. Photo by Francois Duhamel
  • 29.
    1 2 The pattern of genres ranked by the average number of sites at the widest point of release (WPR) is shown in Table 3 4.2. The top genre by WPR in 2009 was family. This is the same as in 2007, but science fiction, 2008’s top genre, is fourth in the present list, despite the influence of Avatar. In 2009 the average WPR for family films was 476 sites. This average is based on just two films however, Alvin and the Chipmunks 2: The Squeakquel which had a WPR 4 of 492, and G-Force with a WPR of 459. The film with the widest release at WPR in 2009 was Harry Potter and the Half-Blood Prince, with 586 sites. Documentary continued to have a low average number of sites at WPR, but 2009’s average of 20 is almost double 2008’s average of 11. Western is shown as the genre with the lowest average 5 number of sites at WPR, but this is based on a limited showing (two cinemas) of the 1968 film Once upon a Time in the West. 6 Table 4.2 Films released in the UK and Republic of Ireland by genre, 2009, ranked by average widest point of release Average number Gross 7 of sites at widest Number of box office Genre point of release releases (£ million) Family 476 2 36.7 8 Animation 357 14 160.0 Fantasy 349 6 67.6 Sci-fi 296 9 133.8 9 Musical 268 5 20.7 Adventure 253 9 33.2 10 Horror 158 35 66.7 Action 156 55 147.2 Biopic 144 19 22.7 11 Romance 137 10 38.0 Comedy 135 121 223.3 12 War 128 5 12.5 Crime 114 32 40.6 Thriller 110 19 33.7 13 Drama 48 104 77.9 Documentary 20 57 12.0 Western 2 1 0.1 14 Total 122 503 1,126.7 Source: Rentrak EDI, BBFC, IMDb, RSU analysis. 15 Figures as at 21 February 2010. 16 17 18 19 20 Chapter 4: Genre and classification – 27 21
  • 30.
    Table 4.3 demonstrateswhat the different genres generated in box office revenues per site, which gives a good indication of performance in the market while controlling for the size of release. Science fiction tops this list, mainly due to Avatar. A high percentage of the sites screening Avatar showed it on 3D screens, which attract premium prices. Comedy, which took the largest slice of box office overall, is much lower placed when the average WPR is taken into account, indicating a long tail of less able performers. Table 4.3 Films released in the UK and Republic of Ireland by genre, 2009, ranked by average box office gross per site Average Gross box office box office Genre per site (£) (£ million) Total sites Sci-fi 50,136 113.8 2,668 Family 38,543 36.7 951 Fantasy 32,314 67.6 2,092 Animation 32,027 160.0 4,995 Romance 27,647 38.0 1,374 War 19,558 12.5 641 Action 17,196 147.2 8,559 Thriller 16,173 33.7 2,085 Drama 15,473 77.9 5,036 Musical 15,458 20.7 1,342 Adventure 14,561 33.2 2,280 Western 14,276 0.1 2 Comedy 13,627 223.3 16,388 Horror 12,052 66.7 5,535 Crime 11,118 40.6 3,656 Documentary 10,407 12.0 1,155 Biopic 8,277 22.7 2,745 Total 18,319 1,126.7 61,504 Source: Rentrak EDI, BBFC, IMDb, RSU analysis. Figures as at 21 February 2010. Total sites = number of releases multiplied by average number of sites at widest point of release. 4.1.2 Genre of UK and UK independent film releases Looking at the genres of UK films and UK independent films released in 2009 we see similar rankings to those for all films released for percentages of releases by genre, but differences in share of box office by genre (Figures 4.1 and 4.2). Comedy, drama and documentary occupied the top three places for numbers of releases for UK, UK independent and all film releases. For all releases comedy was clearly the genre with the greatest proportion of releases while for both UK and UK independent films drama was the top genre. However, when looking at box office by genre, there are notable differences between the three categories. For all films, comedy was the top earning genre (20% of the total box office for all films), while the box office success of Harry Potter and the Half-Blood Prince and Slumdog Millionaire made fantasy (with 30% of the total box office for UK films) the highest earning category for UK films, and drama (45% of the box office for UK independent films) the highest earning genre for UK independent films. Comedy accounted for 12% of the box office for UK films and 18% of the box office for UK independent films. For all films, drama and fantasy accounted for 7% and 6% of the total box office respectively. Avatar’s record breaking box office gross contributed to the science fiction genre taking 12% of the total box office for all films, whereas science fiction films accounted for only 0.7% of the total box office for UK films and 1.4% of the total box office for UK independent films (Tables 4.1, 4.4 and 4.5). 28 – UK Film Council Statistical Yearbook 2010
  • 31.
    1 2 Table 4.4 UK films released in the UK and Republic of Ireland by genre, 2009, ranked by gross box office 3 Gross % Number of % box office of total Genre releases of all releases (£ million) box office Top performing title 4 Fantasy 4 3.5 55.7 29.6 Harry Potter and the Half-Blood Prince Drama 26 23.0 42.8 22.8 Slumdog Millionaire Action 8 7.1 26.7 14.2 Sherlock Holmes 5 Comedy 18 15.9 23.1 12.3 St Trinian’s 2: The Legend of Fritton’s Gold Animation 3 2.7 14.0 7.4 Fantastic Mr. Fox 6 Biopic 8 7.1 10.5 5.6 The Young Victoria Crime 5 4.4 4.6 2.5 Harry Brown Musical 2 1.8 3.5 1.9 Nine 7 Romance 4 3.5 2.6 1.5 Last Chance Harvey Horror 11 9.7 1.6 0.8 Tormented Sci-fi 1 0.9 1.3 0.7 Moon 8 Thriller 9 8.0 0.9 0.5 Triangle Documentary 13 11.5 0.4 0.2 Age of Stupid 9 War 1 0.9 0.3 0.2 Glorious 39 Total 113 100.0 188.0 100.0 Source: Rentrak EDI, BBFC, IMDb, RSU analysis. 10 Figures as at 21 February 2010. Note: Percentages may not add to 100 due to rounding. UK fantasy films returned to top the chart in 2009 (Table 4.4), as was predicted in section 4.1.2 of our Yearbook 11 2009. Harry Potter and the Half-Blood Prince’s gross of £50.7 million was itself more than the total gross for any other genre, and helped the total gross for the fantasy genre to £55.7 million. Drama had more releases than any other genre, and is second in the list, but 74% of the genre’s total box office was contributed by Slumdog 12 Millionaire’s gross of £31.7 million. Action was the third highest earning genre, mainly due to the success of Sherlock Holmes. Also contributing 13 to the total gross for this genre were three re-released James Bond films, Dr No, From Russia with Love and On Her Majesty’s Secret Service. Comedy was the fourth highest earning genre, down from third in 2008, but with the same share of the total box 14 office from fewer releases. In 2009 UK comedy films earned 12% of the total box office from 18 releases while in 2008 the comedy genre earned 12% of the total box office from 25 releases. The highest-grossing UK comedy of 2009 was St Trinian’s 2: The Legend of Fritton’s Gold at £7.1 million compared with Angus, Thongs and Perfect 15 Snogging at £5.5 million in 2008. For all films, comedy was the highest earning genre and hence contributed a higher percentage of the box office for all films (19%) than for UK films (12%) (see Tables 4.1 and 4.4). 16 17 18 19 20 Chapter 4: Genre and classification – 29 21
  • 32.
    Table 4.5 UKindependent films released in the UK and Republic of Ireland by genre, 2009, ranked by gross box office Gross % Number of % box office of total Genre releases of all releases (£ million) box office Top performing title Drama 24 24.0 42.0 45.4 Slumdog Millionaire Comedy 17 17.0 16.9 18.2 St Trinian’s 2: The Legend of Fritton’s Gold Biopic 7 7.0 8.2 8.9 The Young Victoria Fantasy 3 3.0 5.0 5.4 The Imaginarium of Dr Parnassus Animation 2 2.0 5.0 5.4 Planet 51 Crime 5 5.0 4.6 5.0 Harry Brown Musical 2 2.0 3.5 3.8 Nine Romance 4 4.0 2.6 2.8 Last Chance Harvey Sci-fi 1 1.0 1.3 1.4 Moon Thriller 9 9.0 0.9 1.0 Triangle Action 4 4.0 0.9 1.0 Dead Man Running Horror 9 9.0 0.9 0.9 Tormented Documentary 12 12.0 0.4 0.4 Age of Stupid War 1 1.0 0.3 0.3 Glorious 39 Total 100 100.0 92.4 100.0 Source: Rentrak EDI, BBFC, IMDb, RSU analysis. Figures as at 21 February 2010. Note: Percentages may not add to 100 due to rounding. In 2009, 113 UK films were released and of these 100 were UK independent films. Because of the small number of non-independent UK films there are only small differences in the proportions of releases by genre. However, because some of the non-independent UK films, such as Harry Potter and the Half-Blood Prince and Sherlock Holmes, had considerable success at the box office, there are differences in the percentages of box office takings by genre. Drama was the most popular genre for UK independent films. The £42 million earned by films of this genre represented 45% of the total box office of all UK independent films. This is largely due to the success of Slumdog Millionaire which grossed £31.7 million. Comedy was the second highest earning genre with 18% of the total box office. Comedy included the second and third highest grossing UK independent films of 2009, St Trinian’s 2: The Legend of Fritton’s Gold (£7.1 million) and Nativity (£5.2 million). Biopic was the third highest earning genre for UK independent films. The Young Victoria’s gross of £5.1 million accounted for 62% of the total for this genre, which also included Nowhere Boy, the film about the early adolescent years of John Lennon. Biopics contributed 9% of the total gross of all UK independent films in 2009. This compares with 6% for UK films and just 2% for all films (see Tables 4.1, 4.4 and 4.5). Dramas, biopics, horrors and thrillers formed a higher proportion of UK and UK independent film releases than of all films released in the UK in 2009. Comedy and action were the genres that were slightly under-represented in UK and UK independent films, compared with all films released in the UK in 2009. The biggest difference in the proportions of films released by genre between UK and UK independent films is in the action genre. Eight UK action films were released in 2009, and only four of these were independent films. 30 – UK Film Council Statistical Yearbook 2010
  • 33.
    1 2 Figure 4.1 Proportion of box office by genre for all films, UK films and UK independent films, 2009 3 % of box office 50 4 40 30 5 20 6 10 0 n e n ic y e y a ily y or al ce i r ar n 7 i-f le ed r as ur im am tio io er op ic ta W rr m an ril Sc at nt nt t us m Cr Ho en Ac es Fa Bi Dr Th m im Fa ve Co M W m Ro Ad An cu Do 8 All films 13.1 2.9 14.2 2.0 19.8 3.6 1.1 6.9 3.3 6.0 5.9 1.8 3.4 11.9 3.0 1.1 0.0 UK films 14.2 0.0 7.4 5.6 12.3 2.5 0.2 22.8 0.0 29.6 0.8 1.9 1.4 0.7 0.5 0.2 0.0 UK independent 1.0 0.0 5.4 8.9 18.2 5.0 0.4 45.4 0.0 5.4 0.9 3.8 2.8 1.4 1.0 0.3 0.0 films 9 Source: Rentrak EDI, BBFC, IMDb, RSU analysis. 10 Figure 4.2 Proportion of releases by genre for all films, UK films and UK independent films, 2009 % of releases 30 11 25 20 12 15 13 10 5 14 0 n e n ic y e ry a ily y or al ce i r ar rn i-f le ed as ur im am io io op ic ta W rr te m an ril Sc t at nt nt us m Cr Ho en Ac es Fa Bi Dr Th m im Fa ve Co M W m Ro Ad An cu 15 Do All films 10.9 1.8 2.8 3.8 24.1 6.4 11.3 20.7 0.4 1.2 7.0 1.0 2.0 1.8 3.8 1.0 0.2 UK films 7.1 0.0 2.7 7.1 15.9 4.4 11.5 23.0 0.0 3.5 9.7 1.8 3.5 0.9 8.0 0.9 0.0 16 UK independent 4.0 0.0 2.0 7.0 17.0 5.0 12.0 24.0 0.0 3.0 9.0 2.0 4.0 1.0 9.0 1.0 0.0 films Source: Rentrak EDI, BBFC, IMDb, RSU analysis. 17 18 19 20 Chapter 4: Genre and classification – 31 21
  • 34.
    4.2 BBFC classification Allfilms in the UK must carry a classification indicating their suitability for exhibition in premises licensed for cinematic exhibition by local authorities. The BBFC classifies the majority of films for theatrical release, although local authorities may grant their own classification if they decide to. The symbols used by the BBFC, and their meanings, are given in Table 4.6. Table 4.6 BBFC film classifications U (Universal) Suitable for all PG (Parental Guidance) General viewing, but some scenes may be unsuitable for young children 12A No-one younger than 12 may see a ‘12A’ film in a cinema unless accompanied by an adult 15 No-one younger than 15 may see a ‘15’ film in a cinema 18 No-one younger than 18 may see an ‘18’ film in a cinema Source: BBFC website. 4.2.1 Releases and box office by classification Table 4.7 provides a picture of how 2009 releases were classified. It shows that, as in previous years, more ‘15’ films were released than any other category (44% of all releases, up from 37% in 2008) although they accounted for a smaller proportion of the gross box office (22%). The largest share of gross box office was earned by ‘12A’ films (42%). This was slightly less than the proportion earned by ‘12A’ films in 2008 (45%), and there was also a slight decrease in the proportion of ‘12A’ certified films released, down from 28% to 24%. Table 4.7 Releases in UK and Republic of Ireland by BBFC film classification, 2009 Gross % Number of % box office of gross BBFC classification releases of releases (£ million) box office Top performing title U 24 4.8 131.0 11.6 Ice Age III PG 72 14.3 204.2 18.1 Monsters vs. Aliens 12A 122 24.3 469.0 41.6 Avatar 15 223 44.3 248.9 22.1 Slumdog Millionaire 18 49 9.7 73.6 6.5 Brüno No classification 13 2.6 0.1 0.0 Objectified Total 503 100.0 1,126.7 100.0 Source: Rentrak EDI, BBFC, RSU analysis. Figures as at 21 February 2010. Note: ‘No classification’ means no classification issued for theatrical release. Some of these films have a classification for video release. Table 4.8 shows how 2009 releases of UK films were classified, and Table 4.9 shows how releases of UK independent films were classified. The proportions of films released by BBFC classification were broadly similar for all films, UK films and for UK independent films. The one notable difference was a higher proportion of ‘18’ films than ‘PG’ films for UK independent films, whereas the reverse was true for all films and for UK films. However, because of the high earning international and UK non-independent films there were differences in box office takings by classification between UK independent films and the others, all films and UK films (Figure 4.3). For all films and UK films the highest earning classification was ‘12A’ (42% of the total box office for all films and 48% of the total box office for UK films), whereas for UK independent films the highest earning classification was ‘15’ (51% of the total box office). Avatar, Harry Potter and the Half-Blood Prince and Sherlock Holmes were ‘12A’ films. All three contributed to the difference between all films and UK independent films while the last two had a major impact on the difference between UK films and UK independent films (see Tables 4.7, 4.8 and 4.9). 32 – UK Film Council Statistical Yearbook 2010
  • 35.
    1 2 Table 4.8 Releases of UK films in UK and Republic of Ireland by BBFC film classification, 2009 3 Gross % Number of % box office of gross BBFC classification releases of releases (£ million) box office Top performing title 4 U 8 7.1 11.3 6.0 Nativity PG 14 12.4 23.3 12.4 Fantastic Mr. Fox 12A 22 19.5 90.9 48.4 Harry Potter and the Half-Blood Prince 5 15 52 46.0 55.4 29.5 Slumdog Millionaire 18 13 11.5 7.1 3.8 Harry Brown 6 No classification 4 3.5 0.0 0.0 In Search of Beethoven Total 113 100.0 188.0 100.0 Source: Rentrak EDI, BBFC, RSU analysis. 7 Figures as at 21 February 2010. Note: ‘No classification’ means no classification issued for theatrical release. Some of these films have a classification for video release. 8 Table 4.9 Releases of UK independent films in UK and Republic of Ireland by BBFC film classification, 2009 Gross % Number of % box office of gross BBFC classification releases of releases (£ million) box office Top performing title 9 U 8 8.0 11.3 12.2 Nativity PG 8 8.0 14.2 15.3 St Trinian’s 2: The Legend of Fritton’s Gold 10 12A 20 20.0 14.5 15.6 The Imaginarium of Dr Parnassus 15 49 49.0 46.9 50.8 Slumdog Millionaire 18 11 11.0 5.6 6.0 Harry Brown 11 No classification 4 4.0 0.0 0.0 In Search of Beethoven Total 100 100.0 92.4 100.0 12 Source: Rentrak EDI, BBFC, RSU analysis. Figures as at 21 February 2010. Note: ‘No classification’ means no classification issued for theatrical release. Some of these films have a classification for video release. 13 Figure 4.3 Percentage of gross box office by BBFC film classification for all films, UK films and UK independent films, 2009 14 % of gross box office 60 50 15 40 30 16 20 10 17 0 U PG 12A 15 18 All films 11.6 18.1 41.6 22.1 6.5 18 UK films 6.0 12.4 48.4 29.5 3.8 UK independent 12.2 15.3 15.6 50.8 6.0 films 19 Source: Rentrak EDI, BBFC, RSU analysis. Figures as at 21 February 2010. Note: Category ‘12A’ includes those films that were given the ‘12’ classification before 2003. The ‘12’ classification was superseded by ‘12A’ for films showing at the cinema in August 2002. The first film given a ‘12A’ classification was The Bourne Identity. 20 Chapter 4: Genre and classification – 33 21
  • 36.
    There has beensome gradual change in the proportions of films by classification over the last nine years, as shown in Figure 4.4. The proportion of the most common ‘15’ classification fell slightly below its average 40% mark in 2008 but then increased to 44% in 2009. Until 2008 a slow decline in the ‘PG’ classification was compensated by the gentle rise of the ‘12A’ classification, but in 2009 the increase in the proportion of films released with a ‘15’ classification has seen a compensating decrease in the proportion of ‘12A’ films. Figure 4.4 Percentage of releases in UK and Republic of Ireland by film classification, 2001–2009 % of releases 50 40 30 20 10 0 2001 2002 2003 2004 2005 2006 2007 2008 2009 U 7.0 8.0 5.2 6.0 6.2 5.7 5.2 5.9 4.8 PG 19 23 16.1 18 17.1 14.9 15.9 14.6 14.3 12A 18 20 26 26.4 24.8 27.5 25.4 28.5 24.3 15 40 40 40.4 39 37.3 38.8 40.1 36.6 44.3 18 15 9 12.1 8.6 10.7 9.1 9.1 9.7 9.7 Source: Rentrak EDI, BBFC, RSU analysis. See note to Figure 4.3. The shares of box office by film classification vary widely from year to year as demonstrated in Figure 4.5. However, the box office ranking of the classifications has remained fairly constant over time, the top earner being ‘12A’, with ‘U’ and ‘18’ consistently being the lowest earners, and ‘PG’ and ‘15’ exchanging second and third places over the years. In 2007 and 2008 films in the ‘PG’ category earned more at the box office than those in the ‘15’ category, but this was reversed in 2009 with the ‘15’ films increasing their share of the box office to 22% and ‘PG’ films reducing their share to 18%. 34 – UK Film Council Statistical Yearbook 2010
  • 37.
    1 2 Figure 4.5 Percentage of gross box office of releases in UK and Republic of Ireland by film classification, 2001–2009 3 % of gross box office 50 4 40 30 5 20 6 10 0 2001 2002 2003 2004 2005 2006 2007 2008 2009 7 U 10.2 13.4 10.4 16.6 16.7 13.9 11.8 8.4 11.6 PG 28.8 22.4 11.8 23.3 19 15.2 24.2 21.4 18.1 12A 30.3 39.8 42.4 28.2 40.4 43.9 34.7 44.8 41.6 15 23.5 21.1 29.2 26.6 19.9 21.2 23.7 20.0 22.1 8 18 7.3 3.6 6.3 5.2 3.8 5.7 5.5 5.4 6.5 Source: Rentrak EDI, BBFC, RSU analysis. Figures as at 21 February 2010. 9 See note to Figure 4.3. 4.2.2 Top films by classification 10 Table 4.10 gives the top 10 ‘U’ classified films in 2009. Animation is the genre represented most in the table with four out of 10 titles (traditionally aimed at the youngest audiences for whom a ‘U’ classification is preferable). 11 Three of the 10 films came from the UK, one more than last year. Table 4.10 Top 10 ‘U’ classified films, 2009 12 Gross Country box office Title of origin (£ million) Distributor Genre 13 Ice Age III USA 35.0 20th Century Fox Animation Up USA 34.6 Disney Animation Alvin and the Chipmunks 2: 14 The Squeakquel USA 23.2 20th Century Fox Family Hannah Montana: The Movie USA 8.5 Disney Musical 15 Hotel for Dogs USA/Ger 7.2 Paramount Comedy Cloudy with a Chance of Meatballs USA 6.5 Sony Pictures Animation Nativity UK 5.2 E1 Films Comedy 16 Planet 51 UK/Spa 4.9 Entertainment Animation Beverly Hills Chihuahua USA 3.7 Disney Comedy The Secret of Moonacre UK/Hungary/Fra 0.9 Warner Bros Fantasy 17 Source: Rentrak EDI, BBFC, IMDb, RSU analysis. Figures as at 21 February 2010. 18 The top 10 performing ‘PG’ classified films also included four animations (Table 4.11). Four of the films in this list, Monsters vs. Aliens, A Christmas Carol, Bolt and G-Force, were shown in 3D, with the 3D gross for all four films being a significant percentage of the total gross. The top 10 ‘PG’ films also included 2009’s top documentary, Michael 19 Jackson’s This Is It. Only one of the top 10 films came from the UK, compared with three last year. 20 Chapter 4: Genre and classification – 35 21
  • 38.
    Table 4.11 Top10 ‘PG’ classified films, 2009 Gross Country box office Title of origin (£ million) Distributor Genre Monsters vs. Aliens USA 21.4 Paramount Animation A Christmas Carol USA 20.2 Disney Animation Night at the Museum 2 USA/Can 20.0 20th Century Fox Adventure Bolt USA 17.9 Disney Animation Marley Me USA 15.3 20th Century Fox Comedy G-Force USA 13.5 Disney Family Michael Jackson’s This Is It USA 9.8 Sony Pictures Documentary Fantastic Mr. Fox UK/USA 9.0 20th Century Fox Animation Fame USA 8.8 Entertainment Musical Confessions of a Shopaholic USA 8.3 Disney Comedy Source: Rentrak EDI, BBFC, IMDb, RSU analysis. Figures as at 21 February 2010. The top ‘12A’ film in 2009 was the record breaking Avatar followed by Harry Potter and the Half-Blood Prince (Table 4.12). The top ‘12A’ films therefore include the top two highest grossing films released in 2009. Action is the genre represented most in the table with four out of 10 titles, followed by science fiction with three titles. Two of the top 10 films came from the UK, the same number as last year. Table 4.12 Top 10 ‘12A’ classified films, 2009 Gross Country box office Title of origin (£ million) Distributor Genre Avatar USA 83.3 20th Century Fox Sci-fi Harry Potter and the Half-Blood Prince UK/USA 50.7 Warner Bros Fantasy The Twilight Saga: New Moon USA 27.5 E1 Films Romance Transformers: Revenge of the Fallen USA 27.1 Paramount Action Sherlock Holmes UK/USA 25.7 Warner Bros Action Star Trek USA/Ger 21.4 Paramount Sci-fi 2012 USA 19.5 Sony Pictures Action Angels and Demons USA 18.8 Sony Pictures Thriller X-Men Origins: Wolverine USA 16.3 20th Century Fox Action Terminator Salvation USA 14.2 Sony Pictures Sci-fi Source: Rentrak EDI, BBFC, IMDb, RSU analysis. Figures as at 21 February 2010. By definition, ‘15’ classified films contain stronger material than the younger categories. Depending on the type of film they are likely to involve more adult-oriented themes, comedy, crime and language. This is reflected in the top 10, where the horror and crime genres account for half of the films in the list (Table 4.13). The ‘15’ category films were topped by the UK independent drama Slumdog Millionaire, followed by the comedy The Hangover. Only two films in this list are comedies, compared with five last year. Two of the top 10 films came from the UK, compared with just one last year. 36 – UK Film Council Statistical Yearbook 2010
  • 39.
    1 2 Table 4.13 Top 10 ‘15’ classified films, 2009 3 Gross Country box office Title of origin (£ million) Distributor Genre 4 Slumdog Millionaire UK 31.7 Pathé Drama The Hangover USA 22.1 Warner Bros Comedy The Final Destination USA 12.8 Entertainment Horror 5 Paranormal Activity USA 10.0 Icon Horror District 9 USA/NZ 9.0 Sony Pictures Sci-fi 6 Role Models USA/Ger 8.4 Universal Comedy Gran Torino USA/Aus 8.3 Warner Bros Crime Public Enemies USA 7.0 Universal Crime 7 Drag Me to Hell USA 6.9 Lions Gate Horror Knowing USA/UK 6.8 E1 Films Action 8 Source: Rentrak EDI, BBFC, IMDb, RSU analysis. Figures as at 21 February 2010. Because of the challenging nature of ‘18’ classified films, which contain the strongest content, their audience appeal 9 is generally much narrower than other categories. The most popular genres of the top 10 titles in this category in 2009 were horror, action and crime (Table 4.14). Two films, Brüno and Inglourious Basterds, broke the £10 million barrier. In 2008, Sweeney Todd (£11 million) was the only ‘18’ film to gross more than £10 million, and before that 10 The Departed (£12.8 million) in 2006 was the last ‘18’ to do so. There were two UK titles (compared with three in 2008) among the top 10 of this classification in 2009. 11 Table 4.14 Top 10 ‘18’ classified films, 2009 Gross Country box office Title of origin (£ million) Distributor Genre 12 Brüno USA 15.8 Universal Comedy Inglourious Basterds USA/Ger 10.9 Universal War 13 Watchmen USA 8.9 Paramount Action My Bloody Valentine USA 7.0 Lions Gate Horror Law Abiding Citizen USA 6.4 Paramount Crime 14 Saw VI Can/USA/UK/Aus 5.4 Lions Gate Horror Harry Brown UK 4.6 Lions Gate Crime 15 Underworld 3 USA 2.6 Entertainment Action Friday the 13th USA 2.3 Paramount Horror Crank 2: High Voltage USA 1.6 Lions Gate Action 16 Source: Rentrak EDI, BBFC, IMDb, RSU analysis. Figures as at 21 February 2010. 17 „ 18 3F or cinema admissions and box office in 2009 see Chapter 1 (page 8) 3F or top foreign language films of the last decade see Chapter 5 (page 38) 3F or a look at cinema audiences see Chapter 14 (page 110) 19 3F or information about film classification in the UK see www.bbfc.org.uk 3F or more details of genre classification see www.ukfilmcouncil.org.uk/genre 20 Chapter 4: Genre and classification – 37 21
  • 40.
    Chapter 5: Specialised films Specialisedfilms offer Facts in focus audiences an experience of • 47 specialised films were released in the UK in 2009 3 (69% of the total) earning £173 million (15% of the cinema that is very different total gross box office). from mainstream commercial • ilms in 28 different languages (including English) F were released in the UK in 2009. fare. Such films may offer an • 61 foreign language films made up 32% of total 1 innovative cinematic style, releases, but shared just 2% of the UK box office. engage with challenging • indi was the most frequent foreign language in terms H subject matter, be in foreign of the number of releases, with 3 Idiots and Love Aaj Kal being the two most popular Hindi films. languages or portray • 6 documentary films were released, accounting for 5 experiences from different 11% of releases but only 1% of the gross box office. cultures. Evidence shows that • 6 classic and archive films were re-released (5% of 2 the total), accounting for 0.2% of the box office. specialised films are a growing aspect of our film culture.
  • 41.
    1 2 5.1 Specialised films at the UK box office in 2009 3 The UK Film Council’s definition of ‘specialised’ is broad and relates to those films that do not sit easily within a mainstream and highly commercial genre. Many are from the independent production sector (although they may be handled by a mainstream, studio-based distributor) or are made with a low production budget (compared to 4 a studio production) and may focus more on script and character than on effects and star names. They may be expected to appeal to a narrower audience segment than mainstream films. 5 Specifically, the UK Film Council considers most subtitled foreign language films, documentaries and archive/classic films to be specialised. For films that do not fall into these categories, other criteria are applied and consideration is given to films that are less easy to define as a particular genre or that deal with challenging and complex subject 6 matter. For more information on the UK Film Council’s definition of specialised film, and to access the specialised film database, see www.ukfilmcouncil.org.uk/specialisedfilms. In total, 347 specialised films were released in 2009, representing 69% of the total number of UK theatrical releases 7 last year. These films grossed £173 million, just over 15% of total box office earnings (Table 5.1). Table 5.1 Specialised* films in the UK and Republic of Ireland, 2009 8 Gross Share of Average Number of Share of box office gross box widest point Type releases releases (%) (£ million) office (%) of release 9 Foreign language 161 32 25.6 2.3 18 Documentaries 56 11 12.0 1.1 21 Re-releases 26 5 2.7 0.2 25 10 Other specialised films 117 23 133.1 11.8 83 All specialised films** 347 69 173.1 15.4 41 11 Source: Nielsen EDI data, RSU analysis. *‘Specialised’ as identified by the UK Film Council and listed in the specialised films database as at 11 March 2010. For more information visit www.ukfilmcouncil.org.uk/specialisedfilmsdb. **Note that because of some overlap of categories (eg a film can be categorised as foreign language and as a documentary) the total refers to the number of specialised 12 films, not the sum total of the categories in the table. A 10-year analysis of specialised film releases and market Figure 5.1 Specialised films 2000–2009 share is shown in Figure 5.1. Applying the UK Film Percentage of releases and market share 13 Council definition of specialised film retrospectively 70.0 to films released prior to 2003 (when the Prints and Advertising Fund was established) we can see that 60.0 14 almost six in every 10 films released at the UK box office 50.0 from 2000–2002 were specialised. The figure has grown steadily from a low point of 51% in 2003 to 69% last 15 40.0 year. Market share increased from 8% in 2008 to over 15% in 2009, due largely to the strong performance of 30.0 films such as Slumdog Millionaire, Inglourious Basterds, 16 Michael Jackson’s This Is It and The Curious Case of 20.0 Benjamin Button. 10.0 17 0 00 01 02 03 04 05 06 07 08 09 18 Specialised 57.7 58.2 58.0 50.5 55.4 55.7 58.8 64.4 66.6 69.0 films as % of total releases Market share 7.6 5.9 6.4 5.1 9.8 6.5 8.5 8.0 8.2 15.4 19 of specialised films (%) Source: UK Film Council analysis of Rentrak EDI data. 20 Image: Broken Embraces courtesy of Pathé UK Chapter 5: Specialised films – 39 21
  • 42.
    By sorting specialisedfilms into four separate types – similar impact on revenues in 2004). Foreign language documentaries, foreign language films, re-releases and film grosses have doubled in 10 years, with fluctuations films with a distinctive genre, hook or style – we can depending on individual high grossing titles (such as better understand the patterns of specialised film Crouching Tiger, Hidden Dragon and Amélie in 2001 distribution over time. As Figure 5.2 shows, there has and The Passion of the Christ in 2004). The combined been a steady increase in the number of theatrically revenues for re-releases are comparatively small and released feature documentaries over the last decade – have only risen above £2 million on three occasions in from 10 in 2000 to 56 last year. The number of the last decade, again depending on one or two high re-released films tracked by Rentrak EDI has remained profile re-issues. However, it is better to judge re-issues largely the same, although this figure does not include in terms of screen averages rather than overall grosses. all re-releases, particularly limited or one-off screenings Finally, the more subjective category of titles with in independent cinemas. The number of foreign distinctive and non-mainstream genre or styles saw language films increased from a low point of 96 releases a huge increase in revenue last year due to the in 2001 to a peak of 193 in 2005 and has since performance of films such as Slumdog Millionaire, fluctuated. Finally, the more subjective category of films Inglourious Basterds, The Curious Case of Benjamin with innovative or unconventional approaches, genre or Button and Fantastic Mr. Fox which lifted specialised style saw numbers decline from 86 in 2000 to a low of film revenues in 2009 to over £173 million. 20 in 2005 before rising again to a peak of 117 in 2009. Figure 5.3 Box office gross (£ million) of specialised Figure 5.2 Number of specialised releases, 2000–2009 films, 2000–2009 No. of releases £ million 500 200.00 450 180.00 400 160.00 350 140.00 300 120.00 250 100.00 200 80.00 150 60.00 100 40.00 50 20.00 0 00 01 02 03 04 05 06 07 08 09 0.00 00 01 02 03 04 05 06 07 08 09 Foreign 106 96 123 142 159 193 165 161 179 148 Foreign 11.95 29.75 17.20 20.30 38.30 27.11 29.70 32.15 26.92 25.32 language language Documentary 10 4 8 18 23 27 34 36 49 56 Documentary 0.57 0.17 2.24 5.28 9.27 4.77 4.57 1.57 4.12 12.02 Re-release 19 25 25 17 21 20 25 29 26 26 Re-release 2.95 2.29 1.40 1.34 0.55 0.30 1.24 1.74 0.97 2.68 Genre/hook/ 86 80 58 36 47 20 73 109 97 117 Genre/ 33.32 12.15 32.65 14.52 33.23 23.31 37.35 39.70 45.05 133.10 style hook/style Source: UK Film Council analysis of Rentrak EDI data. Source: UK Film Council analysis of Rentrak EDI data. The box office performance of specialised films, again split into the four sub-categories of documentary, foreign language, re-releases and films with a distinctive hook, genre or style, is shown in Figure 5.3. Theatrical revenues for documentaries are at a 10-year high, although this is due to the success of one major release – Michael Jackson’s This Is It (Fahrenheit 9/11 had a 40 – UK Film Council Statistical Yearbook 2010
  • 43.
    1 2 5.2 Foreign language films The 27 foreign languages were spread over 161 releases 3 in the UK and Republic of Ireland (32% of all releases, Films in 28 different languages (including English) were down four percentage points since 2008), earning released in the UK and the Republic of Ireland in 2009, £25.6 million at the box office (Table 5.3). compared with 30 in 2008 (Table 5.2). Hindi was again 4 the top non-English language at the box office, with a This represented 2% of the total UK gross box office 1% share of revenues, followed by French (0.5%) and for 2009, down from 3% in 2008 and the lowest Spanish (0.3%). since 2002. 5 Table 5.2 Languages of films released, 2009 Table 5.3 Foreign language films at the UK and Republic of Ireland box office, 2002–2009 6 Main Number Gross box office Box office share language of releases (£ million) (%) % of Box office % of total gross Number all releases (£ million) box office English 327 1,042.8 92.5 2002 131 35.5 17.1 2.2 7 English with others* 15 58.3 5.2 Hindi 44 10.9 1.0 2003 147 34.7 20.4 2.5 French 31 5.9 0.5 2004 169 37.5 38.1 4.6 8 Spanish 12 3.6 0.3 2005 203 43.5 26.9 3.2 Swedish 2 1.2 0.1 2006 171 33.9 29.8 3.5 Tamil 10 0.7 0.1 2007 170 32.9 32.3 3.5 9 Italian 3 0.7 0.1 2008 188 35.7 27.1 2.9 German 7 0.6 0.1 2009 161 32.0 25.6 2.3 10 Source: Rentrak EDI, BBFC, IMDb, RSU analysis. Punjabi 6 0.5 0.1 Figures as at 21 February 2010. Mandarin 1 0.4 0.1 Korean 3 0.2 0.1 Films in European languages other than English earned 11 1.1% of the gross box office from 13.5% of releases and Polish 2 0.2 0.1 South Asian subcontinent languages also shared 1.1% Romanian 3 0.2 0.1 of the box office from 12% of releases (Table 5.4). Taken 12 Turkish 9 0.2 0.1 together, foreign language films played on average at Japanese 11 0.1 0.1 only 18 sites at their widest point of release (up from 15 in 2008) compared with an average of 171 for English 13 Bengali 1 0.1 0.1 language releases. Burmese 1 0.1 0.1 Cantonese 1 0.1 0.1 14 Danish 2 0.1 0.1 Farsi 1 0.1 0.1 Hebrew 1 0.1 0.1 15 Hungarian 1 0.1 0.1 Kazakh 1 0.1 0.1 16 Malayalam 1 0.1 0.1 Norwegian 1 0.1 0.1 Portuguese 3 0.1 0.1 17 Slovak 1 0.1 0.1 Thai 2 0.1 0.1 18 Total 503 1,126.7 100.0 Source: Rentrak EDI, BBFC, IMDb, RSU analysis. *‘English with others’ includes films whose main language was English but with 19 extensive use of other languages, such as Slumdog Millionaire in English and Hindi. 20 Chapter 5: Specialised films – 41 21
  • 44.
    Table 5.4 Languageof releases in the UK and Republic of Ireland, 2009 (ranked by number of releases) Average sites at Number % of Gross box office % of gross widest point Main language of releases releases (£ million) box office of release English and English with others* 342 68.0 1,101.1 97.7 171 European other than English 68 13.5 12.4 1.1 16 South Asian subcontinent 62 12.3 12.1 1.1 24 Other Asian 20 4.0 0.8 0.1 15 Other international 11 2.2 0.3 0.1 3 Total 503 100.0 1,126.7 100.0 122 Source: Rentrak EDI, BBFC, IMDb, RSU analysis. *See note to Table 5.2. Figures as at 21 February 2010. Figures may not sum to totals due to rounding. While the top foreign language film in 2009 was in French (Coco Before Chanel), the top 20 as a whole was dominated by Hindi films, which accounted for 11 titles (Table 5.5). Six films earned over £1 million, including Indian films 3 Idiots and Love Aaj Kal, Pedro Almodóvar’s Broken Embraces, Tomas Alfredson’s Let the Right One In, and the first part of Steven Soderbergh’s two biopics of Che Guevara. Table 5.5 Top 20 foreign language films released in the UK and Republic of Ireland, 2009 Gross box office Title Country of origin (£ million) Distributor Main language 1 Coco Before Chanel Fra 2.6 Optimum French 2 3 Idiots India 1.8 Adlabs Hindi 3 Broken Embraces Spa 1.4 Warner Bros Spanish 4 Che: Part One Fra/Spa 1.4 Optimum Spanish 5 Let the Right One In Swe 1.1 Momentum Swedish 6 Love Aaj Kal UK/Ind 1.0 Eros Hindi 7 The Class Fra 0.9 Artificial Eye French 8 Kambakkht Ishq India 0.7 Eros Hindi 9 Mesrine: Killer Instinct Fra/Can/Ita 0.7 Momentum French 10 The White Ribbon Aut/Ger/Fra 0.6 Artificial Eye German 11 De Dhana Dhan India 0.6 Eros Hindi 12 Dil Bole Haddipa India 0.5 Yash Raj Hindi 13 Billu Barber India 0.5 Eros Hindi 14 Chandni Chowk to China India/USA 0.5 Warner Bros Hindi 15 Blue India 0.4 B4U Network Hindi 16 Ajab Prem Ki Ghazab Kahani India 0.4 B4U Network Hindi 17 New York India 0.4 Yash Raj Hindi 18 Red Cliff China 0.4 Entertainment Mandarin 19 Kurbaan India 0.4 UTV Comms Hindi 20 Il Divo Ita/Fra 0.4 Artificial Eye Italian Source: Rentrak EDI, BBFC, IMDb, RSU analysis. Figures as at 21 February 2010. 42 – UK Film Council Statistical Yearbook 2010
  • 45.
    1 2 This year, four of the top 20 foreign language films were supported by the UK Film Council. The four titles (Che: Part 3 One, Il Divo, Let the Right One In and Broken Embraces) received funding to pay for additional prints and advertising, affording greater opportunity for UK audiences to see the films. Table 5.6 shows the 10 biggest foreign language films of the last decade. The top film is The Passion of the Christ 4 (£11.1 million), followed by Crouching Tiger, Hidden Dragon (£9.4 million). There are three Mandarin and three Spanish films in the top 10, but only one French language title. 5 Table 5.6 Top 10 foreign language films, 2000–2009 UK box office Title Language total (£ million) UK distributor Year of release 6 1 The Passion of the Christ Aramaic/Latin/Hebrew 11.08 Icon 2004 2 Crouching Tiger, Hidden Dragon Mandarin 9.37 Sony Pictures 2001 7 3 Amélie French 5.01 Momentum 2001 4 Apocalypto Mayan 4.11 Icon 2007 5 Hero Mandarin 3.82 Disney 2004 8 6 House of Flying Daggers Mandarin 3.78 Pathé 2004 7 Volver Spanish 2.88 Pathé 2006 9 8 The Motorcycle Diaries Spanish 2.75 Pathé 2004 9 Pan’s Labyrinth Spanish 2.72 Optimum 2006 10 The Lives of Others German 2.70 Lions Gate 2007 10 Source: Rentrak EDI, RSU analysis. 11 5.3 Documentaries In all, 56 feature documentaries were released at the UK box office in 2009, representing 11% of theatrical releases. 12 They earned £12 million in total, around 1% of the overall box office gross. The most successful documentary of the year was Michael Jackson’s This Is It, which earned £9.8 million. This was followed by The September Issue and Jonas Brothers: The 3D Concert. 13 Michael Jackson’s This Is It is now the highest grossing documentary of all time at the UK box office (Table 5.7), the previous highest earning documentary, Michael Moore’s Fahrenheit 9/11 grossed £6.5 million in 2004. French natural history documentary March of the Penguins is in third place with £3.1 million and British-made Touching the 14 Void is at number four with £2.6 million. There are two 3D music documentaries in the top 20, and we may well see more documentaries in the 3D format in future. 15 16 17 18 19 20 Chapter 5: Specialised films – 43 21
  • 46.
    Table 5.7 Top20 documentaries at the UK box office, 2000–2009 Country Year of Box office Widest point of Title of origin release gross (£) release (sites) Distributor 1 Michael Jackson’s This Is It USA 2009 9,795,960 498 Sony Pictures 2 Fahrenheit 9/11 USA 2004 6,545,552 200 Optimum 3 March of the Penguins France 2005 3,084,616 163 Warner Bros 4 Touching the Void UK 2003 2,643,252 50 Pathé 5 Bowling for Columbine USA 2002 1,667,625 37 Momentum 6 Super Size Me USA 2004 1,111,093 83 Tartan 7 An Inconvenient Truth USA 2006 935,770 68 Paramount 8 Man on Wire UK/USA 2008 879,377 43 Icon 9 Hannah Montana/Miley Cyrus: Best of Both Worlds USA 2008 799,109 65 Disney 10 U2 3D USA 2008 725,893 67 Revolver 11 Etre et Avoir France 2003 708,116 15 Tartan 12 Shine a Light USA/UK 2008 697,320 159 20th Century Fox 13 Spellbound USA 2003 484,540 17 Metrodome 14 The September Issue USA 2009 427,767 18 Momentum 15 Capturing the Friedmans USA 2004 388,238 26 Tartan 16 Sicko USA 2007 378,669 166 Optimum 17 The Corporation Canada 2004 296,234 20 Metrodome 18 Jonas Brothers: The 3D Concert USA 2009 249,534 169 Disney 19 Of Time and the City UK 2008 245,189 25 BFI 20 Lost in La Mancha UK/USA 2002 233,383 13 Optimum Source: UK Film Council RSU analysis of Rentrak EDI data. Note: The table does not include IMAX-only documentaries and shorts. Based on box office data for 2000–2009. Michael Jackson’s This Is It is regarded as the highest grossing documentary of all time because, even with price inflation, it is unlikely that any documentary films before 1989 will have earned more in nominal terms. An interesting observation is the number of documentaries originating from the USA – a reminder that the USA is not wholly about mainstream Hollywood production but has a large independent and specialised film sector as well. 5.4 Re-releases of classic and archive films According to Rentrak EDI, 26 re-released classic and archive films accounted for 5% of theatrical releases in 2009 and generated £2.7 million (0.2% of the total gross box office). However, not all box office revenues for re-releases are tracked by Rentrak EDI, which primarily focuses on first-run films. Some additional revenue for films, which tend to be booked for a limited time into specialised cinemas long after their initial release, is missing from this analysis, so the actual box office share is likely to be greater. The figures available suggest there is a growing appetite for the theatrical re-release of classic material, fuelled in part by the ageing of the cinema population – the over-45s now account for one-fifth of cinema visits. The availability of enhanced digital versions and the flexibility of digital cinema also give younger audiences the chance to experience the classics for the first time, or to see in the cinema films they have previously only viewed on television. Table 5.8 highlights the top 20 re-releases at UK cinemas over the last decade. Seasonal re-releases take four of the top 20 places, with sizeable audiences for Tim Burton’s The Nightmare Before Christmas 3-D in both 2006 (£647,000) and 2007 (£329,000). It’s a Wonderful Life made an impressive £166,000 from a limited release in the run-up to Christmas 2007, while the British Film Institute’s (BFI) re-release of The Wizard of Oz earned £118,000 the previous year. 44 – UK Film Council Statistical Yearbook 2010
  • 47.
    1 2 The highest earning re-release in the UK over the last decade was Stanley Kubrick’s A Clockwork Orange, which 3 grossed £2.1 million from a wide release in 2000. The chart features an interesting mix of genres – Ridley Scott’s Alien: The Director’s Cut grossed over £500,000 in 2003, while Luchino Visconti’s The Leopard earned £347,000 from its limited release in the same year. Bernardo Bertolucci’s The Conformist was re-released by the BFI in 2008 4 and grossed £111,000 (with an opening weekend average of £4,500). With the successful 3D re-release of Toy Story in 2009 (£2 million from 251 cinemas) we can anticipate further 3D re-releases in the years ahead. Four of the top 20 were re-released by the BFI, illustrating its importance in maintaining and strengthening the 5 UK’s film culture. Table 5.8 Top 20 re-releases at the UK box office, 2000–2009 6 Country Year of Box office Widest point of Title (year of original release) of origin re-release gross (£) release (sites) Distributor 1 A Clockwork Orange (1972) UK 2000 2,067,302 328 Warner Bros 7 2 E.T. (20th anniversary) (1982) USA 2002 2,063,690 313 UIP 3 Toy Story (3D re-release) (1996) USA 2009 2,017,464 251 Disney 8 4 The Nightmare Before Christmas 3-D (1993) USA 2006 646,798 5 Disney 5 Alien: The Director’s Cut (1979) UK/USA 2003 545,782 134 20th Century Fox 9 6 Apocalypse Now Redux (1979) USA 2001 455,335 22 Disney 7 The Leopard (1963) Italy/France 2003 346,807 5 BFI 10 8 It’s a Wonderful Life (1946) USA 2007 329,891 33 Park Circus 9 The Nightmare Before Christmas 3-D (1993) USA 2007 328,759 44 Disney 11 10 2001: A Space Odyssey (1968) UK/USA 2001 326,496 4 Warner Bros 11 Breakfast at Tiffany’s (1961) USA 2001 313,443 5 BFI 12 A bout de souffle (1960) Fra 2000 173,301 5 Optimum 12 13 This is Spinal Tap (1984) USA 2000 166,203 22 Optimum 14 Amadeus (Director’s Cut) (1984) USA 2002 145,234 8 Warner Bros 13 15 The Wizard of Oz (1939) USA 2006 118,033 33 BFI 16 White Christmas (1954) USA 2008 117,808 27 Park Circus 17 The Conformist (1970) Italy/France/ 14 Germany 2008 111,202 6 BFI 18 The Seventh Seal (1957) Sweden 2007 105,594 6 Tartan 15 19 Grease (30th Anniversary) (1978) USA 2008 105,241 143 Park Circus 20 Tokyo Story (1953) Japan 2004 95,935 4 Tartan Source: UK Film Council RSU analysis of Rentrak EDI data. 16 17 18 „ 19 3 For more on the box office see Chapter 1 (page 8) 3F or more on genre and classification see Chapter 4 (page 25) 20 Chapter 5: Specialised films – 45 21
  • 48.
    Chapter 6: UK filmsinternationally Global box office revenues Facts in focus reached almost $30 billion • orldwide, the gross box office for films of all countries W of origin increased by 8% on 2008 to $30 billion. in 2009, with UK films sharing • he UK share of the global theatrical market was 7% T 7% of this market. Harry Potter ($2 billion). and the Half-Blood Prince and • he top 10 performing UK films worldwide grossed T $1.8 billion in 2009. Slumdog Millionaire were the • arry Potter and the Half-Blood Prince was the best H stand-out performers, the performing UK-qualifying film at the worldwide box latter boosting the share office, earning over $900 million in 2009. • K films represented 7% of releases at the North U of independent UK films to American box office (9% in 2008), and 7% of the its highest level since our market (16% in 2008), at a value of $705 million. records began. • n Europe, the top British film was Harry Potter and I the Half-Blood Prince with 26 million admissions, followed by Slumdog Millionaire with 11 million.
  • 49.
    1 2 6.1 UK films worldwide 3 Global box office receipts reached $29.9 billion in 2009, up 8% on 2008 (Table 6.1). UK films had a 7% share of this market, earning $2 billion. UK inward investment films (UK films wholly or partly financed and controlled by US studios but featuring UK cast, crew, locations, facilities, post-production and often UK source material) earned 4 4.4% of the worldwide box office while UK independent films shared 2.3% of global revenues, thanks largely to the success of Slumdog Millionaire. 5 As Table 6.1 shows, the UK market share fluctuates significantly from year to year. The lower UK market share in 2009 can be explained by the reduced number of UK inward investment films in the marketplace compared to 2008, when The Dark Knight, Quantum of Solace and Mamma Mia! dominated the worldwide box office. However, with 6 a larger number of inward investment titles being made in 2009, an increase in UK share in 2010 is anticipated. Table 6.1 UK films global market share, 2002–2009 7 UK film Global worldwide theatrical US studio-backed Independent gross market UK share UK films share UK films share Year (US$ billion) (US$ billion) (%) (%) (%) 8 2002 1.8 19.8 9.1 7.6 1.5 2003 1.4 20.1 6.9 5.5 1.5 9 2004 2.9 24.9 11.6 10.0 1.6 2005 3.6 23.1 15.5 13.4 2.2 2006 2.2 25.5 8.6 7.5 1.2 10 2007 3.3 26.3 12.5 10.6 1.9 2008 4.2 27.8 15.1 13.3 1.8 11 2009 2.0 29.9 6.7 4.4 2.3 Source: MPAA, Screen Digest, Rentrak EDI, UK Film Council. The highest grossing UK film of 2009 was the sixth instalment of the Harry Potter series, Harry Potter and the Half- 12 Blood Prince, which earned $934 million worldwide (Table 6.2). Oscar®-winning Slumdog Millionaire grossed $327 million in 2009 and its lifetime earnings now stand at approximately $377 million. Guy Ritchie’s Sherlock Holmes, a late December release, grossed $191 million in 2009 but has now earned almost $500 million worldwide. 13 Table 6.2 Top 10 UK films worldwide, 2009 14 Country Worldwide gross Title of origin (US$ million) 1 Harry Potter and the Half-Blood Prince UK/USA 934 15 2 Slumdog Millionaire UK 327 3 Sherlock Holmes* UK/USA 191 4 Planet 51* UK/Spa 94 16 5 The Tale of Despereaux UK/USA 67 6 Fantastic Mr. Fox* UK/USA 43 17 7 The Boat That Rocked UK/USA 36 8 Inkheart UK/USA 35 9 Earth UK/Ger 35 18 10 Mamma Mia! UK/USA 30 Total top 10 1,792 19 Source: UK Film Council, Rentrak EDI, IFTA, Screen International, Variety. Note: Additional box office data have been received since the ‘UK films international market share 2009’ statistics were released on 25 March 2010. *Still on international theatrical release as at 31 March 2010. Data are based on gross box office revenue in the calendar year 2009. 20 Image: Sherlock Holmes © 2009 Warner Bros. Entertainment Inc Chapter 6: UK films internationally – 47 21
  • 50.
    6.2 UK filmsin North America Table 6.3 shows the country of origin of films released in the USA and Canada in 2009. The UK share of the gross box office fell from 16% in 2008 to 7% in 2009, with UK films representing 7% of releases in the North American market (down from 9% in 2008). The total revenue from these films stood at $705 million, down from $1.6 billion in 2008. Table 6.3 Country of origin of films in the USA and Canada, 2009 Box office Box office share Country of origin Number of releases % of releases (US$ million) (%) UK and UK co-productions (non-USA) 26 4.5 113 1.1 UK/USA 15 2.6 592 5.5 Sub-total 41 7.2 705 6.6 USA 373 65.1 9,810 91.2 Rest of world 159 27.7 238 2.2 Total 573 100.0 10,752 100.0 Source: Rentrak EDI, RSU analysis. Figures may not sum to totals due to rounding. Table 6.4 UK market share in North America, 2002–2009 UK market share Year % 2002 7.2 2003 5.7 2004 11.0 2005 15.8 2006 9.2 2007 11.8 2008 16.3 2009 6.6 Source: Rentrak EDI, RSU analysis. Harry Potter and the Half-Blood Prince was the top performing UK-qualifying film in 2009 in North America, followed by Sherlock Holmes with $207 million (Table 6.5). Animated family film Planet 51 earned $42 million, while the theatrical version of the BBC’s Planet Earth series grossed $32 million. 48 – UK Film Council Statistical Yearbook 2010
  • 51.
    1 2 Table 6.5 Top 20 UK films at the USA and Canada box office (including co-productions), 2009 3 Country Box office gross Title of origin (US$ million) Distributor 1 Harry Potter and the Half-Blood Prince UK/USA 302.0 Warner Bros 4 2 Sherlock Holmes UK/USA 207.0 Warner Bros 3 Planet 51 UK/Spa 42.1 Sony Pictures 5 4 Earth UK/Ger 32.0 Walt Disney 5 Fantastic Mr. Fox UK/USA 20.9 20th Century Fox 6 Nine UK/USA 19.7 The Weinstein Company 6 7 Inkheart UK/USA 17.3 Warner Bros 8 An Education UK 12.0 Sony Classics 9 The Young Victoria UK/USA 10.4 Apparition 7 10 Pirate Radio aka The Boat That Rocked UK/USA 8.0 Focus Features 11 The Imaginarium of Dr Parnassus UK/Can 7.5 Sony Classics 8 12 Moon UK 5.0 Sony Classics 13 Bright Star UK/Aus 4.4 Apparition 14 Chéri UK/Fra/Ger 2.7 Miramax 9 15 Easy Virtue UK/USA 2.7 Sony Classics 16 Love Aaj Kal UK/Ind 2.4 Eros 10 17 In the Loop UK 2.4 IFC Films 18 Is Anybody There? UK/USA 2.0 Story Island 19 Me and Orson Welles UK/USA 1.2 Freestyle Releasing 11 20 The Boys are Back UK/Aus 0.8 Miramax Source: Rentrak EDI, RSU analysis. Note: Table lists the gross box office for films released in the USA and Canada in 2009 and includes 2010 earnings up to 7 March 2010. 12 6.3 UK films in Europe 13 The UK’s market share in the major European territories is highlighted in Table 6.6. Over 10% of Italian theatrical revenues were earned by UK films, with shares around the 7% mark in France, Germany and Spain. 14 Table 6.6 UK market share in selected European territories, 2009 Box office UK share 15 for UK films 2009 Country (€ million) (%) France 13.5m (admissions) 6.7 16 Germany 66.0 6.6 Italy 65.3 10.4 Spain 51.1 7.2 17 Source: Rentrak EDI, RSU analysis. The top British film in European countries (other than the UK and Republic of Ireland) in 2009 was Harry Potter 18 and the Half-Blood Prince with 26 million admissions, followed by Slumdog Millionaire with 11 million (Table 6.7). Planet 51 performed well in Spain, with 1.9 million admissions, while Ken Loach’s Looking for Eric was the fifth most popular UK film in France, selling 500,000 tickets. 19 20 Chapter 6: UK films internationally – 49 21
  • 52.
    Table 6.7 Top20 UK films in other European countries, 2009 Country Title of origin European admissions 1 Harry Potter and the Half-Blood Prince UK/USA 25,654,203 2 Slumdog Millionaire UK 10,951,926 3 Planet 51 UK/Spa 3,349,364 4 The Imaginarium of Dr Parnassus UK/Can 1,758,331 5 The Tale of Despereaux UK/USA 1,541,656 6 The Boat That Rocked UK/USA 1,413,721 7 Sherlock Holmes UK/USA 1,368,044 8 Inkheart UK/USA 1,292,152 9 Easy Virtue UK/USA 913,431 10 Dorian Gray UK 886,434 11 Last Chance Harvey UK/USA 861,749 12 Looking for Eric UK/Fra/Bel/Ita 801,379 13 The Duchess UK/Fra 586,969 14 Chéri UK/Fra/Ger 504,460 15 The Boy in the Striped Pyjamas UK/USA 466,441 16 The Young Victoria UK/USA 248,877 17 In the Loop UK 117,030 18 City of Ember UK/USA 91,390 19 Bright Star UK/Aus 68,898 20 Brideshead Revisited UK 44,177 Source: European Audiovisual Observatory Lumière Database. Data based on admissions from 24 European countries (excluding the UK and Republic of Ireland) in the 2009 calendar year. 6.4 UK films in Latin America UK films earned between 6% and 8.5% of the box office in the Latin American territories for which data are available. The top performing films were Harry Potter and the Half-Blood Prince, Slumdog Millionaire and Planet 51. Table 6.8 UK market share in selected Latin American countries, 2009 Box office UK share for UK films 2009 Country (US$ million) (%) Argentina 8.4 6.9 Brazil 35.0 6.1 Chile 6.7 8.5 Mexico 42.6 6.7 Source: Rentrak EDI, RSU analysis. 50 – UK Film Council Statistical Yearbook 2010
  • 53.
    1 2 6.5 UK films in Japan and South Korea 3 The share of UK films in Japan was boosted by the 2009 release of both Mamma Mia! and Quantum of Solace, but Harry Potter and the Half-Blood Prince was the highest grossing UK film. 4 Table 6.9 UK market share in Japan and South Korea, 2009 5 Box office UK share for UK films 2009 Country (US$ million) (%) Japan 152.8 6.9 6 South Korea 52.5 5.3 Source: Rentrak EDI, RSU analysis. 7 6.6 UK films in Australasia 8 In 2009, UK films accounted for 10% of the theatrical market in Australia and 14% in New Zealand. Once again, Harry Potter and the Half-Blood Prince, Sherlock Holmes and Slumdog Millionaire were the highest earning UK films. 9 Table 6.10 UK market share in Australia and New Zealand, 2009 Box office UK share 10 for UK films 2009 Country (US$ million) (%) Australia 99.8 9.7 11 New Zealand 17.3 13.6 Source: Rentrak EDI, RSU analysis. 12 Note: Definition of ‘UK film’ For the purposes of this chapter, a UK film is one which is certified as such by the UK Secretary of State for Culture, Media and Sport under Schedule 1 of the Films Act 1985, via the Cultural Test, under one of the UK’s bilateral 13 co-production agreements or the European Convention on Cinematographic Co-production; a film which has not applied for certification but which is obviously British on the basis of its content, producers, finance and talent; or (in the case of a re-release) a film which met the official definition of a British film prevailing at the time it was 14 made or was generally considered to be British at that time. Most UK films in the analysis (including the major UK/ USA films) fall into the first group – films officially certified as British. 15 16 17 18 „ 19 3F or more information on the UK and global market for filmed entertainment see Chapter 13 (page 104) 3F or more information about the UK film economy see Chapter 20 (page 171) 20 Chapter 6: UK films internationally – 51 21
  • 54.
    Chapter 7: UK talentand awards For a small country, the UK Facts in focus film industry has an astonishing • f the top 200 global box office successes of 2001– O 2009, 30 films are based on stories and characters creative record. For the past created by UK writers. Together they have earned more than $16 billion at the worldwide box office. nine years, British actors, • ight of the top 20 global box office successes of the E directors, writers and other last nine years are based on novels by British writers. film talent have been prominent • ore than half of the top 200 films released worldwide M in the global box office charts since 2001 have featured UK actors in lead or prominent supporting roles. and award ceremonies. Story • ritish directors have directed 19 of the 200 biggest B material from UK writers has films of the last nine years with David Yates topping the league. continued to find enthusiastic • K films and talent won 36 major film awards in 2009, U audiences and UK talent has with Slumdog Millionaire being the most recognised taken our culture and identity film. The 241 awards received from 2001–2009 represented 14% of the total of all major awards. to the world.
  • 55.
    1 2 7.1 UK story material 3 The global box office performance of UK films and foreign films which draw on UK source material is a good indicator of the international impact and exposure of British culture. Of the top 200 grossing films released worldwide between 2001 and 2009, 28 are British qualifying films, but UK-originated story material provided the 4 inspiration for 30 – a feat only bettered by US story material. Collectively these 30 films have earned more than $16 billion at the global box office. 5 Novels by British writers have provided the source material for eight of the top 20 grossing films worldwide since 2001 (see www.ukfilmcouncil.org.uk/research for a list of the top 200 films). The top 20 grossing films adapted from stories or characters created by UK writers are listed in Table 7.1. Nineteen are adapted from novels, graphic novels 6 and short stories written by UK authors and one is based on a successful stage production. Table 7.1 Top 20 grossing films worldwide based on stories and characters created by UK writers, 2001–2009 7 Gross Country box office UK story material Rank Title of origin (US$ million) US distributor (writer) 8 1 The Lord of the Rings: The Return of the King USA/NZ 1,119 New Line Novel by JRR Tolkien 2 Harry Potter and the Philosopher’s Stone UK/USA 970 Warner Bros Novel by JK Rowling 9 3 Harry Potter and the Order of the Phoenix UK/USA 937 Warner Bros Novel by JK Rowling 4 Harry Potter and the Half-Blood Prince UK/USA 934 Warner Bros Novel by JK Rowling 5 The Lord of the Rings: The Two Towers USA/NZ 923 New Line Novel by JRR Tolkien 10 6 Harry Potter and the Goblet of Fire UK/USA 896 Warner Bros Novel by JK Rowling 7 Harry Potter and the Chamber of Secrets UK/USA 879 Warner Bros Novel by JK Rowling 11 8 The Lord of the Rings: The Fellowship of the Ring USA/NZ 868 New Line Novel by JRR Tolkien 9 Harry Potter and the Prisoner of Azkaban UK/USA 795 Warner Bros Novel by JK Rowling 12 10 The Chronicles of Narnia: The Lion, the Witch and the Wardrobe USA/NZ 749 Disney Novel by CS Lewis 11 The War of the Worlds USA 596 Paramount Novel by HG Wells 13 12 Casino Royale UK/USA/Cze 595 Sony Pictures Novel by Ian Fleming 13 Mamma Mia! UK/USA 585 Universal Musical book and screenplay 14 by Catherine Johnson 14 Quantum of Solace UK/USA 546 Sony Pictures Based on Ian Fleming novels 15 Charlie and the Chocolate Factory UK/USA 473 Warner Bros Novel by Roald Dahl 15 16 Die Another Day UK/USA 432 MGM/UA Based on Ian Fleming novels 17 The Chronicles of Narnia: Prince Caspian UK/USA 420 Disney Novel by CS Lewis 18 Sherlock Holmes USA/UK 417 Warner Bros Based on Sir Arthur 16 Conan Doyle novels 19 The Golden Compass UK/USA 365 New Line Novel by Philip Pullman 17 20 Wanted USA 345 Universal Graphic novel written by Mark Millar Source: UK Film Council RSU. 18 19 20 Image: An Education courtesy of E1 Entertainment Chapter 7: UK talent and awards– 53 21
  • 56.
    Of the 30films from the top 200 based on UK stories and characters, the majority (71%) were based on novels by authors such as Sir Arthur Conan Doyle, Roald Dahl, Helen Fielding, Ian Fleming, CS Lewis, Philip Pullman, JK Rowling, JRR Tolkien and HG Wells (Figure 7.1). The top grossing UK film of 2009 was Harry Potter and the Half-Blood Prince, which was based on the novel by JK Rowling. The international popularity of UK comedy writing was highlighted by the success of original screenplays for Borat: Cultural Learnings of America for Make Benefit Glorious Nation of Kazakhstan and Love Actually. Films based on graphic novels by UK writers, such as Wanted and Constantine, had a major global impact, as did the computer game Tomb Raider in its film spin-off. The musical Mamma Mia! started life as a UK stage production in 1999, with the songs of ABBA woven into a story written by British playwright Catherine Johnson. Figure 7.1 Origin of UK story material in the top 200 films at the international box office, 2001–2009 Novel 77% Original screenplay 10% Comic book/graphic novel 7% Computer game 3% Musical 3% 7.2 UK actors UK acting talent is widely recognised as being among the best in the world and more than half (113) of the top 200 films at the international box office since 2001 have featured British actors in either lead/title roles (30) or in the supporting cast (83). The prominent role played by UK actors in many of the major blockbusters of the last decade is reflected in Figure 7.2 which shows the top 12 British actors based on appearances in the top 200 films. Orlando Bloom, Ian McKellen and Christopher Lee have featured in some of the biggest franchises in cinema history such as Lord of the Rings, Pirates of the Caribbean, X-Men and the Star Wars prequels. New entries this year include Jonathan Pryce (who appeared in three Pirates of the Caribbean films, and two successful 2009 films, GI Joe and Bedtime Stories), Ewan McGregor (two Star Wars films, Robots and 2009’s Angels and Demons) and Christian Bale (for his role as Batman in Batman Begins and The Dark Knight, and two successful 2009 films, Public Enemies and Terminator Salvation). 54 – UK Film Council Statistical Yearbook 2010
  • 57.
    1 2 Figure 7.2 Top 12 UK actors featured in the top 200 films at the worldwide box office, 2001–2009 3 (number of appearances in brackets) Total gross box office (US$ billion) 7.00 4 6.00 5.00 5 4.00 3.00 6 2.00 1.00 7 0 ) 6) ) ) ) ) 4) ) ) ) G tso / t( / rt a ffe rin n (8 (6 (6 (5 (4 (4 (4 (4 r( om n ee e se e ne ig pe W cli go yc l le Ba ra ee Ru maRad L ai el Pr o re C er C Cl Bl cK n cG el an ph tia el el hn o M ni ha M 8 ni th nd to ris Em Da Jo n Da ic na ris an Ch rla Ia M Jo Ch Ew O Total gross 6.30 5.41 4.53 4.13 3.20 2.38 2.25 1.96 1.87 1.76 box office (US$ billion) 9 Source: UK Film Council RSU. Criteria: based on four or more appearances, either in lead/title role or supporting role. 10 7.3 UK directors Nineteen of the 200 highest grossing films at the worldwide box office have been directed by British directors 11 (Figure 7.3 and Table 7.2). David Yates’s two Harry Potter films (Harry Potter and the Order of the Phoenix and Harry Potter and the Half-Blood Prince) made him the British director with the most commercial success in recent years, with total box office takings of $1.87 billion. Christopher Nolan is second following Batman Begins and 12 The Dark Knight, with combined box office takings of $1.37 billion. In third place is Mike Newell who directed Harry Potter and the Goblet of Fire, which grossed $896 million. Ridley Scott was the most prolific director, with three films (Kingdom of Heaven, Hannibal and American Gangster) in the top 200, grossing over $826 million 13 between them. The success of The Bourne Supremacy and The Bourne Ultimatum ensures that Paul Greengrass features twice in the top 200 list, with a combined gross of $731 million. Two new British directors appear in the top 200 films due to the success of their 2009 films. These are Danny Boyle who directed Slumdog Millionaire, which 14 grossed $362 million, and Guy Ritchie, whose Sherlock Holmes has grossed $417 million to date. Three women feature in the top 200 list – Sharon Maguire and Beeban Kidron – for Bridget Jones’s Diary and Bridget Jones: The Edge of Reason respectively and also Phyllida Lloyd, who made the transition from West End stage to film 15 with her 2008 debut feature, Mamma Mia!. 16 17 18 19 20 Chapter 7: UK talent and awards – 55 21
  • 58.
    Figure 7.3 Top10 UK directors based on top 200 grossing films, 2001–2009 (number of films in brackets) Gross box office (US$ million) 1,900 1,425 950 475 0 2) ) ) ) ) ) ) ) ) ) (2 (1 (3 (2 (1 (1 (1 (1 (1 s( an l tt ss d e le on re el te hi oy o y ra ui w ol dr Bo Ya Sc tc Ll ag g Ne N Ki Ri en ey a y d M er nn lid an vi uy e re dl ph ik Da on yl G Da G eb Ri M to Ph ar ul Be ris Sh Pa Ch Gross 1,871 1,370 896 826 731 585 417 362 261 254 box office (US$ million) Source: UK Film Council RSU. Table 7.2 UK directors from the top 200 films at the global box office and their films, 2001–2009 Total gross box office Director Film(s) (US$ million) David Yates Harry Potter and the Order of the Phoenix, Harry Potter and the Half-Blood Prince 1,871 Christopher Nolan Batman Begins, The Dark Knight 1,370 Mike Newell Harry Potter and the Goblet of Fire 896 Ridley Scott American Gangster, Hannibal, Kingdom of Heaven 826 Paul Greengrass The Bourne Supremacy, The Bourne Ultimatum 731 Phyllida Lloyd Mamma Mia! 585 Guy Ritchie Sherlock Holmes 417 Danny Boyle Slumdog Millionaire 362 Beeban Kidron Bridget Jones: The Edge of Reason 261 Sharon Maguire Bridget Jones’s Diary 254 Simon West Lara Croft: Tomb Raider 252 Richard Curtis Love Actually 245 Steve Bendelack Mr Bean’s Holiday 228 Tom Vaughan What Happens in Vegas 219 Source: UK Film Council RSU. 56 – UK Film Council Statistical Yearbook 2010
  • 59.
    1 2 7.4 Awards for UK films and talent 3 UK films and British talent, in front of and behind the camera, have enjoyed major award recognition since 2001. Table 7.3 illustrates the number of awards won by UK films and individuals at two major international award ceremonies (Academy Awards®, BAFTA Film Awards) and the major international film festivals (Berlin, Cannes, 4 Sundance, Toronto and Venice). In all, there were 241 award winners, representing 14% of the awards made. 5 Table 7.3 Awards for British films and talent, 2001–2009 Year Number of UK award winners* UK share % 2001 25 14 6 2002 24 15 2003 22 13 7 2004 22 13 2005 23 14 2006 25 14 8 2007 32 15 2008 32 15 9 2009 36 17 Total 241 14 *Awards include Academy Awards® and BAFTA Film Awards, and Berlin, Cannes, Sundance, Toronto and Venice festivals. 10 Source: UK Film Council. UK films and talent won 36 major academy and festival awards in 2009, 17% of the total number conferred (Table 7.4). Slumdog Millionaire won six awards for UK talent, including Best Film and Best Director, at both the Academy® 11 and BAFTA awards (in total Slumdog Millionaire won eight Academy Awards® and seven BAFTAs). Kate Winslet was also awarded Best Leading Actress at both the Academy® and BAFTA awards for her role in The Reader. 12 13 14 15 16 17 18 19 20 Chapter 7: UK talent and awards – 57 21
  • 60.
    The documentary Manon Wire followed its 2008 success at the Sundance Film Festival by being awarded the 2009 Oscar® for Best Documentary Feature. This film was also given an Outstanding British Film award at the BAFTAs. Andrea Arnold was awarded the Jury Prize at the Cannes Film Festival for Fish Tank, and two British documentaries received awards at Sundance. Kim Longinotto won the Grand Jury Prize – World Cinema – Documentary for Rough Aunties, and Havana Marking won two prizes, the Directing Award – World Cinema – Documentary and the Audience Award – World Cinema – Documentary, for Afghan Star. Table 7.4 UK award winners, 2009 Award ceremony/festival Award Recipient Title Academy Awards ® Best Motion Picture of the Year Christian Colson Slumdog Millionaire 22 February 2009 Best Performance by an Actress in Kate Winslet The Reader a Leading Role Best Achievement in Directing Danny Boyle Slumdog Millionaire Best Writing, Screenplay Based Simon Beaufoy Slumdog Millionaire on Material Previously Produced or Published Best Achievement in Cinematography Anthony Dod Mantle Slumdog Millionaire Best Achievement in Costume Design Michael O’Connor The Duchess Ian Tapp, Richard Pryke Best Achievement in Sound Mixing Slumdog Millionaire (with Resul Pookutty) Best Achievement in Editing Chris Dickens Slumdog Millionaire Best Documentary, Features James Marsh, Simon Chinn Man on Wire BAFTA Film Awards Best Film Christian Colson Slumdog Millionaire 8 February 2009 Leading Actress Kate Winslet The Reader Director Danny Boyle Slumdog Millionaire Original Screenplay Martin McDonagh In Bruges Adapted Screenplay Simon Beaufoy Slumdog Millionaire Cinematography Anthony Dod Mantle Slumdog Millionaire Costume Design Michael O’Connor The Duchess Glenn Freemantle, Richard Sound Slumdog Millionaire Pryke, Tom Sayers, Ian Tapp (with Resul Pookutty) Editing Chris Dickens Slumdog Millionaire Short Film Esther Campbell September Wallace and Gromit in Short Animation Nick Park, Steve Pegram, “A Matter of Loaf and Bob Baker Death” Outstanding British Film James Marsh, Simon Chinn Man on Wire Outstanding British Contribution Pinewood and Shepperton to Cinema Studios 58 – UK Film Council Statistical Yearbook 2010
  • 61.
    1 2 3 4 5 Table 7.4 UK award winners, 2009 (continued) Award ceremony/festival Award Recipient Title 6 BAFTA Film Awards The Carl Foreman Award for Special Steve McQueen Hunger 8 February 2009 cont. Achievement by a British Director, Writer or Producer in their First Feature Film 7 Orange Rising Star Award Noel Clarke Academy Fellowship Terry Gilliam 8 Berlin International Silver Bear, Best Short Film Daniel Elliott Jade Film Festival 5–15 February 2009 9 Prize of the Ecumenical Jury – Richard Loncraine My One and Only Special Mention Cannes Film Festival Jury Prize Andrea Arnold Fish Tank 10 13–24 May 2009 Best Actress Charlotte Gainsbourg Antichrist Sundance Film Festival Grand Jury Prize – World Cinema – 11 Kim Longinotto Rough Aunties 15–25 January 2009 Documentary 12 Directing Award – World Cinema – Havana Marking Afghan Star Documentary World Cinema Screen Writing Award Guy Hibbert Five Minutes of Heaven 13 Audience Award – World Cinema – Havana Marking Afghan Star Documentary Audience Award – World Cinema – 14 Lone Scherfig An Education Dramatic Short Filmmaking Award – Honorable Sam Taylor-Wood Love You More Mention 15 Venice Film Festival Volpi Cup – Best Actor Colin Firth A Single Man 2–12 September 2009 Source: UK Film Council. 16 Note: No awards were made to British talent or films at Toronto in 2009. 17 18 „ 3F or more details on the film distribution sector in 2009 see Chapter 8 (page 60) 19 3F or more information about the exhibition sector in 2009 see Chapter 9 (page 65) 3F or more background on film production in 2009 see Chapter 16 (page 132) 20 Chapter 7: UK talent and awards – 59 21
  • 62.
    Chapter 8: Distribution Filmdistribution in the Facts in focus UK is dominated by a few • he top 10 distributors had a 92% share of the market T in 2009, down from 95% in 2008. very large companies but a • eekdays (Monday to Thursday) accounted for 42% of W number of smaller companies the box office, the highest share since our records began. distribute almost as many • pening weekends represented 26% of the total O box office. titles. Their combined • stimated total advertising spend was £168 million, E spending on advertising a 2% fall on 2008. was less in 2009 than in 2008, but with fewer films released, the average spend per film saw very little change.
  • 63.
    1 2 8.1 Distributors in 2009 3 The top 10 distributors had a 92% share of the market in 2009, down from 95% in 2008 (Table 8.1) The remaining 83 distributors handled a total of 374 titles, 65% of the total, but gained only an 8% share of the box office. The leading distributor was 20th Century Fox, which released the highest grossing film of all time in the UK, Avatar 4 (though Table 8.1 includes box office data only to 3 January 2010, when Avatar’s takings were £32.8 million, still below Mamma Mia!’s old record) as well as Ice Age III and Alvin and the Chipmunks 2: The Squeakquel. Walt Disney Studios was the second highest grossing distributor, with films such as Up, A Christmas Carol and Bolt. Sony Pictures 5 was in third place thanks to 2012 and Angels and Demons. 6 Table 8.1 Distributor share of box office, UK and Republic of Ireland, 2009 Market Films on Box office share release gross Distributor (%) 2009 (£ million) 7 20th Century Fox 16.6 24 178.7 Walt Disney Studios 12.4 22 133.3 8 Sony Pictures 11.3 28 122.2 Warner Bros 11.2 25 120.8 Paramount 10.8 19 116.6 9 Universal Pictures 10.5 29 113.4 Entertainment 8.6 24 92.4 10 E1 Films 4.9 11 53.1 Lions Gate 2.9 14 31.8 Pathé 2.9 5 31.7 11 Sub-total 92.2 201 994.0 Others (83 distributors) 7.8 374 83.5 Total 100.0 575 1,077.5 12 Source: Rentrak EDI. Box office gross = cumulative box office total for all films handled by the distributor in the period 2 January 2009 to 3 January 2010. Note: Percentages do not add to sub-total due to rounding. 13 Table 8.2 highlights the top 10 distributors of foreign language films at the UK box office. Companies that release Indian films, such as Yash Raj, Eros, Adlabs and UTV Communications, are well represented in the list. Curzon 14 Artificial Eye released the most foreign language titles (13) in 2009, while Optimum’s eight releases had the biggest share of the box office (£4.5 million). Optimum’s releases included Coco Before Chanel, which was the highest grossing foreign language film of the year. 15 16 17 18 19 20 Image: Coco Before Chanel courtesy of Optimum Releasing Chapter 8: Distribution – 61 21
  • 64.
    Table 8.2 Top10 distributors of foreign language films in the UK and Republic of Ireland, 2009 (ranked by box office gross) Films Average Box office released widest point gross Distributor in 2009 of release (£ million) Optimum Releasing 8 42 4.5 Eros International 9 36 3.3 Curzon Artificial Eye 13 15 2.5 Adlabs 6 31 2.3 Momentum 5 40 2.1 Warner Bros 2 77 1.8 UTV Communications 7 34 1.5 Yash Raj 4 34 1.2 B4U Network 6 21 1.0 Studio 18 4 37 0.9 Source: Rentrak EDI, RSU analysis. Note: The list includes distributors releasing two or more foreign language titles in the period 2 January 2009 to 3 January 2010. 8.2 Distributors 2004–2009 The distributors’ market shares fluctuate from year to year (Table 8.3). The leading distributor of 2009, 20th Century Fox, saw its market share increase thanks to films such as Avatar and Ice Age III. The share of box office made by distributors outside the top 10 ranged from under 3% in 2005 to over 5% in 2007 and 2008 and just under 8% in 2009. Table 8.3 Distributor market share as percentage of box office gross, 2004–2009 Distributor 2004 2005 2006 2007 2008 2009 20th Century Fox 10.7 14.3 20.9 13.9 9.4 16.6 Walt Disney 14.5 13.1 15.7 10.7 9.9 12.4 Sony Pictures 10.0 6.8 16.1 8.2 12.5 11.3 Warner Bros 14.7 18.2 8.2 15.6 11.0 11.2 Paramount – – – 14.7 16.9 10.8 Universal Pictures – – – 13.9 18.5 10.5 Entertainment 7.9 9.4 7.9 9.5 8.0 8.6 E1 Films – – – – – 4.9 Lions Gate 1.0 0.3 2.4 2.3 2.5 2.9 Pathé 2.8 3.4 3.2 1.3 2.1 2.9 Momentum 2.2 1.9 2.3 3.4 3.5 – UIP* 29.8 29.1 18.9 – – – Top 10 total** 96.1 97.3 96.4 94.5 94.5 92.2 Others 3.9 2.7 3.6 5.5 5.5 7.8 Total 100.0 100.0 100.0 100.0 100.0 100.0 Source: Rentrak EDI. *Until 2006 Paramount and Universal distributed jointly as UIP. **Top 10 total refers to the top 10 distributors of that particular year. Table is ranked by top 10 distributors in 2009. Note: Percentages may not add to sub-totals due to rounding. 62 – UK Film Council Statistical Yearbook 2010
  • 65.
    1 2 8.3 Weekend box office 3 In 2009, 58% of the box office was taken at weekends (Friday to Sunday), almost the same as the 59% seen in 2008, which was down from 64% in 2007 (Table 8.4). As in 2008, the films released in 2009 included some that attracted large weekday audiences. Family films tend to attract weekday audiences, and some of 2009’s family films, such as 4 Ice Age III, Up and Alvin and the Chipmunks 2: The Squeakquel, were very successful at the box office. In addition, the ‘Orange Wednesdays’ promotion continued to have an impact in 2009 with 14% of the box office being taken on Wednesdays (compared with 12% in 2008). 5 Table 8.4 Box office percentage share by weekday/weekend, 2004–2009 6 2004 2005 2006 2007 2008 2009 Friday 15.3 18.0 16.5 16.4 16.7 16.4 Saturday 24.5 27.0 25.1 27.8 24.4 24.0 7 Sunday 19.9 19.0 18.7 19.3 18.3 17.8 Weekend 59.7 64.0 60.3 63.5 59.4 58.2 8 Monday 9.7 8.0 9.5 7.2 9.4 9.2 Tuesday 10.1 8.0 9.5 9.0 9.5 9.5 Wednesday 10.7 10.0 10.9 11.6 11.9 13.7 9 Thursday 9.8 10.0 9.7 8.7 9.9 9.5 Weekday 40.3 36.0 39.7 36.5 40.7 41.8 10 Total 100.0 100.0 100.0 100.0 100.0 100.0 Source: Rentrak EDI. Note: Percentages may not add to sub-totals due to rounding. 11 The opening weekend box office as a share of total theatrical revenue fell to 26% in 2009 as shown in Table 8.5. Some of the top films such as Ice Age III, Slumdog Millionaire and The Hangover had longer theatrical runs and so their opening weekend represented a smaller share of overall box office. The opening weekend box office as 12 a percentage of total theatrical revenue for Slumdog Millionaire was just 6%. However, this film’s success at the BAFTA Awards and Academy Awards® was a significant factor in its box office success, and these awards were won after its opening weekend. 13 Table 8.5 Opening weekend as percentage of total box office, 2007–2009 14 % of total in % of total in % of total in opening opening opening weekend weekend weekend Range of box office results 2007 2008 2009 15 All films 28.5 27.3 26.1 More than £30 million 35.8 21.7 18.8 £20 million – £30 million 30.2 31.0 23.0 16 £10 million – £19.9 million 20.0 29.2 32.2 £5 million – £9.9 million 25.4 27.6 26.1 17 £1 million – £4.9 million 28.1 27.4 30.3 £200,000 – £999,000 31.9 34.1 35.5 Less than £200,000 34.1 34.8 36.5 18 Source: Rentrak EDI, RSU analysis. Opening weekends include preview figures. For films with a limited initial opening, the wider release figure is included in the analysis. 19 20 Chapter 8: Distribution – 63 21
  • 66.
    Chapter 1: 8.4 Releasecosts The opening weekend is recognised as being crucial Where the data are available, the total release costs for various release widths can be estimated. By taking a typical print cost of £1,000 per print and adding the The box office to the lifetime of a film, both in cinemas and on subsequent release platforms. Distributors invest heavily Nielsen Media Research advertising spend estimate plus 20% for other public relations campaigns, publicity and in advertising in order to raise a film’s profile across all premiere costs, the average release cost for each level media (outdoor posters, print media, television, radio of theatrical release can be calculated (Table 8.7). and increasingly online). The estimated total distributor This shows that for films released across the widest advertising spend in 2009 was £168 million, down 2% number of cinemas (500+), the average release cost was from £172 million in 2008 (Table 8.6). However, fewer £3.4 million, compared with almost £4 million in 2008. films were released in 2009, and the average advertising spend per film in 2009, at £0.3 million, was very similar Average release costs for the films with the widest to that in 2008. Press spend has fallen over the last six releases have decreased from 2008 levels but, as years (from £30.1 million in 2003) while the internet indicated above, the 2009 average advertising costs has emerged as an outlet for film advertising (internet for all films was very similar to the 2008 average. advertising spend dipped slightly from 2007 to 2008, While the films with the widest releases (ie those but increased from £4.5 million in 2008 to £6.4 million which spend most on advertising) spent less per film in 2009). Approximately £28 million was spent on on advertising in 2009 than in 2008, there were more advertising British films, down from £43 million in 2008. of these films in 2009, and so the overall advertising This drop in advertising of UK films was largely due to spend in 2009 was similar to that in 2008. the lower number of UK/USA studio films released in 2009. There were 13 studio-backed UK films released Table 8.7 Estimated release cost by width of release, in 2009 (five of which were re-releases which received 2008–2009 little or no advertising) compared with 22 in 2008. Average Average release release Sites at widest cost 2008 cost 2009 Table 8.6 Estimated advertising spend, point of release (£ million) (£ million) 2003 and 2007–2009 500 3.95 3.40 (£ million) 400–499 2.21 2.05 2003 2007 2008 2009 300–399 1.39 1.32 TV 61.2 74.1 79.3 74.3 200–299 0.90 0.84 Outdoor 46.6 65.3 56.2 57.0 100–199 0.43 0.51 Press 30.1 27.0 22.6 19.9 50–99 0.18 0.21 Radio 9.7 8.4 9.4 10.7 10–49 0.08 0.06 Internet – 4.7 4.5 6.4 10 0.01 0.01 Total 147.6 179.5 172.0 168.3 Source: Nielsen Media Research, Rentrak EDI, RSU analysis. Source: Nielsen Media Research. „ 3F or further details about the UK box office in 2009 see Chapter 1 (page 8) 3F or more information about the top films at the UK box office in 2009 see Chapter 2 (page 15) 3F or an overview of employment in film distribution see Chapter 21 (page 182) 64 – UK Film Council Statistical Yearbook 2010
  • 67.
    Chapter 9: Exhibition The numberof screens in the Facts in focus UK continues to rise, although • he UK had 3,651 screens, 41 more than 2008, T in 723 cinemas. the availability of screens • here were six screens for every 100,000 people, the T and admissions per person same as in 2008, but lower than some other countries. vary considerably across the • orthern Ireland had the highest number of screens N (9.6) per 100,000 people in the UK, while the East country. The number of digital Midlands (4.7), the North East (4.3) and the East screens doubled during 2009, of England (4.1) had the lowest. while the number of 3D digital • nly 7% of screens were dedicated to ‘specialised’ O (that is non-mainstream) programming, with 0.3% screens increased by over dedicated mainly to South Asian films. six times. • he UK had the second highest number of digital screens T in Europe with 642 screens (behind France’s 959 digital screens). The UK had 449 screens capable of screening digital 3D features (70% of all digital screens). • he average ticket price was £5.44. T
  • 68.
    9.1 UK cinemasites Figure 9.1 shows the number of cinema sites in the UK from 2002 to 2009. The number of sites decreased slightly in 2004 but rose to a high of 727 sites by 2007. In 2008 sites fell by one to 726, and fell by a further three, to 723, in 2009. The number of multiplex sites increased from 269 in 2008 to 275 in 2009. In 2009 multiplexes made up 38% of all cinema sites. Figure 9.1 UK cinema sites by type of site, 2002–2009 Number of sites 800 700 600 500 400 300 200 100 0 2002 2003 2004 2005 2006 2007 2008 2009 Multiplex 229 234 238 242 249 258 269 275 Traditional and mixed use 439 444 406 417 448 469 457 448 Total sites 668 678 644 659 697 727 726 723 % multiplex sites 34 35 37 37 36 35 37 38 Source: Dodona Research, RSU analysis. Note: Data on cinema sites prior to 2002 not availabe. Multiplexes are defined as purpose-built cinema complexes with five screens or more while excluding those that were converted from traditional cinema sites. 9.2 UK screens The number of owned or programmed cinema screens (excluding those operated in venues such as schools and private screening rooms) continued to increase slightly in 2009, rising by just over 1% to 3,651 as Figure 9.2 shows. The proportion of multiplex screens (see definition in the note to Figure 9.1) continued to rise in 2009. There has been an increase of 68% in the number of multiplex screens since 1999 compared with a 19% fall in the number of traditional and mixed use screens (used for film screenings only part of the time). The UK has gained 1,111 multiplex screens since 1999 and lost 218 traditional or mixed use screens. The proportion of multiplex screens increased from 59% in 1999 to 75% in 2009. 66 – UK Film Council Statistical Yearbook 2010 Image: Love Aaj Kal courtesy of Eros International
  • 69.
    1 2 Figure 9.2 UK cinema screens by type of cinema, 1999–2009 3 Number of screens 4,000 3,500 4 3,000 2,500 5 2,000 1,500 1,000 6 500 0 1999 2000 2001 2002 2003 2004 2005 2006 2007 2008 2009 7 Multiplex 1,624 1,874 2,115 2,299 2,362 2,426 2,453 2,512 2,578 2,689 2,735 Traditional and mixed use 1,134 1,080 1,049 959 956 916 904 928 936 921 916 Total sites 2,758 2,954 3,164 3,258 3,318 3,342 3,357 3,440 3,514 3,610 3,651 8 % multiplex screens 58.9 63.4 66.8 70.6 71.2 72.6 73.1 73.0 73.4 74.5 74.9 Source: Dodona Research, RSU analysis. See note to Figure 9.1. 9 Table 9.1 shows that more multiplex sites and screens opened than closed in 2009 while there were net falls in the number of traditional sites and screens over the same period. The number of traditional screens fell for the second 10 year in succession, after two small rises in 2006 and 2007 as shown in Figure 9.2. A total of 34 sites (all but two traditional) closed in 2009, nine fewer than the number of closures in 2008, with a loss of 63 screens (the same number as in 2008). Thirty-one sites opened (including eight multiplexes), adding 11 105 screens, including 67 multiplex screens. Table 9.1 Site openings and closures, 2009 12 Multiplex Traditional sites screens sites screens 13 Opened 8 67 23 38 Closed 2 21 32 42 Net difference +6 +46 –9 –5 14 Source: Dodona Research, RSU analysis. See note to Figure 9.1. 15 9.3 Screen location Historically, cinemas have been a feature of the urban landscape and 2009 was no different with 97% of all screens 16 in the UK in town or city centres, edge of centre, ‘out of town’ or suburban locations. Table 9.2 shows suburban and rural cinemas tend to have fewer screens on average than their urban counterparts, 17 although town and city centre sites are also relatively small. In 2009, while there was a significant fall in the percentage of suburban screens, the number of suburban screens lost was just three. The number of rural screens rose fractionally from 95 in 2008 to 97 in 2009. 18 19 20 Chapter 9: Exhibition – 67 21
  • 70.
    Table 9.2 Screensby location, 2003–2009 Average % change number of Location 2003 2004 2005 2006 2007 2008 2009 2008/09 screens per site Town/city centre 1,470 1,502 1,495 1,555 1,616 1,683 1,732 +2.9 3.8 Out of town 1,234 1,243 1,250 1,262 1,284 1,303 1,297 –0.5 9.8 Edge of centre 464 465 479 478 486 499 498 –0.2 9.1 Suburban 33 33 38 40 30 30 27 –10.0 1.8 Rural 117 99 95 105 98 95 97 +2.1 1.4 Total 3,318 3,342 3,357 3,440 3,514 3,610 3,651 +1.1 5.0 Source: Dodona Research, RSU analysis. 9.4 Screen density and admissions per person – international comparisons A standard way to gauge the level of cinema provision is by ‘screen density’, that is the number of screens per unit of population. In 2009, the UK figure was 6.0 screens per 100,000 people, the same as in 2008. This level of screen access falls short of the numbers in other major film territories: USA (12.8), Australia (9.2), Spain (9.0), France (8.7) and Italy (7.2). Germany’s screen density, of 5.8 screens per 100,000 people, is slightly less than in the UK (source: Screen Digest). Table 9.3 shows the numbers of admissions per person in a number of major film territories. The UK saw more admissions per person (2.8) than Spain, Italy and Germany despite having lower screen density than Spain and Italy. Of the major territories, the USA had the highest admissions per person (4.3), closely followed by Australia (4.2). Table 9.3 Admissions per person in major film territories, 2003–2009 Australia USA France UK Spain Italy Germany 2003 4.5 5.4 2.9 2.8 3.3 1.5 1.8 2004 4.5 5.2 3.2 2.9 3.4 1.7 1.9 2005 4.0 4.7 2.9 2.7 2.9 1.6 1.5 2006 4.1 4.8 3.1 2.6 2.7 1.6 1.7 2007 4.1 4.6 2.9 2.7 2.6 1.8 1.5 2008 4.0 4.1 3.0 2.7 2.4 1.7 1.6 2009 4.2 4.3 3.2 2.8 2.4 1.7 1.8 Source: Screen Digest. 9.5 Screen density and admissions per person in the UK As in the previous Yearbooks we are able to present screen provision data based on two types of regional classification. The datasets are not directly comparable because of differences in the way the regions are defined; they do, however, shed light on different aspects of national and regional variation in screen provision. 68 – UK Film Council Statistical Yearbook 2010
  • 71.
    1 2 The Cinema Advertising Association produces monthly admissions totals for each of the television advertising 3 regions used by the Incorporated Society of British Advertisers (ISBA). Screen and admissions data for 2009 using these television regions are presented in Table 9.4. Although London had the highest numbers of screens and sites, its screen density (6.5) was lower than that of Northern Ireland (9.6) and was the same as Central Scotland. 4 The North East had the lowest screen density (4.0) among all ISBA regions. Table 9.4 Screens and admissions by ISBA TV region, 2009 (ranked by screens per 100,000 people) 5 % of total Population Screens per Admissions Admissions Admissions ISBA TV region Screens screens Sites (‘000)* 100,000 people (‘000) per screen per person Northern Ireland 171 4.7 25 1,775 9.6 5,705 33,360 3.2 6 Central Scotland 237 6.5 38 3,626 6.5 12,787 53,953 3.5 London 788 21.6 153 12,208 6.5 41,694 52,911 3.4 7 Wales and West 302 8.3 70 4,787 6.3 11,414 37,794 2.4 Southern 332 9.1 81 5,405 6.1 15,969 48,099 3.0 Lancashire 428 11.7 59 6,971 6.1 19,760 46,167 2.8 8 Northern Scotland 75 2.1 16 1,256 6.0 3,573 47,644 2.8 Border 36 1.0 19 607 5.9 1,346 37,401 2.2 9 South West 106 2.9 35 1,839 5.8 4,274 40,317 2.3 Midlands 553 15.1 105 9,831 5.6 24,624 44,528 2.5 East of England 214 5.9 46 4,209 5.1 11,272 52,675 2.7 10 Yorkshire 292 8.0 51 5,884 5.0 14,565 49,879 2.5 North East 117 3.2 25 2,894 4.0 6,480 55,382 2.2 11 Total 3,651 100.0 723 61,293 6.0 173,461 47,511 2.8 Source: Dodona Research, Beacon Dodsworth, Cinema Advertising Association (CAA), RSU analysis. *Mid-year population estimates 2008. Crown copyright material is reproduced with the permission of the Controller Office of Public Sector Information (OPSI). 12 There was a positive and statistically significant linear relationship between cinema admissions per person and screen density in 2009, as shown in Figure 9.3. That is, the higher the number of screens per person, the higher the admissions level. However, this association should not be interpreted as a causal relationship as it would be 13 hard to prove whether higher demand caused the higher supply of cinema screens or vice versa. The pattern of admissions by screen density for ISBA regions in 2009 was very similar to the pattern in 2008. In 2009, as in 2008, some regions had above average screen densities, but their levels of admissions remained 14 low. For example, Wales and the West had a relatively high screen density of 6.3 per 100,000 people but its cinema admissions rate was one of the lowest at 2.4 admissions per person. It is hard to pinpoint the reason behind this observation. The levels of cinema admissions across regions are subject to numerous influences, such as fluctuations 15 in population size during tourist seasons, the age composition of the population, presence or absence of a film culture and varying competition from other forms of entertainment. 16 17 18 19 20 Chapter 9: Exhibition – 69 21
  • 72.
    Figure 9.3 Cinemaadmissions per person by screen density across ISBA regions, 2009 Admissions per person 4.0 Central Scotland 3.5 London Northern Ireland Southern 3.0 East of Northern England Scotland Lancashire Midlands 2.5 Yorkshire Wales and West South West North East Border 2.0 4 5 6 7 8 9 10 Screen density Source: Dodona Research, Beacon Dodsworth, CAA, RSU analysis. *Mid-year population estimates 2008. Crown copyright material is reproduced with the permission of the Controller Office of Public Sector Information (OPSI). Notes: The line shown above is derived from a weighted linear regression so the results are more influenced by areas with larger population, for example, London and the Midlands. The relationship between the variables is positive and statistically significant. The area of the circle is proportional to the ISBA region’s population. Screen density means number of screens per 100,000 people. Table 9.5 gives screen information for each of the English Government Office Regions, plus Scotland, Wales and Northern Ireland, which correspond to the areas covered by the nine English Regional Screen Agencies, Scottish Screen, the Film Agency for Wales and Northern Ireland Screen. Table 9.5 Screens and population in the nations and Government Office Regions, 2009 (ranked by screens per 100,000 people) Population Average % of total (in ‘000) Screens per number of Nation/Government Office Region Screens screens Sites mid-year 2008* 100,000 people screens per site Northern Ireland 171 4.7 25 1,775 9.6 6.8 London 559 15.3 110 7,620 7.3 5.1 South East 533 14.6 121 8,380 6.4 4.4 Scotland 325 8.9 63 5,169 6.3 5.2 North West 431 11.8 62 6,876 6.3 7.0 Wales 183 5.0 46 2,993 6.1 4.0 South West 316 8.7 82 5,209 6.1 3.9 West Midlands 310 8.5 53 5,411 5.7 5.8 Yorkshire and The Humber 254 7.0 44 5,213 4.9 5.8 East Midlands 207 5.7 42 4,433 4.7 4.9 North East 112 3.1 22 2,576 4.3 5.1 East of England 233 6.4 49 5,729 4.1 4.8 Others** 17 0.5 4 n/a n/a 4.3 Total 3,651 100.0 723 61,383 5.9 5.0 Source: Dodona Research, Office for National Statistics (ONS), RSU analysis. * Mid-2008 Population Estimates, ONS. **Others include the Channel Islands and the Isle of Man. n/a = not available. 70 – UK Film Council Statistical Yearbook 2010
  • 73.
    1 2 The pattern of national and regional variation in screen provision changed slightly in 2009 with Scotland and 3 the South East moving up the screen density rankings. Northern Ireland had the highest number of screens per 100,000 people of the four nations (9.6), followed by Scotland (6.3), Wales (6.1) and England (5.7). Table 9.5 also reveals that Northern Ireland and the North West had on average over six screens per site compared 4 with the UK average of five. The South West, Wales and the South East fell below the average, showing a tendency towards smaller cinemas and, particularly for the South West, proportionally fewer multiplex screens (see Table 9.6). 5 9.6 Type of cinema screens by nation and region Table 9.6 provides a snapshot of variations in multiplex provision around the UK. The South East had the largest 6 number of multiplex screens (388), one more than the North West and 32 more than London. The North West had the highest proportion of multiplex screens (90%). In England the lowest concentration of multiplex screens was found in the South West (60%), which had a high number of traditional and mixed use screens (the third 7 highest after London and the South East). The proportion of multiplex screens for England as a whole was 74%. The Channel Islands and Isle of Man (59%) also had proportionally fewer multiplex screens than the UK average. 8 Table 9.6 Cinema screens by type by nation or Government Office Region, 2009 (ranked by percentage multiplex) Traditional and 9 Nation/Government Office Region Multiplex % multiplex mixed use Total North West 387 89.8 44 431 Yorkshire and The Humber 211 83.1 43 254 10 North East 93 83.0 19 112 Northern Ireland 137 80.1 34 171 11 West Midlands 243 78.4 67 310 Wales 141 77.0 42 183 Scotland 248 76.3 77 325 12 East of England 176 75.5 57 233 East Midlands 156 75.4 51 207 13 South East 388 72.8 145 533 London 356 63.7 203 559 South West 189 59.8 127 316 14 Other* 10 58.8 7 17 Total 2,735 74.9 916 3,651 15 Source: Dodona Research, RSU analysis. *Other includes the Channel Islands and the Isle of Man. 16 17 18 19 20 Chapter 9: Exhibition – 71 21
  • 74.
    9.7 Mainstream, specialisedand South Asian programming Dodona Research categorises screens according to whether they show mostly mainstream, specialised (that is non- mainstream, including ‘art-house’) or South Asian films. Table 9.7 shows that by far the majority of screens mostly show mainstream films. In 2009, 551 cinemas with 3,388 screens showed mostly mainstream films (a rise of 1% for screens and a decrease of 1% for sites). This compared with 168 sites (253 screens, 7% of screens) showing specialised films and four cinemas (10 screens, 0.3% of screens) dedicated mainly to South Asian films. The numbers of screens showing mostly specialised films increased by 1% in 2009 while the number of cinemas stayed the same. Table 9.7 Sites and screens by programme, 2005–2009 Sites Screens Programme 2005 2006 2007 2008 2009 2005 2006 2007 2008 2009 South Asian 5 5 4 4 4 18 18 10 10 10 Specialised 132 157 177 168 168 206 231 255 250 253 Mainstream 522 535 546 554 551 3,133 3,191 3,249 3,350 3,388 Source: Dodona Research, RSU analysis. The majority (68%) of specialised screens were found in single, independent cinemas (that is, not part of a chain). The pattern of programme type by location in 2009 is shown in Table 9.8. Screens showing mostly South Asian films were located in town or city centres and suburban areas, while those devoted to specialised film were mainly found in town or city centres. The overall pattern remained similar to last year. Table 9.8 Percentages of screens by location and programme, 2009 Location South Asian Specialised Mainstream Total Town/city centre 80.0 85.0 44.5 47.5 Out of town – 3.2 38.0 35.5 Edge of centre – 2.0 14.6 13.6 Suburban 20.0 3.6 0.5 0.7 Rural – 6.3 2.4 2.7 Total 100.0 100.0 100.0 100.0 Source: Dodona Research, RSU analysis. Note: Percentages may not add to totals due to rounding. This geographical analysis is extended in Tables 9.9 and 9.10, which reveal the distribution of South Asian and specialised screens around the UK. Table 9.9 shows that 80% of all screens showing South Asian films were found in London, with the remainder in the East Midlands, both areas having large British Asian populations. 72 – UK Film Council Statistical Yearbook 2010
  • 75.
    1 2 Table 9.9 Geographical spread of South Asian screens, 2009 3 Government Office Region South Asian screens % London 8 80 4 East Midlands 2 20 Total 10 100 Source: Dodona Research, RSU analysis. 5 Screens showing mainly specialised films were concentrated in London and the South East, which housed 45% of them in 2009 (Table 9.10). Scotland had 28 specialised screens and the South West 26, accounting for 11% and 6 10% respectively, of such screens. The North East (3.2%), Wales (2.8%) and Northern Ireland (0.8%) had the smallest number of specialised screens. 7 Table 9.10 Geographical spread of specialised screens, 2009 Nation/Government Office Region Specialised screens % London 75 29.6 8 South East 38 15.0 Scotland 28 11.1 9 South West 26 10.3 West Midlands 17 6.7 East Midlands 15 5.9 10 East of England 15 5.9 Yorkshire and The Humber 12 4.7 11 North West 10 4.0 North East 8 3.2 Wales 7 2.8 12 Northern Ireland 2 0.8 Total 253 100.0 13 Source: Dodona Research, RSU analysis. 9.8 Exhibitors 14 The number of exhibitors that owned or programmed 20 or more screens in the UK was 11 in 2009, the same as in 2008 (13 in 2005 and 2006, 12 in 2007), as shown in Table 9.11. The five largest exhibitors owned approximately 15 75% of all UK screens. The order of the list remained similar to last year except for Merlin Cinemas, which increased its number of screens from 26 in 2008 to 31 in 2009, to move ahead of AMC in the list. 16 17 18 19 20 Chapter 9: Exhibition – 73 21
  • 76.
    Table 9.11 Cinemascreens by exhibitors with 20+ screens, 2009 % of Exhibitor Sites Screens total screens Odeon 106 840 23.0 Cineworld 76 773 21.2 Vue 67 641 17.6 National Amusements 21 274 7.5 Ward Anderson 25 213 5.8 Apollo 13 77 2.1 City Screen 18 51 1.4 Reel Cinemas 14 51 1.4 Movie House Cinemas 5 39 1.1 Merlin Cinemas 10 31 0.8 AMC 2 28 0.8 Others (14 major exhibitors and 312 independent single venue exhibitors) 366 633 17.3 Total 723 3,651 100.0 Source: Dodona Research. Figures correct as at March 2010. Notes: Odeon is owned by Terra Firma Capital Partners, a European private equity firm with headquarters in London and Frankfurt. Cineworld comprises the former Cine-UK and UGC chains and is owned by The Blackstone Group, a multinational private equity company. Vue, which acquired Warner Village cinemas in 2003, is owned by SBC International Cinemas (headquartered in the UK). National Amusements is owned by the family of Sumner Redstone, chairman of US media giant Viacom. Ward Anderson is headquartered in the Republic of Ireland where it operates the Cineplex, IMC and Omniplex chains. 9.9 Exhibitor revenues Dodona Research reports that total exhibitor revenue in 2009 stood at £1,193 million, 10% higher than in 2008. Net concession revenue stood at £302 million (a rise of 11% on 2008), while gross advertising revenue totalled £195 million. Average ticket prices, calculated by dividing UK box office gross for the year (£944 million) by total UK admissions (173.5 million), rose from £5.18 in 2008 to £5.44 in 2009, an increase of 5%. 9.10 Digital projection 9.10.1 Digital Screen Network The UK Film Council’s 239 state-of-the-art digital cinema screens had been installed by the end of 2008. The end of the final installations marked the beginning of the four-year contract with the cinemas for the delivery of specialised films. At the end of 2008, the 239 Digital Screen Network screens accounted for a large proportion of the UK’s total of 310 digital screens. Since then however, the rate of installation of digital screens in cinemas has accelerated, and at the end of 2009 there were 642 digital screens in UK cinemas. 9.10.2 Digital screens worldwide and in the UK According to Screen Digest, at the end of 2009 there were 16,335 DCI–level (Digital Cinema Initiatives; see Glossary) digital screens worldwide, 86% up on 8,800 screens in 2008. Table 9.12 shows the number of high-end digital (often referred to as ‘D-Cinema’ in the industry) screens in the world from 2005 to 2009. Worldwide, digital screens have increased almost twenty-fold since 2005. 74 – UK Film Council Statistical Yearbook 2010
  • 77.
    1 2 Table 9.12 Number of high-end digital screens in the world, 2005–2009 3 % % of change in 2009 screens Region 2005 2006 2007 2008 2009 total 2008/09 4 Americas 345 2,030 4,666 5,754 8,185 50.1 42.2 Asia-Pacific 272 430 919 1,471 3,488 21.4 137.1 5 Europe 229 532 864 1,547 4,580 28.0 196.1 of which UK 38 148 296 310 642 3.9 107.1 Africa and Middle East 2 4 6 28 82 0.5 192.9 6 Total 848 2,996 6,455 8,800 16,335 100.0 85.6 Source: Screen Digest. Note: Figures prior to 2007 include a small number of digital screens using the earlier projectors (1.3K DLP Cinema projectors) that do not meet the DCI specifications. 7 The minimum projector resolution for DCI is 2K (see Glossary). Figures valid to March 2010. The rise in the worldwide number of digital screens continued in 2009, with a total increase of 7,535 screens. It was fuelled by the continuing growth of digital screens in Europe, which had the largest percentage increase 8 from 2008 to 2009 and the largest increase in numbers (40% of the worldwide total). North and South America’s increase in digital screens from 2008 to 2009 accounted for 32% of the worldwide increase, and the Asia-Pacific region accounted for 27%. The number of digital screens in Africa and the Middle East increased by 193%, from 9 28 in 2008 to 82 in 2009, but this increase of 54 screens represented just 0.5% of the worldwide total increase. In Europe 12 countries, led by France, had more than 100 digital screens in 2009, compared with five in 2008 as 10 shown in Table 9.13. The top five countries had 63% (62% in 2008) of all of the high-end digital screens in Europe. France increased its number of screens by 278% from 254 in 2008 to 959 in 2009, to have the largest number of digital screens in Europe (21% of the European total). The largest percentage increases from 2008 to 2009, however, were seen in the Czech Republic (780% increase from five to 44 screens) and in Finland (514% increase from seven 11 to 43 screens). 12 Table 9.13 European countries with 100 or more high-end digital screens, 2008–2009 (ranked by number of screens in 2009) % of 13 Year 2009 % increase Europe from Country 2008 2009 total 2008 France 254 959 20.9 277.6 14 UK 310 642 14.0 107.1 Germany 164 525 11.5 220.1 15 Italy 78 415 9.1 432.1 Russia 98 331 7.2 237.8 Spain 58 286 6.2 393.1 16 Austria 119 239 5.2 100.8 Poland 56 191 4.2 241.1 17 Portugal 36 178 3.9 394.4 Belgium 107 142 3.1 32.7 Netherlands 36 105 2.3 191.7 18 Republic of Ireland 46 101 2.2 119.6 Rest of Europe 185 466 10.2 151.9 19 Europe total 1,547 4,580 100.0 196.1 Source: Screen Digest. See note to Table 9.12. 20 Chapter 9: Exhibition – 75 21
  • 78.
    The overall increasein the number of high-end digital screens in the Asia-Pacific region was lower than in Europe between 2008 and 2009. The region’s total number of screens increased by 137% from 1,471 to 3,488. China more than doubled its number of screens (to 1,788) and now has 51% of the region’s digital screens. Table 9.14 shows that the top five countries had just under 92% of all digital screens in the region. In the Asia-Pacific region, Australia had the largest percentage increase in the number of digital screens (588%, from 42 to 289 screens in 2009), and Japan increased its number of digital screens from 123 to 440 (an increase of 258%). Table 9.14 Countries in Asia-Pacific region with 100 or more high-end digital screens, 2008–2009 (ranked by number of screens in 2009) % of Year 2009 % increase Asia-Pacific from Country 2008 2009 total 2008 China 861 1,788 51.3 107.7 South Korea 199 536 15.4 169.3 Japan 123 440 12.6 257.7 Australia 42 289 8.3 588.1 India 112 146 4.2 30.4 Rest of Asia-Pacific 134 289 8.3 115.7 Asia-Pacific total 1,471 3,488 100.0 137.1 Source: Screen Digest. Percentages may not add to 100 due to rounding. See note to Table 9.12. 9.10.3 3D and alternative content programming Of the 642 high-end digital screens in the UK in 2009, 449 (70%) of them were 3D-capable digital screens. This represents a greater than three-fold increase in the proportion of 3D digital screens over 2008. Some of the popular 3D screenings in the UK in 2009 included Avatar (Avatar’s 3D box office takings alone were higher than any other film has taken at the UK box office), Ice Age III and Up. Table 9.15 shows the increasing number and proportion of 3D digital screens in the UK. The growth in 3D digital screens coincided with an increase in the availability of 3D content internationally. Fourteen digital 3D features (films produced in stereoscopic 3D format) were released in 2009, and there is a strong line-up, especially animations, of 3D releases for 2010, including Alice in Wonderland, Clash of the Titans 3D, Harry Potter and the Deathly Hallows: Part 1, Shrek Forever After and Toy Story 3 3D. Table 9.15 3D digital screens in the UK, 2006–2009 Number of 3D digital Total digital 3D % of all Year screens screens digital screens Top performing digital 3D title in the UK/Republic of Ireland 2006 5 148 3.4 Tim Burton’s Nightmare Before Christmas 2007 47 296 15.9 Beowulf 2008 69 310 22.3 Fly Me to the Moon 2009 449 642 69.9 Avatar Source: Screen Digest, Rentrak EDI, RSU analysis. Note: 3D digital screens are capable of screening content made in stereoscopic 3D format. Top performing digital 3D titles in the UK and Republic of Ireland are based on takings from 3D and IMAX screenings. 76 – UK Film Council Statistical Yearbook 2010
  • 79.
    1 2 Alternative content (AC) or non-feature film programming is becoming a regular feature in some UK cinemas 3 equipped with digital screens. The UK is the most advanced territory in Europe for alternative content programming, not least because it also has the highest number of digital sites and, until recently, the highest number of digital screens (now surpassed by France). The availability of a digital screen base has allowed a wider range of content 4 on the big screen, allowed interactivity between the screen and the audience and potentially improved the use of auditorium capacity during typically quiet periods, for example, special screenings of children’s television programmes for parents with babies in the morning. Also, since alternative content events usually have only 5 one or two screenings they tend to generate higher occupancy rates than feature films. There were 58 alternative content events screened in UK cinemas in 2009, according to Screen Digest (Figure 9.4). In 2008, such events ranged from live or recorded operas and pop music concerts to film screenings with a live 6 ’question and answer’ session or a live ‘virtual’ premiere. New types of events shown in 2009 included ballet, a live poetry reading and a live Digital Cinema Workshop. 7 Figure 9.4 Alternative content events screened in UK cinemas by type of event, 2007–2009 Number of events 40 8 30 9 20 10 10 11 0 Opera Sport Theatre Kids (sub Comedy Ballet Classical Poetry Education 12 Popular music Film concerts division of film) music concerts 2007 8 11 7 4 0 0 1 0 0 0 0 2008 39 9 4 6 6 2 1 0 0 0 0 13 2009 34 2 11 1 2 0 1 3 2 1 1 Source: Screen Digest. Note: Figures include live and recorded events. ‘Film’ includes film screenings followed by a live ‘question and answer’ session. ‘Kids’ includes cartoons or short 14 features that would normally be released on television or DVD. Although there were fewer alternative content events in 2009 than in 2008, revenues from these events continued 15 to rise, as Figure 9.5 shows. This may be due to events being shown more widely as more digital screens become available. Notable alternative content events screened in 2009 included a 3D showing of Olympic gold medallist Usain Bolt’s 150 metres sprint in Manchester in May. This event was screened in Odeon cinemas before the showing 16 of Ice Age III. The National Theatre broadcast its production of Racine’s Phèdre starring Helen Mirren to 273 venues around the world, enabling 30,000 viewers to see the play, rather than just those able to attend the live theatre. Events in 2010 include Kenny Chesney: Summer in 3D, a 3D concert film of the singer’s 2008 summer tour across the USA, released in cinemas in April. 17 18 19 20 Chapter 9: Exhibition – 77 21
  • 80.
    Figure 9.5 Revenuesfrom alternative content events While many film societies and community cinemas screened in UK cinemas, 2006–2009 have been in existence over a long period, new ones £ million are established all the time. Over half (56%) of the 5 responding organisations were established in 2000 or later, while 17% were established in the 1960s or earlier 4 (down from 24% in 2007/08). 3 Nearly all of the film societies that responded (87%) operated a membership system in 2008/09 and the 2 average membership size was 138. The membership of responding societies stood at 11,614. The BFFS 1 estimates a total membership of over 38,000 across all film societies known to them. 0 2006 2007 2008 2009 The average full annual membership fee was £26.30 Alternative 0.2 0.8 3.1 4.9 (down from £26.94 in 2007/08). Less than one-third of content revenues societies that operated a membership system charged Source: Screen Digest. an additional admission fee (28%). The average admission fee charged by these societies was £3.96. 9.11 Community cinema in the UK The responding organisations programmed a total of 682 different titles, in 1,581 screenings, during the The screening of feature films in the UK is not limited to 2008/09 season (more than the 503 films released cinemas belonging to the major cinema operators. There theatrically in the UK in 2009). British films were is a thriving sector of non-commercial providers bringing screened 388 times (25% of all screenings, up from a wide variety of programming, often specialised in 23% in 2007/08), and 49% of screenings were foreign nature, to local communities which would otherwise be language films (up from 39% in 2007/08). In total, under-served by the commercial operators. This sector 70% of titles were screened by only one film society is often referred to as community cinema. Members (up from 65% in 2007/08), indicating the diversity of local communities are often more involved in the of programming choices made by individual societies. programming of such cinemas than their commercial However, some titles proved popular choices across counterparts. Screenings of films in this sector are many film societies, and 30 films were programmed in venues such as village halls, mixed arts venues, by 10 or more societies. independent cinemas and the like. Seven of these films programmed by 10 or more There was a knowledge gap in the contribution of respondents in 2008/09 were British, and 15 were in community cinema until recently. In the Yearbook a foreign language. The three most programmed films 2006/07 we presented the findings of a 2006 survey, were Happy-Go-Lucky, The Kite Runner and Persepolis. Cinema for All, commissioned by the British Federation Just over half (51%, the same as in 2007/08) of all of Film Societies (BFFS). This survey looked at the size, responding organisations held special events in addition composition and geographical distribution of the to screenings in 2008/09. community cinema sector in the UK. The survey has since been repeated annually, and here we present a summary of the key findings from the 2008/09 survey. 78 – UK Film Council Statistical Yearbook 2010
  • 81.
    1 2 The average audience size in 2008/09 was 76. Film societies and community cinemas enhance film 3 The smallest audience recorded was just one admission provision in thematic or geographical areas otherwise and the largest stood at 347. The sum total of all under-served by commercial cinemas. On average, film admissions from responding organisations was 104,097. societies and community cinemas were located around 4 If this is extrapolated to all societies, the BFFS estimates nine miles from the nearest commercial cinema. that the total number of admissions in 2008/09 would Moreover, 44% operated in rural areas (with 19% in have been around 347,000. remote rural areas more than 10 miles from the nearest 5 settlement) compared with 3% of commercial screens The most commonly used format for screenings (Table 9.8). The South West was the region with the was DVD (used ‘usually’ or ‘sometimes’ by 91% of highest number of admissions, accounting for 23% responding organisations). Only 16% of responding of all admissions to film society screenings. In contrast, 6 societies still used VHS, and none of the societies the number of admissions to commercial cinemas in reported it as their usual projection format. One quarter the South West ISBA region represented 2.5% of all of the responding societies used 35mm as their usual admissions to commercial cinemas (Table 9.4). 7 projection format. The vast majority of film societies used only one venue for screenings (90%), and public buildings 8 (for example, civic centres, village or town halls) were the most common type (used by 38% of respondents). Other types of venue included theatres (used by 15% 9 of respondents), cinemas (14%), school halls or college/ university lecture theatres (11%) and mixed arts centres (8%). 10 11 12 13 14 15 16 „ 17 3F or cinema admissions and box office see Chapter 1 (page 8) 3F or a look at cinema audiences see Chapter 14 (page 110) 18 3F or employment in the exhibition sector see Chapter 21 (page 182) 3S ee www.ukfilmcouncil.org.uk/dsn for more about the UK Film Council’s Digital Screen Network, including a list of such screens by region 3F or maps showing distances from households to closest commercial and independent cinemas in the UK, 19 see www.ukfilmcouncil.org.uk/exhibition 3W ebsite for British Federation of Film Societies (BFFS): www.bffs.org.uk 20 Chapter 9: Exhibition – 79 21
  • 82.
    Chapter 10: Film onvideo Video offers audiences the Facts in focus opportunity to see films within • he combined rental and sales market for video on T physical media in 2009 was £2.39 billion, and feature months of their cinema release film on video accounted for £1.51 billion. – and of course some films are • 1 million films were rented on video in 2009 (72 million 7 in 2008) and 180 million films on video were sold released on DVD only. In 2009, (196 million in 2008). people living in the UK bought • ilm accounted for 74% of the volume of the video sales F an average of four physical market and 61% of the value. UK film had a 20% share. videos each, three of which • he most popular purchase on DVD was Harry Potter T and the Half-Blood Prince. were feature films. • nline video rental of feature films accounted for 49% O of all rental transactions of feature films in 2009.
  • 83.
    1 2 10.1 Film in the retail video market 3 ‘Video’ is used in this chapter as the generic description of all physical video formats, including DVD, UMD (Universal Media Disc), high-definition DVD (HD-DVD) and Blu-ray, in line with the British Video Association’s (BVA) definition, and does not include downloads. (For information on films rented or purchased by download, 4 see Chapters 12 and 13.) In 2009, 243 million videos were sold, down 5.4% on 2008. The total market value was £2,164 million (Figure 10.1), 5 down 10.1% on 2008. DVDs accounted for the vast bulk of video sales value (92%), while Blu-ray sales accounted for 6.4% of total sales value in 2009, compared with 2.9% in 2008. Feature film represented approximately 61% of the retail video market by value (£1,311 million) and 74% by volume. UK films accounted for around 20% of 6 sales of film on video. Figure 10.1 Retail video sales (all categories), 1999–2009 7 Million 3,000 8 2,500 2,000 9 1,500 10 1,000 500 11 0 1999 2000 2001 2002 2003 2004 2005 2006 2007 2008 2009 12 Volume (million) 96 114 135 169 208 234 222 228 249 257 243 Value (£ million) 878 1,101 1,417 1,896 2,245 2,478 2,309 2,219 2,349 2,408 2,164 Source: Screen Digest. 13 Note: Data in this table include all categories of retail video: film, TV, sport, fitness etc. The number of films sold on video more than trebled between 1999 and 2008, from 61 million units to 196 million, 14 before falling in 2009 to 180 million units (Figure 10.2). The loss of some 900 Woolworth and Zavvi stores in 2009 is likely to have had an effect on DVD film sales. As Figure 10.3 shows, the average unit price increased with the introduction of DVD in the late 1990s to reach a peak in 2002, but has since fallen back to the level of the late 15 1990s (£7.29). 16 17 18 19 20 Image: Ice Age III © 2009, Twentieth Century Fox. All rights reserved Chapter 10: Film on video – 81 21
  • 84.
    Figure 10.2 Filmon video retail sales, 1999–2009 Million 1,800 1,600 1,400 1,200 1,000 800 600 400 200 0 1999 2000 2001 2002 2003 2004 2005 2006 2007 2008 2009 Volume (million) 61 76 96 128 158 180 164 165 188 196 180 Value (£ million) 451 601 821 1,175 1,392 1,557 1,399 1,302 1,440 1,454 1,311 Source: UK Film Council RSU analysis of Official UK Charts Company and BVA data. Figure 10.3 Retail price of film per unit, 1999–2000 Price (£) 10 9 8 7 6 5 4 3 2 1 0 1999 2000 2001 2002 2003 2004 2005 2006 2007 2008 2009 Price 7.46 7.87 8.56 9.15 8.80 8.64 8.52 7.89 7.68 7.42 7.29 Source: UK Film Council RSU. Table 10.1 shows the top selling films on video in 2009. Harry Potter and the Half-Blood Prince topped the chart with more than two million copies sold. The Dark Knight appears in 2009’s top 10 as well as being the second highest selling video of 2008. Just outside this list (at number 11) is Star Trek, which was the highest selling Blu-ray disc of 2009. Sales of Blu-ray discs accounted for 3.3% of all video sales by volume in 2009, up from 1.4% in 2008. 82 – UK Film Council Statistical Yearbook 2010
  • 85.
    1 2 Table 10.1 Top 10 films on video retail, 2009 3 Title Country of origin Distributor 1 Harry Potter and the Half-Blood Prince UK/USA Warner 4 2 Quantum of Solace UK/USA 20th Century Fox 3 Twilight USA E1 Entertainment 4 Transformers: Revenge of the Fallen USA Paramount 5 5 Slumdog Millionaire UK 20th Century Fox 6 Madagascar: Escape 2 Africa USA Paramount 7 Angels and Demons USA Sony Pictures 6 8 High School Musical 3: Senior Year USA Walt Disney 9 Ice Age III USA 20th Century Fox 7 10 The Dark Knight UK/USA Warner Source: Official UK Charts Company, BVA. 8 Once again, comedy was the dominant genre of films sold on video in 2009, accounting for over 23% of the market as Figure 10.4 shows. Drama was the next most popular with 19% of all sales, followed by action/adventure with 15%. 9 Figure 10.4 Sales breakdown by film genre, 2009 % Comedy 23.3 10 Thriller 8.9 Family 11.8 11 Horror 5.6 Sci-fi 8.2 Adult 0.1 12 War 2.4 Musical 3.3 Drama 19.4 13 Western 1.1 Action/adventure 15.3 Anime 0.3 14 Documentary 0.3 Bollywood 0.0 15 Source: Official UK Charts Company, BVA. The top 10 UK performers on sell-through video in 2009 (Table 10.2) include four UK-qualifying titles which are also 16 in the overall top 10 of the year. In addition, Mamma Mia! continued to sell well in 2009 after being the top selling video of 2008 when it sold more than 5 million copies to become the highest selling DVD of all time in the UK. By the end of 2009, it had sold almost 6 million copies. In second place in the list is Quantum of Solace, which 17 was also the second highest selling Blu-ray disc of 2009. 18 19 20 Chapter 10: Film on video – 83 21
  • 86.
    Table 10.2 Top10 UK-qualifying video film retail titles, 2009 Title Country of origin Distributor 1 Harry Potter and the Half-Blood Prince UK/USA Warner 2 Quantum of Solace UK/USA 20th Century Fox 3 Slumdog Millionaire UK 20th Century Fox 4 The Dark Knight UK/USA Warner 5 Mamma Mia! UK/USA Universal Pictures 6 The Duchess UK/Fra/Ita 20th Century Fox 7 The Boy in the Striped Pyjamas UK/USA Walt Disney 8 Casino Royale UK/USA/Cze Sony Pictures 9 Rocknrolla UK/USA Warner 10 Wild Child UK/USA Universal Pictures Source: RSU analysis of Official UK Charts Company data. The list of top 10 UK independent films sold on video in 2009 is topped by Slumdog Millionaire, which was also the top grossing UK independent film at the UK box office in 2009 (Table 10.3). Biopics were also popular in 2009, with The Duchess and The Young Victoria in second and third places in the list. Table 10.3 Top 10 UK independent video film retail titles, 2009 Title Country of origin Distributor 1 Slumdog Millionaire UK 20th Century Fox 2 The Duchess UK/Fra/Ita 20th Century Fox 3 The Young Victoria UK/USA# Momentum 4 City Rats UK Revolver 5 Bronson UK E1 Entertainment 6 Adulthood UK 20th Century Fox 7 Kidulthood UK Revolver 8 Run, Fat Boy, Run UK/USA# EIV 9 The Bank Job UK/USA# Lions Gate 10 Cass UK Optimum Source: RSU analysis of Official UK Charts Company data. #The Young Victoria, Run, Fat Boy, Run and The Bank Job were made with independent (non-studio) US support. 84 – UK Film Council Statistical Yearbook 2010
  • 87.
    1 2 10.2 The relationship between film on video sales and theatrical box office takings 3 As can be seen from Table 10.1, the top selling titles on video tend to be the same as those which performed well theatrically. Looking more closely at this relationship (Figures 10.5 and 10.6) we see a positive and statistically significant association between box office and video sales. That is, the greater the gross box office for a film, the 4 more videos it is likely to sell. Table 10.4 shows the number of videos a film is likely to sell at various box office levels. For example, a film taking £5 million could be expected to sell 598,000 videos in the UK. There is considerable variation around this result. On the data studied, 80% of films taking £5 million at the UK box office would sell 5 between 199,000 and 998,000 videos. As the box office increases, the variation relative to the average gets smaller. So a film taking £50 million at the box office could be expected to sell 3.4 million videos, with a variation (for 80% of the titles) between 3.0 million and 3.8 million. The data also suggest that low to medium box office films receive 6 a greater proportion of their total revenues from video sales than do high box office ‘blockbuster’ films (see box for explanation). 7 Figure 10.5 Scatter plot and fitted lines of video sales against gross box office for all films Video sales (million) 4 8 3 9 2 10 1 11 0 0 10 20 30 40 50 All films All films, box office £1 million All films, box office £1 million 12 Source: RSU analysis of Rentrak EDI and Official UK Charts Company data. 13 14 15 16 17 18 19 20 Chapter 10: Film on video – 85 21
  • 88.
    Figure 10.6 Scatterplot and fitted lines of video sales against gross box office for UK films Video sales (million) 4 3 2 1 0 0 10 20 30 40 50 UK films UK films, box office £1 million UKfilms, box office £1 million Source: RSU analysis of Rentrak EDI and Official UK Charts Company data. Note: the scatter plot shows all the points included in Figure 10.5 but the lines were fitted using data for UK films only. Table 10.4 Average numbers of video sales for levels of gross box office UK Average number Range containing the video sales of box office of UK video sales 80% of films for the level of box office From To Low box office gross films £50,000 13,000 0 60,000 £100,000 20,000 0 67,000 £200,000 34,000 0 81,000 £500,000 75,000 27,000 122,000 £750,000 109,000 62,000 156,000 £1 million 143,000 96,000 190,000 High box office gross films £5 million 598,000 199,000 998,000 £10 million 910,000 510,000 1,310,000 £20 million 1,533,000 1,134,000 1,933,000 £50 million 3,404,000 3,004,000 3,803,000 Source: RSU analysis of Rentrak EDI and Official UK Charts Company data. 86 – UK Film Council Statistical Yearbook 2010
  • 89.
    1 2 The relationship between UK box office Figures 10.5 and 10.6 show that while there is a 3 and UK video sales positive relationship between box office and video sales there is considerable variation for individual titles. To test the relationship between the UK box office and The relationship is weakest (most variation around the UK video sales a sample of films that were released in fitted line) for low grossing films (box office gross less 4 a particular year1 around the middle of the decade was than £1 million), but even for these films the relationship taken and their gross box office takings were compared between the two variables is statistically significant. with the number of video sales achieved after five years. Further, the estimated impact of an increase in box 5 All films from the release year for which data on video office on video sales for low grossing films is greater sales were available were included in the sample. than for higher grossing films. The total number of films included was 356, and 6 78 of these were UK films. The gross box office for From the regression analyses we can estimate the the majority of the films in the sample was less than average number of video sales for a given level of box £1 million (238 of all films and 43 of the UK films). office takings but, as can be seen from Figures 10.5 7 and 10.6, there is much variation around these averages. Only films that were released theatrically are included in Table 10.4 shows the average number of video sales for this comparison (that is, no ‘straight to video’ films are different levels of box office takings, for high grossing included). Also, only sales of physical discs are included films and for low grossing films separately. Also shown 8 in the present comparison. It would be better to include is a range of video sales for each level of box office all films purchased, ie films on physical discs and films takings. These ranges have been estimated so that the purchased as downloads. However, while we have some video sales of about 80% of films with the particular 9 information on the total number of films downloaded level of box office takings lie within the range. to own, we do not have information on numbers of downloads by title for films purchased in this way There were no differences between UK films and all 10 (see Chapter 12). Also, the films included in the films in the relationship between box office takings present analysis were released some time ago, so it and video sales, and the expected increases in video is likely that only a very small percentage of the total sales for a given increase in box office are the same, 11 sales of these films would have been downloaded. except that the samples were smaller, so the ranges around the estimates are slightly wider. Analyses of the data show statistically significant positive linear relationships between gross box office Figure 10.5 also shows that many more films in the 12 and video sales (after five years). That is, the greater £5 million to £20 million box office range had video the gross box office for a film, the more videos it would sales above the fitted lines (fitted to all films’ and expect to sell. As most of the films in the sample are to high grossing films’ data) than below the lines. 13 clustered at the lower end of the box office and video This suggests that the relationship between box office sales scales, three separate lines were fitted to the data, and video sales for the ‘blockbusters’ (box office around using linear regression analysis. The first line represents £30 million or greater) is different from that of other 14 the relationship between box office and video sales for films, and that even films grossing in the £5 million to all films, the second for films which took more than £20 million range will obtain a greater proportion of £1 million at the box office and the third for films which total revenues from video sales than the blockbusters. As more of the top films are now being released in 3D 15 took less than £1 million at the box office (Figure 10.5). it is likely that in future a smaller percentage of their Similar analyses were carried out for UK films only total revenues will come from video sales (at least until (Figure 10.6) and also showed a statistically significant 3D Blu-ray discs or downloads become widely available 16 positive linear relationship. The UK films contained in and households become equipped with 3D home the sample described above were included in these viewing equipment). analyses, rather than taking a different sample of UK 17 films. The scatter plot shown in Figure 10.6 includes 1. particular year is not disclosed so as not to reveal the video sales The of individual titles, which under current arrangements are confidential the data points for all films so as not to reveal the to the companies concerned. identity of individual titles, but the lines are fitted 18 using the data for UK films only. 19 20 Chapter 10: Film on video – 87 21
  • 90.
    10.3 Film inthe video rental market Total physical video rentals totalled 79 million in 2009 (including over-the-counter and online rentals). Film on video rentals totalled 71 million, with an average value of £2.82. Online video renting (with postal delivery) now accounts for 54% of all rental transactions and 49% of film on video rental transactions in the UK. The number of feature film rental transactions in 2009 was down by 1.5 million from 2008, and the value of the physical rental market fell to £199 million from a peak of £494 million in 2001 (Figure 10.7). This is due mainly to the rapid decline of the over-the-counter rental market in the wake of competition from multi-channel television, film theft and, in particular, the availability and lower cost of retail DVDs. Figure 10.7 Film on video rental market, 2001–2009 Million 600 500 400 300 200 100 0 2001 2002 2003 2004 2005 2006 2007 2008 2009 Transactions (million) 198 182 160 158 133 110 92 72 71 Value (£ million) 494 492 457 458 390 327 280 202 199 Source: Screen Digest. The most popular genre was comedy which accounted for 27% of rentals, followed by drama and action/adventure titles (Figure 10.8). (It should be noted that these categories, as defined by Kantar Worldpanel, may differ from the genre categories assigned to the theatrical market by the RSU in Chapter 4.) Figure 10.8 Video rental share by genre, 2009 % Comedy 26.5 Drama 21.5 Thriller 7.9 Action 20.2 Horror 6.3 Sci-fi 4.2 Children’s/family 8.7 Others 4.8 Source: Kantar Worldpanel, BVA. The list of top 10 online rentals in 2009 is topped by Slumdog Millionaire, which was also one of the highest selling videos of 2009 (Table 10.5). The Dark Knight is the only other film in this list which was also in the list of top selling titles. 88 – UK Film Council Statistical Yearbook 2010
  • 91.
    1 2 Table 10.5 Top 10 online video rentals, 2009 3 Title Country of origin Distributor 1 Slumdog Millionaire UK 20th Century Fox 4 2 The Curious Case of Benjamin Button USA Warner 3 Taken Fra/USA 20th Century Fox 4 Changeling USA Universal Pictures 5 5 Burn After Reading USA Universal Pictures 6 The Reader USA/Ger EV 7 Gran Torino USA/Aus Warner 6 8 The Dark Knight UK/USA Warner 9 Seven Pounds USA Sony Pictures 7 10 Australia Aus/USA 20th Century Fox Source: BVA. Note: ‘Online rental’ refers to online ordering with postal delivery. See Glossary. 8 The list of top 10 over-the-counter rentals in 2009 shows a different pattern from the online rentals, with only three titles appearing in both lists (Table 10.6). None of the titles in the top over-the-counter rentals appears in the list of best selling videos of 2009. 9 Table 10.6 Top 10 over-the-counter video rentals, 2009 10 Title Country of origin Distributor 1 Taken Fra/USA 20th Century Fox 11 2 Knowing USA/UK E1 Entertainment 3 Gran Torino USA/Aus Warner 4 Yes Man USA Warner 12 5 Role Models USA/Ger Universal Pictures 6 He’s Just Not That Into You USA/Ger EV 13 7 The Curious Case of Benjamin Button USA Warner 8 Tropic Thunder USA Paramount 9 Defiance USA Momentum Pictures 14 10 Body of Lies USA Warner Source: BVA. 15 10.4 Hardware According to the BVA, 5.5 million DVD players were sold in 2009, taking cumulative DVD hardware sales since launch 16 to 60 million, almost one DVD player for every person in the UK. In addition, consumers increasingly have access to high-definition DVD technology through dedicated players and games consoles in particular. The BVA reports that 200,000 Blu-ray stand-alone players were sold in 2009 and Screen Digest estimates that there are more than three 17 million households in the UK with games consoles with Blu-ray capability. 18 „ 19 3F or more information about top films at the UK box office see Chapter 2 (page 15) 3F or more information about the UK film market as a whole see Chapter 13 (page 104) 20 Chapter 10: Film on video – 89 21
  • 92.
    Chapter 11: Film onUK television The number and variety of Facts in focus films broadcast on television • here were 5,973 unique film titles on television in 2009, T including 2,070 on terrestrial, 1,606 on subscription film has soared since 2000. channels and 3,283 on free-to-air film channels. Viewers had a choice of • here were 2,218 film transmissions (2,070 unique titles) T on terrestrial channels, virtually unchanged from 2008, nearly 6,000 film titles across and an average of six films per day. Of these, 487 (22%) all channels in 2009, worth were UK films, and 76 (3%) were foreign language films. approximately £1.1 billion to • n average of 1 million people watched each film on A peak-time network television (down from 1.3 million in the broadcasters. 2008), compared to median cinema audiences for the top 50 films of 2 million. • he top film on terrestrial television was Pirates of T the Caribbean: At World’s End on BBC One, with 6.4 million viewers. • here were 3.4 billion viewings of feature film across T all television formats (except pay-per-view) in 2009 – the same level as 2008 and over almost 20 times the number of cinema admissions.
  • 93.
    1 2 11.1 Programming on network channels 3 Table 11.1 shows the number of feature films broadcast on the five terrestrial network channels in 2009 and the total number of UK titles broadcast in that time. These are broken down into older titles (more than eight years old) and recent theatrical releases (released in the last eight years). Here, UK film includes all titles listed as UK-originated 4 by the Broadcasters’ Audience Research Board (BARB), plus UK co-productions given other nationalities (mostly USA) in the BARB data. 5 There were 2,218 films on terrestrial television in 2009, virtually unchanged from 2008, which represented an average of six films a day. The proportion of recent UK films remained the same at 7%. 6 Table 11.1 Feature films broadcast on network television, 2009 Recent UK Number Number UK films (ie released Recent UK of films of UK films as % theatrically as % of total 7 Channel broadcast broadcast of total since 2001) broadcast BBC One 338 63 19 43 12.7 8 BBC Two 369 119 32 35 9.5 ITV1 446 117 26 36 8.1 Channel 4 561 129 23 33 5.9 9 Five 504 59 12 7 1.4 Total 2,218 487 22 154 6.9 10 Source: Attentional, UK Film Council RSU analysis. Network television screened 76 foreign language films in 2009, 3% of the total, up from 73 in 2008 (3% of the total), as Table 11.2 shows. The top foreign language film was the Jackie Chan martial arts comedy Rumble in the 11 Bronx, with an audience of 1.2 million on BBC One. Table 11.2 Foreign language films broadcast on network television, 2009 12 Number of foreign % Average language of channel’s audience Top rated foreign Audience 13 Channel films broadcast film output (million) language film (million) BBC One 1 0.3 1.2 Rumble in the Bronx 1.2 BBC Two 25 6.8 0.1 Pinocchio 0.5 14 ITV1 3 0.7 0.1 The Children of Heaven 0.1 Channel 4 42 7.5 0.1 House of Flying Daggers 0.6 15 Five 5 1.0 0.3 Fist of Fury 0.6 Total 76 3.4 0.1 Source: UK Film Council RSU. 16 17 18 19 20 Image: Wallace Gromit: The Curse of the Were-Rabbit © Aardman Animations 2005 Chapter 11: Film on UK television – 91 21
  • 94.
    The number ofslots for feature film on network television has fluctuated since 2000, as Figure 11.1 shows with Channel 4 and Five broadcasting the most films over the last decade. Figure 11.1 Number of feature films on network television, 2000–2009 700 600 500 400 300 200 100 0 2000 2001 2002 2003 2004 2005 2006 2007 2008 2009 BBC One 320 341 351 435 434 354 369 384 381 338 BBC Two 509 514 433 451 499 426 397 447 395 369 ITV1 287 285 269 312 268 373 184 243 367 446 Channel 4 557 617 574 584 503 562 581 595 606 561 Five 619 637 641 565 527 605 496 513 472 504 Total 2,292 2,394 2,268 2,347 2,231 2,320 2,027 2,182 2,221 2,218 Source: Attentional, UK Film Council RSU. 11.2 Peak time on network television In 2009, the proportion of peak-time hours (18:00 to 23:59 hours) dedicated to feature films varied widely across the terrestrial channels. In terms of total hours, film represented 19% of programming on BBC One, 5% on BBC Two, 15% on Channel 4 and 21% on Five (Figure 11.2). ITV1’s film output more than doubled, from 9% in 2008 to 19% last year. Figure 11.2 Composition of peak-time hours, 2009 Percentage 100 90 80 70 60 50 40 30 20 10 0 BBC One BBC Two ITV1 Channel 4 Five Total Factual 14.0 47.3 14.9 40.6 25.3 28.4 Drama 19.9 6.0 31.0 13.5 28.2 19.8 Films: Cinema 18.8 4.6 19.1 14.9 20.6 15.7 News/current affairs 26.8 13.1 14.1 13.7 7.7 15.0 Entertainment 13.8 15.7 14.1 15.2 13.0 14.3 Sport 4.9 8.6 6.4 0.0 3.1 4.6 Other 1.2 4.5 0.4 1.7 0.1 1.5 Films: made for TV 0.7 0.1 0.0 0.3 2.0 0.7 Source: Attentional. 92 – UK Film Council Statistical Yearbook 2010
  • 95.
    1 2 11.3 Audiences for film on network television 3 The average audience for a film shown on peak-time network television was 1.1 million on BBC One, 800,000 on BBC Two, 1.2 million on ITV1 and 1 million on both Channel 4 and Five (Figure 11.3). Across all channels, the average audience was 1 million, down from 1.3 million in 2008. This compares with median cinema admissions 4 for the top 50 films of approximately 2 million. Of the main programme categories, film accounts for the lowest average peak-time audience on ITV1 but performs 5 relatively well on Five, as shown in Figure 11.3. Figure 11.3 Average peak-time audience, 2009 6 (000s) 7,000 6,000 7 5,000 4,000 8 3,000 2,000 9 1,000 0 BBC One BBC Two ITV1 Channel 4 Five 10 Drama 6,141 971 6,191 1,404 1,391 Entertainment 3,999 1,793 5,216 1,324 207 Factual 3,270 1,678 2,689 1,543 750 Films: Cinema 1,088 830 1,161 1,001 1,009 11 Films: made for TV 588 1,318 – 1,156 1,072 News/current affairs 4,182 770 2,581 797 797 Other 2,432 829 2,090 570 270 12 Sport 2,494 1,268 2,255 303 842 All genres 4,057 1,418 3,718 1,308 946 Source: BARB/Attentional. 13 11.4 Top films on network television 14 The most popular film on terrestrial television in 2009 was Pirates of the Caribbean: At World’s End, with 6.4 million viewers tuning in to its premiere on BBC One (Table 11.3). In theatrical audience terms, this is equivalent to a box office gross of £35 million (its actual gross was £41 million). The top 20 is dominated by recent animated family 15 films such as Shrek 2, Ice Age 2: The Meltdown and The Incredibles. 16 17 18 19 20 Chapter 11: Film on UK television – 93 21
  • 96.
    Table 11.3 Top10 films on network television, 2009 Country of Year of TV audience Title Channel origin theatrical release (million) 1 Pirates of the Caribbean: At World’s End BBC One USA 2007 6.4 2 Shrek 2 BBC One USA 2004 6.2 3 Shrek 2 BBC One USA 2004 6.0 4 Ice Age 2: The Meltdown ITV1 USA 2006 5.9 5 The Incredibles BBC One USA 2004 5.6 6 Harry Potter and the Goblet of Fire ITV1 UK/USA 2005 5.5 7 Over the Hedge BBC One USA 2006 5.0 8 Elf Channel 4 USA 2003 4.9 9 Batman Begins ITV1 UK/USA 2005 4.9 10 Pirates of the Caribbean: The Curse of the Black Pearl BBC One USA 2003 4.8 Source: Attentional, BARB. Note: Shrek 2 was broadcast twice on BBC One – on 1 January and 24 December. The top 10 UK films of 2009 (Table 11.4) included the premieres of Batman Begins, King Arthur, and The Da Vinci Code. The highest ratings were recorded for the second broadcast of Harry Potter and the Goblet of Fire on ITV1. Table 11.4 Top 10 UK-originated films on network television, 2009 Country of Year of TV audience Title Channel origin theatrical release (million) 1 Harry Potter and the Goblet of Fire ITV1 UK/USA 2005 5.5 2 Batman Begins ITV1 UK/USA 2005 4.9 3 Casino Royale ITV1 UK/USA 2006 4.8 4 King Arthur BBC One UK/USA/Ire 2004 4.8 5 Wallace Gromit: The Curse of the Were-Rabbit BBC One UK/USA 2005 4.8 6 Nanny McPhee ITV1 UK/USA 2005 4.6 7 Harry Potter and the Chamber of Secrets ITV1 UK/USA 2002 4.3 8 The Da Vinci Code Five UK/USA 2006 4.1 9 Love Actually ITV1 UK/USA 2003 3.9 10 Harry Potter and the Prisoner of Azkaban ITV1 UK/USA 2004 3.9 Source: Attentional, BARB. 94 – UK Film Council Statistical Yearbook 2010
  • 97.
    1 2 11.5 Films on multi-channel television 3 Table 11.5 shows the audience share for freeview/satellite/cable multi-channel television has continued to grow in the last few years. Multi-channel television accounted for 41% of the UK television audience in 2009, up from 39% in 2008. The biggest loss over this period was experienced by ITV1, which saw its audience share drop from 4 29% to 18%. 5 Table 11.5 Television percentage audience shares, 2000–2009 Year BBC One BBC Two ITV1 Channel 4 Five Multi-channel TV 2000 27.2 10.8 29.3 10.5 5.7 16.6 6 2001 26.9 11.1 26.7 10.0 5.8 19.6 2002 26.2 11.4 24.1 10.0 6.3 22.1 7 2003 25.6 11.0 23.7 9.4 6.5 23.6 2004 24.7 10.0 22.8 9.7 6.6 26.2 2005 23.3 9.4 21.5 9.6 6.4 29.8 8 2006 22.8 8.8 19.6 9.8 5.7 33.3 2007 22.0 8.5 19.2 8.6 5.1 36.5 9 2008 21.8 7.8 18.4 8.2 5.0 38.8 2009 20.9 7.5 17.8 7.5 4.9 41.4 Source: BARB. 10 Table 11.6 lists the number of films shown, average audience, the top film and audience for the top film, for a selection of digital channels which broadcast feature films. The ITV digital channels screened over 1,300 films in 11 2009, with an average audience of around 260,000 viewers. Charlie and the Chocolate Factory received the largest audience for a single screening on multi-channel television, with almost two million viewers on ITV2. Film4 broadcast over 2,600 films last year, averaging 133,000 viewers per film. 12 13 14 15 16 17 18 19 20 Chapter 11: Film on UK television – 95 21
  • 98.
    Table 11.6 Featurefilm on selected digital channels, 2009 Number of Average film Audience for Channel film transmissions audience Top film top film BBC Three 117 508,634 Pirates of the Caribbean: The Curse of the Black Pearl 1,361,000 BBC Four 95 112,906 Calendar Girls 620,200 Bravo 261 46,361 Apocalypto 213,600 E4 184 261,986 Independence Day 789,400 Film 24 927 3,927 The Ultimate Weapon 75,400 Film4 2,649 133,404 Night at the Museum 1,008,500 Fiver 182 153,086 The Da Vinci Code 556,400 Five USA 308 146,365 Swordfish 505,200 G.O.L.D. 157 139,643 Bruce Almighty 495,700 ITV2 – 4 1,359 260,094 Charlie and the Chocolate Factory 1,986,900 More 4 393 86,128 Battle of Britain 437,100 More 24+ 432 14,064 Prancer Returns 151,700 Movies 4 Men 5,533 5,359 A.W.O.L. Absent Without Leave 98,900 Sci Fi 566 36,396 Under Siege 2: Dark Territory 254,700 Sky 1 – 3 217 124,792 I Am Legend 909,300 Sky Arts 1 – 2 150 1,497 Last Mogul 11,300 Sunrise TV 390 4,565 Maharaja 16,500 True Movies 360 6,989 Santa Who? 54,100 Turner Classic Movies 5,105 6,893 Jack Frost 105,900 Watch 226 120,786 Hellboy 393,400 Zone Horror/Zone Thriller 1,830 10,480 Ted Bundy 73,400 Source: Attentional, BARB. The top film on free-to-air digital multi-channel (in terms of total audience across all transmissions) was Ice Age 2: The Meltdown on ITV2 with a total audience of 5.8 million from five transmissions (Table 11.7). 96 – UK Film Council Statistical Yearbook 2010
  • 99.
    1 2 Table 11.7 Top 10 feature films on free-to-air digital multi-channel television, 2009 3 Number of Country of Year of Total Title Channel transmissions origin theatrical release audience 1 Ice Age 2: The Meltdown ITV2 5 USA 2006 5,823,900 4 2 The Mummy Returns ITV2/Sci Fi 14 UK/USA 2001 4,515,300 3 The 40 Year Old Virgin ITV2 8 USA 2005 3,961,250 5 4 Charlie and the Chocolate Factory ITV2 4 UK/USA 2005 3,927,000 5 Love Actually ITV2 6 UK/USA 2003 3,656,400 6 The Fast and the Furious: Tokyo Drift ITV2 6 USA 2006 3,595,850 6 7 Bridget Jones: The Edge of Reason ITV2 6 UK/USA 2004 3,164,500 8 2 Fast 2 Furious ITV2 5 USA 2003 3,139,050 9 Total Recall ITV2 10 USA 1990 3,024,100 7 10 Ocean’s Eleven ITV2 6 USA 2004 2,940,450 Source: Attentional, BARB. 8 Table 11.8 outlines the number of films shown, average audience and top film on the UK’s premium subscription movie channels. The various Sky Movie channels broadcast a total of 1,546 films across 43,591 slots while Disney Cinemagic broadcast 1,423 films with an average audience of 23,000. The highest rated broadcast of a film on UK 9 pay-TV was Indiana Jones and the Kingdom of the Crystal Skull, with 760,100 viewers on Sky Movies Premiere. 10 Table 11.8 Feature films on premium subscription movie channels, 2009 Number of film Average film Audience Channel transmissions audience Top film for top film 11 Disney Cinemagic 1,423 23,000 Toy Story 2 207,700 Sky Movie channels 43,591 12,070 Indiana Jones and the Kingdom of the Crystal Skull 760,100 Source: Attentional, BARB. 12 The top film in terms of combined viewings on the subscription film channels in 2009 was National Treasure: Book of Secrets, which attracted a total audience of 5.4 million viewers from 184 transmissions on the Sky Movie 13 channels (Table 11.9). 14 15 16 17 18 19 20 Chapter 11: Film on UK television – 97 21
  • 100.
    Table 11.9 Top10 feature films on pay-TV film channels, 2009 Year of Number of Country theatrical Total Title Channel transmissions of origin release audience* 1 National Treasure: Book of Secrets Sky Movies 184 USA 2007 5,391,500 2 The Mummy Sky Movies 98 USA 1999 4,186,500 3 Alvin and the Chipmunks Sky Movies 73 USA 2007 3,427,600 4 Indiana Jones and the Kingdom of the Crystal Skull Sky Movies 47 USA 2007 3,357,900 5 St Trinian’s Sky Movies 70 UK 2007 3,238,600 6 Bee Movie Sky Movies 77 USA 2007 3,228,700 7 The Game Plan Sky Movies 108 USA 2007 2,951,400 8 Transformers Sky Movies 54 USA 2007 2,881,100 9 Enchanted Sky Movies 127 USA 2007 2,687,500 10 Kung Fu Panda Sky Movies 33 USA 2008 2,674,500 Source: Attentional, BARB. *Audience figures refer to total audience for all transmissions of that film across all subscription film channels in 2009. 11.6 The audience for film on all television channels, 2000–2009 In order to compare the audiences for film on television with the number of admissions to UK cinemas, we have calculated the total audience for film broadcast on UK television since 2000 (see Figure 11.4). In 2000 there were 3.5 billion viewings of film on television, compared with cinema ticket sales of 143 million. Despite the massive increase in the availability of titles with the introduction of digital television, the audience for film on television actually declined from 2003 to 2007. The number has since recovered, largely due to the impact of the digital free- to-air channels, but the number of film viewings per person has remained largely the same since 2000 when the average person watched 63 films a year on terrestrial and multi-channel television. This represents 3.4 billion television viewings per year compared with cinema admissions of 174 million. Figure 11.4 Total audience for feature film on television (except nVoD), 2000–2009 Million 4,500 4,000 3,500 3,000 2,500 2,000 1,500 1,000 500 0 2000 2001 2002 2003 2004 2005 2006 2007 2008 2009 Terrestrial 2,901 2,929 2,601 2,833 2,579 2,350 1,949 1,827 1,808 1,725 Subscription film channels 647 673 741 820 734 671 634 490 489 559 Other digital multi-channel 0 0 75 268 305 374 722 796 969 1,118 Total (million) 3,548 3,602 3,417 3,921 3,618 3,395 3,305 3,113 3,266 3,402 Source: UK Film Council RSU, Attentional, BARB. nVoD = pay-per-view. 98 – UK Film Council Statistical Yearbook 2010
  • 101.
    1 2 Figure 11.5 shows the total number of films shown on television since 2000. The steep rise in film showings 3 to 2003 has since flattened but the 69,592 total in 2009 is almost double the number shown in 2000 (38,865). The subscription film channels and digital multi-channel TV have driven this increase. In terms of unique film titles, there were 2,070 films broadcast on terrestrial, 1,606 titles on the subscription film channels and 3,283 on other 4 digital channels. Overall, 5,973 individual film titles were shown across all TV channels in 2009. Figure 11.5 The total number of film transmissions on all television channels (except nVoD), 2000–2009 5 70,000 60,000 6 50,000 40,000 7 30,000 20,000 8 10,000 0 2000 2001 2002 2003 2004 2005 2006 2007 2008 2009 9 Terrestrial 2,318 2,405 2,275 2,355 2,234 2,326 2,011 2,182 2,221 2,218 Subscription film channels 36,547 40,277 46,720 52,552 47,499 47,698 44,346 34,737 40,014 45,015 Other digital 10 multi-channel 0 0 4,573 7,900 8,821 13,144 17,998 20,765 20,274 22,359 Total 38,865 42,682 53,568 62,807 58,554 63,168 64,355 57,684 62,509 69,592 Source: UK Film Council RSU, Attentional. 11 nVoD = pay-per-view. 11.7 The value of feature film to broadcasters 12 Based on a model developed by Attentional, we have estimated the value of feature film to UK broadcasters to be approximately £1.1 billion in 2009. This figure is derived from the annual revenue per channel, that is, net advertising 13 revenue for the commercial channels, subscription revenues for the pay channels and the proportion of licence fee applied to programming on the BBC channels, multiplied by the percentage of broadcast hours for feature film. Despite the fall in advertising revenues associated with the recession, the 2009 value is slightly higher than the 14 2008 value (£1.07 billion). This is due to an increase in the number of Sky subscribers (driven by HD), an increase in peak-time film output (particularly on ITV1) and the continued rise in the number of films transmitted on the free-to-air digital channels. 15 16 17 18 „ 19 3 For cinema admissions see Chapter 1 (page 8) For an overview of the film market as a whole see Chapter 13 (page 104) 3 20 Chapter 11: Film on UK television – 99 21
  • 102.
    Chapter 12: Video onDemand Video on Demand (VoD) brings Facts in focus films direct to our television • he total Video on Demand (VoD) and near-Video on T Demand (nVoD) film market was estimated to be worth and computer screens and, £124 million in 2009, up 3% on 2008. increasingly, to our mobile • 4 million households were able to access television- 1 based VoD and nVoD in 2009 and spent an estimated devices, anytime, anywhere. £108 million on films. However, despite the number • nline film revenues increased by 156% to £15.9 million. O of UK VoD services increasing • here are now 32 internet and television-based VoD film T substantially over the last year, services available to UK consumers, a five-fold increase in two years. VoD revenues remained a small part of the film value chain.
  • 103.
    1 2 12.1 Current size of the UK market 3 The Video on Demand (VoD) market in the UK can be divided into television-based services and internet and/or mobile-based services. While cable TV and IPTV (Internet protocol TV) operators are able to offer a true-VoD service (a system which streams content in real time from a server to the viewer), the leading satellite broadcaster, BSkyB, is 4 only able to offer a near-Video on Demand (nVOD) service, where multiple channels are used to show the same film at staggered times. Around 14 million UK households were able to access VoD and nVoD films via television in 2009, up from 12.6 million in 2008. However, the value of the total television-based market declined slightly from an 5 estimated £114 million in 2008 to £108 million in 2009. Despite broadband penetration of 65% of all UK households (and 90% of UK households connected to the internet), 6 the online VoD market remained small in 2009, with estimated revenues of around £15.9 million (plus approximately £300,000 from subscription services). However, this has grown from £6.2 million in 2008 and £700,000 in 2007 due largely to the introduction of films on iTunes mid-way through 2008 and also on Xbox Live Marketplace. 7 Screen Digest estimated that the combined value of the television-based VoD and nVoD and internet-based film market was worth £124 million in 2009, roughly 3% of the total UK filmed entertainment market. It should also be noted that title-by-title data are still unavailable for this sector and we are therefore unable to 8 report statistics on the top performing titles or the market share of UK films. 12.2 Video on Demand services in the UK 9 VoD services in the UK employ four basic types of business model: • Rental VoD – one-off rental, also known as download to rent; 10 • Subscription VoD (SVoD) – unlimited access to content for a fixed monthly sum; • Retail – download-to-own (DTO) onto computer or portable device; and 11 • Free/advert-supported VoD. The number of VoD film services in the UK has grown rapidly over 2009. At the time of writing (March 2010), 12 32 VoD film services could be identified compared with 17 in March 2009. Ten of these services offered more than 1,000 film titles, compared to five in March 2009. The leading VoD providers in the UK are listed in Table 12.1. Virgin Media and Sky are the market leaders in television-based VoD and nVoD with over 13 million subscribers 13 between them. Over 3.7 million Virgin Media TV subscribers are able to access a true-VoD service. The 9.7 million Sky satellite subscribers are able to access nVoD films which can then be stored on personal video recorders (PVRs) through the Sky Anytime service. This then becomes a service with qualities similar to true-VoD. 14 BT Vision (500,000 subscribers) and TalkTalk TV (100,000 subscribers) offer major studio films as part of a true-VoD IPTV offering. For digital terrestrial television (DTT) viewers, Picturebox via Top Up TV Anytime offers a limited 15 number of titles available through a compatible PVR. iTunes has emerged as the leading internet-based VoD service, with a 55% share of the online market in 2009, according to Screen Digest. Overall, catch-up TV has been the big success story of VoD, with BBC iPlayer recording 16 120 million streams in January 2010. However, the number of feature films available on the service has been limited. 17 18 19 20 Image: Alvin and the Chipmunks 2: The Squeakquel ©2009, Twentieth Century Fox, Chapter 12: Video on Demand – 101 Monarchy Enterprises S.A.r.l. and Regency Entertainment USA, Inc. All rights reserved 21
  • 104.
    Table 12.1 LeadingVoD film services in the UK, March 2010 Service Network Catalogue Prices Content providers Business model 4oD Internet, Selection of Film4 and Rental VoD Film4, 20th Century Fox Rental VoD IPTV 20th Century Fox titles from £1.99 Apple Internet, 2000+ films £10.99 for new releases; Disney, Paramount, VoD, DTO iTunes Store iPhone/iPod (500+ in HD) £6.99 for library titles Warner Bros and (£1 extra for HD films); Lions Gate rental VoD from £2.49 The Auteurs Internet 8,500 films Free – £3.00 Independents and Streaming some major studios BabelGum Internet n/a Free (advert-supported) Independents Advert-supported streaming BBC iPlayer Internet, Varied selection of films Free (funded by BBC acquired titles Free TV and mobile broadcast on BBC TV licence fee) BlinkBox Internet 3,500 films Rental VoD All major studios Rental VoD and DTO except Disney Bollywood.tv Internet 1,000 films US$3.99 Indian distributors Rental VoD and DTO Brightwide Internet 8 films Rental VoD £2.99 Independents Rental VoD BT Vision IPTV 400 major studio films £1.99 – £3.95 per film All majors except Fox Rental VoD, SVoD Channel Films Internet 500 features Download to rent from Independents DTO, Rental, and shorts £1.99; DTO from £4.99 streaming Cinebox on Internet 1,000 films Rental VoD £2.99; Independents Rental VoD and DTO MovieMail online DTO £7.99 Coolroom Internet 500 films Rental VoD from £1.99; Major studios Rental VoD, DTO DTO from £4.99 and independents FilmIsNow.eu Internet 1,500 films €3.99–€9.99 Independents DTO and Rental VoD Filmflex via Cable TV 500 films £2.50–£3.50 for new All major studios except Rental VoD Virgin Media releases; 50p–£2.00 Fox. Independent for library titles distributors including Icon and Pathé Go! View Internet for PSP Monthly selection Rental VoD from Universal Rental VoD £2.50 per title iLoaded Internet 200 films From £5.00 for Major studios DTO library titles; £10.00 and independents for new releases IndieMoviesonline Internet 130 films Free (advert-supported) Independents Advert-supported streaming ITV Player Internet Selection of films Free (advert-supported) ITV acquired titles Advert-supported broadcast on ITV channels streaming Jaman Internet 1,000 films From £1.99 for Independent Rental VoD, DTO, rental VoD distributors Free and streaming Joiningthedocs.tv Internet 100 titles SVoD £10.00 per month; Independent VoD streaming Rental VoD £4.00 documentaries Joost Internet and iPhone 1,200 features Free (advert-supported) Paramount, Eros Advert-supported application and shorts and independents streaming Lovefilm Internet 3,500 films Rental VoD Three major studios plus Rental VoD £2.99–£3.49 independent distributors Picturebox on DTT 28 films per month; £5.00 per month Universal SVoD Top-Up TV 7 rotated weekly Playstation Store Internet/PlayStation n/a n/a n/a Rental VoD and DTO Projector.tv Internet 100+ films n/a Independents Rental VoD and DTO Samsung Movies Internet n/a Rental VoD 99p–£2.99; Independents and Rental VoD and DTO DTO £4.99–£13.99 major studios Sky Anytime Satellite/Internet TV 400 films £3.99 per film; All major VoD, nVoD (including HD) £16 per month for SVoD US studios Premium Sky Movies Sky Player Internet 400 films Subscription All major studios Streaming Talk Talk TV IPTV Over 1,000 films From £1.99–£3.49 All major studios Rental VoD, SVoD per rental 102 – UK Film Council Statistical Yearbook 2010
  • 105.
    1 2 3 Service Network Catalogue Prices Content providers Business model Tesco Internet 2,500 films £1–£20; Major studios VoD, DTO Digital New releases £9.97 4 The Vid Store Internet 100 films DTO £7.99; rental VoD Major studios Rental VoD, DTO Xbox Live Internet/IPTV 80 films (16 in HD) £2.13–£4.08 Paramount, Rental VoD Marketplace per film Warner Bros, Disney 5 Source: UK Film Council. 6 12.3 Future prospects for the VoD market Although the number of VoD services has increased markedly over the last two years, the aggregate size of the market remains small. Key factors behind the relatively modest growth of the sector remain the following – barriers 7 to delivery to the television screen, pricing and availability of titles, and download speeds. Research conducted by Ipsos Media CT in 20091 found a high level of interest in downloading newly released films 8 at the same time as the DVD release, and increasingly the VoD window is being brought forward in line with DVD release dates. Television-based nVoD is typically no later than six months after theatrical release. The same research revealed that lack of connectivity between internet and television was a key barrier to consumer 9 uptake of film VoD, so any solution which enables internet access through a main household television (via the proposed Project Canvas or similar) could well make a significant contribution to the development of this market. Other key factors to be addressed over the coming years include improving the user interface (via better menu 10 options and recommendation engines), increasing broadband speed and capacity, finding price points that work for both the industry and the consumer and increasing the size of VoD film catalogues so that a wider choice of material is available. 11 1. pportunities for digital distribution – assessing models in the music, film and games markets, Ipsos Media CT, May 2009 O 12 13 14 15 16 17 18 „ 3F or more information on film on video see Chapter 10 (page 80) 19 3F or more information on film on television see Chapter 11 (page 90) 3F or an overview of the film market as a whole see Chapter 13 (page 104) 20 Chapter 12: Video on Demand – 103 21
  • 106.
    Chapter 13: The UKfilm market as a whole New films typically Facts in focus establish their reputation in • he total filmed entertainment market in the UK in T 2009 is estimated to have been £3.7 billion, unchanged the cinema, but only a quarter from 2008. of the industry’s UK revenues • n 2009, the UK had the third-largest filmed I entertainment market in the world after the USA come from cinema exhibition. and Japan. Physical video sales and • n 2009, sell-through video on physical media was the I rentals account for 41% of the largest single revenue source for film in the UK market, accounting for 35% of total revenues. market, while film on television • n 2009, theatrical revenues and pay-TV revenues I generates significant revenue. from film and Video on Demand all recorded increases, but sell-through and rental video and free-to-air TV revenues declined.
  • 107.
    1 2 13.1 The UK filmed entertainment market as a whole 3 ‘Video’ is used in this chapter as the generic description of all physical video formats, including DVD, UMD (Universal Media Disc), high-definition DVD (HD-DVD) and Blu-ray. 4 In 2008 and 2009, physical video retail was the largest single revenue source (Table 13.1), accounting for 35% of total revenues in 2009 (£1.3 billion). Theatrical revenues increased by 11% to £944 million, while physical video rental revenues fell slightly from £202 million to £199 million. Gross television revenues increased by 4% from 5 £1,067 million to £1,108 million, thanks to film on pay-TV, though much of this accrued to the television industry rather than to the suppliers of film. The market share for UK films was highest for terrestrial television (24%) and lowest for film on pay-TV where it 6 was 16%. Table 13.1 UK filmed entertainment market, 2008 and 2009 7 Attributable to Attributable to Total gross value UK films Total gross value UK films (£ million) (£ million) (£ million) (£ million) Platform 2008 2008 2009 2009 8 Theatrical 850 261 944 160 Video rental (physical) 202 48 199 41 9 Video retail (physical) 1,454 349 1,311 275 Pay-TV 521 76 585 93 Terrestrial television 257 60 240 58 10 ‘Free’ multi-channel television 289 57 283 59 nVoD and VoD 120 29 124 26 11 Total UK 3,693 880 3,686 712 Sources: Rentrak EDI, BVA, Official Charts Company, Attentional, Screen Digest, RSU analysis. Notes: 12 ‘Theatrical’ is the total gross UK theatrical revenues (including VAT) in the calendar year 2009 for all films exhibited in the UK. See Chapter 1. ‘Video rental (physical)’ is the total revenue from physical video rental (DVD, Blu-ray, etc) transactions in the calendar years 2008 and 2009. See Chapter 10. ‘Video retail (physical)’ is the total revenue from physical video retail transactions in the calendar years 2008 and 2009. See Chapter 10. The television values are retail equivalent values calculated from the dataset of films shown on UK television. Values are estimated by multiplying the film share of the total 13 channel time by the total revenue applicable to that channel (licence fee, subscription or advertising revenue). Television values cover terrestrial, subscription and free multi-channel. See Chapter 11. An estimate for pay-per-view is included in nVoD. Video on Demand and near-Video on Demand revenues are derived from Screen Digest estimates of the combined size of the television and internet-based markets. UK share is based on an estimate derived from knowledge of UK film share in the pay-TV and video markets. The above values are gross values and include exhibitor and distributor margins, VAT, prints and advertising costs, DVD/video retail margins, broadcaster and multi-channel 14 television operator margins in addition to net returns to the film production sector and film investors. The revenues shown here are revenues earned by film in the UK market, whether UK or foreign films. The table does not include export revenues for the UK film industry. See Chapter 20 for UK film export revenues. 15 16 17 18 19 20 Image: Brighton Rock courtesy of Optimum Releasing Chapter 13: The UK film market as a whole – 105 21
  • 108.
    13.2 The UKmarket in the global context In 2009, the UK had the third-largest filmed entertainment market in the world, after the USA and Japan (Table 13.2). The USA accounted for 40% of the world market. The next biggest individual territories after the UK were France, Germany, Canada, Australia and Italy. The world filmed entertainment market is still dominated by the largest developed economies. Although the Indian market is vast in terms of admissions and both India and China have huge populations and are growing fast economically, their filmed entertainment markets still count in US dollar terms below Australia (population 22 million) and Italy (population 60 million). Table 13.2 Filmed entertainment revenues by country/region, US$ million, 2009 Revenue in Percentage Country/region US$ million of total USA 34,431 40.4 Japan 11,061 13.0 UK 5,599 6.6 Other Western Europe 5,151 6.1 France 3,763 4.4 Germany 3,646 4.3 Canada 3,330 3.9 Other Asia Pacific 2,681 3.1 Australia 2,562 3.0 Latin America 2,431 2.9 Italy 2,087 2.5 Central and Eastern Europe 1,982 2.3 India 1,899 2.2 Spain 1,688 2.0 South Korea 1,275 1.5 China 1,206 1.4 Middle East and Africa 345 0.4 Total 85,137 100.0 Source: PricewaterhouseCoopers, Global Entertainment and Media Outlook 2010–2014, June 2010 Note: ‘Filmed entertainment revenue’ includes box office receipts, home DVD/video (rental and retail) and online download and streaming revenues. It does not include TV revenues. According to PricewaterhouseCoopers, the situation is forecast to change by 2014 (Table 13.3), with India becoming the eighth-largest individual territory, ahead of Italy and Spain. The USA is forecast to remain the largest single film territory (by a factor of three). The value of the Chinese market is expected to double, with China’s forecast share of the global filmed entertainment market increasing to 2.4%. 106 – UK Film Council Statistical Yearbook 2010
  • 109.
    1 2 Table 13.3 Filmed entertainment revenues by country/region, US$ million, forecast for 2014 3 Revenue in Percentage Country/region US$ million of total USA 41,162 38.3 4 Japan 15,053 14.0 UK 7,159 6.7 5 Other Western Europe 6,024 5.6 France 4,483 4.2 Germany 4,411 4.1 6 Canada 4,139 3.8 Australia 3,417 3.2 India 3,400 3.2 7 Other Asia Pacific 3,255 3.0 Latin America 3,129 2.9 8 Central and Eastern Europe 2,872 2.7 China 2,549 2.4 Italy 2,527 2.3 9 Spain 1,935 1.8 South Korea 1,592 1.5 10 Middle East and Africa 424 0.4 Total 107,531 100.0 Source: PricewaterhouseCoopers, Global Entertainment and Media Outlook 2010–2014, June 2010. 11 Notes: ‘Filmed entertainment revenue’ includes box office receipts, home DVD/video (rental and retail) and online download and streaming revenues. It does not include TV revenues. Forecasts are in nominal US dollars at the average 2009 exchange rate and therefore do not estimate the impact of any changes in exchange rates between 2009 and 2014. 12 13.3 The evolution of UK film revenues, 1998–2009 13 After strong growth in the early 2000s, aggregate film revenues fell in 2005 and 2006 (Figure 13.1). The chart shows a resumption of growth in 2007, as a result of increases in theatrical revenues and film on retail video. Since then, revenues have stabilised, with growth in the theatrical and pay-TV markets compensating for a decline in the physical rental and retail video markets. The VoD and nVoD markets remain a small component of the overall 14 film value chain. 15 16 17 18 19 20 Chapter 13: The UK film market as a whole – 107 21
  • 110.
    Figure 13.1 Grossfilm revenues, all platforms, 1998–2009 £ million 4,500 4,000 3,500 3,000 2,500 2,000 1,500 1,000 500 0 1998 1999 2000 2001 2002 2003 2004 2005 2006 2007 2008 2009 Theatrical 547 563 583 645 755 742 770 770 762 821 850 944 Rental video (physical) 437 408 444 494 492 457 458 390 327 280 202 199 Retail video (physical) 453 451 601 821 1,175 1,392 1,557 1,399 1,302 1,440 1,454 1,311 Film on television 726 755 826 954 1,066 1,182 1,119 1,089 1,066 994 1,067 1,108 Film on VoD 17 19 32 44 49 58 60 64 72 92 119 124 Total 2,180 2,196 2,486 2,958 3,537 3,830 3,964 3,712 3,528 3,627 3,692 3,686 Source: Rentrak EDI, MRIB, BVA, Official Charts Company, Attentional, Screen Digest, RSU analysis. Notes: ‘Film on television’ covers terrestrial, subscription and free multi-channel. TV-based nVoD and VoD are included within the VoD total. Retail video values for 2007 and earlier years have been re-estimated on the basis of improved title-by-title video retail value data that became available in 2008. Rental video values are now based on Screen Digest data. The revenues shown in Figure 13.1 are the actual figures. If adjusted for inflation using the recreational and cultural services price index (Figure 13.2), the decline in revenues in 2005 and 2006 is more marked. Real revenues in 2006 were 18% below the level of 2004. Real revenues dropped marginally between 2006 and 2008, with a 4% decline in 2009. Figure 13.2 Gross inflation-adjusted film revenues, all platforms, 1998–2009, expressed in 2005 pounds £ million in 2005 pounds 4,500 4,000 3,500 3,000 2,500 2,000 1,500 1,000 500 0 1998 1999 2000 2001 2002 2003 2004 2005 2006 2007 2008 2009 Theatrical 688.9 687.4 695.7 752.6 829.7 788.5 798.8 770.0 728.5 754.6 758.3 811.0 Rental video (physical) 550.4 498.2 529.8 576.4 540.7 485.7 475.1 390.0 312.6 257.4 180.2 171.0 Retail video (physical) 570.5 551.1 717.7 957.9 1,291.4 1,478.9 1,615.1 1,399.1 1,244.3 1,323.6 1,297.1 1,126.3 Film on television 914.4 921.9 985.7 1,113.2 1,171.4 1,256.1 1,160.8 1,089.0 1,019.1 913.6 951.8 951.9 Film on VoD 21.4 23.2 37.9 51.5 53.5 61.2 62.1 63.8 68.6 84.7 106.5 106.5 Total 2,746.0 2,682.0 2,967.0 3,452.0 3,887.0 4,070.0 4,112.0 3,712.0 3,373.0 3,334.0 3,294.0 3,167.0 Source: Rentrak EDI, MRIB, BVA, Official Charts Company, Attentional, ONS, Screen Digest, RSU analysis. Notes: Actual revenues deflated by the UK recreational and cultural services price index, using the year to December 2005 as the base. ‘Film on television’ covers terrestrial, subscription and free multi-channel. Television-based nVoD and VoD are included in the VoD total. Rental video values are now based on Screen Digest data. 108 – UK Film Council Statistical Yearbook 2010
  • 111.
    1 2 Previous UK Film Council research has identified film theft and competition from new media entertainments as two 3 factors influencing the revenue decline in 2005 and 2006 (see 2006/07 Statistical Yearbook, Chapter 13). In 2009, the theatrical market was boosted by several high grossing 3D releases while HD TV was seen as the key driver of growth in the pay-TV sector. 4 13.4 The impact of recession 5 There are two ways recession might influence the film industry – by affecting the demand for filmed entertainment and, on the supply side, by diminishing the availability of film finance. On the demand side, there is evidence that the theatrical film market is recession resistant. In each of the UK 6 recessions of 1974–76, 1980–82 and 1990–92 cinema admissions stayed close to the long-term trend of the period in question. UK cinema ticket sales increased by 6% in 2009 (Figure 13.3), despite the sharpest recession since the Second World War. This growth has been attributed to several factors – a good selection of films coming to market, 7 the success of 3D and a substitution effect as people scaled back expenditure on expensive consumer durables and foreign travel in favour of cinema entertainment. 8 Figure 13.3 UK cinema admissions, 1970–2009 Millions 200 R1 R2 R3 R4 9 150 10 11 100 12 50 1970 1975 1980 1985 1990 1995 2000 2005 2010 Cinema admissions Cinema admissions trend 13 Source: CAA, UK Film Council RSU. Note: R1 to R4 = Recession periods 1 to 4. 14 However, the ‘credit crunch’ of 2008/09 is reported to have had an impact on film financing. Hollywood experienced a decline in some of its sources of financing (eg hedge fund money) and the UK independent sector found it harder to raise finance for film production. Judging by UK production data (see Chapter 16) financing challenges have 15 exerted downward pressure on UK independent film budgets but have not affected the flow of US studio product. It is unlikely, therefore, that the overall size of the film market will be negatively affected. The main uncertainties are film quality and the pace of the digital revolution. 3D films were the big success story of 16 2009 and the 3D roll-out continues in 2010. Film revenues depend on a relatively small number of hits, so if the right creative choices are made, the theatrical market should continue to grow. Regarding video, the physical market is clearly experiencing downward pressure on both prices and volume. The main 17 question is how fast Video on Demand and its competitor, film theft, will develop. If moves to limit film theft prove a success, we will hopefully see a large new legal Video on Demand market develop over the next few years. 18 „ 19 3F or information on the export revenues of the UK film industry, see Chapter 20 (page 171) 3F or more information on the Video on Demand market, see Chapter 12 (page 100) 20 Chapter 13: The UK film market as a whole – 109 21
  • 112.
    Chapter 14: Audiences Watching filmsis one of Facts in focus the UK’s favourite pastimes. • n 2009, 60% of the UK population said they went to I the cinema at least once a year, the same percentage On average almost seven films as 2008. are seen per person per month, • 8% went to the cinema once a month or more. 1 either in the cinema, on video • he cinema audience for the top 20 films in 2009 was T predominantly young, with the 7–34 age group (40% or television, or increasingly of the population) making up 64% of the audience. online and via portable devices. • inority ethnic groups were equally or over-represented M Age, gender, ethnicity and socio- in the film audience, except for viewing pay-per-view films where they were under-represented. economic status influence film • isabled people were under-represented in the D preferences and the tendency film audience. to watch films at home or • otal ‘film viewing occasions’ numbered over 4.5 billion, T which means an average of 81 film viewings per person on the big screen – and to in 2009. download films illicitly.
  • 113.
    1 2 14.1 Cinema audience by gender 3 Six out of 10 of us went to the cinema at least once in 2009, the same level as 2008. Almost one person in five, 18% (18% in 2008), went to the cinema once a month or more (Table 14.1). 4 The overall UK cinema audience in 2009 was evenly split between male and female, in contrast to the slight female bias reported in 2008 due largely to the success of Mamma Mia! and Sex and the City (Table 14.2). 5 Table 14.1 Frequency of cinema visits by gender, 2009 Male % Female % Overall % 6 Go to the cinema at least once per year (proportion of population 7+) 60 61 60 Go to the cinema at least once a month (proportion of population 7+) 19 17 18 Source: CAA Film Monitor Jan–Dec 2009. 7 Table 14.2 Cinema audience by gender 2009 8 2008 2009 Male % Female % Male % Female % Top 20 films (proportion of audience) 49 51 51 49 9 Top UK films (proportion of audience)* 46 54 49 51 Total survey population 7+ 49 51 50 50 10 Source: CAA Film Monitor. Notes: *Audience data were only available for 17 of the top 20 UK films released in 2009. ‘Audience’ in this table and throughout this chapter refers to film-going occasions. That is, if a person went to the cinema to see 10 films in 2009, that person would have 11 contributed 10 film-going occasions to the audience figures above, unless otherwise stated. Repeat visits to the same films are not recorded in CAA Film Monitor. CAA Film Monitor included 115 film titles (mostly popular) of the 503 theatrical releases in 2009. These 115 film titles accounted for 80% of the gross box office of the UK and Republic of Ireland of the year. Film Monitor results are derived from a weekly nationally representative sample survey of 2,000 adults aged 15+ across Great Britain, conducted for the CAA by BMRB. 12 14.2 Film preferences by gender 13 Although the overall cinema audience in 2009 was split almost evenly between men and women, some films attracted substantially more of one gender than the other (Table 14.3). Men preferred action (Terminator Salvation, X-Men Origins: Wolverine), comedy (Brüno, Lesbian Vampire Killers), and science fiction (Avatar, Star Trek). Comedy 14 (Marley Me), romance/fantasy (The Twilight Saga: New Moon) and animation (A Christmas Carol) figured highly in the list of films with large female audience shares (Table 14.3). 15 16 17 18 19 20 Image: The Imaginarium of Dr Parnassus courtesy of Lions Gate Films Chapter 14: Audiences – 111 21
  • 114.
    Table 14.3 Audiencegender split of top performing films released in the UK and Republic of Ireland, 2009 Top 20 films and top UK films Greater female audience share Male % Female % Marley Me 22 78 The Twilight Saga: New Moon 34 66 A Christmas Carol 39 61 Greater male audience share Male % Female % Terminator Salvation 72 28 Brüno 67 33 Planet 51 (UK) 67 33 Lesbian Vampire Killers (UK) 67 33 X-Men Origins: Wolverine 66 34 Avatar 65 35 The Imaginarium of Dr Parnassus (UK) 64 36 Star Trek 62 38 Gender difference not statistically significant Male % Female % Dorian Gray (UK) 51 49 Slumdog Millionaire (UK) 50 50 G-Force 49 51 Angels and Demons 49 51 Alvin and the Chipmunks 2: The Squeakquel 48 52 Bolt 48 52 Harry Potter and the Half-Blood Prince (UK) 48 52 Up 48 52 Source: CAA Film Monitor. Note: Audience demographic data were available for 17 of the top 20 UK films released in 2009. 14.3 Cinema audience by age Teenagers and young adults were the most frequent cinema-goers in 2009 (Table 14.4), a pattern common to previous years. The 40% of the population in the 7–34 age group provided 64% of the top 20 film audience and 53% of the top UK film audience (Table 14.5). Table 14.4 Frequency of cinema visits by age group, 2009 Age 7–14 % Age 15–24 % Age 25–34 % Age 35–44 % Age 45–54 % Age 55+ % Overall % Go to the cinema at least once per year (proportion of population 7+) 88  81 67 66 58 35 60 Go to the cinema at least once a month (proportion of population 7+) 32 40 21 15 11 6 18 Source: CAA Film Monitor. 112 – UK Film Council Statistical Yearbook 2010
  • 115.
    1 2 Table 14.5 Cinema audience by age group, 2009 3 Age 7–14 % Age 15–24 % Age 25–34 % Age 35–44 % Age 45–54 % Age 55+ % Total % Top 20 films (proportion of audience) 22 25 17 18 10 8 100 4 Top UK films (proportion of audience) 15 23 15 19 14 15 100 Total survey population aged 7+ 11 14 15 17 14 30 100 Source: CAA Film Monitor. 5 Totals may not sum to 100 due to rounding. See notes to Table 14.2. Table 14.6 Cinema audience by gender and age group, 2009 6 Age 7–14 % Age 15–24 % Age 25–34 % Age 35–44 % Age 45–54 % Age 55+ % Total % Male 9 15 11 8 4 3 50 7 Female 9 16 7 8 5 5 50 Total 18 31 18 16 9 8 100 8 Source: CAA Film Monitor. Note: Figures include audiences for 115 film titles (mostly high grossing) of the 503 theatrical releases in 2009. These 115 film titles accounted for 80% of the gross box office of the UK and Republic of Ireland for the year. Figure 14.1 shows the age trends of cinema-goers from 1997 to 2009. The proportion of people aged 35 or above 9 going to the cinema increased gradually at the expense of younger cinema-goers from 1997 to 2008. However, last year saw an increase in the number of 25- to 44-year-old cinema-goers at the expense of the over 45s which may reflect the number of animated family films in the top 20 last year and also the absence of a major hit with particular 10 appeal to the over 45 audience, as was the case with Mamma Mia! in 2008. Figure 14.1 Age distribution of cinema-goers, 1997 to 2009 11 % 100 90 12 80 70 60 13 50 40 30 14 20 10 0 1997 1998 1999 2000 2001 2002 2003 2004 2005 2006 2007 2008 2009 15 15–24 43 40 39 40 36 35 36 30 38 38 34 36 35 25–34 29 29 29 27 25 27 26 27 19 21 20 18 21 34–44 14 16 15 17 20 20 16 18 18 17 19 16 18 16 45+ 14 15 17 16 19 18 22 25 25 24 27 30 25 Source: CAA, National Readership Survey (NRS), CAA Film Monitor. Note: Cinema-goers are defined as those who reported to have ‘ever gone’ the cinema in the surveys. Figures for any given year may have included audiences for a small number of titles released in the latter part of the previous year. 17 18 19 20 Chapter 14: Audiences – 113 21
  • 116.
    14.4 Film preferencesby age Animations, comedies and family films such as Bolt, G-Force, Planet 51 and Up appealed to the 7–14 audience (Table 14.7). Action, comedies and romance/fantasy films appealed to the 15–24 age group (Table 14.8). Brüno and Avatar were of particular appeal to the 25–34 audience (Table 14.9). Besides Dorian Gray, family animated features appealed to the 35–44 audience (Table 14.10), some of whom would be parents accompanying their children. UK-produced Last Chance Harvey and The Boat That Rocked attracted a greater proportion of cinema-goers in the 45–54 age group (Table 14.11). UK films continued to appeal strongly to the over 55 audience (Table 14.12) with The Young Victoria, Last Chance Harvey, Dorian Gray and Slumdog Millionaire all featuring in the list. Table 14.7 Films with an above-average audience in 7–14 age group, 2009 top 20 films and top UK films Title Age group % of the film’s total audience G-Force 47 Bolt 41 Planet 51 (UK) 39 Up 38 Marley Me 37 Fantastic Mr. Fox (UK) 36 Monsters vs. Aliens 36 Alvin and the Chipmunks 2: The Squeakquel 34 Night at the Museum 2 33 Ice Age III 33 7–14 age group in top 20 and top UK audience (%) 22 7–14 age group in total survey population (%) 11 Source: CAA Film Monitor. Table 14.8 Films with an above-average audience in 15–24 age group, 2009 top 20 films and top UK films Title Age group % of the film’s total audience Brüno 60 The Hangover 55 Fast Furious 48 The Boat That Rocked (UK) 48 Lesbian Vampire Killers (UK) 47 The Twilight Saga: New Moon 45 Transformers: Revenge of the Fallen 38 Terminator Salvation 36 X-Men Origins: Wolverine 35 The Imaginarium of Dr Parnassus (UK) 35 15–24 age group in top 20 and top UK audience (%) 25 15–24 age group in total survey population (%) 14 Source: CAA Film Monitor. 114 – UK Film Council Statistical Yearbook 2010
  • 117.
    1 2 Table 14.9 Films with an above-average audience in 25–34 age group, 2009 top 20 films and top UK films 3 Title Age group % of the film’s total audience Brüno 29 4 Avatar 27 25–34 age group in top 20 and top UK audience (%) 17 25–34 age group in total survey population (%) 15 5 Source: CAA Film Monitor. 6 Table 14.10 Films with an above-average audience in 35–44 age group, 2009 top 20 films and top UK films Title Age group % of the film’s total audience Dorian Gray (UK) 31 7 Monsters vs. Aliens 28 Planet 51 (UK) 27 8 35–44 age group in top 20 and top UK audience (%) 18 35–44 age group in total survey population (%) 17 Source: CAA Film Monitor. 9 Table 14.11 Films with an above-average audience in 45–54 age group, 2009 top 20 films and top UK films 10 Title Age group % of the film’s total audience Last Chance Harvey (UK) 17 The Boat That Rocked (UK) 16 11 45–54 age group in top 20 and top UK audience (%) 10 45–54 age group in total survey population (%) 14 12 Source: CAA Film Monitor. 13 Table 14.12 Films with an above-average audience in 55+ age group, 2009 top 20 films and top UK films Title Age group % of the film’s total audience The Young Victoria (UK) 49 14 Last Chance Harvey (UK) 40 Dorian Gray (UK) 20 15 Slumdog Millionaire (UK) 20 55+ age group in top 20 and top UK audience (%) 8 55+ age group in total survey population (%) 30 16 Source: CAA Film Monitor. 17 14.5 Cinema audience by social group The cinema audience for both the top 20 films and top UK films had a higher incidence of people in professional and higher-skilled manual occupations than in the population as a whole (Tables 14.13 and 14.14). 18 19 20 Chapter 14: Audiences – 115 21
  • 118.
    Table 14.13 Frequencyof cinema visits by social group, 2009 AB % C1 % C2 % DE % Overall % Go to the cinema at least once per year (proportion of population 7+) 73 65 57 46 60 Go to the cinema at least once a month (proportion of population 7+) 21 21 15 13 18 Source: CAA Film Monitor. Table 14.14 Cinema audience by social group, 2009 AB % C1 % C2 % DE % Total % Top 20 films (proportion of audience) 29 34 19 19 100 Top UK films (proportion of audience) 34 35 16 15 100 Total survey population 7+ 25 29 21 25 100 Source: CAA Film Monitor. Notes: AB: Professional, business and white collar, C1: Higher-skilled manual, C2: Lower-skilled manual, DE: ‘Semi-’ and ‘Un-skilled’ manual. Percentages may not add to 100 due to rounding. 14.6 Film preferences by social group Four films including UK biopic The Young Victoria had a strong appeal to the AB audience in 2009 (Table 14.15). Three films Planet 51, Marley Me and Monsters vs. Aliens appealed to the DE audience (Table 14.16), while only one film was found to have a significantly strong appeal to the C1 audience group, which was Lesbian Vampire Killers (54% of total audience). Table 14.15 Films with above-average AB audience share, 2009 top 20 films and top UK films Title AB group % of film’s total audience The Young Victoria (UK) 58 Last Chance Harvey (UK) 43 The Boat That Rocked (UK) 42 Star Trek 40 AB share of top 20 and top UK audience (%) 30 AB in total survey population (%) 25 Source: CAA Film Monitor. Table 14.16 Films with above-average DE audience share, 2009 top 20 films and top UK films Title DE group % of film’s total audience Planet 51 (UK) 41 Marley Me 29 Monsters vs. Aliens 27 DE share of top 20 and top UK audience (%) 18 DE in total survey population (%) 25 Source: CAA Film Monitor. 116 – UK Film Council Statistical Yearbook 2010
  • 119.
    1 2 14.7 Film audiences by ethnicity 3 According to a survey of 15,000 people by Kantar Worldpanel, minority ethnic groups were over-represented among buyers of cinema tickets and rental and sell-through video but were under-represented among viewers of pay-per- view (PPV) (Table 14.17). For reference, the size of each of these markets as measured in the Kantar Worldpanel 4 survey is shown in Table 14.18. 5 Table 14.17 Ethnicity of audiences aged 12+ for cinema, rental and retail video, PPV, 2009 Black, Asian, Chinese, mixed and other % White % 6 Population aged 12+ 6.8 93.2 Buyers of cinema, rental, retail and PPV film 7.3 92.7 7 Cinema-goers 7.5 92.5 Video buyers 7.4 92.6 Video renters 7.6 92.4 8 PPV buyers 5.1 94.9 Source: Kantar Worldpanel. Notes: 9 Fieldwork took place in July 2009. Purchase data for 52 weeks ending 3 January 2010. ‘Video’ includes all physical video formats, including DVD, UMD (Universal Media Disc), high-definition DVD (HD-DVD) and Blu-ray. 10 Table 14.18 Size of cinema, rental, retail and PPV markets for 12+ age groups, 2009 Market Number of volume 11 persons/ (individual buyers purchases, (million) million) Population aged 12+ 48.7 n/a 12 Total buyers: cinema, rental, retail and PPV film 34.1 523.3 Cinema-goers 24.0 190.2 13 Video buyers 24.4 226.2 Video renters 8.9 96.2 PPV 2.9 10.8 14 Source: Kantar Worldpanel. See notes to Table 14.17. 15 16 17 18 19 20 Chapter 14: Audiences – 117 21
  • 120.
    14.8 Film audiencesby disability As in the previous five years, disabled people were under-represented among those who paid to watch films. Pay-per-view was the only market segment in which disabled purchasers came close to their overall population percentage (Table 14.19). The share of audiences with disabilities across all markets was up from 12% in 2008 to 16% in 2009. Table 14.19 Disabled audiences aged 12+ for cinema, rental and retail video, PPV, 2009 Disabled % Not disabled % Population aged 12+ 15.8 84.2 Buyers of cinema, rental, retail and PPV film 12.8 87.2 Cinema-goers 12.1 87.9 Video buyers 11.5 88.5 Video renters 13.8 86.2 PPV buyers 14.8 85.2 Source: Kantar Worldpanel. See notes to Table 14.17. 14.9 Film preferences by nation or region The national/regional distribution of audiences for most top 20 and top UK films was close to that of the top 20 audience as a whole. Seven titles had unusually high audience shares in particular nations or regions: X-Men Origins: Wolverine and Slumdog Millionaire in London (Table 14.20), Marley Me and Planet 51 in the South East (Table 14.21), Last Chance Harvey and Nativity in the Midlands (Table 14.22) and The Hangover in Scotland (Tale 14.23). Table 14.20 Films with above-average London audience share, 2009 top 20 films and top UK films London % Title of film’s total audience X-Men Origins: Wolverine 33 Slumdog Millionaire (UK) 32 London share of top 20 and top UK audience (%) 23 London percentage of total survey population (%) 24 Source: CAA Film Monitor. 118 – UK Film Council Statistical Yearbook 2010
  • 121.
    1 2 Table 14.21 Films with above-average South East audience share, 2009 top 20 films and top UK films 3 South East % Title of film’s total audience Marley Me 29 4 Planet 51 (UK) 28 South East share of top 20 and top UK audience (%) 17 5 South East percentage of total survey population (%) 17 Source: CAA Film Monitor. 6 Table 14.22 Films with above-average Midlands audience share, 2009 top 20 films and top UK films Midlands % Title of film’s total audience 7 Last Chance Harvey (UK) 32 Nativity (UK) 30 8 Midlands share of top 20 and top UK audience (%) 16 Midlands percentage of total survey population (%) 15 Source: CAA Film Monitor. 9 Table 14.23 Films with above-average Scotland audience share, 2009 top 20 films and top UK films 10 Scotland % Title of film’s total audience The Hangover 30 11 Scotland share of top 20 and top UK audience (%) 9 Scotland percentage of total survey population (%) 10 12 Source: CAA Film Monitor. 14.10 Film downloads 13 In 2009, the Cinema Advertising Association (CAA) continued to commission an annual online survey of 3,500 people who had been to the cinema in the six months prior to the survey. Known as FAME (Film Audience Measurement 14 and Evaluation), the survey included questions about film downloads from the Internet. The age breakdown of respondents who regularly or occasionally watched downloaded or shared films is shown in Figure 14.2. One in three 15- to 24-year-olds surveyed said they regularly or occasionally watched downloaded/ 15 shared films. This declined to one in four of the 25–34 age group. In total, just 5% of respondents claimed to be regular viewers of downloaded or shared film files. 16 17 18 19 20 Chapter 14: Audiences – 119 21
  • 122.
    Figure 14.2 Frequencyof cinema-goers watching downloaded/shared films by age, 2009 % 35.0 30.0 25.0 20.0 15.0 10.0 5.0 0.0 7–14 15–24 25–34 35–44 45–54 55+ Total % who regularly watch downloaded or shared films 2.5 11.3 10.1 3.5 0.8 0.3 5.1 % who occasionally watch downloaded or shared films 3.9 18.8 15.2 5.0 4.2 1.2 8.5 Source: FAME 2010. Note: Figures refer to the cinema-going audience only, not the total population. A smaller proportion of respondents (4.5%) claimed to be regular viewers of films shared via internet discussion boards and forums. Again, the most active age category was the 15–24 group followed by the 25–34 group (Figure 14.3). Figure 14.3 Frequency of cinema-goers watching movies via link on discussion board/forum by age, 2009 % 25.0 20.0 15.0 10.0 5.0 0.0 7–14 15–24 25–34 35–44 45–54 55+ Total % who regularly watch films via link on discussion board/forum 3.1 12.1 8.0 1.7 0.1 0.1 4.5 % who occasionally watch films via link on discussion board/forum 2.6 11.1 13.3 3.9 2.3 0.5 6.1 Source: FAME 2010. See note to Figure 14.2. 120 – UK Film Council Statistical Yearbook 2010
  • 123.
    1 2 When respondents were asked about frequency of viewing films downloaded from authorised sources, the figures 3 drop further to 2% who regularly watch and 6% who occasionally watch, which suggests that a high proportion of reported film downloading is from illicit sources (Figure 14.4). Again, the most active age groups are the 25–34 range (almost 14% regularly or occasionally watch films downloaded from authorised sources) and 15- to 24-year- 4 olds (13% regularly or occasionally watch). Figure 14.4 Frequency of cinema-goers watching films downloaded from authorised sources by age, 2009 5 % 16.0 14.0 6 12.0 10.0 7 8.0 6.0 4.0 8 2.0 0.0 7–14 15–24 25–34 35–44 45–54 55+ 9 % regularly watch 1.4 4.7 3.3 1.5 0.6 0.3 % occasionally watch 4.5 8.1 10.4 5.2 4.1 1.6 10 Source: FAME 2010. See note to Figure 14.2. 11 14.11 Comparative profiles of cinema audiences and audiences for film on television Table 14.24 compares the audience profiles for film at the cinema and film on television. Although the gender split is roughly equal in each case, there is a dramatic difference in the age and social group profiles of the two audiences. 12 The film on television audience is much older (40% over the age of 55) and skewed towards the DE social group and away from the AB group. The cinema audience is relatively youthful (67% under the age of 35) and skewed towards the AB and C1 social groups. Given the 3.5 billion size of the audience for film on television (Chapter 11), Table 14.24 13 demonstrates how film reaches all ages and social groups through its successive release windows. 14 15 16 17 18 19 20 Chapter 14: Audiences – 121 21
  • 124.
    Table 14.24 Profileof cinema audience and audience for film on television, 2009 Cinema audience Share of audience for share % film on television % Male 50 49 Female 50 51 Age 7–14 (cinema) and 4–15 (TV) 18 7 15–24 (cinema) and 16–24 (TV) 31 8 25–34 18 11 35–44 16 16 45–54 9 18 55+ 8 40 AB 29 16 C1 34 24 C2 18 21 DE 19 39 Source: Attentional, CAA Film Monitor, RSU analysis. Note: Television audience is total viewing occasions and includes those of the five terrestrial TV channels only. 14.12 Cinema-goers’ preferences by age for cinema, DVD and television Table 14.25 shows the frequency with which cinema-goers visited the cinema as compared with watching television and videos. The results shown here are based on the FAME 2010 online survey whose respondents had all been to the cinema in the six months prior to the survey. Just over three-quarters (76%) of respondents watch DVDs or Blu-rays once a month or more, with 7- to 14-year-olds the heaviest consumers. Television viewing is skewed to an older audience, with 79% of the over 55s watching 15 hours or more per week. Table 14.25 Frequency by age of cinema-goers watching DVDs and Blu-ray, going to the cinema and watching television, 2009 Age 7–14 % 15–24 % 25–34 % 35–44 % 45–54 % 55+ % Total % Watch DVD or Blu-ray once a month or more 87 83 77 79 71 59 76 Watch DVD or Blu-ray once a week or more 57 50 46 40 29 23 42 Go to cinema once a month or more 54 63 54 36 34 34 47 Go to cinema once a week or more 6 14 12 3 2 3 7 Watch TV 35 hours or more per week 13 23 22 19 16 23 19 Watch TV 15 hours or more per week 69 61 67 70 74 79 69 Source: CAA Film Audience Measurement and Evaluation (FAME) 2010. Note: The figures in Table 14.25 are based on the online panel survey FAME which represents the UK online population aged 15 or above who had been to the cinema in the previous six months. Hence, the figures in this table are not the same as those for the whole UK population shown in Table 14.1. 122 – UK Film Council Statistical Yearbook 2010
  • 125.
    1 2 14.13 Total size of film audience in the UK 3 The total size of the film audience in the UK in 2009 was estimated to be 4.5 billion, calculated from all the sources available (Table 14.27). Television accounted for 75% of the total film audience, followed by video (20%) and cinema at 4%. Film watching via pay-per-view or other Video on Demand formats represented a small fraction of the total 4 audience in the year (1%). The figures do not include watching film from illicit sources. 5 Table 14.26 Estimated total audience for film in the UK, all modes, 2009 Audience size % of total film Mode (million) audience 6 Cinema 173 4 DVD/video 930 20 VoD (including pay-per-view) 41 1 7 Film on television 3,402 75 Total 4,546 100 8 Sources: CAA, Rentrak EDI, FAME, Kantar Worldpanel, Screen Digest, Attentional, RSU analysis. Notes: ‘DVD/video’ includes occasions watching previously-purchased feature film DVD/videos as well as current purchases. The DVD/video estimate is derived from FAME survey information on the DVD-watching habits of cinema-goers with an additional estimate for the population not covered by FAME. 9 ‘Film on television’ includes terrestrial, subscription and free-to-air multi-channel. Taking the total film viewing figure of 4.5 billion occasions and dividing it by an estimated viewing population (excluding the very young), there were 81 film viewing occasions per person in 2009, an average of just under 10 seven films per month. 11 12 13 14 15 16 17 „ 18 3F or more information about top films at the box office in 2009 see Chapter 2 (page 15) 3F or further details about film on video see Chapter 10 (page 80) 19 3F or further information about film on television see Chapter 11 (page 90) 3F or more information about film exhibition regionally see Chapter 9 (page 65) 20 Chapter 14: Audiences – 123 21
  • 126.
    Chapter 15: Films certifiedas British 1998 – 2009 To access UK film tax relief, Facts in focus a film must be certified as • total of 152 UK films (105 in 2008) received final A certification as British films in 2009. Of these, 144 ‘British’. To qualify as British, were Schedule 1 films and eight were co-productions. a film must either pass the • he total production budget of finally certified Schedule 1 T films was £604 million in 2009 (£935 million in 2008). Cultural Test under Schedule 1 • here were 149 interim Schedule 1 approvals in T of the Films Act 1985, or be 2009, with a total anticipated production budget certified under one of the of £1,591 million. UK’s bilateral co-production • he median co-production budget rose over the last T decade, while since 2005 that of Schedule 1 films agreements or the European dropped to only £1 million. Convention on Cinematographic Co-production.
  • 127.
    1 2 15.1 Qualifying as an official British film 3 The Secretary of State for Culture, Media and Sport (DCMS) is responsible for issuing British Film Certificates on the basis of recommendations made by the UK Film Council’s Certification Unit. Makers of certified British films can apply for tax relief on qualifying films or apply for Lottery funding from the UK Film Council and other sources. 4 (There is more information about public investment in film in Chapter 17.) Schedule 1 films are films certified as British under Schedule 1 of the Films Act 1985. To qualify, films starting 5 principal photography on or after 1 January 2007 must pass a UK Cultural Test. Points are awarded for UK elements in the story, setting and characters and for where and by whom the film was made (see the links at the end of the chapter for details of the Cultural Test). A wide variety of films qualified as British under the Cultural 6 Test in 2009, from The Dark Knight and Sweeney Todd: The Demon Barber of Fleet Street to The Young Victoria and The Damned United. Films can also qualify as British if they are certified under the various official UK co-production agreements. 7 Official co-productions must be certified by the competent authorities in each country as meeting the certifying criteria, which include the creative, artistic, technical and financial input from each co-producer. Once certified, a film counts as a national film in each of the territories and may qualify for public support on the same basis as 8 national films in that territory. On the basis of recommendations made by the UK Film Council, the Secretary of State grants ‘interim approval’ prior to the start of principal photography to those films that meet the criteria and ‘final certification’ once the film has been completed and final documents submitted. British films made as official 9 co-productions are not required to pass the Cultural Test. At the end of 2009, the UK had seven active bilateral treaties in place, with Australia, Canada, France, India, Jamaica, New Zealand and South Africa. Four others were under negotiation in mid-2010. Official UK 10 co-productions can also be certified under the European Convention on Cinematographic Co-production of which the UK is one of 42 signatories. 11 15.2 Schedule 1 cultural test certifications, 2008 and 2009 In 2009, a total of 144 films (97 in 2008) were finally certified as British under the Schedule 1 Cultural Test 12 (Table 15.1). The total budget of finally certified films fell from £935 million to £604 million. This reflects the smaller number of big budget inward investment films made in 2008 feeding through to a smaller value of final certifications in 2009. Interim Schedule 1 approvals rose from 122 to 149 with the aggregate budget increasing 13 from £859 million to £1,591 million. The growth in the number of interim approvals reflects an increase in the number of very low budget films while the increase in aggregate budget is due to a number of high value inward investment productions. 14 Table 15.1 Schedule 1 cultural test certifications, 2008 and 2009 2008 2009 15 Type of certification Number Budget (£ million) Number Budget (£ million) Interim approval 122 858.8 149 1,591.1 16 Final certification 97 935.4 144 603.9 Source: DCMS, UK Film Council. 17 18 19 20 Image: Robin Hood © 2010 Universal Studios. Photo by David Appleby Chapter 15: Films certified as British 1998–2009 – 125 21
  • 128.
    15.3 Co-production certifications,2008 and 2009 In 2009, official co-productions remained at the low level of 2008 with eight final certifications (£48 million) and 19 interim approvals (£102 million). The decline in co-productions from the much higher levels of the early 2000s has been influenced by the closing of tax loopholes and the redesign of the post-2006 tax relief to relate to UK spend rather than the total film budget. Table 15.2 Co-production certifications, 2008 and 2009 2008 2009 Type of certification Number Budget (£ million) Number Budget (£ million) Interim approval 16 108.9 19 102.1 Final certification 8 45.2 8 48.0 Source: DCMS, UK Film Council. In 2009, five of the eight final co-production certifications were under the European Convention on Cinematic Co-production, one was under the UK-Australia agreement, one under the UK-Canada agreement and one under the UK-South Africa agreement. Of the 19 interim co-production approvals, 10 were under the European Convention, two were under the UK-New Zealand agreement, five were under the UK-Canada agreement, one was under the UK-Australia agreement and one under the UK-South Africa agreement. 15.4 Finally certified British films, 1998–2009 The number of UK films (Schedule 1 and co-productions) receiving final certification rose gradually from 56 in 1998 to a peak of 172 in 2005 (Figure 15.1). The numbers then fell to 105 in 2008 before picking up again to 152 in 2009. At the peak in 2003–2005 the majority of final certifications were co-productions, but these have since dropped away to the very low levels of 2008 and 2009. Figure 15.1 Number of finally certified (Schedule 1 and co-production) UK films, certification years 1998–2009 No. certifications (final) 200 150 100 50 0 98 99 00 01 02 03 04 05 06 07 08 09 Schedule 1 40 70 108 75 77 76 72 66 74 98 97 144 Co-production 16 13 22 41 56 84 99 106 68 56 8 8 Total 56 83 130 116 133 160 171 172 142 154 105 152 Source: DCMS, UK Film Council. 126 – UK Film Council Statistical Yearbook 2010
  • 129.
    1 2 The total production budget of finally certified British films peaked at £1,822 million in 2004 (Figure 15.2). 3 The rise was mainly due to the surge in official UK co-productions in the early 2000s. In 2004/05 a series of cooling measures designed to restore balance in co-production relations were introduced by the DCMS and Her Majesty’s Revenue and Customs (HMRC) and in 2007 the basis of tax relief was shifted from total budget to UK spend, 4 reducing the incentive to structure films as co-productions as these films generally have lower levels of UK spend than Schedule 1 films. The value of official co-productions has since fallen back to the pre-2000s level. 5 Figure 15.2 Total production budget of finally certified (Schedule 1 and co-production) UK films, calendar years 1998–2009 Total production budget (£ million) 6 2,000 7 1,500 1,000 8 500 9 0 98 99 00 01 02 03 04 05 06 07 08 09 10 Schedule 1 232.1 421.5 361.2 538.5 585.4 330.0 643.5 757.7 402.0 561.4 935.4 603.9 Co-production 59.5 66.3 95.5 277.7 462.2 427.6 1,178.2 877.1 459.5 356.7 45.2 48.0 Total 291.6 487.8 456.7 816.1 1,047.5 757.6 1,821.7 1,634.8 861.6 918.1 980.6 651.8 11 Source: DCMS, UK Film Council. Notes: Total production budget is total budget for Schedule 1 films and total investment for co-productions. Due to rounding, totals may differ slightly from the sum of the separate rows. 12 Figure 15.3 shows the levels of UK spend over the same period. UK spend is generally that part of the production budget spent in the UK (see notes to Figure 15.3). At its peak in 2005, UK spend reached £1,023 million whereas in 2009 it was £445 million. Although over half the total production budget was contributed by co-productions 13 at the peak in 2004–2005, the UK spend of co-productions was less than that of the Schedule 1 films. Since then, their contribution has continued to fall. In 2009, Schedule 1 films accounted for 95% of the UK spend of finally certified films. 14 15 16 17 18 19 20 Chapter 15: Films certified as British 1998–2009 – 127 21
  • 130.
    Figure 15.3 UKspend of finally certified (Schedule 1 and co-production) UK films, calendar years 1998–2009 UK spend (£ million) 1,200 1,000 800 600 400 200 0 98 99 00 01 02 03 04 05 06 07 08 09 Schedule 1 151.4 277.7 292.4 459.3 522.5 293.3 560.2 685.4 341.1 442.4 588.5 422.9 Co-production 22.9 21.6 37.8 88.2 132.2 127.3 442.7 337.4 183.1 123.1 34.0 21.6 Total 174.4 299.3 330.3 547.5 654.7 420.6 1,002.9 1,022.8 524.2 565.5 622.5 444.6 Source: DCMS, UK Film Council. Notes: ‘UK spend’ is the ‘value of the production activities in the UK’ for Schedule 1 films and ‘UK expenditure’ for co-productions (bilateral and European Convention). UK spend for co-productions may include some expenditure on UK goods and services which took place outside the UK. Due to rounding, totals may differ slightly from the sum of the separate rows. UK spend as a percentage of total budget is typically lower for co-productions than for Schedule 1 films (Table 15.3). The co-production UK spend share is usually around one-third, though it has risen in the last two years as the number of co-productions has fallen away. The UK spend share of Schedule 1 films has averaged between 63% and 91% and in 2009 was 70%. Tax relief for British films is based on UK spend up to a maximum of 80% of the qualifying budget. Table 15.3 UK spend as % of total production budget, 1998–2009 1998 1999 2000 2001 2002 2003 2004 2005 2006 2007 2008 2009 Schedule 1 65.2 65.9 81.0 85.3 89.3 88.9 87.1 90.5 84.8 78.8 62.9 70.0 Co-production 38.5 32.5 39.6 31.8 28.6 29.8 37.6 38.5 39.8 34.5 75.2 45.0 Total 59.8 61.4 72.3 67.1 62.5 55.5 55.1 62.6 60.8 61.6 63.5 68.2 Source: UK Film Council. 15.5 Median budgets, 1998–2009 Median budgets for final certifications are shown in Figure 15.4. From 1998 to 2005 the median budget for co-productions was on a rising trend, increasing to £4.9 million. This was followed by a drop in 2006–2008 to £3.8 million then a steep rise in 2009 to £6.3 million. However, the numbers of co-productions were very low in 2008 and 2009, so the median is more susceptible to the effect of individual titles. A decade ago, the median budget of Schedule 1 films was £3 million. This dipped in 2002–2003 to around £2 million, but then rose to over £3 million in 2004 and 2005. Since then, as the number of Schedule 1 films has increased, the median budget has fallen steeply to only £1 million. 128 – UK Film Council Statistical Yearbook 2010
  • 131.
    1 2 Figure 15.4 Median budget of final certifications, 1998–2009 3 Median budget (£ million) 7.0 6.0 4 5.0 4.0 5 3.0 2.0 6 1.0 0 1998 1999 2000 2001 2002 2003 2004 2005 2006 2007 2008 2009 7 Schedule 1 3.1 2.9 2.8 2.9 2.0 1.8 3.2 3.5 2.0 1.2 1.0 1.0 Co-production 2.5 3.5 3.3 3.4 4.7 3.6 4.3 4.9 4.4 4.4 3.8 6.3 Source: UK Film Council. Note: The median is the middle value, ie there are equal numbers of films above and below the median. 8 15.6 Final certifications by budget band, 2007–2009 9 Table 15.4 shows that the reason for the decline in the Schedule 1 median budget is the growth in the number of very low budget (under £2 million) films being certified. This growth has been particularly marked since 2006, 10 suggesting that UK tax relief has become more accessible to low budget filmmakers, following the introduction of the new rules in 2007. The total number of medium and high budget Schedule 1 films has remained fairly consistent from year to year over the last decade. 11 Table 15.4 Final Schedule 1 certifications by budget band, 1998–2009 Budget band £ million 1998 1999 2000 2001 2002 2003 2004 2005 2006 2007 2008 2009 12 30 2 3 1 3 2 2 5 5 2 3 9 4 10–30 2 3 3 10 13 3 7 9 7 7 6 7 13 5–10 5 14 14 7 10 5 13 7 9 9 11 8 2–5 20 26 43 24 13 25 23 25 21 18 9 24 =2 11 24 47 31 39 41 24 20 35 61 62 101 14 Total 40 70 108 75 77 76 72 66 74 98 97 144 Source: DCMS, UK Film Council. 15 Table 15.5 shows the distribution of Schedule 1 budgets by budget band for the years 2007–2009. The 5% of films with budgets over £30 million accounted for 60.1% of the aggregate budget, while the 66% of films with budgets under £2 million accounted for only 7% of the aggregate budget. This reflects both the growth in the number of 16 low budget Schedule 1 films and the big budget inward investment UK/USA titles in the top budget band. 17 18 19 20 Chapter 15: Films certified as British 1998–2009 – 129 21
  • 132.
    Table 15.5 FinalSchedule 1 certifications, budget distribution by budget band, 2007–2009 Budget band Total budget £ million Number £ million % number % budget 30 16 1,261.8 4.7 60.1 10–30 20 339.5 5.9 16.2 5–10 28 195.0 8.3 9.3 2–5 51 158.6 15.0 7.6 =2 224 145.8 66.1 6.9 Total 339 2,100.7 100.0 100.0 Source: DCMS, UK Film Council. For co-productions the pattern is different. The rise and fall in co-production numbers is clear from Table 15.6, which also shows a disproportionate increase in large budget co-production certifications in 2004–2005. This reflects the structuring of some large budget UK/USA inward investment films as co-productions at that time, a practice that has fallen away since the tax rules changed. Table 15.6 Final co-production certifications by budget band, 1998–2009 Budget band £ million 1998 1999 2000 2001 2002 2003 2004 2005 2006 2007 2008 2009 30 – – – 1 1 – 8 4 2 2 – – 10–30 – 2 2 7 14 11 20 15 5 7 2 1 5–10 5 2 4 8 12 18 14 32 20 13 1 4 2–5 6 6 13 19 21 39 40 39 28 25 4 1 =2 5 3 3 6 8 16 17 16 13 9 1 2 Total 16 13 22 41 56 84 99 106 68 56 8 8 Source: DCMS, UK Film Council. The budget distribution for co-productions was much more even than for Schedule 1 films, with 81% of films having budgets between £2 million and £30 million and accounting for 81% of the total budget, as shown in Table 15.7. 130 – UK Film Council Statistical Yearbook 2010
  • 133.
    1 2 Table 15.7 Final co-production certifications, budget distribution by budget band, 2007–2009 3 Budget band Total budget £ million Number £ million % number % budget 30 2 67.6 2.8 15.0 4 10–30 10 125.9 13.9 28.0 5–10 18 133.5 25.0 29.7 5 2–5 30 104.3 41.7 23.2 =2 12 18.6 16.7 4.1 Total 72 449.9 100.0 100.0 6 Source: DCMS, UK Film Council. 7 8 9 10 11 12 13 14 15 16 „ 17 3 For more on UK film production, see Chapter 16 (page 132) 3F or more on the UK film economy, see Chapter 20 (page 171) 18 3F or public investment in film in the UK see Chapter 17 (page 143) 3F or quarterly updates on British film certification data, see www.ukfilmcouncil.org.uk/ukfilms 3F or more information about British films, tax relief and the Cultural Test, see www.ukfilmcouncil.org.uk/qualifying 19 3F or more information on the European Convention on Cinematographic Co-production, see the Council of Europe website: http://conventions.coe.int (number 147 under the full list of treaties) 20 Chapter 15: Films certified as British 1998–2009 – 131 21
  • 134.
    Chapter 16: Film productionin 2009 2009 saw a substantial Facts in focus increase in production in • otal UK production activity in 2009 was £957 million, T compared with £613 million in 2008. the UK, driven by a record • he UK spend associated with inward investment T level of inward investment. features was £753 million, the highest yet recorded, up 111% from £357 million in 2008. However, the UK independent • here were 71 UK domestic features (77 in 2008) T sector remained under and 22 co-productions (22 in 2008). pressure, with the median • he median budget for UK domestic features was T budget of UK domestic films £1.5 million, compared with £1.7 million in 2008 and £2.9 million in 2003. falling to £1.5 million. • hirteen big budget films accounted for 69% of the T total UK production spend in 2009. • S studios were involved with 26 productions in the U UK in 2009, accounting for 76% of total UK spend.
  • 135.
    1 2 16.1 The value of UK production in 2009 3 UK production activity grew by 56% in 2009 to £956.9 million, from £613 million in 2008. The increase was due to the surge in inward investment, which was encouraged by the decline in the pound-dollar exchange rate, the bedding-in of the UK film tax relief and the resolution of the writers’ and actors’ disputes in the USA. 4 There were 32 inward investment productions in 2009, with a UK production value of £752.7 million (see Table 16.1 for definitions). Some of the big budget films contributing to this figure were Harry Potter and the Deathly Hallows 5 Part I, Robin Hood, Gulliver’s Travels, Clash of the Titans, The Chronicles of Narnia: The Voyage of the Dawn Treader, Your Highness, Inception, London Boulevard and Gnomeo and Juliet. There were 71 UK domestic features in 2009, down slightly from 77 in 2008, with a UK production value of 6 £169.2 million which was 18% down from the 2008 figure. Domestic UK titles in 2009 included Nanny McPhee and the Big Bang, Centurion, Blitz, Tamara Drewe, St Trinian’s 2: The Legend of Fritton’s Gold, It’s a Wonderful Afterlife and Nowhere Boy. 7 Co-productions remained steady at 22 with their UK spend falling from £48.9 million to £35 million. This continues the downward trend established in 2005 and reflects a tightening of co-production qualification rules and the effect of the new UK film tax relief, which applies to UK spend rather than the total budget of a film. Co-productions in 8 2009 included Mr Nice, Route Irish, The Ghost (aka The Ghost Writer), Neds and Tracker. Table 16.1 Feature film production activity, 2008 and 2009 9 Number of Value Number of Value productions £ million productions £ million 2008 2008 2009 2009 10 Inward investment feature films 27 356.8 32 752.7 Domestic UK feature films 77 207.2 71 169.2 11 Co-productions 22 48.9 22 35.0 Total 126 613.0 125 956.9 Source: UK Film Council. 12 Notes: Numbers have been revised on the basis of new information received since the publication of the 2009 Statistical Yearbook. Inward investment includes nine films in 2008 (£17.7 million) and nine films in 2009 (£36.8 million) that involved only visual effects (VFX) work in the UK. Inward investment feature films include three non-USA films in 2008 and three non-USA films in 2009. 13 Definitions: An inward feature is defined as a feature film which is substantially financed and controlled from outside the UK and where the production is attracted to the UK because of script requirements, the UK’s infrastructure or UK tax incentives. An inward feature co-production is an official co-production that originates from outside the co-production treaty countries (usually from the USA) and which is attracted 14 to the UK because of script requirements, the UK’s infrastructure or UK tax relief. None were made in 2008 and 2009. A domestic (indigenous) UK feature is a feature made by a UK production company that is produced wholly or partly in the UK. A co-production is a production (other than an inward co-production) involving various country partners usually under the terms of a bilateral co-production agreement or the European Convention on Cinematographic Co-production. 15 Measurement: The above numbers include only the UK spend associated with productions shot or post-produced in whole or in part in the UK. Spend is allocated to the year in which principal photography started or to the year in which the visual effects were undertaken in the case of VFX-only films. 16 Exclusions: Spending on films with budgets under £500,000 is not included. 17 18 19 20 Image: Nanny McPhee and the Big Bang © 2010 Universal Studios. Chapter 16: Film production in 2009 – 133 ALL RIGHTS RESERVED. Photo by Liam Daniel 21
  • 136.
    16.2 Inward, domesticand co-production features, 1994–2009 Figure 16.1 puts the 2009 figures in a longer time perspective. The decline in domestic features between 1997 and 2004 occurred alongside a substantial growth in co-production activity, suggesting it was easier at that time to make films as official co-productions than as stand-alone UK productions. From 2005 to 2008 this trend was reversed, reflecting a tightening in co-production certification requirements followed by the introduction of the new UK film production tax relief based on UK spend rather than the whole production budget of the film. Minority co-productions saw the greatest reduction. After a decline from the peak of 2003 the total number of films has levelled out at around 125 per year, but domestic UK productions have grown as a proportion of the total. Production numbers continued at the higher level achieved after the introduction of tax relief and Lottery support for film in the mid–1990s. Figure 16.1 Number of inward, domestic, co-production and total features, 1994–2009 Number of features 200 150 100 50 0 94 95 96 97 98 99 00 01 02 03 04 05 06 07 08 09 Inward 13 14 25 20 16 22 28 23 16 45 28 48 28 29 27 32 Domestic 33 34 73 84 67 70 52 51 37 45 41 51 55 70 77 71 Co-production – – – – – – – – 66 106 105 65 51 28 22 22 Of which… – – – – – – – – – 23 23 12 18 15 10 5 majority and parity co-production minority – – – – – – – – – 83 82 53 33 13 12 17 co-production Total 46 48 98 104 83 92 80 74 119 196 174 164 134 127 126 125 Source: UK Film Council. Notes: Inward features include inward investment co-productions from 2002 and a small number of visual effects (VFX) only titles from 2007. UK co-productions not available by shoot date prior to 2002. Data for 2003–2008 updated since publication of the 2009 Yearbook. Inward investment includes a spike in the number of non-USA (mainly Indian) inward investment films in 2005. Majority co-production means a co-production in which the UK investment is the largest single national investment (not necessarily an absolute majority). Parity co-production means a co-production in which the UK and at least one other country contributed equal largest investments. Minority co-production means a co-production in which at least one other country made a larger investment than the UK. Data for films with budgets greater than or equal to £500,000. Table 16.2 distinguishes independent UK films from UK/USA studio films and non-UK films made partly or wholly in the UK. In 2009, UK independent films were 75.2% of the total while UK films as a whole were 88%. In recent years the share of UK independent films in the total has been as high as 89% (2004). The number of non-UK films increased in 2008 and 2009, mainly as a result of an increase in VFX-only titles tracked. VFX-only titles are usually big budget USA studio films which contract part of their visual effects to UK-based VFX companies. The number of UK independent films with budgets greater than or equal to £500,000 has declined since 2003, reflecting the tougher economic environment for independent production. 134 – UK Film Council Statistical Yearbook 2010
  • 137.
    1 2 Table 16.2 Numbers of UK/USA studio and independent UK films, 2003–2009 3 2003 2004 2005 2006 2007 2008 2009 UK/USA studio films 27 14 15 21 17 13 16 4 UK independent films 162 155 144 108 103 100 94 Non-UK films 7 5 5 5 7 13 15 Total 196 174 164 134 127 126 125 5 % UK independent films 82.7 89.1 87.8 80.6 81.1 79.4 75.2 Source: UK Film Council. Notes: 6 A UK/USA studio film is a UK film produced by or in association with one of the major US studios or one of the major US studios’ specialist production subsidiaries. A UK independent film is a UK film made by an independent production company or group of independent production companies. Data for films with budgets greater than or equal to £500,000. 7 The value of UK production in 2009 increased by 56% compared with 2008, making 2009 the second highest production year on record after 2003 (Figure 16.2). The value of inward investment, at £753 million, was the highest yet tracked. In 2009, inward investment accounted for 78.7% of UK spend demonstrating the importance of inward 8 investment to the UK film economy. Since 1997, the fluctuation in production value has principally been driven by fluctuations in inward investment. In contrast, the combined UK spend of co-productions and UK domestic films declined from £386 million in 2003 to £204 million in 2009, reflecting tougher economic conditions and changing 9 arrangements for film tax relief. The majority of the fall is due to the decline in co-productions, the UK spend of which has fallen from £169 million in 2004 to £35 million in 2009. 10 Figure 16.2 Value of UK spend of inward, domestic, co-production and total features, 1994–2009 Value of UK spend £ million 1,200 11 1,000 800 12 600 13 400 200 14 0 94 95 96 97 98 99 00 01 02 03 04 05 06 07 08 09 Inward 182.7 216.5 387.1 261.9 214.2 336.4 366.6 198.5 265.9 732.9 583.8 306.5 558.7 595.1 356.8 752.7 15 Domestic 59.5 94.0 172.2 202.9 175.0 170.3 211.7 180.1 156.4 227.8 126.8 178.7 157.5 155.4 207.2 169.2 Co-production – – – – – – – – 128.2 158.3 169.2 97.3 109.2 74.1 48.9 35.0 Of which… – – – – – – – – – 62.1 55.1 34.6 66.1 51.2 32.7 12.8 16 majority and parity co-production minority – – – – – – – – – 96.2 114.2 62.6 43.1 22.9 16.2 22.2 co-production 17 Total 242.2 310.5 559.3 464.8 389.2 506.7 578.3 378.6 550.5 1,119.0 879.8 582.5 825.4 824.6 612.9 956.9 Source: UK Film Council. See notes to Figure 16.1. 18 Table 16.3 shows the split between UK/USA studio films, UK independent films and non-UK films. Over the period as a whole UK independent films accounted for one-third of the UK spend with UK/USA studio films making up most 19 of the rest. In 2009, the UK spend of UK independent films was lower than average at 24% of the total, due to the surge in studio films. 20 Chapter 16: Film production in 2009 – 135 21
  • 138.
    Table 16.3 Valueof UK spend of UK/USA studio and independent UK films, 2003–2009, £ million 2003 2004 2005 2006 2007 2008 2009 UK/USA studio films 750.0 558.4 236.2 588.6 557.3 348.5 689.7 UK independent films 352.2 315.3 341.9 222.6 249.2 241.3 226.2 Non-UK films 16.9 6.2 4.3 14.2 18.0 23.2 41.0 Total 1,119.0 879.8 582.4 825.4 824.5 613.0 956.9 % UK independent films 32.1 35.8 58.7 27.0 30.2 39.4 23.6 Source: UK Film Council. See notes to Table 16.2. The competitiveness of the UK as a destination for internationally mobile film production is significantly affected by the UK pound-US dollar exchange rate. When the value of the pound in US dollars increases, film production in the UK becomes more expensive and US producers may choose to stay at home or go to countries where costs and exchange rates are more favourable. Conversely, if the value of the pound falls, the UK becomes more competitive. Figure 16.3 shows the high value of the pound in 2007, peaking at a monthly average of $2.07 in November 2007. The last time the dollar-pound rate was at or above $2.07 was in May 1981. The pound began depreciating significantly from August 2008, bottoming out at $1.42 in March 2009, before recovering to $1.65 in August 2009. In January 2010 the rate was $1.61. The average dollar-pound rate for the 30-year period 1980 to 2009 was $1.67. Figure 16.3 Value of £ sterling in US dollars, 2007–2009 US$ 2.5 2.0 1.5 1.0 0.5 0.0 Jan-07 Apr-07 Jul-07 Oct-07 Jan-08 Apr-08 Jul-08 Oct-08 Jan-09 Apr-09 Jul-09 Oct-09 Jan-10 £ Sterling in US$ Source: Bank of England. 136 – UK Film Council Statistical Yearbook 2010
  • 139.
    1 2 16.3 Productions by genre, 2007–2009 3 Table 16.4 shows a breakdown of production by genre for the years 2007–2009. Production in the UK is reasonably well spread across genres and does not appear to be as over-concentrated on drama as sometimes supposed. Drama accounted for 23% of the films, but only 7% of the budget. Comedy accounted for 19% of the films and 16% of the 4 budget. The biggest spending genres were action, fantasy, comedy and adventure. After drama and comedy, the most numerous genres were thrillers (9%) and action (8%). 5 Table 16.4 Genre of production in the UK, 2007–2009 Budget UK spend Genre Number of films % of total £ million % of total £ million % of total 6 Action 30 7.9 1,201.8 28.0 555.4 23.2 Adventure 5 1.3 316.1 7.4 257.3 10.7 7 Animation 8 2.1 161.0 3.7 83.3 3.5 Biopic 20 5.3 114.9 2.7 68.0 2.8 Comedy 71 18.8 686.3 16.0 343.6 14.4 8 Crime 16 4.2 63.7 1.5 52.9 2.2 Documentary 23 6.1 44.4 1.0 23.2 1.0 9 Drama 88 23.3 286.7 6.7 193.0 8.1 Family 3 0.8 6.6 0.2 6.0 0.2 Fantasy 11 2.9 625.3 14.6 386.0 16.1 10 Horror 24 6.3 118.6 2.8 104.3 4.4 Musical 7 1.9 121.7 2.8 99.2 4.1 11 Romance 23 6.1 86.6 2.0 56.9 2.4 Sci-fi 7 1.9 226.6 5.3 48.8 2.0 Thriller 34 9.0 159.6 3.7 68.2 2.8 12 War 5 1.3 66.8 1.6 45.5 1.9 Other 3 0.8 10.7 0.2 3.0 0.1 13 Total 378 100.0 4,297.6 100.0 2,394.4 100.0 Source: UK Film Council. Notes: The data have been presented for a three-year period to show as many genres as possible without disclosing the budgets of individual films. The category ‘other’ contains 14 mystery and war films, grouped because of their low numbers. Percentages may not sum to 100.0 due to rounding. 15 Looking at UK independent films alone (Table 16.5) the situation is somewhat different. The top three genres in terms of numbers and budget were drama, comedy and thrillers. Drama accounted for 26% of the films and 22% of the budget, but there was a reasonable representation of the minor genres, for example romance (7% of the films, 8% of the budget), documentaries (7% of the films, 3% of the budget) and biopics (6% of the films, 8% 16 of the budget). 17 18 19 20 Chapter 16: Film production in 2009 – 137 21
  • 140.
    Table 16.5 IndependentUK productions by genre, 2007–2009 Budget UK spend Genre Number of films % of total £ million % of total £ million % of total Action 11 3.7 56.2 5.5 33.3 4.6 Adventure 3 1.0 22.8 2.2 7.2 1.0 Animation 4 1.3 31.3 3.1 14.7 2.1 Biopic 18 6.1 80.2 7.8 58.4 8.1 Comedy 52 17.5 168.6 16.4 134.5 18.8 Crime 15 5.1 56.5 5.5 46.4 6.5 Documentary 20 6.7 30.3 3.0 19.2 2.7 Drama 77 25.9 227.8 22.2 168.8 23.6 Family 3 1.0 6.6 0.6 6.0 0.8 Fantasy 5 1.7 36.3 3.5 23.2 3.2 Horror 22 7.4 35.7 3.5 28.8 4.0 Musical 5 1.7 49.2 4.8 39.6 5.5 Romance 22 7.4 84.1 8.2 56.3 7.8 Thriller 31 10.4 97.2 9.5 57.1 8.0 War 4 1.3 26.5 2.6 15.7 2.2 Other 5 1.7 15.8 1.5 7.6 1.1 Total 297 100.0 1,025.1 100.0 716.7 100.0 Source: UK Film Council. Notes: The category ‘other’ contains western, mystery and science fiction. Percentages may not sum to 100.0 due to rounding. 16.4 Budget trends The median budget of domestic UK features fell in 2009 to £1.5 million and is now only half the level it was in 2003 (£2.9 million). The co-production median also fell in 2009, to £2.6 million, though it had been stable in 2008. In contrast, the median budget of inward investment features continued to rise, reaching £25 million in 2009. This reflects the continuing upward movement in the budgets of US studio films, notwithstanding reports of financial challenges facing Hollywood. Table 16.6 Median feature film budgets £ million, 2003–2009 Production category 2003 2004 2005 2006 2007 2008 2009 Inward investment features 11.5 8.6 3.9* 18.6 10.3 23.1 25.0 Domestic UK productions 2.9 2.3 2.0 1.9 1.3 1.7 1.5 Co-productions 3.3 4.0 4.2 4.0 3.7 3.6 2.6 Source: UK Film Council. Notes: Median budget is the middle value (ie there are equal numbers of films above and below the median). The median in this case is a better measure of central tendency than the average as it avoids the upward skew of a small number of high budget productions. Data for 2003–2008 updated since publication of the 2009 Yearbook. *In 2005 there was an unusually high number of inward features from India (28), reducing the median budget for that year. 138 – UK Film Council Statistical Yearbook 2010
  • 141.
    1 2 16.5 Size distribution of budgets Table 16.8 Size distribution of budgets, domestic UK 3 features, 2009 The budget size distribution for the three main Total categories of films made in 2009 is shown in Tables 16.7 budget % to 16.9. Thirteen features with budgets over £30 million in band of total 4 Budget band Number (£ million) budget accounted for 84% of the total budget for inward investment features. Only four of 32 inward features £5 million 13 111.7 54.1 had budgets between £0.5 million and £5 million. £2–£5 million 14 45.8 22.2 5 £0.5–£2 million 44 48.8 23.7 Table 16.7 Size distribution of budgets, inward Total 71 206.3 100.0 6 investment features, 2009 Source: UK Film Council. Total Note: There was one film with a budget above £10 million which is not shown budget % separately as the data would be disclosive. in band of total 7 Budget band Number (£ million) budget Co-production budgets tend to be more evenly £30 million 13 1,261.4 84.2 distributed than those of inward and domestic films, £10–£30 million 10 187.7 12.5 as shown in Table 16.9. The nine co-productions with 8 £5–£10 million 5 39.6 2.6 budgets in the £2–£5 million band accounted for 32% of the total budget. There was only one co-production £0.5–£5 million 4 9.9 0.7 with a budget above £10 million (not shown separately), 9 Total 32 1,498.6 100.0 while eight out of 22 had budgets between £0.5 million Source: UK Film Council. and £2 million, accounting for 10% of the total budget. 10 In contrast, the majority of domestic UK features (44 out of 71) had budgets under £2 million (Table 16.8). Table 16.9 Size distribution of budgets, There was a rise in the number of domestic features co-productions, 2009 with budgets above £5 million to 13 in 2009 compared Total 11 budget % with six in 2008. However, the combined budget of in band of total these 13 films (£111.7 million) was no greater than the Budget band Number (£ million) budget combined budget of the six in 2008 (£111.8 million). £5 million 5 54.1 58.0 12 (See 2009 Statistical Yearbook for details.) £2–£5 million 9 29.8 32.0 £0.5–£2 million 8 9.4 10.0 13 Total 22 93.3 100.0 Source: UK Film Council. 14 15 16 17 18 19 20 Chapter 16: Film production in 2009 – 139 21
  • 142.
    16.6 Big budgetproductions, 2007–2009 The importance to UK spend of a small number of big budget productions – usually inward investment films – is demonstrated in Table 16.10. In 2009, the 13 films with budgets greater than £30 million accounted for 68.9% of UK production spend. Table 16.10 Big budget films’ contribution to UK spend, 2007–2009 2007 2008 2009 Number of films with budgets £30 million 8 11 13 Value of associated UK spend (£ million) 475.1 341.8 659.2 Total UK spend (£ million) 824.5 613.0 956.9 Big budget film share of UK spend 57.6% 55.8% 68.9% Source: UK Film Council. Note: Data for 2007–2008 updated since publication of 2009 Statistical Yearbook. 16.7 UK spend as percentage of total production budget Table 16.11 shows UK spend as a percentage of production budget for inward investment films, domestic UK productions and co-productions. Domestic UK productions had the highest UK spend percentage in 2009 (82.0%), followed by inward investment films at 70.0%. Co-productions had the lowest UK spend percentage (37.5%) though this was significantly higher than the 30% prevailing in 2003–2004, reflecting a fall in the number of low-UK-spend co-productions after the introduction of the new film tax relief. The UK spend percentage for inward investment films has fallen moderately. In 2003–2004 it was 75.5%, reflecting the requirement for a minimum 70% UK spend in the pre-2007 criteria for tax relief. Under the new rules, films can qualify for UK tax relief providing they pass the UK Cultural Test and have a minimum UK spend of 25% of the qualifying budget (and meet certain other criteria specified in the regulations). Table 16.11 UK spend as percentage of total production budget, 2007–2009 Production category 2007 2008 2009 Inward investment films 64.5 65.2 70.0 Domestic UK productions 84.0 84.6 82.0 Co-productions 47.5 43.7 37.5 Source: UK Film Council. Notes: Data for 2007–2008 updated since publication of 2009 Yearbook. VFX-only films not included in ‘Inward investment films’. 140 – UK Film Council Statistical Yearbook 2010
  • 143.
    1 2 16.8 UK domestic productions by territory Table 16.13 UK domestic productions, shoots by 3 of shoot territory or region, 2009 Territory of shoot Number of shoots Table 16.12 analyses UK domestic productions in 2009 according to whether they were wholly or partially shot UK 67 4 in the UK, or wholly shot abroad. The majority (52 out USA 7 of 71) were shot exclusively in the UK, while 14 films India 3 were shot partly abroad. Five UK domestic films were 5 shot wholly abroad. The non-UK spend as a proportion Other Africa 3 of budget (18.0%) was higher than in 2008. Isle of Man 2 South Africa 2 6 Table 16.12 UK domestic productions by territory Germany 2 of shoot, 2009 Other 7 7 Non-UK Total shoots 93 spend Non-UK as % Source: UK Film Council. Number Budget spend of total Shooting in of films (£ million) (£ million) budget 8 UK only 52 152.6 11.6 7.6 16.9 Co-productions by territory of shoot UK and other 14 32.5 7.2 22.2 In contrast to UK domestic productions, co-productions 9 Other only 5 21.3 18.4 86.5 were usually shot partly or wholly abroad, as Table Total UK 16.14 shows. Only two out of 22 films, with a total domestic films 71 206.3 37.2 18.0 budget of £5.6 million, were shot wholly in the UK. 10 Source: UK Film Council. Non-UK spend accounted for 62.5% of the total budget of co-productions in 2009. Table 16.13 shows the number of shoots by territory 11 for UK domestic films. Because some films were shot in Table 16.14 Co-productions by territory of shoot, 2009 two or more territories, the total number of shoots was greater than the total number of films. Compared to Non-UK spend 12 2008, the range of countries and number of non-UK Non-UK as % shoots was larger. There were seven shoots in the USA, Number Budget spend of total Shooting in of films (£ million) (£ million) budget three in India, three in ‘Other Africa’ and two each in the Isle of Man, South Africa and Germany. UK only 2 5.6 0.6 10.0 13 UK and other 11 57.2 35.2 61.5 Other only 9 30.4 22.5 73.8 14 Total co-productions 22 93.3 58.2 62.5 Source: UK Film Council. 15 The country distribution of co-production shoots is shown in Table 16.15. The majority of shoots were in the UK or elsewhere in Europe. Of the non-European 16 shoots, three were in India, two in New Zealand, two in Thailand and four elsewhere in the world. 17 18 19 20 Chapter 16: Film production in 2009 – 141 21
  • 144.
    Chapter 1: Table 16.15Co-productions, shoots by territory or region, 2009 Table 16.16 Film production company activity, 2009 Number of features The box office per company Number of companies Territory of shoot Number of shoots UK 13 4 2 Other Europe 6 3 1 India 3 2 11 Bulgaria 2 1 199 Ireland 2 Total 213 New Zealand 2 Source: UK Film Council. Notes: Spain 2 Includes all production categories. Further information on film production companies in the UK can be found in Thailand 2 Chapter 19. Other 4 Films frequently have several production companies associated with them (including special purpose vehicle subsidiaries of parent companies), so the sum of (number Total shoots 36 of features) x (number of companies) is substantially greater than the total number of features involving the UK in 2009. Source: UK Film Council. Note: The majority of co-productions were shot in at least two territories. Hence the total in Table 16.15 is more than the number of co-productions in 2009. 16.11 US studios’ involvement in film production in the UK 16.10 Production company activity levels The US studios were involved in the production of UK film production in 2009 was, as usual, dispersed 26 films in the UK in 2009, nine of which were VFX-only among a large number of production companies, as (Table 16.17) accounting for £728.5 million in UK spend, shown in Table 16.16. The UK Film Council recorded 213 76% of total UK spend. production companies associated with films shot in the UK or co-productions involving the UK in 2009. Of these, Table 16.17 US studios’ involvement in film 199 companies were associated with a single feature. production in the UK, 2009 These were a mixture of distinct production companies and special purpose vehicles (that is, companies set up Studio Number of films to make a single film). The most prolific production Universal 8 companies (Black and Blue Films and Film Music Walt Disney 6 Entertainment) were associated with four features each, 20th Century Fox 5 followed by one company with three films (Matador Pictures) and 11 companies with two films each. Warner Bros 4 Columbia Pictures 2 Sony 1 Total films 26 Source: UK Film Council. Note: Nine of the above films involved only VFX in the UK. Two were UK domestic films produced by Working Title under its output deal with Universal. „ 3I nformation about film companies is given in Chapter 19 (page 161) 3F or details about employment in the film production sector see Chapter 21 (page 182) 3 For more information about the UK film economy see Chapter 20 (page 171) 3F or information on film production in the UK prior to 1992, see earlier editions of this Yearbook and the annual Film and Television Handbooks published by the British Film Institute or the Information Briefings on the BFI’s website – www.bfi.org.uk 142 – UK Film Council Statistical Yearbook 2010
  • 145.
    Chapter 17: Public investmentin film in the UK The UK Government provides Facts in focus financial support to film in • otal measured public funding for film in the financial T year 2008/09 was £256 million. the UK through a variety of • he principal sources of public funding for UK film T channels. This recognises in 2008/09 were the film production tax relief, National Lottery and grant-in-aid from central government, the value of film, both culturally particularly via the Department for Culture, Media and economically. Additional and Sport. funding comes from EU • he European Union provided £8.5 million in 2008/09. T sources. The single biggest • er Majesty’s Revenue and Customs (HMRC) and the UK H Film Council were responsible for the largest gross spend source of public funding in (£110 million and £74.5 million respectively). 2008/09 was film tax relief, • ilm production took 56% of the total financial support, F but distribution and exhibition, training and skills, followed by Lottery funding education, and archives and heritage also received and DCMS grant-in-aid. substantial allocations.
  • 146.
    17.1 Public fundingfor film in the UK by source Public funding for film in the UK comes from a number of UK Government, public sector and European sources, including: • The Department for Culture, Media and Sport (DCMS); • Other central government departments; • The governments of Scotland, Wales and Northern Ireland; • The National Lottery; • Her Majesty’s Revenue and Customs (HMRC); • BBC Films; • Film4; • The European Union. Public funding for film identified in Table 17.1 is estimated to have been £256 million in the financial year 2008/09, slightly down on the £261 million in 2007/08. As in 2007/08, the estimate does not include some local authority, research council, higher or further education funding, as indicated in the notes to Table 17.1. The largest single source of public funding was the UK film tax relief, which provided £110 million in 2008/09, 43% of the total. The second-largest source was the National Lottery (£45.9 million, 18% of the total) and the third-largest was the DCMS grant-in-aid to the UK Film Council and National Film and Television School (£31.2 million, 12% of the total). The National and Regional Development Agencies provided £17.1 million, BBC Films £12.7 million and Film4 £8.2 million. The European Union contributed £8.5 million, of which £3.9 million (£11.5 million in 2007/08) came from the MEDIA Programme. 144 – UK Film Council Statistical Yearbook 2010 Image: Centurion courtesy of Pathé UK
  • 147.
    1 2 Table 17.1 Public funding for film in the UK by source, 2008/09 3 Amount % Source £ million of total Notes National Lottery Distribution Fund (DCMS) – Film 45.9 17.9 National Lottery allocations to the UK Film 4 Council, Scottish Screen and Northern Ireland Screen, plus Heritage Lottery Fund(1) DCMS grant-in-aid to the 31.2 12.2 Awards to the UK Film Council (of which 5 UK Film Council and NFTS £17.4 million was awarded to the BFI) and National Film and Television School National and Regional 17.1 6.7 Contributions to the National and Regional 6 Development Agencies Screen Agencies BBC Films 12.7 4.9 BBC Films’ production investment and contributions by the BBC to NFTS and N/RSA 7 projects – excludes acquisitions etc made by other BBC departments Film4 8.2 3.2 Film4 (Channel 4’s film production company) 8 investment in film development and production plus Channel 4 investment in NFTS and N/RSA projects 9 Department for Children, Schools and Families 6.8 2.7 DCSF investment in Mediabox and FILMCLUB. Match funding in individual FILMCLUB or Mediabox projects (and other First Light 10 projects) is not collated Other European Union 4.6 1.8 European Regional Development Fund and European Social Fund 11 Scottish Government 4.3 1.7 Includes spend from all Scottish government agencies into strategic bodies/projects 12 EU MEDIA Programme 3.9 1.5 European Union MEDIA Programme(2) Higher Education Funding Council 3.1 1.2 HEFC investment in Screen Academies and a small number of projects by strategic 13 agencies(3) Welsh Assembly Government 2.3 0.9 Includes spend from all Welsh government agencies into strategic film bodies/projects 14 Northern Ireland Executive 1.5 0.6 Includes spend from all Northern Ireland government agencies into strategic bodies/projects 15 Ofcom 1.0 0.4 Contribution to BFI National Archive for television Department for Innovation, Universities and Skills 1.0 0.4 Awards to Screen Academies, Skillset 16 and N/RSAs 17 18 19 20 Chapter 17: Public investment in film in the UK – 145 21
  • 148.
    Table 17.1 Publicfunding for film in the UK by source, 2008/09 (continued) Amount % Source £ million of total Notes Local Government 0.9 0.4 Investment by local authorities in N/RSA activities Foreign and Commonwealth Office 0.9 0.3 Funding for UK-originated British Council activity. Excludes partnership funding of ‘in country’ events (outside the UK) Arts Councils 0.6 0.2 Awards from national Arts Councils to film agencies(4) Other public sector 0.07 0.0 Very small awards (under £10,000) from a range of public sector agencies, mainly to N/RSAs Department for Business, Enterprise and 0.05 0.0 Awards to RSAs for film export support Regulatory Reform Local authority direct spend n/a n/a Data on local government direct investments in cinemas, youth activity, film offices etc are not collated Other education and research n/a n/a Figures not collated for investment in university courses not part of the Screen Academy network, further education film courses and film-related research awards from research councils Total public sector selective investment 145.9 57.0 National Lottery and grant-in-aid from all sources as above UK film production tax relief (HMRC) 110.0 43.0 Cost of film tax relief in 2008/09(5) Total public sector selective 255.9 100.0 Sum of all the above and automatic investment Source: UK Film Council, Northern Alliance. Abbreviations: BFI – British Film Institute. DCMS – Department for Culture, Media and Sport. HMRC – Her Majesty’s Revenue and Customs. NFTS – National Film and Television School. N/RSA – National and Regional Screen Agencies. Names of government departments are shown as they were in the 2008/09 financial year. The Department for Children, Schools and Families is now the Department for Education. The Department for Innovation, Universities and Skills and the Department for Business, Enterprise and Regulatory Reform are now part of the Department for Business, Innovation and Skills. Notes: 1. The National Lottery funding figure is for financial year 2008/09. 2. Investment for the MEDIA Programme is for awards made from 1 April 2008 to 31 March 2009. 3. Includes the Higher Education Funding Councils for England, Scotland and Wales, and investment from the Joint Information Systems Committee (JISC) which is HEFCE funded. Comprises awards to the BFI, Screen Academies and other strategic agencies. Does not include payments from educational funding councils to other film courses (film studies etc) in higher or further education. 4. Arts Council England, Arts Council of Wales, Arts Council Northern Ireland, Scottish Arts Council. Does not include Arts Councils’ direct investments in artists’ film and video. 5. Film Tax Relief Summary, HMRC, September 2009. 146 – UK Film Council Statistical Yearbook 2010
  • 149.
    1 2 17.2 Film spend by organisation 3 The largest net spender on film was HMRC (£110 million for tax relief), followed by the BFI (£39.9 million), the UK Film Council (£36.6 million) and BBC Films (£12 million). Putting aside HMRC tax relief, net spend decreased by 2% from 2007/08 to 2008/09 (from £179 million to £175 million). Significant decreases were recorded for Film4, 4 Northern Ireland Screen, the Welsh agencies and the EU MEDIA Programme. On the other hand, increases were recorded for Skillset, North West Vision and Media, Screen West Midlands, Screen East, Screen South and the Heritage Lottery Fund. (See Table 18.2 in the 2009 Statistical Yearbook for comparable figures for 2007/08.) 5 Table 17.2 Net film spend by organisation, 2008/09 6 Net spend % of total Organisation £ million(1) net spend HM Revenue and Customs film tax relief 110.0 38.6 7 BFI 39.9 14.0 UK Film Council(2) 36.6 12.9 BBC Films 12.0 4.2 8 Skillset 8.4 3.0 Film4 8.0 2.8 9 National Film and Television School 7.4 2.6 Scottish Screen 7.4 2.6 Northern Ireland Screen 7.1 2.5 10 North West Vision and Media(3) 5.1 1.8 Screen Yorkshire(4) 5.0 1.7 11 First Light 4.9 1.7 Welsh agencies(5) 3.9 1.4 Screen West Midlands(6) 3.9 1.4 12 Film London 3.8 1.3 EU MEDIA Programme 3.7 1.3 13 Screen East(7) 3.5 1.2 FILMCLUB 3.1 1.1 EM Media 3.1 1.1 14 South West Screen(8) 2.4 0.8 Screen South(9) 2.1 0.7 Northern Film and Media(10) 2.0 0.7 15 Heritage Lottery Fund 1.0 0.4 British Council 0.9 0.3 16 Total public sector(11) 285.0 100.0 Source: UK Film Council, Northern Alliance. Notes: 17 1. Net spend means spend after deducting grants and awards to other organisations in this table. Figures are presented net to avoid double counting. 2. The UK Film Council gross spend in 2008/09 was £74.5 million. The UK Film Council made £37.9 million of grants and awards to other organisations such asn the BFI (£17.4 million), Skillset, Regional Screen Agencies and First Light. 3. Includes the North West Film Archive. 18 4. Includes the Yorkshire Film Archive. 5. Welsh agencies means Film Agency for Wales, Welsh Creative IP Fund (part of Finance Wales), Welsh Film Archive (part of the National Library of Wales) and Wales Screen Commission (part of the Creative Industries Hub). 6. Includes the Media Archive for Central England (MACE) which provides film archive services for the East and West Midlands. 7. Includes the East Anglian Film Archive. 19 8. Includes the South West Film and Television Archive. 9. Includes the Wessex Film and Sound Archive and Screen Archive South East and investments in film made by Kent County Council’s Film Office/Kent Development Fund. 10. ncludes film investments made by the Design and Creative Investment Fund operated by North East Finance. I 11. he spending tabulated above includes net transfers to and from reserves and spending financed by commercial income (eg from film rights) earned by agencies. T 20 For these reasons the total spending by agencies (£285 million) is igher than total public funding for film in the 2008/09 year (£255.9 million, Table 17.1). h Chapter 17: Public investment in film in the UK – 147 21
  • 150.
    17.3 Activities supportedby public 17.4 Large film production awards spend on film by agency, 2008/09 The various activities supported by public spend on Major production awards (greater than £250,000) film in the UK in 2008/09 are shown in Table 17.3. given by National and Regional Screen Agencies to As in previous years, film production took the largest individual film projects in 2008/09 are shown in Table share, accounting for £158.4 million (56% of the 17.4. In relation to the median British domestic film total). Distribution and exhibition was second with budget of £1.5 million (see Chapter 16) and the median £31.6 million (11%), followed by administration and co-production budget of £2.6 million, awards of this services to the public (7%) and training and skills (7%). size can provide substantial assistance to UK films of Of the remaining activities, film archives and heritage distinctive national and regional character. and script development registered significant increases over 2007/08. Table 17.4 Large film production awards (£250,000+) by National/Regional Agency, 2008/09 Table 17.3 Activities supported by public spend on Agency Project (total = 14) Amount £ film, 2008/09 Scottish Screen Outcast 447,655 Amount % Activity £ million of total Northern Ireland Your Highness 618,553 Screen Production(1) 158.4 55.6 Cherrybomb 282,951 Distribution and exhibition 31.6 11.1 The Race 250,000 Administration and services 20.0 7.0 Five Minutes of Heaven 250,000 to the public Training and skills(2) 19.5 6.9 Wales Creative IP Skellig 600,000 Fund Education, young people and 19.1 6.7 Mr Nice 366,476 lifelong learning Film archives and heritage(3) 14.6 5.1 EM Media Pelican Blood 250,000 Script development 9.9 3.5 Screen Yorkshire The Damned United 250,000 Export and inward investment Screen East Glorious 39 425,000 7.0 2.4 promotion(4) Screen West Nativity 500,000 Business support(5) 5.0 1.8 Midlands Total public film expenditure(6) 285.0 100.0 One Day 380,000 Source: UK Film Council, Northern Alliance. Soulboy 368,000 Notes: The Tormented 259,776 1. Non-tax break production spend in 2008/09 was £48.4 million. 2. Skills Investment Fund, National/Regional Screen Agency training investment, Source: UK Film Council, DCMS, Northern Alliance, N/RSA reports. Skills Academies. 3. National Film and Television Archive, National/Regional Screen Archives, Heritage Lottery Fund investments. 4. UK Film Council International; British Council, locations services in the nations and regions. 5. National/Regional Screen Agency investment: primary beneficiaries are independent production companies. 6. 2008/09 total expenditure (£285 million) was greater than total public funding (£256 million, Table 17.1) as expenditure was supplemented by earned/self-generated income, grants from trusts and foundations and transfers from reserves. 148 – UK Film Council Statistical Yearbook 2010
  • 151.
    1 2 Table 17.5 shows the Lottery awards made by the UK Table 17.6 Large awards (£250,000+) made by UK 3 Film Council in 2009. There were 303 awards in total Film Council, 2009 (253 in 2008), to a combined value of £24.4 million Amount of award (£15.6 million in 2008). Most of the awards were for Fund Project (total = 20) £ 4 relatively low amounts (£50,000 and under) made by Premiere Centurion 1,200,000 the Development and Prints and Advertising funds. Another Year 1,200,000 For a list of the individual project titles see www.ukfilmcouncil.org.uk/awards. Attack the Block 1,085,788 5 The King’s Speech 1,000,000 Table 17.5 UK Film Council Lottery awards, 2009 StreetDance 3D 1,000,000 6 Number Total value Brighton Rock 1,000,000 Fund of awards £ million Tracker 971,291 Development 150 4.2 Made in Dagenham 850,000 7 Prints and Advertising 112 4.2 Tamara Drewe 780,000 New Cinema 21 6.0 Africa United 500,000 8 Premiere 20 10.0 New Cinema Chatroom 700,000 Total large awards 303 24.4 Sex Drugs Rock Roll* 700,000 Source: UK Film Council. Submarine 700,000 9 Note: UK Film Council awards data are for calendar year 2009. Neds 650,000 The large awards (£250,000+) made by the UK Film Slave 610,000 Council in 2009 are shown in Table 17.6. The biggest First Grader 600,000 10 awards (£1.2 million) were for the Premiere Fund films Centurion and Another Year. The largest New Cinema Project Nim 510,095 Fund awards (£700,000) were for Chatroom, Sex Cirkus Columbia 430,000 11 Drugs Rock Roll and Submarine. There was only Self Made 250,000 one Prints and Advertising Fund award greater than Prints and Fifty Dead Men Walking 250,471 £250,000, Fifty Dead Men Walking (£250,471). Advertising 12 Source: UK Film Council. Note: UK Film Council awards data are for calendar year 2009. *Sex Drugs Rock Roll was noted in the 2009 Yearbook as a 2008 award, 13 but the date of its award was amended to 4 February 2009. 17.5 Leading public investors in British film 14 production, 2007–2009 Table 17.7 shows the leading public agency and public 15 service broadcaster investment in British films with budgets of £500,000+ for the calendar years 2007– 2009. The most frequent public investor was the 16 UK Film Council with 54 projects (combined budget £216 million), followed by Film4/Channel 4 (38 projects, combined budget £128 million) and BBC Films (36 17 projects, £157 million). These budget figures are for the total budget of the films, including the share of the budget provided by private investors and pre-sales. 18 19 20 Chapter 17: Public investment in film in the UK– 149 21
  • 152.
    Table 17.7 Leadingpublic investors in British film production, 2007–2009 Estimated budget Public funder Number £ million Selected titles UK Film Council 54 216 Of which... Premiere Fund 29 170 Chéri, The Moon Princess, The King’s Speech, Centurion, Tamara Drewe, Nowhere Boy, Made in Dagenham, Another Year, Harry Brown New Cinema Fund 25 46 Neds, Chatroom, In the Loop, Cirkus Columbia, Genova, Submarine, Sex Drugs Rock Roll, Fish Tank Film4/Channel 4 38 128 The Eagle of the Ninth, Never Let Me Go, Route Irish, Chatroom, The Unloved, Looking for Eric, the Red Riding trilogy, In Bruges, Nowhere Boy, She a Chinese BBC Films 36 157 The Special Relationship, Creation, Brideshead Revisited, The Boys are Back, The Edge of Love, Tamara Drewe, Bright Star, Brighton Rock, The Damned United Welsh Agencies 15 51 Ironclad, Submarine, Mr Nice, Valhalla Rising, Patagonia Screen East 12 63 The Boat that Rocked, Easy Virtue, The Scouting Book for Boys Scottish Screen 10 35 The Eagle of the Ninth, Neds, Outcast, The Last Word Irish Film Board(1) 10 32 The Guard, Perrier’s Bounty, The Last Word Screen Yorkshire 10 20 The Damned United, the Red Riding trilogy, A Passionate Woman EM Media 9 16 Bronson, The Unloved, Pelican Blood Northern Ireland Screen 8 58 Hunger, Fifty Dead Men Walking, Your Highness Screen West Midlands 8 10 Nativity, Clubbed, The Children Source: UK Film Council production tracking. Includes films with budgets £500,000+ only. In some cases more than one public agency contributed funding to the same film, so there is some double counting of budgets in the above table. Hence there is no ‘total budget’ row. Data in this table are for the calendar years 2007–2009. Note: 1. The Irish Film Board was one of a number of overseas public agencies that part-funded British films during the period. Others included Screen Australia, Icelandic Film Centre, Isle of Man Film, Filmburo Bremen, Medienboard Berlin-Brandenburg, Filmstiftung Nordrhein-Westfalen, Fonds Sud (France) and the New Zealand Film Fund. „ 3F or more information on film production in the UK see Chapter 16 (page 132) 3F or more information on the UK film economy see Chapter 20 (page 171) 3 For more information on UK film companies, see Chapter 19 (page 161) 150 – UK Film Council Statistical Yearbook 2010
  • 153.
    Chapter 18: Film education Filmeducation provides Facts in focus children and young people • lmost 68,000 students were entered for GCSE media A studies related subjects in 2008/09, up 95% in six years. with a structured, systematic • ver 1.9 million children have attended National Schools O opportunity to watch films, Film Week screenings over the last decade. to understand films and even • ver the last decade First Light has supported the O production of 878 short films involving over 13,000 to make films as part of their children and young people. preparation for adult life. • here were 3,815 students enrolled in higher T For adults, film education education film studies courses in 2008/09, an increase of 235% on 2002. is a stimulating part of • here were 31,000 admissions to BFI Southbank T lifelong learning. education events in 2009, and 172,000 video streaming requests were made via the Screenonline website. • here is evidence that 355 moving image education T providers were operating in the UK in 2009, with over one-fifth production companies and one-fifth venues.
  • 154.
    18.1 Introduction Learning andparticipation are at the heart of an imaginative, diverse and vibrant film culture and can take many different forms. Film education takes place in both formal and informal settings, from schools and colleges to voluntary interest groups like youth clubs and film societies. There is a wide range of film education activity in the UK but there has been little attempt to quantify this activity across the many types of provision. This chapter, a new addition to the Statistical Yearbook, is intended as a first step in addressing the information gap and establishes baseline data which can be built upon in the future. From this initial attempt, it is hoped that additional research and data acquisition will enhance our understanding of the film education landscape. 18.2 Film education in formal education settings In practice, film education activity involves watching and listening to a range of film texts, discussing and analysing them; generating discursive and written work, storyboards and scripts; making films and re-purposing archive material. Outside of dedicated film and media studies courses, film is also used in other parts of the curriculum such as in English or modern languages. However, relatively little data exists on film education in the curriculum before Key Stage 4. There has been a 95% increase in the number of students entering GCSE media, film or TV studies in the UK (Table 18.1). Almost 68,000 students were enrolled in 2008/09, 1.2% of all GCSE entries. The WJEC (known previously as the Welsh Joint Education Committee) offers a film studies GCSE. In 2009 there were 1,284 candidates across the UK for this subject, rising to 3,286 in 2010. Table 18.1 Entries for GCSE media/film/TV studies in England, Wales and Northern Ireland, 2003–2009 Number of media/film/TV % change studies entries 2003/04 2004/05 2005/06 2006/07 2007/08 2008/09 2004–2009 England 36,829 42,483 54,126 62,683 65,693 63,685 +73 Northern Ireland 772 785 780 868 842 849 +10 Wales 2,219 2,415 2,615 2,874 3,288 3,438 +55 Total 39,820 45,683 57,521 66,425 69,623 67,972 +95 All GCSE entries 5,875,373 5,736,505 5,752,152 5,827,319 5,669,077 5,469,260 –7 Source: Joint Council for Qualifications (JCQ). Note: Scotland not included because of separate examinations system. The number of students taking GCE A Level media/film or TV studies in the UK has risen by 40% since 2003 (Table 18.2). There were almost 34,000 entries in 2008/09, 4% of all A Level entries. Table 18.2 Entries for GCE A Level media/film/TV studies in England, Wales and Northern Ireland, 2002–2009 Number of % change media/film/TV studies entries 2002/03 2003/04 2004/05 2005/06 2006/07 2007/08 2008/09 2003–2009 England 22,743 25,425 26,633 29,123 30,036 30,651 31,618 +39 Northern Ireland 364 377 468 602 654 745 897 +146 Wales 1,072 1,092 1,160 1,239 1,252 1,353 1,307 +22 Total 24,179 26,894 28,261 30,964 31,942 32,749 33,822 +40 All GCE A Level entries 750,537 766,247 783,878 805,698 805,657 827,737 846,977 +13 Source: Joint Council for Qualifications (JCQ). Note: Scotland not included because of separate examinations system. 152 – UK Film Council Statistical Yearbook 2010 Image: Looking for Eric courtesy of Icon Film Distribution
  • 155.
    1 2 The number of entries for Scottish Higher media studies has seen a 10% decline since 2003 (Table 18.3). 3 Table 18.3 Entries for Scottish Higher media studies, 2003–2009 % change 4 2003 2004 2005 2006 2007 2008 2009 2003–2009 Number of media studies entries 851 827 814 843 819 797 765 –10 5 All entries 166,885 165,575 164,142 159,140 161,081 162,576 167,792 +0.5 Source: Scottish Qualifications Authority. The WJEC offers a dedicated film studies qualification available to schools throughout the UK. In 2009 there were 6 6,674 A Level candidates completing (up 109% since 2003) and 11,800 AS Level candidates completing (Table 18.4). 7 Table 18.4 Candidates completing GCE A and AS Level film studies, 2003–2009 % change 2003 2004 2005 2006 2007 2008 2009 2003–2009 8 A Level film studies entries 3,197 4,162 4,907 5,965 6,598 6,552 6,674 +109 AS Level film studies entries 7,200 8,249 9,405 9,908 9,915 11,052 11,800 +64 Source: WJEC. 9 Film Education is an organisation funded by the film industry to provide structured programmes for the teaching of film criticism and appreciation and offers professional development opportunities and resources for teachers. 10 Film Education has 15,817 primary schools (69% of the total) and 5,012 secondary schools (88% of the total) on its database – these figures represent any school that has taken students to a cinema-based event, has teachers that have used resources or paid to send a teacher to a training event. With almost 67,000 teacher contacts on the 11 database, the reach of Film Education is estimated to be 2.2 million pupils and students annually. Its flagship festival, National Schools Film Week, is the largest event of its kind in the world. In 2009, over 392,000 schoolchildren visited the cinema for free as part of the event (Table 18.5). 12 Table 18.5 Attendances at National Schools Film Week and other Film Education screenings, 2001–2009 2001 2002 2003 2004 2005 2006 2007 2008 2009 13 National Schools Film Week attendances 102,880 75,490 105,392 125,761 213,794 259,964 298,586 335,733 392,452 14 Other Film Education screenings n/a n/a 25,755 24,803 12,737 35,756 34,188 23,754 13,481 15 Source: Film Education. 16 17 18 19 20 Chapter 18: Film Education – 153 21
  • 156.
    Media studies ingeneral, and film studies in particular, also has a strong presence in UK higher education. Over 28,000 students were enrolled on media studies related courses in 2008/09, up 26% in six years (Table 18.6). The film studies subject area saw a 235% increase in numbers over the same period, from 1,140 first degree and postgraduate students in 2003 to 3,815 in 2009. Table 18.6 Higher education students in the subject area media studies, 2002–2009 % change 2002/03 2003/04 2004/05 2005/06 2006/07 2007/08 2008/09 2002–2009 All media studies related courses 22,495 26,135 26,495 26,665 27,010 28,085 28,245 +26 Media studies 17,300 20,215 20,205 19,785 18,995 17,860 17,595 +2 Film studies 1,140 1,490 1,840 2,155 2,540 3,610 3,815 +235 Film production 100 135 165 420 545 520 530 +430 Source: HESA Student Record 2002/03–2008/09. © Higher Education Statistics Agency Limited 2010. HESA cannot accept responsibility for any inferences or conclusions derived from the data by third parties. Notes: Includes first degree, postgraduate and other degrees. Media studies related courses include media, film, television, radio, electronic and print-based media studies courses. In the last few years Skillset, the Sector Skills Council for Creative Media, together with the film industry, has worked closely with further and higher education institutions to identify and establish a network of Skillset Screen Academies recognised as existing centres of excellence in film education in the UK. Members of the network are endorsed by the film industry as providers of the highest standard of relevant vocationally orientated education, training and development at a further, higher and postgraduate level. In 2009/10 the network offered 51 courses (diploma, undergraduate and postgraduate qualifications) with 2,240 students enrolled. 18.3 National and regional film education providers The British Film Institute (BFI) is the main UK-wide agency for promoting understanding and appreciation of moving image culture, education and cinema heritage. It runs programmes for learners of all ages at BFI Southbank, as well as providing resources via telephone, in print and online to support film education and research across the UK. Table 18.7 provides details of some of the BFI’s main education activities. In 2008/09 there were 30,999 admissions to BFI Southbank education events (up 53% on 2004/05) and 5,698 education admissions to BFI Festivals (up 5% on 2004/05). Visits to the BFI National Library have remained largely unchanged over the last five years (around 12,000 visits per year) and there were almost 20,000 BFI information service enquiries in 2008/09. The BFI Screenonline website (www.screenonline.org.uk) is a web-based encyclopaedia of British film and television featuring hundreds of hours of clips from the BFI National Archive, supplemented by contextual material, stills, posters and press books. Users in UK schools, colleges, universities and libraries can access the entire site for free, and in 2008/09 there were over 172,000 video streaming requests. 154 – UK Film Council Statistical Yearbook 2010
  • 157.
    1 2 Table 18.7 BFI education activity, 2004–2009 3 2004/05 2005/06 2006/07 2007/08 2008/09 BFI Southbank education event admissions 19,625 15,149 12,648 33,945 30,000 4 BFI Festivals – education admissions 5,451 4,881 4,106 3,733 5,698 BFI National Library visits n/a 12,331 11,919 11,905 12,024 BFI information service enquiries n/a 27,044 25,655 25,711 19,539 5 BFI Screenonline video streaming requests n/a n/a n/a n/a 172,142* Sales of BFI education resources of which… copies of short film resources** n/a n/a n/a n/a 3,618 6 copies of other resources n/a n/a n/a n/a 1,301 Source: BFI. *80% of requests from schools and colleges outside London. 7 **Each resource reaches an average of 50 students or pupils. Over many years, schools have organised and run film clubs for their pupils on an ad hoc basis, showing films either for enjoyment or as part of curriculum-based activity. Unfortunately, historical data showing the number of such 8 clubs operating in the UK is unavailable. In 2007, FILMCLUB was established with the intention of setting up a UK-wide school-based network of film clubs 9 that would allow young people the chance to experience characters, images, cultures and stories they would never normally be exposed to. A pilot scheme involving 800 children and young people from 25 schools in England ran between January and March 2007, during which schools held 152 screenings of 89 films for different age groups 10 between 5 and 18. By the end of 2009, there were 2,901 school film clubs in England (2,978 across the whole UK) with an estimated 90,000 pupils involved (92,000 in the UK). A total of 3,040 schools and 3,700 staff members have taken part in the 11 initiative and 35,837 films (1,876 unique titles) have been supplied to film clubs. The range of films ordered by the film clubs are diverse – in 32 languages and set in over 100 countries. Table 18.8 outlines the regional distribution of film clubs in England. 12 Table 18.8 Regional distribution of FILMCLUB schools in England, 2009 % of 13 % of % of pupils in FILMCLUB % of pupils in general Region schools schools online schools population 14 East Midlands 10.6 9.3 9.5 8.5 East of England 9.3 11.6 10.0 11.1 London 15.4 9.8 16.8 15.0 15 North East 8.1 4.9 6.3 4.9 North West 11.3 15.3 10.9 13.8 South East 17.5 16.5 17.3 16.0 16 South West 10.2 9.4 10.3 9.6 West Midlands 7.0 11.9 7.8 11.1 17 Yorkshire and Humber 10.6 11.3 11.0 10.0 Source: FILMCLUB. 18 19 20 Chapter 18: Film Education – 155 21
  • 158.
    Learning about filmcan be enhanced by practical involvement in filmmaking activity, which gives learners the opportunity to see for themselves how images and sounds are recorded and combined to create meaningful stories. There are a number of opportunities to gain filmmaking experience outside of professional film production. One of these, First Light, was established to fund and mentor children and young people aged five to 19 to make short digital films. Over the last decade it has supported the production of 878 films involving over 13,000 children and young people (Table 18.9). First Light is also the lead partner for the Mediabox consortium, funded by the Department for Education (formerly Department for Children, Schools and Families), which offers disadvantaged 13- to 19-year-olds the opportunity to develop and produce creative media projects, using film, television, print, radio, games, interactive or online platforms. During 2007/08 and 2008/09, Mediabox enabled over 9,400 young people to participate in the making of 317 films. Table 18.9 First Light projects, 2001–2009 Year 2001/02 2002/03 2003/04 2004/05 2005/06 2006/07 2007/08 2008/09 Number of films made 10 155 121 150 114 121 117 90 Number of young people participating 143 2,178 1,988 2,470 1,694 1,644 1,840 1,291 Source: First Light. 18.4 Public investment in film education A total of £19.1 million was spent on education, young people and lifelong learning in 2008/09 by the national agencies described above and the screen agencies of the nations and regions (Table 18.10). However, this analysis does not include all film education spend, particularly investments in film-based learning activities made by local authorities, schools, further and higher education institutions and some of the third-party providers described in section 18.5. Table 18.10 Public expenditure on film education by agency, 2008/09 Agency £ BFI 9,317,000 First Light (including Mediabox) 3,418,502 FILMCLUB 3,100,000 Northern Ireland Screen 680,878 Scottish Screen 589,000 UK Film Council 461,315 Screen East 273,323 Screen West Midlands 223,695 EM Media 211,212 North West Vision and Media 142,180 Screen South 136,915 Northern Film and Media 133,894 South West Screen 125,773 Film Agency for Wales 89,856 Screen Yorkshire 86,342 Film London 70,680 Total 19,060,564 Source: UK Film Council, Northern Alliance. 156 – UK Film Council Statistical Yearbook 2010
  • 159.
    1 2 18.5 Moving image education providers in the UK 3 In addition to the activity described above, there are a number of other organisations involved in the delivery of film education in the UK. The UK Film Council has undertaken some primary research on moving image education providers and has compiled a database from information supplied by the national and regional screen agencies, 4 First Light, Media Education Wales, Screen West Midlands REd REx network, the MovIES network, Arts Council England’s national and regional offices and others. It includes details of organisations actively engaged in providing moving image education directly to learners as part of their core activity. It does not include organisations which 5 fund such activity or support it through the provision of learning resources, nor does it include schools, colleges or universities (although many of the organisations in the database work with formal education institutions). Neither does it include organisations that solely deliver industry training, but it does include training bodies that 6 operate non-vocational educational programmes alongside their training activity. Finally, it does not include organisations that solely provide teacher training and Continuing Professional Development (CPD). The database is intended to help the UK Film Council and its partners to better understand the range and nature 7 of moving image education provision across the UK. There is evidence that 355 moving image education providers were operating in the UK as at 24 February 2010 8 (Table 18.11). The largest proportion of moving image education providers is found in London (15% of the total). The East Midlands, Yorkshire, the North East, Scotland, Wales and Northern Ireland all have a higher proportion of providers than their UK population share. The reverse is true for the West Midlands, South East, South West, 9 North West and the East of England. Table 18.11 Number of moving image education providers by nation/region, 2010 10 % Nation/region Number % UK population London 54 15.2 12.4 11 East Midlands 37 10.4 7.2 Yorkshire and Humber 33 9.3 8.5 12 West Midlands 28 7.9 8.8 South East 27 7.6 13.6 South West 26 7.3 8.5 13 North West 24 6.8 11.3 North East 20 5.6 4.2 East of England 12 3.4 9.3 14 England sub-total 261 73.5 83.8 Scotland 38 10.7 8.4 15 Northern Ireland 30 8.5 2.9 Wales 26 7.3 4.9 UK total 355 100.0 100.0 16 Source: UK Film Council Moving Image Education Providers Database. Just over one-fifth (22%) of all moving image education providers are production companies, and one in five (19%) 17 are venues (Table 18.12). Arts organisations make up 17% of providers while education/training organisations contribute to a further 14%. 18 19 20 Chapter 18: Film Education – 157 21
  • 160.
    Table 18.12 Numberof moving image education providers by type, 2010 Type Number % Production company/corporate video 77 21.7 Venue 66 18.6 Arts organisation 59 16.6 Education/training 49 13.8 Participatory media 35 9.9 Festival 26 7.3 Archive 20 5.6 Community Group 17 4.8 Other 6 1.7 Total 355 100.0 Source: UK Film Council Moving Image Education Providers Database. Notes: ‘Production company/corporate video’ includes feature and short film production companies and businesses offering corporate video services. ‘Venue’ includes cinemas, film clubs and local authority-run mixed arts venues that offer in-house education activities. ‘Arts organisation’ includes community arts projects, artist collectives and art galleries that offer moving image based activity. ‘Education/training’ includes dedicated education and/or training providers, often working in partnership with formal education institutions. ‘Participatory media’ includes non-profit, community-based filmmaking enterprises. ‘Festival’ includes film festivals that offer a dedicated education strand. ‘Archive’ includes moving image archives offering dedicated education activities. ‘Community group’ includes youth clubs and other local groups that offer filmmaking opportunities as part of their core activity. ‘Other’ includes membership based organisations that offer education opportunities (eg professional networks) and museums. Over six out of 10 (64%) moving image education providers offer production-based learning opportunities, and a further 17% offer a mix of production- and exhibition-based education (Table 18.13). Learning activity through watching films (exhibition-based) is offered by 14% of providers, while 6% offer archive-based learning. Table 18.13 Type of provision given by moving image education providers, 2010 Type Number % Production-based 227 63.9 Mixed 60 16.9 Exhibition-based 48 13.5 Archive-based 20 5.6 Total 355 100.0 Source: UK Film Council Moving Image Education Providers Database. Notes: ‘Production-based’ provision involves learning through making films or animation. ‘Exhibition-based’ provision involves learning through watching films. ‘Mixed’ provision involves learning through making and watching films (although not necessarily within the same course or workshop). ‘Archive-based’ provision involves learning through watching archive films and/or using them in creative activity. 158 – UK Film Council Statistical Yearbook 2010
  • 161.
    1 2 Two-thirds (67%) of moving image education providers offer learning opportunities to all age groups (Table 18.14). 3 A sizeable minority (30%) specialise in providing learning opportunities for children and young people. Table 18.14 Learner age group of moving image education providers, 2010 4 Type Number % All ages 237 66.8 5 Children and young people 105 29.6 Adults 13 3.7 Total 355 100.0 6 Source: UK Film Council Moving Image Education Providers Database. Notes: ‘All ages’ – the provider offers learning opportunities for all ages. 7 ‘Children and young people’ – the provider specialises in learning opportunities for children and young people (commonly aged up to 19 years, but can include up to 25 years). ‘Adults’ – the provider specialises in learning opportunities for adults (commonly aged 19+). Table 18.15 provides a breakdown of the type of provision by learner age group. Production-based activity accounts 8 for 84% of child-focused learning activity, 77% of adult opportunities and 54% of opportunities for all ages. Table 18.15 Type of moving education provision by learner age group, 2010 9 Production-based Exhibition-based Archive-based Mixed Children 88 9 0 8 10 Adults 10 1 0 2 All 129 38 20 50 Total 227 48 20 60 11 Source: UK Film Council Moving Image Education Providers Database. Finally, Table 18.16 shows the national and regional breakdown of type of moving image education provision. 12 Exhibition-based activity plays a proportionally greater role in Yorkshire (27%), North West and West Midlands (both 21%) and London (17%). Archive-based activity is a key feature of moving image education provision in Northern Ireland, accounting for 47% of all activity. 13 14 15 16 17 18 19 20 Chapter 18: Film Education – 159 21
  • 162.
    Table 18.16 Typeof moving education provision by nation/region, 2010 Production-based Exhibition-based Archive-based Mixed Total East Midlands 27 4 1 5 37 East England 7 1 0 4 12 London 39 9 0 6 54 North East 17 1 0 2 20 North West 15 5 1 3 24 Northern Ireland 6 3 14 7 30 Scotland 29 3 1 5 38 South East 19 3 1 4 27 South West 17 3 0 6 26 Wales 14 1 1 10 26 West Midlands 16 6 0 6 28 Yorkshire 21 9 1 2 33 Source: UK Film Council Moving Image Education Providers Database. „ 3F or more information on public investment in film in the UK see Chapter 17 (page 143) 3T o access the UK Film Council Moving Image Education Database please go to: www.21stcenturyliteracy.org.uk/resources.php?type=film_making 3 For more information on the film education providers described in this chapter, please see the following links: www.21stcenturyliteracy.org.uk www.bfi.org.uk www.filmclub.org www.filmeducation.org www.firstlightonline.co.uk www.media-box.co.uk www.skillset.org 160 – UK Film Council Statistical Yearbook 2010
  • 163.
    Chapter 19: Film industrycompanies In the UK the film sectors Facts in focus with the largest numbers of • n 2009, there were nearly 5,000 film production I companies and 2,500 post-production companies companies are production and in the UK. post-production, though the • here were 420 film distributors and 225 exhibitors. T largest companies are found • he majority of companies were small (turnover under T £250,000) but more than 70% of turnover was accounted in distribution and exhibition. for by the 170 companies with turnover over £5 million. Across Europe, the US majors • he production, post-production and distribution sectors T are prominent but so also are were concentrated in London and the South East, while the exhibition sector was more dispersed. British exhibitors, French and • utside London and the South East there were significant O German production companies production and post-production clusters in the North West, South West, East of England and Scotland. and French distributors. • S majors, video distributors and exhibitors were U prominent in the top 14 UK film companies in 2008 (the most recent year for which comparable data are available).
  • 164.
    19.1 Number ofcompanies in the film and video industries The number of companies involved in the film and video industries has grown rapidly in the last 13 years, particularly in the production sector where the number of companies increased by 356% between 1996 and 2009, compared with the UK average of 56% (Table 19.1). Part of this growth reflects the improvement in coverage in 2008 when companies registered for PAYE but not VAT were added to the totals. In 2009, there were 7,965 film and video production companies, 460 film and video distributors and 225 exhibitors. Table 19.1 Number of companies by industry group, 1996–2009 Film and video Film and video Year production distribution Film exhibition UK all industries 1996 1,745 355 155 1,380,695 1997 2,460 360 160 1,547,175 1998 3,065 370 160 1,573,935 1999 3,460 380 165 1,595,705 2000 3,900 425 165 1,616,835 2001 4,185 485 190 1,623,025 2002 4,605 515 195 1,619,195 2003 5,065 530 205 1,623,715 2004 5,275 455 200 1,611,535 2005 5,785 445 200 1,631,540 2006 6,210 415 200 1,646,280 2007 6,575 400 200 1,673,835 2008 7,970 435 230 2,161,555 2009 7,965 460 225 2,152,400 Growth 1996–2009 (%) 356.4 29.6 45.2 55.9 Source: Office for National Statistics. Notes: From 1996 to 2007, data include only companies registered for VAT. For 2008 and 2009, data include in addition companies registered for PAYE but not registered for VAT, so give improved coverage of the company population. For 1996–2008 data are for 2003 Standard Industrial Classifications (SICs) 9211 (film and video production), 9212 (film and video distribution) and 9213 (film exhibition). For 2009, film and video production is the sum of 2007 SICs 59111 (film production), 59112 (video production) and 5912 (film, video and TV post-production), film and video distribution is the sum of 59131 (film distribution) and 59132 (video distribution) and film exhibition is 5914 (film exhibition). The introduction of the 2007 Standard Industrial Classifications makes possible a more detailed breakdown of the sector, as shown in Tables 19.2 and 19.3. This gives, for the first time, a view of film production and distribution separately from video production and distribution, and confirms that film production and distribution make up the majority of the sector. However, it is interesting to note the size of the post-production sector – 29% of companies and 16% of turnover – previously included in the film and video production total. 162 – UK Film Council Statistical Yearbook 2010 Image: The King’s Speech courtesy of Momentum Pictures
  • 165.
    1 2 Table 19.2 Number of film and video companies by sub-sector, 2009 3 Sub-sector Number of companies % of total Film production 4,905 56.7 4 Video production 590 6.8 Film, video and TV post-production* 2,470 28.6 Film distribution 420 4.9 5 Video distribution 40 0.5 Film exhibition 225 2.6 Total 8,650 100.0 6 Source: Office for National Statistics. *Companies in the post-production sector usually work on films, commercials, videos and television programmes, and therefore have a combined statistical classification. Data as at March 2009. 7 Percentages may not sum to 100.0 due to rounding. Although film distributors were only 5% of the companies, they accounted for 36% of the turnover (Table 19.3) in 2009. This reflects the dominant position of the UK subsidiaries of the major Hollywood studios in the film 8 value chain. 9 Table 19.3 Turnover of film and video companies by sub-sector, 2009 Sub-sector Turnover £000s % of total Film production 2,471,123 30.8 10 Video production 204,281 2.5 Film, video and TV post-production* 1,267,039 15.8 11 Film distribution 2,872,355 35.8 Video distribution 188,624 2.4 Film exhibition 1,019,372 12.7 12 Total 8,022,794 100.0 Source: Office for National Statistics. *See note to Table 19.2. 13 Data as at March 2009. 14 19.2 Size distribution of film companies The size distribution of film companies is shown in Tables 19.4 to 19.7. While the majority of companies were very small (turnover less than £250,000 per year) over 70% of turnover was accounted for by the 170 companies with 15 turnover greater than £5 million. The concentration was particularly high in film distribution (Table 19.6) where the 30-largest companies accounted for 94% of turnover. In exhibition the large company turnover concentration was close to 90% (Table 19.7), though the Office for National Statistics was not able to release the precise number for 16 confidentiality reasons. 17 18 19 20 Chapter 19: Film industry companies – 163 21
  • 166.
    Table 19.4 Sizedistribution of film production companies, 2009 Turnover size band £000s Number % Turnover % 5,000 + 85 1.7 1,338,074 54.1 1,000 – 4,999 290 5.9 545,204 22.1 500 – 999 230 4.7 149,376 6.0 250 – 499 440 9.0 148,086 6.0 100 – 249 1,165 23.8 169,223 6.8 50 – 99 1,255 25.6 87,476 3.5 0 – 49 1,440 29.4 33,684 1.4 Total 4,905 100.0 2,471,123 100.0 Source: Office for National Statistics. Data as at March 2009. Percentages may not sum to 100.0 due to rounding. Table 19.5 Size distribution of post-production companies, 2009 Turnover size band £000s Number % Turnover % 5,000 + 45 1.8 754,053 59.5 1,000 – 4,999 115 4.7 233,510 18.4 500 – 999 105 4.3 69,984 5.5 250 – 499 170 6.9 61,129 4.8 100 – 249 470 19.0 70,813 5.6 50 – 99 830 33.6 59,013 4.7 0 – 49 735 29.8 18,537 1.5 Total 2,470 100.0 1,267,039 100.0 Source: Office for National Statistics. Data as at March 2009. Percentages may not sum to 100.0 due to rounding. Table 19.6 Size distribution of film distribution companies, 2009 Turnover size band £000s Number % Turnover % 5,000 + 30 7.1 2,709,356 94.3 1,000 – 4,999 50 11.9 98,396 3.4 500 – 999 45 10.7 29,854 1.0 250 – 499 50 11.9 15,815 0.6 100 – 249 85 20.2 11,826 0.4 50 – 99 75 17.9 5,448 0.2 0 – 49 85 20.2 1,660 0.1 Total 420 100.0 2,872,355 100.0 Source: Office for National Statistics. Data as at March 2009. Percentages may not sum to 100.0 due to rounding. 164 – UK Film Council Statistical Yearbook 2010
  • 167.
    1 2 Table 19.7 Size distribution of film exhibition companies, 2009 3 Turnover size band £000s Number % Turnover % 5,000 + 10 4.4 c – 4 1,000 – 4,999 35 15.6 76,010 7.5 500 – 999 40 17.8 c – 250 – 499 25 11.1 c – 5 100 – 249 45 20.0 7,221 0.7 50 – 99 30 13.3 c – 0 – 49 40 17.8 1,554 0.2 6 Total 225 100.0 1,019,372 100.0 Source: Office for National Statistics. 7 ‘c’ Indicates the data have been made confidential by the Office for National Statistics to avoid disclosing details of individual companies. Data as at March 2009. 8 19.3 National/regional distribution of film companies in the UK Tables 19.8 and 19.9 show the national/regional distribution of film companies and film company turnover in 2009. Overall, 68% of film companies were concentrated in London and the South East and over 85% of turnover was 9 generated by companies located in these two regions. The London concentration was particularly strong for distribution (55% of companies and 97% of turnover) but the exhibition sector was more evenly distributed across the UK, with 71% of companies and 48% of turnover associated with companies based outside London. 10 While London and the South East dominate in production and post-production, there are significant national and regional centres, particularly in the North West, the East of England, the South West and Scotland (Table 19.9). 11 Table 19.8 National/regional distribution of film companies, 2009 Film production Post-production Film distribution Film exhibition Total UK Film 12 Number % Number % Number % Number % Number % London 2,685 54.7 1,270 51.4 230 54.8 65 28.9 4,250 53.0 13 South East 675 13.8 440 17.8 75 17.9 20 8.9 1,210 15.1 East of England 285 5.8 160 6.5 30 7.1 30 13.3 505 6.3 South West 285 5.8 170 6.9 15 3.6 15 6.7 485 6.0 14 North West 210 4.3 105 4.3 20 4.8 10 4.4 345 4.3 Scotland 170 3.5 75 3.0 10 2.4 15 6.7 270 3.4 15 West Midlands 130 2.7 55 2.2 15 3.6 10 4.4 210 2.6 Yorkshire and The Humber 130 2.7 55 2.2 10 2.4 15 6.7 210 2.6 Wales 115 2.3 45 1.8 5 1.2 10 4.4 175 2.2 16 East Midlands 105 2.1 40 1.6 5 1.2 15 6.7 165 2.1 North East 70 1.4 30 1.2 5 1.2 5 2.2 110 1.4 17 Northern Ireland 45 0.9 25 1.0 0 0.0 15 6.7 85 1.1 Total UK 4,905 100.0 2,470 100.0 420 100.0 225 100.0 8,020 100.0 Source: Office for National Statistics. 18 Data as at March 2009, for business enterprises. Percentages may not sum to 100.0 due to rounding. 19 20 Chapter 19: Film industry companies – 165 21
  • 168.
    Table 19.9 National/regionaldistribution of film company turnover, 2009 Film production Post-production Film distribution Film exhibition Total UK Film Turnover % Turnover % Turnover % Turnover % Turnover % London 1,628,593 65.9 954,103 75.3 2,774,962 96.6 529,791 52.0 5,887,449 77.2 South East 445,914 18.0 150,619 11.9 48,811 1.7 c c c c South West 77,038 3.1 28,362 2.2 2,335 0.1 c c c c North West 76,356 3.1 24,118 1.9 6,957 0.2 c c c c East of England 71,910 2.9 29,730 2.3 26,961 0.9 27,571 2.7 156,172 2.0 Scotland 61,294 2.5 15,858 1.3 2,250 0.1 7,357 0.7 86,759 1.1 Yorkshire and The Humber 31,088 1.3 12,284 1.0 c c 9,166 0.9 – – Wales 19,380 0.8 12,653 1.0 c c c c c c East Midlands 18,361 0.7 6,467 0.5 c c c c c c West Midlands 16,543 0.7 6,735 0.5 4,708 0.2 c c c c Northern Ireland 13,966 0.6 3,931 0.3 c c 28,562 2.8 c c North East 10,680 0.4 22,179 1.8 c c c c c c Total UK 2,471,123 100.0 1,267,039 100.0 2,872,355 100.0 1,019,372 100.0 7,629,889 100.0 Source: Office for National Statistics. ‘c’ Indicates the data have been made confidential by ONS to avoid disclosing details of individual companies. The geographic distribution of turnover is given by the location of the company, not its local units, so London concentration may be overstated for companies such as cinema chains that have local units around the UK. Data as at March 2009, for business enterprises. 166 – UK Film Council Statistical Yearbook 2010
  • 169.
    1 2 19.4 Leading film companies in the UK and Europe 3 Table 19.10 shows the top 14 film companies in the UK in 2008 as identified by the European Audiovisual Observatory. Several features stand out – the prominence of the US majors, the importance of undertaking multiple activities (production, distribution, rights, video) and the relatively high position of companies specialising in video 4 and exhibition. There is only one UK theatrical distributor on the list (Entertainment), one UK film finance company (Ingenious) and no stand-alone UK film production companies. 5 Table 19.10 Top 14 film companies in the UK, 2008 Rank Company Activities Operating revenues €000 6 1 Walt Disney International DISFILM, DISTV, RIGHTS, VID *1,535,974 2 Odeon and UCI Cinemas Group EXH 574,134 3 Cineworld Group EXH 313,725 7 4 VUE Entertainment Holdings (UK) EXH 298,006 5 20th Century Fox Home Entertainment VID *287,728 8 6 Warner Bros Entertainment UK DISFILM, PRODFILM 267,214 7 2 Entertain VID 258,565 8 Universal Pictures Productions RIGHTS, DISFILM, PRODFILM 251,981 9 9 Ingenious Film Partners PRODFILM, INVFILM *202,882 10 Paramount Home Entertainment (UK) VID 159,259 10 11 The Entertainment Group of Companies DISFILM, VID *145,153 12 Sony Pictures Home Entertainment VID *124,836 13 Universal Pictures International VID 100,014 11 14 20th Century Fox Film Company DISFILM *92,985 Source: European Audiovisual Observatory, 2009 Yearbook. *Indicates 2007 revenues. 12 Definitions: DISFILM = film distribution; DISTV = television distribution, RIGHTS = trade in television rights; VID = video; EXH = exhibition; PRODFILM = film production; INVFILM = film investment. 13 Across Europe, the US majors were prominent. They were joined by four French companies (Pathé, Europalaces, Canal+ and UGC), indicating the continued corporate strength of the French film industry, three British-based 14 exhibitors (Odeon, Cineworld and VUE), a Swedish distributor (Egmont Nordisk), an Italian producer (RAI), a Dutch producer/distributor (Embassy Eagle), a British video distributor (2 Entertain) and a German producer/distributor (Constantin Film/AG) (Table 19.11). 15 16 17 18 19 20 Chapter 19: Film industry companies – 167 21
  • 170.
    Table 19.11 Top20 film companies in Europe, 2008 Operating revenues Rank Company Activities Country €000 1 Walt Disney International DISFILM, DISTV, RIGHTS, VID UK *1,535,974 2 Groupe Pathé EXH, DISFILM, VID, RIGHTS, PRODFILM, TV FR 770,000 3 Odeon and UCI Cinemas Group EXH UK 574,134 4 Egmont Nordisk Film DISFILM, VID SE 472,000 5 Europalaces EXH FR 468,000 6 Warner Bros Entertainment Spain DISFILM ES *407,571 7 Groupe Canal+ PROD, DISFILM, RIGHTS, VID FR **394,000 8 UGC EXH, DISFILM, VID, RIGHTS, PRODFILM, FR 384,092 9 RAI Cinema PRODFILM, RIGHTS IT 373,851 10 Warner Bros Entertainment Germany DISFILM DE 338,843 11 Universal Pictures International VID, DISFILM NL *335,872 12 Cineworld Group EXH UK 313,725 13 VUE Entertainment Holdings (UK) EXH UK 298,006 14 Embassy Eagle Holdings PRODFILM, DISFILM NL *289,894 15 20th Century Fox Home Entertainment VID UK *287,728 16 Warner Bros Entertainment UK DISFILM UK *267,214 17 2 Entertain VID UK 258,565 18 United International Pictures DISFILM NL 268,458 19 Universal Pictures Productions RIGHTS, DISFILM, PRODFILM UK 251,981 20 Constantin Film PRODFILM, DISFILM, RIGHTS DE 251,324 Source: European Audiovisual Observatory, 2009 Yearbook, Table T.16.1. *Indicates 2007 revenues. **Indicates 2004 revenues. Definitions: DISFILM = film distribution; DISTV = television distribution, RIGHTS = trade in television rights; VID = video; EXH = exhibition; PRODFILM = film production; TV = television. 19.5 Leading film production companies in the UK and Europe Looking at film production only, we see that 11 out of the top 20 European independent production companies in 2008 were French (up from nine in 2007), four Italian, two German, two Nordic, and one British. As in previous years, the list was topped by Constantin Film AG of Germany, the maker of Perfume, Downfall and the Fantastic Four and Resident Evil films. Europacorp (France) and Filmauro (Italy) came second and third. The UK is under-represented in this table due to the frequent use of special purpose vehicles (companies set up to make a single film) and the US studio connections of a number of the UK’s leading production companies. 168 – UK Film Council Statistical Yearbook 2010
  • 171.
    1 2 Table 19.12 Top 20 independent film production companies in Europe, 2008 3 Operating revenues Rank Company Nationality €000 1 Constantin Film AG DE 248,500 4 2 EuropaCorp FR 207,318 3 Filmauro IT *121,994 5 4 Gaumont FR 105,100 5 Nordisk Film AS NO *98,700 6 Ingenious Film Partners LLP UK *97,930 6 7 Pathé Production FR *90,357 8 Odeon Film AG DE 89,768 9 AB Svensk Filmindustri SE 78,890 7 10 Cattleya IT 62,979 11 Fidélité Films FR *62,202 8 12 La Petite Reine FR *56,840 13 Galatée Films FR 54,570 14 Fandango IT *40,227 9 15 Pan Européenne Production FR **37,301 16 Produire à Paris FR 36,518 10 17 MK2 SA FR 36,335 18 Melampo Cinematografica IT 36,034 19 UGC YM FR 35,765 11 20 Pulsar Productions FR 33,649 Source: European Audiovisual Observatory, 2009 Yearbook, Table T.16.3. *Indicates 2007 revenues. 12 **Indicates 2006 revenues. Drawing on the UK Film Council’s production database and public information, Table 19.13 presents the top 13 16 production companies involved in the production of films in the UK over the three-year period 2007 to 2009. Film and Music Entertainment came top of the list with 10 films, followed by Matador Pictures with eight and Working Title and Revolution Films with seven each. 14 Table 19.13 also illustrates the range of budgets for UK films. At the low end, Warp X and Slingshot were each involved in the production of four films with an estimated combined budget of £4 million. At the upper end, Heyday Films, working with Warner Bros (UK) on the Harry Potter films, was involved in four productions with a combined 15 budget of several hundred million pounds. 16 17 18 19 20 Chapter 19: Film industry companies – 169 21
  • 172.
    Table 19.13 Top16 production companies involved in UK production, 2007–2009 Estimated combined budget Production company Number of films £ million Selected titles Film and Music 10 12 White Lightnin’, Donkey, Mission London, Entertainment Reykjavik Whale Watching Massacre, The Italian Key Matador Pictures 8 17 Book of Blood, The Last Princess, Wild Target, Dread, Jackboots on Whitehall Working Title Films 7 170 Green Zone, The Soloist, Wild Child, Nanny McPhee and the Big Bang, The Boat That Rocked Revolution Films 7 20 The Killer Inside Me, Genova, Red Riding 1974, 1980 and 1983, The Unloved Vertigo Films 6 13 Bronson, The Firm, StreetDance 3D, The Heavy Palm Tree Entertainment 6 5 Sisters Grimm, Back Burner, Inside Out, Seven Crosses Fragile Films 5 30 Easy Virtue, Dorian Gray, St Trinian’s 2: The Legend of Fritton’s Gold, Celador Films 5 20 Slumdog Millionaire, Centurion, The Scouting Book for Boys Black and Blue Films Ltd 5 8 Devil’s Playground, Dead Cert, Just for the Record Heyday Films Ltd 4 * The Boy in the Striped Pyjamas, Harry Potter and the Half-Blood Prince, Harry Potter and the Deathly Hallows The Weinstein Company 4 90 Nine, The King’s Speech, Shanghai Potboiler Productions 4 24 Blindness, Happy-Go-Lucky, Slave Ruby Films 4 14 Tamara Drewe, Chatroom, Fish Tank Sixteen Films 4 14 Route Irish, Looking for Eric, Summer Warp X Films 4 4 Hush, Donkey Punch, She a Chinese Slingshot Productions 4 4 Tormented, French Film, Faintheart Source: UK Film Council. Companies ranked by number of films produced, then by estimated combined budget. ‘Estimated combined budget’ is the sum of the estimated budgets of all the films associated with the named company. It is not a measure of that company’s contribution to the budget. Most films had a number of production companies associated with them and funding came from a variety of sources including equity investment, US studio investment, distributor minimum guarantees and television pre-sales. The table includes all those companies associated with four or more films over the three-year period. *The estimated combined budget of Heyday’s films is in the order of several hundred million pounds, but the estimate has been omitted to avoid disclosing the budgets of individual Harry Potter films. „ 3F or Film4 and BBC Films see Chapter 17 (page 143) 3F or film production company activity levels in 2009 see Chapter 16 (page 132) 3 For US studio involvement in UK film production in 2009 see Chapter 16 (page 132) 3 For leading film distributors in the UK in 2009 see Chapter 8 (page 60) 3F or leading film exhibitors in the UK in 2009 see Chapter 9 (page 65) 3F or numbers and size distribution of film workplaces in 2008 see Chapter 21 (page 182) 170 – UK Film Council Statistical Yearbook 2010
  • 173.
    Chapter 20: The UKfilm economy The film industry is significant Facts in focus in the UK economy, making • n 2008, the UK film industry had a total turnover I of £6.8 billion. a substantial contribution to • ts direct contribution to UK GDP was £3.1 billion, I Gross Domestic Product (GDP) 0.2% of the total. and the balance of payments. • he core UK film industry (film production plus T distribution and exhibition of UK films) contributed Film exports hit an all time £1.6 billion directly to GDP and £4.6 billion including high of £1.3 billion in 2008, all indirect effects. generating a trade surplus • he UK facilities sector had a turnover of £403 million T derived from film in 2008. of £494 million. • he industry exported £1,341 million worth of services T in 2008, made up of £792 million in royalties and £549 million in film production services. • xports in 2008 were 92% higher than in 2001. E • he UK film trade surplus in 2008 was £494 million. T
  • 174.
    20.1 Film industryturnover, 1995–2008 Figure 20.1 shows the total turnover of the UK’s film sectors (production, distribution and exhibition) for the period 1995 to 2008. Each of the three sectors has shown strong growth over this period, with the total industry turnover increasing from £2 billion in 1995 to £6.8 billion in 2008. Figure 20.1 Total turnover of UK film industry by sector, 1995–2008 £ million 8,000 7,000 6,000 5,000 4,000 3,000 2,000 1,000 0 1995 1996 1997 1998 1999 2000 2001 2002 2003 2004 2005 2006 2007 2008 % change 1995–2008 Film and 829 1,514 1,612 1,306 1,589 2,334 1,402 1,389 2,119 2,281 2,280 3,693 2,852 2,579 211.1 video production Film and 895 1,385 1,328 1,521 1,555 1,494 1,271 1,721 1,718 2,030 2,450 2,125 2,105 3,069 242.9 video distribution Film 329 420 527 485 485 519 828 871 987 1,065 1,065 976 1,022 1,143 247.4 exhibition Total 2,053 3,319 3,467 3,312 3,629 4,347 3,501 3,981 4,824 5,376 5,795 6,794 5,979 6,791 230.8 Source: Office for National Statistics (ONS) Annual Business Inquiry. Notes: ‘Total turnover’ is expressed in current values, ie not adjusted for inflation. For 1995–2007 data are for 2003 SICs 9211 (film and video production), 9212 (film and video distribution) and 9213 (film exhibition). For 2008, film and video production is the sum of 2007 SICs 59111 (film production), 59112 (video production) and 5912 (film, video and TV post-production), film and video distribution is the sum of 59131 (film distribution) and 59132 (video distribution) and film exhibition is 5914 (film exhibition). SIC stands for Standard Industrial Classification. The introduction of the 2007 Standard Industrial Classifications (SICs) makes possible a more detailed breakdown of the sector, as shown in Table 20.1. This gives an official measure of film production and distribution separate from video production and distribution, and confirms that film production and distribution make up the majority of the sector. However, it is interesting to note the size of the post-production sector (16% of turnover) previously included in the film and video production total. 172 – UK Film Council Statistical Yearbook 2010 Image: Harry Potter and the Deathly Hallows: Part I © 2010 Warner Bros. Entertainment Inc. Harry Potter Publishing Rights © J.K.R.
  • 175.
    1 2 Table 20.1 Total turnover of UK film industry by sector, 2008, £ million 3 Sub-sector Turnover % of total Film production 1,197* 17.6 4 Video production 304 4.5 Film, video and TV post-production 1,078 15.9 Film distribution 2,895 42.6 5 Video distribution 174 2.6 Film exhibition 1,143 16.8 Sector total 6,791 100.0 6 Source: ONS Annual Business Inquiry. Notes: Companies in the post-production sector usually work on films, commercials, videos and television programmes and therefore have a combined statistical classification. 7 *The turnover shown for film production is lower than the equivalent figure in Table 19.3 (£2.5 billion) taken from the Interdepartmental Business Register (IDBR). The Annual Business Inquiry estimate is based on a relatively small sample of companies, whereas the IDBR number comes from HMRC data on VAT and PAYE. There is a case therefore for preferring the higher IDBR estimate. This would add £1.3 billion to the above estimate of industry turnover. 8 The total industry turnover expressed in real terms, ie with the effects of inflation removed, is shown in Figure 20.2. The real increase has been large: 124% for film and video production, 147% for film and video distribution and 150% for film exhibition. Overall, the industry more than doubled in size in real terms over this period. 9 Figure 20.2 Inflation-adjusted turnover of UK film industry by sector, 1995–2008 £ million (2008 pounds) 10 8,000 7,000 6,000 11 5,000 4,000 12 3,000 2,000 13 1,000 0 1995 1996 1997 1998 1999 2000 2001 2002 2003 2004 2005 2006 2007 2008 % change 1995–2008 14 Film and 1,152.6 2,031.4 2,104.3 1,667.8 1,987.5 2,885.2 1,697.0 1,630.8 2,413.7 2,534.3 2,482.8 3,912.4 2,936.8 2,579.0 123.8 video production Film and 1,244.3 1,858.3 1,733.5 1,942.4 1,945.0 1,846.8 1,538.4 2,020.6 1,956.9 2,255.5 2,667.9 2,251.3 2,167.6 3,069.0 146.6 15 video distribution Film 457.4 563.5 687.9 619.4 606.6 641.6 1,002.2 1,022.6 1,124.3 1,183.3 1,159.7 1,034.0 1,052.4 1,143.0 149.9 exhibition 16 Total 2,854.3 4,453.3 4,525.8 4,229.6 4,539.1 5,373.5 4,237.7 4,674.0 5,494.9 5,973.1 6,310.4 7,197.6 6,156.9 6,791.0 137.9 Source: ONS Annual Business Inquiry, HM Treasury. Notes: The deflator used to calculate real values is the UK whole economy deflator. 17 Values expressed in constant 2008 pounds. For sector classifications, see notes to Figure 20.1. 18 19 20 Chapter 20: The UK film economy – 173 21
  • 176.
    20.2 Film industrycontribution to GDP, 1995–2008 The contribution an industry makes to UK Gross Domestic Product is measured by its gross value added (GVA). ‘Value added’ is industry turnover minus the cost of inputs bought from other industries. The main components of value added are wages and salaries, interest and company profits. Value added is therefore a measure of the industry’s ability to generate income for its workers, company owners and investors. The industry’s total value added increased from £956 million in 1995 to £3.1 billion in 2008. This is 0.2% of the UK’s total GDP. All three sub-sectors showed substantial growth over the 14-year period, with the production sector showing the biggest gain. In 2008, production accounted for 34% of value added, distribution 53% and exhibition 13%. Figure 20.3 UK film industry gross value added, 1995–2008 £ million 4,000 3,500 3,000 2,500 2,000 1,500 1,000 500 0 1995 1996 1997 1998 1999 2000 2001 2002 2003 2004 2005 2006 2007 2008 % change 1995–2008 Film and 299 663 758 525 805 1,032 514 562 983 1,032 1,035 1,957 1,172 1,051 251.5 video production Film and 522 829 638 784 716 582 689 760 520 841 1,072 1,232 964 1,618 210.0 video distribution Film 135 208 264 260 266 250 354 504 592 592 600 407 403 403 198.5 exhibition Total 956 1,700 1,660 1,569 1,787 1,864 1,557 1,826 2,095 2,465 2,707 3,596 2,539 3,072 221.3 Source: ONS Annual Business Inquiry. Note: ‘Gross value added’ is expressed in actual values, ie not adjusted for inflation. Table 20.2 shows the gross value added breakdown by 2007 SICs. Film accounted for the majority of the sector contribution, with distribution particularly high at £1.5 billion, 49% of the total. 174 – UK Film Council Statistical Yearbook 2010
  • 177.
    1 2 Table 20.2 UK film and video industry gross value added, 2008, £ million 3 Sub-sector Turnover % of total Film production 316 10.3 4 Video production 198 6.4 Film, video and TV post-production 537 17.5 Film distribution 1,518 49.4 5 Video distribution 100 3.3 Film exhibition 403 13.1 Sector total 3,072 100.0 6 Source: Office for National Statistics, Annual Business Inquiry. Note: Companies in the post-production sector usually work on films, commercials, videos and television programmes and therefore have a combined statistical classification. 7 Figure 20.4 shows the industry’s value added expressed in real terms, ie with the effects of inflation removed. There was a sharp increase in real industry GVA in 1995–1996, followed by a plateau from 1996 to 2002. Real GVA 8 then began to increase strongly again, reaching a peak of £3.7 billion in 2006. Real GVA was £3.1 billion in 2008, 131% higher than in 1995. 9 Figure 20.4 UK film industry real gross value added, 1995–2008 £ million (2008 pounds) 4,500 10 4,000 3,500 3,000 11 2,500 2,000 12 1,500 1,000 500 13 0 1995 1996 1997 1998 1999 2000 2001 2002 2003 2004 2005 2006 2007 2008 % change 1995–2008 Film and 415.7 889.6 989.5 670.5 1,006.9 1,275.7 622.2 659.8 1,119.7 1,146.6 1,127.1 2,073.3 1,206.9 1,051.0 152.8 video 14 production Film and 725.7 1,112.3 832.8 1,001.2 895.6 719.4 834.0 892.3 592.3 934.4 1,167.3 1,305.2 992.7 1,618.0 122.9 video distribution 15 Film 187.7 279.1 344.6 332.0 332.7 309.0 428.5 591.7 674.3 657.7 653.4 431.2 415.0 403.0 114.7 exhibition Total 1,329.1 2,281.0 2,166.9 2,003.7 2,235.2 2,304.2 1,884.6 2,143.8 2,386.3 2,738.8 2,947.8 3,809.6 2,614.5 3,072.0 131.1 16 Source: ONS Annual Business Inquiry, HM Treasury. Note: The deflator used to calculate real values is the UK whole economy deflator. Values expressed in constant 2008 pounds. 17 18 19 20 Chapter 20: The UK film economy – 175 21
  • 178.
    20.3 Economic impactof the film industry In June 2010 the UK Film Council and Pinewood Shepperton plc published an updated report from Oxford Economics on the economic impact of the UK film industry. This report, the third in a series, examined not only the direct impact but also indirect contributions, such as those to supplier industries, tourism, culture, merchandising, trade and the promotion of the UK internationally. The study focused in particular on the ‘core UK film industry’, defined as film production in the UK plus the distribution and exhibition of UK films. The analysis showed that the core UK film industry contributed £1.6 billion directly to UK GDP in 2009, with a direct contribution to the Exchequer of £445 million. This GDP contribution rose to £4.6 billion when all indirect effects were taken into account, as shown in Table 20.3. Table 20.3 Economic contribution of the core UK film industry, 2009 Total contribution Total contribution to Exchequer Employment to UK GDP in 2009 revenues in 2009 impact Channel of impact (£ million) (£ million) in 2009 Direct 1,594 445 36,000 Multiplier effects 1,714 425 36,000 British film box office effect 59 18 350 Tourism 950 210 20,000 Promotion/trade 20 5 700 Merchandising 237 107 6,600 Total 4,574 1,210 99,650 Source: Oxford Economics. Notes: ‘Multiplier effects’ means the effects on other industries such as suppliers. ‘British film box office effect’ is the amount that the total UK box office is raised by the presence of UK films. It is different from and less than the UK film box office share. A copy of the report can be found on the UK Film Council’s website – www.ukfilmcouncil.org.uk/media/pdf/i/r/The_Economic_Impact_of_the_UK_Film_Industry_-_June_2010.pdf 20.4 The UK facilities sector The facilities sector provides essential inputs to film production, encompassing activities from provision of studio space and equipment hire to visual effects and post-production. During 2008–2009, UK Screen, the facilities sector trade body, carried out the first ever economic study of the sector, publishing the results in January 2010. These showed that the UK facilities sector had a total turnover in 2008 of £2.2 billion, with equipment hire being the largest sub-sector (21% of the total) followed by visual effects and graphics (17%) and picture post-production (15%) as shown in Table 20.4. 176 – UK Film Council Statistical Yearbook 2010
  • 179.
    1 2 Table 20.4 Turnover of UK facilities sector, 2008 3 Segment Turnover £000s % of total Hire (camera, lighting, equipment) 461,010 20.9 4 Visual effects and graphics (VFX) 376,360 17.1 Picture post-production 333,650 15.1 Transmission, network and support services 305,940 13.9 5 Studios 188,890 8.6 Audio post-production 157,990 7.2 Outside broadcast 139,880 6.3 6 Access services 95,180 4.3 Other 77,520 3.5 7 Physical special effects (SFX) 68,120 3.1 Total facilities sector 2,204,540 100.0 Source: UK Screen, Trends Business Research (TBR), Olsberg SPI. 8 Table 20.5 shows that roughly half the activity of the facilities sector was television-related, but film provided the second largest share of revenue (18.3%). 9 Table 20.5 Turnover of facilities sector by market, 2008 10 Segment Turnover £000s % of total Television 1,142,580 51.8 Film 403,250 18.3 11 Commercials 401,140 18.2 Corporate 171,590 7.8 12 Promos 56,580 2.6 Other 24,700 1.1 Games 4,600 0.2 13 Total facilities sector 2,204,540 100.0 Source: UK Screen, TBR, Olsberg SPI. 14 Other findings were that inward investment features accounted for 68% of film facilities turnover in 2008 and that 31% of film facilities turnover was generated by exports, with the USA being the leading export market. A full copy of the report can be obtained from UK Screen and a summary of findings can be found at the following 15 link – www.ukfilmcouncil.org.uk/publications/facilities 16 17 18 19 20 Chapter 20: The UK film economy – 177 21
  • 180.
    20.5 Film exports,1995–2008 The UK film industry exported £1,341 million worth of services in 2008 (the latest year for which data are available), £792 million of which came from royalties and £549 million from film production services. Compared with 2007, both categories increased significantly. Film exports in 2008 were 92% higher than in 2001 as can be seen in Figure 20.5. Figure 20.5 UK film exports, 1995–2008 £ million 1,600 1,400 1,200 1,000 800 600 400 200 0 1995 1996 1997 1998 1999 2000 2001 2002 2003 2004 2005 2006 2007 2008 Royalties 560 686 438 427 508 487 468 434 400 399 660 582 646 792 Film 227 202 212 154 145 210 232 222 233 444 307 330 403 549 production services Total film 787 888 650 581 653 697 700 656 633 843 967 913 1,050 1,341 company exports Source: ONS. Notes: Data for 2009 will be available in December 2010. The export data are derived from the ONS Film and Television Survey (2008) which is a sample survey with a high response rate (87%) of companies in the Inter Departmental Business Register in the Standard Industrial Classification codes relating to film and television. The above chart shows the results for film companies only. 20.6 Film imports, 1995–2008 Film imports have been fairly constant since 2005, increasing by only £42 million, which is within the margin of error of the survey. Until 2006, the vast majority of imports were royalties, with film production imports accounting for only around 15% of total film imports. In 2007 and 2008, this pattern changed, with the royalty share dropping to 60% and the production share increasing to 40%. The reasons for this are unclear as the reported level of production imports is high in relation to total UK film production for these years (see Chapter 16). One possible explanation could be the categorisation of the non-UK spend of UK/USA inward investment productions as imports of production services. However, this explanation cannot be confirmed as the survey returns are confidential. 178 – UK Film Council Statistical Yearbook 2010
  • 181.
    1 2 Figure 20.6 UK film imports, 1995–2008 3 £ million 900 800 4 700 600 500 5 400 300 6 200 100 0 1995 1996 1997 1998 1999 2000 2001 2002 2003 2004 2005 2006 2007 2008 7 Royalties 489 507 419 374 317 497 405 403 430 616 704 698 573 510 Film 192 145 106 63 58 113 50 67 108 136 100 86 245 336 production 8 services Total film 681 652 525 437 375 610 455 470 538 752 804 784 818 846 company imports 9 Source: ONS. See notes to Figure 20.5. 10 20.7 The film trade balance, 1995–2008 The film industry has made a continuous positive contribution to the UK balance of payments since 1995, with 11 a trade surplus (positive balance of exports over imports) in 2008 of £494 million, as Figure 20.7 shows. This is significant at a time when the UK’s physical trade is showing a large deficit and helps explain the Government’s support for creative industries such as film. 12 Figure 20.7 Trade surplus of UK film industry, 1995–2008 £ million 13 600 500 14 400 300 15 200 16 100 0 1995 1996 1997 1998 1999 2000 2001 2002 2003 2004 2005 2006 2007 2008 17 Balance 106 236 125 144 278 87 245 186 95 91 163 128 232 494 Source: ONS. Note: ‘Trade surplus’ equals exports minus imports. Where a company (eg the UK subsidiary of a US major) receives income from another country on behalf of its parent 18 company and subsequently passes it on to its parent company, this is recorded both as a receipt and a payment, leaving the measure of the trade surplus unaffected. 19 20 Chapter 20: The UK film economy – 179 21
  • 182.
    20.8 Film exportmarkets 20.9 UK film exports compared with the global market for filmed entertainment Figure 20.8 shows the geographic distribution of UK film exports for the years 2004–2008. The leading export A useful comparison can be made between UK film destinations were the USA (52%), followed by the export shares and the geographical distribution of European Union (21%) and ‘other Europe’ (9%). the global market for filmed entertainment (Figure Asia took 5% and the rest of the world 12% of the total. 20.9). For the EU, USA and ‘Rest of the world’ UK exports are roughly proportional to the size of the filmed entertainment market in each of those regions. Figure 20.8 Destination of UK film exports The differences that stand out are: as percentage of the total, 2004–2008 • he higher proportion of UK exports to ‘other Europe’ T European Union 21.0% (9% against a 3% ex-UK global market share); Other Europe 9.4% • he lower proportion of UK exports to Asia (5%) T USA 52.0% compared with the Asian countries’ share of the Asia 5.4% ex-UK global market (22%). Rest of the world 12.2% The latter discrepancy reflects the strength of the main Asian countries (Japan, China, South Korea and India) in their own markets and the consequent lower market shares for Hollywood and UK films. Source: ONS. Note: ‘Rest of the world’ cannot be disaggregated due to sampling variation and disclosive data. Figure 20.9 UK export shares 2004–2008 compared with the ex-UK global market for filmed entertainment, 2009 % share 60.0 50.0 40.0 30.0 20.0 10.0 0 European Union Other Europe USA Asia Rest of the world Total % of total 21.0 9.4 52.0 5.4 12.2 100.0 UK film exports % of total ex-UK 20.1 3.0 43.3 22.3 11.4 100.0 global filmed entertainment market Sources: UK exports: ONS. Global market: PricewaterhouseCoopers. Note: Totals may not sum to 100 due to rounding. 180 – UK Film Council Statistical Yearbook 2010
  • 183.
    1 2 20.10 The geographical distribution of the UK’s film trade surplus 3 The geographical distribution of the UK’s film trade surplus was different from the export pattern, as shown in Table 20.6. In the years 2004–2008, almost one-third of the surplus came from ‘Other Europe’ while Asia accounted for 15%. In contrast with some earlier years, the UK ran large film trade surpluses with the USA in 2007 and 2008 4 which led to the USA accounting for 46% of the UK’s film trade surplus in 2004–2008. 5 Table 20.6 International transactions of the UK film industry by geographical area, annual average, 2004–2008 Exports Imports Balance % £ million £ million £ million balance 6 European Union 214.6 194.8 19.8 8.9 Other Europe 96.4 30.6 65.8 29.6 USA 532.0 428.8 103.2 46.4 7 Asia 54.8 22.2 32.6 14.7 Rest of the world 125.0 124.2 0.8 0.4 8 Total 1,022.8 800.6 222.2 100.0 Source: Office for National Statistics. 9 10 11 12 13 14 15 16 17 „ 18 3F or more information on the UK and global film market see Chapter 13 (page 104) 19 3F or more information on the performance of UK films internationally see Chapter 6 (page 46) 3F or more information on inward investment in film production in the UK see Chapter 16 (page 132) 3F or details of public investment in film see Chapter 17 (page 143) 20 Chapter 20: The UK film economy – 181 21
  • 184.
    Chapter 21: Employment inthe film and video industries The film and video industries Facts in focus employ a high proportion of • 2,543 people worked in the film and video industries 4 in 2009, of whom 25,556 worked in film and video skilled people but it is a volatile production. This was an increase on 2008. sector, with unpredictable • roduction and distribution were concentrated in P London and the South East. peaks and troughs in • lmost 60% of people in film and video production A employment levels. Despite were freelance. the recession, 2009 saw an • omen made up 17% (17% in 2008) of the W increase in employment in screenwriters of UK films released in the UK in 2009 and 17% (12% in 2008) of the directors. production, distribution and • ost businesses were small scale. For example, M exhibition. 55% of employees in film and video production were in workplaces with 10 or fewer people.
  • 185.
    1 2 21.1 The workforce 3 21.1.1 Labour Force Survey 4 According to the Labour Force Survey (LFS) conducted by the Office for National Statistics (ONS), a total of 42,543 people worked in film and video production, distribution and film exhibition in the year 2009 (October 2008 – September 2009). The figures include workers whose main jobs are in film and video production, distribution and 5 film exhibition, and those with second jobs in these sectors. They also include both full-time and part-time workers. Table 21.1 shows the breakdown. 6 Table 21.1 Film and video industry workforce, 2009 Sector Number in employment 7 Film and video production 25,556 Film and video distribution 2,951 Film exhibition 14,036 8 Total 42,543 Source: Labour Force Survey, ONS. Notes: 9 Numbers in employment are averages of the four calendar quarters, Oct–Dec 2008, Jan–Mar, Apr–Jun and Jul–Sep 2009. People in employment include people aged 16 or over who did paid work (as an employee or self-employed), those who had a job that they were temporarily away from, those on government supported training and employment programmes, and those doing unpaid family work. 10 Changes to Labour Force Survey estimates The LFS estimate of the numbers employed in film and video production in 2009 shows an increase of 2,000 over the 11 2008 figure, which reverses the recent trend which has seen employment numbers decrease every year since 2003. However, there are two important differences between the estimates relating to the years up to 2006 and those for 2007 onwards. First, the Standard Industrial Classification (SIC) changed recently and the data to 2006 are based on 12 the old classification while data for 2007 onwards are based on the new classification. For film exhibition the two classifications are directly comparable, but for film and video production and distribution some people would be included in the figures for the earlier years, but not in the later ones. Secondly, the LFS weighting has changed. The LFS collects information from a sample of the population, and in order to make estimates and inferences about 13 the whole population, the data must be ‘weighted’, with the weights depending on the size of the sample and the size of the population. ONS has recently carried out a reweighting of LFS data to make them consistent with revised (increased) population estimates. Not all of the older LFS data have yet been reweighted, however. Data referring to 14 years up to 2006 are based on the old weights, and data referring to 2007 onwards are based on the new weights. The new weights will, in most instances, result in higher estimates. 15 Employment in film and video production and distribution and film exhibition generally decreased between 2003 and 2006. Because of the changes to the data explained in the box, it is difficult to compare the data for years up 16 to 2006 with the data for 2007 onwards. However, for all three sectors, the LFS estimates (Figure 21.1) indicate a decrease in employment from 2007 to 2008, then an increase in 2009 (with 2009 levels being higher than the 2007 levels in both film and video production and film exhibition). 17 18 19 20 Image: Nowhere Boy courtesy of Icon Film Distribution Chapter 21: Employment in the film and video industries – 183 21
  • 186.
    Figure 21.1 Sizeof film and video workforce, 1996–2009 Number in employment 35,000 30,000 25,000 20,000 15,000 10,000 5,000 0 1996 1997 1998 1999 2000 2001 2002 2003 2004 2005 2006 2007 2008 2009 Film and 17,705 23,819 26,255 22,407 23,396 31,271 31,565 31,620 29,222 26,974 25,802 23,797 23,535 25,556 video production Film and 3,296 3,188 4,622 2,277 4,205 3,918 4,527 5,261 2,826 3,379 2,862 4,514 2,752 2,951 video distribution Film 10,427 11,585 14,121 16,917 13,328 11,844 16,667 20,004 22,670 15,581 17,368 13,032 12,361 14,036 exhibition Source: Labour Force Survey, ONS. Notes: The employment figures are averages of the four ‘calendar quarters’ (Oct–Dec, Jan–Mar, Apr–Jun and Jul–Sep), referred to as ‘year to September’. In 2006, the European Commission required all countries in the EU to base their labour force surveys on calendar quarters. Most people working in the film distribution and exhibition sectors were employees, but the film production sector had a higher proportion of freelance workers. In 2009, 60% of those engaged in film and video production, a total of 15,278 people, were self-employed (Table 21.2 and Figure 21.2). Table 21.2 Film and video production workforce, 1996–2009 Unpaid Total in Self-employed Unpaid family worker Year employment Self-employed as % of total family worker as % of total 1996 17,705 7,539 42.6 215 1.2 1997 23,819 9,313 39.1 488 2.0 1998 26,255 13,276 50.6 – – 1999 22,407 10,776 48.1 422 1.9 2000 23,396 10,764 46.0 107 0.5 2001 31,271 12,201 39.0 705 2.3 2002 31,565 14,885 47.2 305 1.0 2003 31,620 17,406 55.0 111 0.4 2004 29,222 15,406 52.7 251 0.9 2005 26,974 11,382 42.2 1,076 4.0 2006 25,802 12,687 49.2 502 1.9 2007 23,797 11,026 46.3 – – 2008 23,535 11,769 50.0 – – 2009 25,556 15,278 59.8 – – Source: Labour Force Survey, ONS. Notes: Year means the year ending September. See note to Figure 21.1 for explanation. An ‘unpaid family worker’ is defined as a person who is doing unpaid work for a business that they own or that a relative owns. 184 – UK Film Council Statistical Yearbook 2010
  • 187.
    1 2 The proportion of self-employed workers has fluctuated mainly in the 40%–50% band between 1996 and 3 2006. For 2007 onwards, the proportion has been slightly higher on average, reaching 60% in 2009 (though the proportion was as high as 55% in 2003). The figures shown for 2007 onwards are based on the new Standard Industrial Classification, and so the higher average percentages of freelancers in the industry since 2007 could be 4 due to changes in industry practices, the change in the classification or a combination of both. In comparison, only 14% of the total UK workforce was self-employed in the year to September 2009. 5 Figure 21.2 Self-employed and unpaid family workers as proportions of total workforce, film and video production, 1996–2009 % total in employment 6 60 50 7 40 30 8 20 10 9 0 1996 1997 1998 1999 2000 2001 2002 2003 2004 2005 2006 2007 2008 2009 10 Self-employed 42.6 39.1 50.6 48.1 46.0 39.0 47.2 55.0 52.7 42.2 49.2 46.3 50.0 59.8 as % of total Unpaid family 1.2 2.0 – 1.9 0.5 2.3 1.0 0.4 0.9 4.0 1.9 – – – 11 worker as % of total Source: Labour Force Survey, ONS. Notes: Year means the year ending September. See note to Figure 21.1 for explanation. 12 Data for unpaid family workers were unavailable for 1998, 2007, 2008 and 2009 due to sampling, but numbers were likely to be small. 13 21.1.2 Skillset’s Labour Market Intelligence and Employment Census In view of the limitations of official labour market data in providing workforce size at sub-sector level, Skillset, the Sector Skills Council for Creative Media, compiles its own workforce employment statistics for a number of 14 sub-sectors of the creative industries. The latest Labour Market Intelligence (LMI) Digest for Film, published in 2009, includes data from Skillset’s 2006 Employment Census of the creative media industries and the joint Skillset/UK Film Council Feature Film Production Workforce Survey from 2008. Skillset has also published its 2009 Employment 15 Census of the creative media industries. According to Skillset’s latest LMI Digest for Film, the UK film industry had a total workforce of 27,800 people. The majority were working in exhibition (62% of total, 17,200 people), with 34% in production (9,500 people) 16 and 4% (1,100 people) in distribution. Results from the more recent Employment Census of the creative media industries estimate that 1,200 people worked in film distribution and 17,650 people worked in film exhibition in 2009 (an estimate of the total workforce for film production is not available from this census, as there is no 17 estimate for the number of freelancers). The LMI and Employment Census workforce estimates for film production and distribution are not directly 18 comparable with those from the LFS due to differences between the methodologies used by ONS and Skillset. The LMI estimates are 37% and 38% of their LFS counterparts, for 2006, for film and video production and distribution respectively. The LMI estimate for film exhibition is directly comparable to that from the LFS, and, at 17,200 people, is similar to the equivalent figure for 2006 from the LFS (17,368). For 2009, the Employment 19 Census estimate for distribution is 41% of the LFS estimate and the film exhibition estimate from the Employment Census (17,650) is 26% higher than the LFS estimate (14,036). 20 Chapter 21: Employment in the film and video industries – 185 21
  • 188.
    21.2 The featurefilm production workforce survey The Skillset/UK Film Council feature film production surveys aim to obtain reliable statistics on working patterns, skills development needs, existing provision, and barriers experienced to receiving training and development. Following a survey conducted in 2002, a second feature film workforce survey was carried out in 2006 and its final results published in 2008. Here we report and contrast the main results on demographics and work patterns between the two surveys. Full reports of both surveys are available from the Skillset website (see the end of the chapter). Two-fifths of the 2006 survey respondents were women, with the female percentage varying widely by occupational group, from 85% in make-up and hairdressing to 3% in construction, as Table 21.3 shows. There appears to be some variation in the gender profiles between the two surveys. There were more female assistant directors (39%) but fewer women working in editing, post-production and visual effects (26%) in 2006. Five per cent of the respondents in the sound/electrical occupations were women compared to zero in 2002. Table 21.3 Occupational group by gender, film production workforce, 2002 and 2006 Respondents 2002 Respondents 2006 Occupational group Male % Female % Male % Female % Production/script development 34 66 36 64 Assistant directors 74 26 61 39 Art/set decorating/props 68 32 55 45 Camera 91 9 85 15 Sound/electrical 100 – 95 5 Costume 30 70 20 80 Make-up/hairdressing 12 88 15 85 Editing/post-production/visual effects 58 42 74 26 Construction 95 5 97 3 Locations 76 24 78 23 Others 70 30 65 35 All occupations 67 33 60 40 Source: Skillset. Note: The percentages for male and female in some occupational groups may not add up to 100 due to rounding. The challenge of reflecting the UK’s ethnic diversity in the film production industry is evident in Tables 21.4 and 21.5. The ethnic profile of the respondents in 2006 was identical to that in the previous survey. Overall only 5% of the film workforce was from minority groups, below the UK all-sectors average of 7% and well below the London workforce average of 24%, which is a relevant comparator for the film industry in view of its concentration in London. 186 – UK Film Council Statistical Yearbook 2010
  • 189.
    1 2 Table 21.4 Ethnicity of UK film production workforce, 2002 and 2006 3 All UK Respondents Respondents workforce 2002 2006 (LFS, 2004) Ethnic group % % % 4 White 95 95 93 Mixed 2 2 1 5 Asian or Asian British 1 1 3 Black or black British 1 1 2 Chinese – – – 6 Other 1 1 1 Source: Skillset; ONS Labour Force Survey, quarterly supplement 2004. 7 Table 21.5 Ethnicity of London film production workforce, 2002 and 2006 London London All London 8 respondents respondents workforce 2002 2006 (LFS, 2004) Ethnic group % % % White 94 93 76 9 Mixed 3 2 1 Asian or Asian British 1 1 11 10 Black or black British 1 1 8 Chinese – 1 1 Other 1 1 3 11 Source: Skillset; ONS Labour Force Survey, quarterly supplement 2004. The disabled proportion of the film production workforce increased slightly from 2% to 3%, as shown in Table 21.6, 12 but is still less than the UK average of 5%. Table 21.6 Disability, film production workforce, 2002 and 2006 13 All UK Respondents Respondents workforce 2002 2006 (LFS, 2005) 14 Workers who consider themselves to have a disability % % % Yes 2 3 5 No 98 97 95 15 Source: Skillset; ONS Labour Force Survey, quarterly supplement 2005. The age profile of the respondents in 2006 was somewhat more youthful than in the previous survey. The film 16 production workforce was predominantly young, with 84% aged 49 or under (Table 21.7). The female age profile was significantly younger than the male, with 90% of women being under the age of 49. 17 18 19 20 Chapter 21: Employment in the film and video industries – 187 21
  • 190.
    More of therespondents in 2006 were between 16 and 24 years (8% compared with 3% in 2002). People in film production appeared younger than in the wider workforce, with more than a third falling into the 25 to 34 year age band in comparison with a fifth of the UK workforce as a whole. The increase in the female percentage in the 16–24 and 25–34 age groups is consistent with the slight growth overall in the female percentage of the workforce, suggesting increased entry of younger women into film production. Table 21.7 Age distribution of film production workforce, 2002 and 2006 All UK Respondents 2002 Respondents 2006 workforce (LFS, Nov 06–Jan 07) Age group Male % Female % All % Male % Female % All % All % 16–24 3 4 3 7 9 8 14 25–34 26 41 31 27 45 34 21 35–49 46 42 45 46 37 42 38 50+ 25 13 21 21 10 16 26 All ages 100 100 100 100 100 100 100 Source: Skillset; ONS Labour Force Survey, quarterly supplement March 2007. Note: The percentages may not add up to 100 due to rounding. As Table 21.8 shows, slightly fewer respondents were married or living as a couple in 2006 than in 2002 (57% compared with 61%). In addition, more were single (38% compared with 32%). Table 21.8 Marital status of film production workforce, 2002 and 2006 Respondents Respondents 2002 2006 Marital status % % Married or living as couple 61 57 Single and never married 32 38 Divorced or separated 7 5 Widowed – – Source: Skillset. Just over a quarter (27%) of respondents in 2006 reported living with at least one dependent child under 16 years, which was a slight drop in comparison with the third in 2002 (Table 21.9). As in 2002 however, the proportion of male respondents living with dependent children was considerably greater than the proportion of female respondents (40% compared with 14%). 188 – UK Film Council Statistical Yearbook 2010
  • 191.
    1 2 Table 21.9 Family status of film production workforce, 2002 and 2006 3 Respondents 2002 Respondents 2006 Male % Female % All % Male % Female % All % 4 Living with dependent child(ren) under 16 39 21 33 40 14 27 Source: Skillset. 5 More results from the feature film production workforce surveys are available from the full reports, which can be seen on the Skillset website. 6 21.3 The gender of writers and directors of UK films Since 2005, the UK Film Council has been studying the under-representation of women among screenwriters of UK 7 films. This has been the subject of two reports Scoping Study into the Lack of Women Screenwriters in the UK (IES, 2006) and Writing British Films – who writes British films and how they are recruited (Susan Rogers, Royal Holloway and UK Film Council, 2007). See the web-link at the end of the chapter. 8 The combined conclusion of these reports is that female under-representation is an aspect of a commissioning process that tends to recruit writers who: • Are already known to the commissioning producers; and/or 9 • Are members of the Writers Guild of America; and/or • Have American agents (even if they are British). 10 At the time these reports were commissioned, evidence suggested that around 10% of UK films had a female director and around 15% of UK films had a female writer. Of the 139 identified writers of UK films in 2009, 23 (17%) were women (Table 21.10). 11 Table 21.10 Gender of writers of UK films released in the UK, 2009 12 Year 2009 Number of UK titles released in the UK 113 Number of writers associated with these titles 139 13 Number of male writers 116 Number of female writers 23 14 % male 83.5 % female 16.5 Source: UK Film Council. 15 While this is a low proportion, it is very similar to the 17.3% seen in 2008, but an increase on 2006 and 2007, when only 15% and 12% of writers were women (see Chapter 21, 2009 Statistical Yearbook and Chapter 19, 16 2008 Statistical Yearbook). 17 18 19 20 Chapter 21: Employment in the film and video industries – 189 21
  • 192.
    Although the percentageof female writers was similar in 2009 to that in 2008, the absolute number of female writers associated with released UK films in 2009 was lower than the 29 seen in 2008, and similar to the levels of the previous two years (23 and 20 respectively). Some of the female writers associated with UK films released in 2009 were: Lucy Shuttleworth (The Secret of Moonacre), Kari Skogland (Fifty Dead Men Walking) and Franny Armstrong (The Age of Stupid). As well as being involved in the writing of films, many of the female writers also directed or co-directed their films. Table 21.11 shows directors by gender for UK films released in the UK in 2009. Table 21.11 Gender of directors of UK films released in the UK, 2009 Year 2009 Number of UK titles released in the UK 113 Number of directors associated with these titles 122 Number of male directors 101 Number of female directors 21 % male 82.8 % female 17.2 Source: UK Film Council. The proportion of female directors in 2009 (17%) was higher than the proportion in 2008 (12%), which itself was higher than for 2006 (9%) and 2007 (6%). Some of the 21 female directors associated with UK films released in 2009 were: Lone Sherfig (An Education), Sam Taylor-Wood (Nowhere Boy), Debbie Isitt (Nativity) and Jane Campion (Bright Star). Both Debbie Isitt and Jane Campion also wrote the screenplays of their films. Other notable female writer/directors are Kim Longinotto, Havana Marking and Andrea Arnold, who all won awards for their directing in 2009. Kim Longinotto won the World Cinema Grand Jury Prize at the 2009 Sundance Festival for her documentary Rough Aunties. Havana Marking won two awards at the same festival: the World Cinema Directing Award and the World Cinema Audience Award for her documentary Afghan Star. Andrea Arnold won the Jury Prize at the 2009 Cannes Film Festival for her film Fish Tank. 21.4 The workplace location The film production and distribution sectors are concentrated in London and the South East, as shown in Table 21.12. The exhibition sector workforce is more concentrated in these regions than the overall industry average, but less so than production and distribution. 190 – UK Film Council Statistical Yearbook 2010
  • 193.
    1 2 Table 21.12 London and South East employment as percentage of total, 2009 3 London and London and Total UK South East South East Sector employment employment as % of UK total 4 UK all industries 29,950,249 8,430,122 28.1 Film and video production 25,556 18,716 73.2 Film and video distribution 2,951 2,293 77.7 5 Film exhibition 14,036 5,756 41.0 Source: Labour Force Survey, ONS. Notes: 6 The South East region wraps around London to include the major studios to the west of London. Totals shown in this table are averages of the four calendar quarters from October 2008 to September 2009. The London and South East share of the film and video production workforce was 73% in the year to September 7 2009 (79% in 2008). Figure 21.3 suggests that the share of the film and video production workforce in London and the South East is close to the level prevailing in the early 2000s. The LFS estimate of the London and South East share of the distribution workforce is erratic from year to year, mainly due to statistical error arising from the small sample 8 size of the survey at industry sub-sector level. Figure 21.3 London and South East percentage share of the film and video production and 9 total workforce, 1999–2009 % 10 90 80 11 70 60 50 12 40 30 20 13 10 1999 2000 2001 2002 2003 2004 2005 2006 2007 2008 2009 14 Film and video 68.7 76.2 76.9 63.0 71.3 58.1 70.3 77.4 73.8 78.8 73.2 production UK all 28.0 28.0 28.1 28.1 27.7 27.6 27.6 27.5 27.6 27.9 28.1 15 industries Source: Labour Force Survey, ONS. Note: Year means the year to September of the year. See note to Figure 21.1 for explanation. 16 17 18 19 20 Chapter 21: Employment in the film and video industries – 191 21
  • 194.
    21.5 The scaleof the workplace Each year, the Office for National Statistics conducts a survey of businesses, called the Annual Business Inquiry (ABI), which provides information on the number of employees in England, Scotland and Wales, by industrial sector. The latest available data are for 2008 and those relating to the film industry are shown in Tables 21.13 to 21.15. Figures reported in sections 21.1 and 21.4 are based on the LFS which counts the number of people employed, and the figures reported in the present section are from the ABI, which is a survey of employers, and counts numbers of jobs. The two things are not the same, and the data come from different sources, but the numbers arising from the two surveys should be similar. However, this is not always the case. ONS has identified a number of reasons for differences between the estimates, but the two most important ones when looking at particular industry sub-sectors are likely to be: sampling error arising from small LFS sample size at industry sub-sector level and the fact that there are two industry classification processes involved. In the LFS, individuals are classified by industry depending on the industrial information they give, whereas in the ABI the industry classification is based on companies’ activities. As people and companies often work across more than one industry (television and film for example) this gives rise to unpredictable variations between the LFS and the ABI measures. Also, while the most recent LFS data use the latest industrial classification (SIC07), the ABI data are available on the old classification (SIC92). The ABI data presented here are based on SIC92, as this classification better captures those working just in film or video (at the four-digit level of the classification for which ABI data are available – the latest years’ LFS data shown in Section 21.1 are compiled from the new SIC at the five-digit level). Nomis (the official labour market statistics online database) provides ABI data for England, Scotland and Wales only. Figures for Northern Ireland are reported separately by the Northern Ireland Department of Enterprise, Trade and Investment (DETI) and are shown in Table 21.16. These data are from the Northern Ireland Census of Employment, which is carried out every two years. The latest available data for Northern Ireland, therefore, refer to 2007. The different characteristics of the three sectors stand out clearly in these tables. The film and video production sector had a very high number of small workplaces (97% in the band of 1–10 employees), accounting for a majority of the sector’s total workforce (55%), as Table 21.13 shows. At the other end of the scale, there were a small number of large workplaces. The 41 workplaces with 50 or more employees accounted for 5,497 employees, an average of 134 each. Table 21.13 Film and video production (SIC 9211) workplace size distribution (employees) for England, Scotland and Wales, 2008 Number of Number of workplaces % of total employees % of total Workplace size band in band workplaces in band employees 1–10 7,785 97.2 11,478 55.2 11–49 184 2.3 3,835 18.4 50+ 41 0.5 5,497 26.4 Total 8,010 100.0 20,811 100.0 Source: Annual Business Inquiry, ONS. The distribution sector was not as concentrated in small workplaces as the production sector, with four-fifths of the employees working in workplaces with 11 or more employees (Table 21.14). 192 – UK Film Council Statistical Yearbook 2010
  • 195.
    1 2 Table 21.14 Film and video distribution (SIC 9212) workplace size distribution (employees) for England, 3 Scotland and Wales, 2008 Number of Number of workplaces % of total employees % of total Workplace size band in band workplaces in band employees 4 1–10 433 88.9 891 18.3 11+ 54 11.1 3,973 81.7 5 Total 487 100.0 4,864 100.0 Source: Annual Business Inquiry, ONS. 6 Workplace numbers for bands above 11 employees cannot be published for confidentiality reasons (too few workplaces in the bands). More than 60% of distribution employees worked in workplaces of 50 employees or more, while a small number of workplaces had 200-plus employees. 7 Table 21.15 shows that the exhibition sector had a concentration that was the reverse of the production sector with 59% of employees in workplaces of 50 or more and only 4% in workplaces in the 1–10 employee band. 8 Table 21.15 Film exhibition (SIC 9213) workplace size distribution (employees) for England, Scotland and Wales, 2008 9 Number of Number of workplaces % of total employees % of total Workplace size band in band workplaces in band employees 1–10 195 35.3 624 3.5 10 11–49 215 38.9 6,613 37.5 50+ 142 25.7 10,400 59.0 11 Total 552 100.0 17,637 100.0 Source: Annual Business Inquiry, ONS. 12 Due to the ‘disclosive’ nature of workplace statistics reported for Northern Ireland (too few units in certain size bands), the three SIC categories have been combined under the SIC code of 921, as shown in Table 21.16. The latest available data are from the 2007 Census of Employment for Northern Ireland. Two-thirds (67%) of the workplaces had 10 employees or fewer while 90% (88% in 2005) of the employees were in workplaces of 11 or more employees. 13 The number of small workplaces (10 employees or fewer) in 2007 had increased by 10 percentage points from 57% in 2005. 14 15 16 17 18 19 20 Chapter 21: Employment in the film and video industries– 193 21
  • 196.
    Chapter 1: Table 21.16Film and video industry (SIC 921) workplace size distribution (employees) for Northern Ireland, 2007 Number of Number of The box office workplaces % of total employees % of total Workplace size band in band workplaces in band employees 1–10 43 67.2 97 9.8 11+ 21 32.8 890 90.2 Total 64 100.0 987 100.0 Source: Northern Ireland Census of Employment, Department of Enterprise, Trade and Investment (DETI). The declining trend in the proportion of employment in workplaces with 50 or more employees in the film and video production sector in the early part of the last decade has been reversed in recent years. In contrast, the proportion of employment in workplaces with 1–10 employees grew rapidly between 1996 and 2000, then remained at a level of just below 60%, but appears to have declined between 2006 and 2008 (Figure 21.4). Figure 21.4 Film and video production sector (SIC 9211) employees by workplace size band, percentage of total, 1995–2008 % of sector workforce 70 60 50 40 30 20 10 0 1995 1996 1997 1998 1999 2000 2001 2002 2003 2004 2005 2006 2007 2008 1–10 employees 44.9 46.9 50.3 55.6 57.2 57.9 57.2 59.4 56.2 58.8 58.2 59.0 57.7 55.2 50+ employees 30.0 28.3 25.7 25.6 21.3 22.9 17.3 17.4 23.7 21.5 25.3 21.9 24.2 26.4 Source: Annual Business Inquiry, ONS. Notes: These figures cover England, Scotland and Wales only. Workforce data from 1995 to 1997 were re-scaled to be comparable with the current series of ABI. In the exhibition sector the proportion of employees in the 50-plus category has increased over the past two years, after decreasing in 2004–2006. The reverse is happening in the 11– 49 category where the proportion of employees appears to be declining after seeing an increase between 2004 and 2006, as shown in Figure 21.5. 194 – UK Film Council Statistical Yearbook 2010
  • 197.
    1 2 Figure 21.5 Film exhibition sector (SIC 9213) employees by workplace size band, percentage of total, 1995–2008 3 % of sector workforce 80 70 4 60 50 5 40 30 20 6 10 1995 1996 1997 1998 1999 2000 2001 2002 2003 2004 2005 2006 2007 2008 7 11–49 employees 63.1 56.8 40.5 25.1 36.6 51.8 36.1 34.2 41.1 32.1 39.5 44.3 41.1 37.5 50+ employees 29.8 35.4 52.1 68.0 56.1 42.2 59.3 61.8 54.6 63.9 56.8 51.6 55.1 59.0 8 Source: Annual Business Inquiry, ONS. Notes: These figures cover England, Scotland and Wales only. 9 Workforce data from 1995 to 1997 were re-scaled to be comparable with the current series of ABI. 10 11 12 13 14 15 „ 16 or the reports on under-representation of women among screenwriters of UK films, Scoping Study into the 3F Lack of Women Screenwriters in the UK and Writing British Films – who writes British films and how they are 17 recruited, see www.ukfilmcouncil.org.uk/publications 3 For more information about differences between LFS estimates of numbers of people in employment and ABI estimates of numbers of jobs, see the National Statistics Quality Review Series Report no. 44: Review of 18 Employment and Jobs Statistics, at www.ons.gov.uk/about-statistics/methodology-and-quality/quality/nat-stats- qual-revs/qual-revs-by-theme/labour-market/index.html 3F or more information on film distribution, see Chapter 8 (page 60) 19 3F or details of the exhibition sector, see Chapter 9 (page 65) 3F or more background on film production, see Chapter 16 (page 132) 3S killset website: www.skillset.org 20 Chapter 21: Employment in the film and video industries – 195 21
  • 198.
    Glossary Country of origin The nationality of a film. In the case of co-productions, Asian programming this may include more than one country Films originating from South Asia, for example Bollywood, and generally, though not exclusively, DCMS aimed at a South Asian audience and in a South Department for Culture, Media and Sport. Asian language The government department that sponsors the UK Film Council BAFTA British Academy of Film and Television Arts Digital Cinema Initiatives Digital Cinema Initiatives, LLC (DCI) was created in BARB March 2002 and is a joint venture of Disney, Fox, Broadcasters’ Audience Research Board Ltd. Paramount, Sony Pictures Entertainment, Universal and The company that compiles audience figures for Warner Bros Studios. Its primary purpose is to establish UK television (www.barb.co.uk) and document voluntary specifications for an open architecture for digital cinema that ensures a uniform BBFC and high level of technical performance, reliability and British Board of Film Classification. Independent body quality control (www.dcimovies.com) responsible for classifying films and video (see Film classification) (www.bbfc.org.uk) DLP Cinema The trademark of Texas Instruments’ digital projection Blu-ray disc (BD) system. DLP stands for ‘digital light processing’ An optical disc format that can store up to 50 Gb of data, almost six times the capacity of a dual layer DVD. Digital projection It uses a short wavelength blue-violet laser to read and The projection of a film onto a cinema screen using a write information to disc digital master and a digital projector, ie using electronic signals to direct light onto the screen rather than Box office passing light through a celluloid strip Total value of ticket sales for a film screened commercially at cinemas Digital terrestrial television (DTT) Multi-channel television delivered free to the consumer Box office gross by means of a signal decoder between the aerial and Box office takings before deduction of Value Added the television set Tax (VAT) Distributor BVA A person or company that acquires the right to exploit British Video Association. The trade body the commercial and creative values of a film in the representing the interests of publishers and rights theatrical, video and TV market. Also undertakes the owners of pre-recorded home entertainment on promotional and marketing activities to attract video (www.bva.org.uk) audiences to the film CAA Download Cinema Advertising Association. The trade association See ‘Film download’ of cinema advertising contractors operating in the UK and Republic of Ireland Download to Own (DTO) The purchase of permanent film downloads for storage Concession revenue on hard drive, and in some cases to burn an additional Revenue from sales of food, drink and merchandise copy to DVD at cinemas DVD Co-production Digital versatile disc A film made by companies from more than one country, often under the terms of a bilateral Exhibitor co-production treaty or the European Convention A cinema operator that rents a film from a distributor on Cinematographic Co-production to show to a cinema audience 196 – UK Film Council Statistical Yearbook 2010
  • 199.
    Feature film HD-DVD A film made for cinema release, as opposed to High-definition digital versatile disc. A high-density a film made for television, and usually of at least optical disc format designed for the storage of data and 80 minutes duration high-definition video. Abandoned in February 2008 after Blu-ray prevailed in the competition to become the next Film classification generation DVD format Classification given to a film by the British Board of Film Classification. Indicates the film’s suitability for Higher (Scottish) audiences according to their age In Scotland, the Higher is one of the national school- leaving certificate exams and university entrance Film download qualifications of the Scottish Qualifications Certificate A digital version of a film transferred (either officially offered by the Scottish Qualifications Authority. or unofficially) from the Internet to a personal computer or mobile device. Downloads may also go directly to HMRC television sets via game consoles, internet protocol Her Majesty’s Revenue and Customs. The government television or dedicated set-top boxes department charged with collecting revenue on behalf of the Crown Film rental The sum of money paid to the distributor by the HMT exhibitor in return for the right to show a particular Her Majesty’s Treasury. The government department film. Usually calculated as a percentage of net box office responsible for formulating and implementing the Government’s financial and economic policy Franchise A film series such as Harry Potter and the Philosopher’s Inward features Stone and its sequels A term used by the UK Film Council to denote a film which is substantially financed and controlled from GCE – General Certificate of Education outside the UK and which is attracted to the UK by script An academic qualification comprising Advanced Level requirements (eg locations) and/or the UK’s filmmaking (A Level) and Advanced Subsidiary Level (AS Level). infrastructure and/or UK tax incentives GCSE – General Certificate of Secondary Education Internet Protocol Television (IPTV) An academic qualification awarded in a specific subject, Television connected to the internet that uses internet generally taken by students aged 14-16 in secondary digital protocols to communicate data education in England, Wales and Northern Ireland (Scottish equivalent is the Standard Grade). ISBA TV Regions System for classifying regions developed by the GDP – Gross Domestic Product Incorporated Society of British Advertisers for use by A measure of a country’s income and output. GDP is the advertising industry defined as the total market value of all final goods and services produced within the country in a given period Mainstream programming of time. GDP is also the sum of the value added at each Category of films aimed at the general audience stage of the production process. ‘Gross’ refers to the fact that GDP includes capital investment but does Megaplex site not subtract depreciation Defined by Dodona Research as a purpose-built cinema with 20 or more screens Genre A style or category of film defined on the basis of Multiplex site common story and cinematic conventions (eg action, Dodona Research defines a multiplex as a purpose-built crime, romantic comedy, drama etc) cinema with five or more screens Government Office Regions Multi-channel television Classification of English regions used to establish the Digital television programming carried by satellite, cable boundaries of the Regional Development Agencies or freeview delivery systems, in this case excluding the and the Regional Screen Agencies five main network channels (BBC One, BBC Two, ITV1, Channel 4 and Five) Glossary – 197
  • 200.
    Near-Video on Demand(nVoD) Sites A system which allows television viewers to purchase Individual cinema premises individual films to view. The film is shown at the same time to everyone ordering it, as opposed to true-Video Socio-economic group on Demand, which allows the viewers to see the film Section of the population defined by employment status at any time. Films can be purchased via an on-screen Specialised programming guide, automated telephone or customer services line. Generally, non-mainstream films. This category includes Also referred to as pay-per-view foreign language and subtitled films, art-house Net box office productions and films aimed at niche audiences Box office takings after deduction of VAT Terrestrial television Online rental The five main free-to-air channels: BBC One, BBC Two, Selecting and renting DVDs via a website for postal ITV1, Channel 4 and Five delivery Traditional cinema ONS A cinema generally with fewer than five screens and Office for National Statistics that shows more mainstream product. Often an older building located in city centres or suburbs Out of town cinema Cinema located on the outskirts of a town, typically UK and Republic of Ireland in a large shopping development The distribution territory comprising the UK and Republic of Ireland. Where this publication indicates PAYE a film has been released ‘in the UK and Republic of Pay as you earn. A method of collecting income tax Ireland’ it refers to the distribution territory and not and national insurance where these are deducted necessarily to an actual release in both countries at source by the employer and remitted to HMRC UMD Pay-per-view Universal Media Disc. An optical disc medium developed See Near-Video on Demand by Sony for use on the PlayStation Portable Pay-TV VHS A satellite or cable television system in which viewers Video Home System. Standard format for cassette tapes pay a subscription to access television content containing recorded films and other audiovisual content Personal computer (PC) Video on Demand (VoD) A lap-top or desk-top computer capable of operating A system that allows users to select and watch films independently of a network (although frequently on television, PC or mobile device at the time they want networked in office environments) over an interactive network. The user can buy or rent films and download them before viewing starts or Personal video recorder (PVR) stream content to be viewed in real time A digital set-top box with hard drive capable of storing large amounts of audiovisual content Video on physical media See ‘physical media’ Physical media Refers to the various physical formats on which video can be distributed, such as VHS, DVD, Blu-ray etc. PlayStation Portable (PSP) A portable games console made by Sony that can be used to view VoD content Standard Industrial Classification (SIC) A numbering system used by the Office for National Statistics to identify different industries in the UK’s official statistics 198 – UK Film Council Statistical Yearbook 2010
  • 201.
    Acknowledgments Please note that no material in this Yearbook may be reproduced in any form without prior permission from We would like to thank the following organisations the authors or copyright owners. for kindly allowing us to reproduce their data: Attentional Ltd Sources Beacon Dodsworth Chapters 1 to 9: Box office, top films, genre British Board of Film Classification (BBFC) and classification, specialised films, UK films internationally, UK talent and awards, distribution British Federation of Film Societies (BFFS) and exhibition British Film Institute (BFI) • entrak EDI, weekly UK and international box R British Market Research Bureau (BMRB) office reports British Video Association (BVA) • ndependent Film and Television Alliance (IFTA), I Broadcasters’ Audience Research Board Ltd (BARB) international box office database Cinema Advertising Association (CAA) • otion Picture Association of America, theatrical M market statistics Department for Culture Media and Sport (DCMS) • European Audiovisual Observatory Lumière database Department for Environment, Food and Rural Affairs (DEFRA) • HM Treasury, GDP deflators Dodona Research • Dodona Research, Cinema-going 19, April 2010 European Audiovisual Observatory (EAO) • Screen Digest, Cinema Intelligence FILMCLUB • ritish Board of Film Classification (BBFC), database B of film classifications Film Education • ielsen Media Research, monthly media spend reports N First Light • The Internet Movie Database (IMDb) Higher Education Statistics Agency (HESA) • Rentrak EDI, Filmsource database HM Revenue and Customs (HMRC) • eacon Dodsworth, UK population data by B HM Treasury (HMT) ISBA TV region Joint Council for Qualifications (JCQ) • inema Advertising Association, cinema admissions C Kantar Worldpanel by ISBA TV region Motion Picture Association of America (MPAA) • ffice for National Statistics, UK population data O by Government Office Region Northern Ireland Department of Enterprise, Trade and Investment (DETINI) • ritish Federation of Film Societies, Cinema for B All Survey results Nielsen Media Research Chapters 10 to 14: Film on video, television and Office for National Statistics (ONS) VoD, the film market as a whole and audiences Official UK Charts Company (OCC) Sources from previous chapters, plus: PricewaterhouseCoopers • British Video Association, BVA Yearbook 2010 Rentrak EDI • Official UK Charts Company, video charts Scottish Qualifications Authority (SQA) • roadcasters’ Audience Research Board, Television B Screen Digest Audience Measurement Service Skillset • ttentional Ltd, database of film on UK A television, 2009 WJEC Acknowledgements and sources – 199
  • 202.
    • creenDigest, Global Media Intelligence (monthly), S • killset, Film production workforce survey, 2008 S Online Movie Strategies (report), Video Intelligence • killset, Labour Market Intelligence Digest for S and Broadband Media Intelligence Film, 2009 • inema Advertising Association, 2009 Film Monitor C • killset, Employment Census of the Creative Media S (Quarterly Reports) and FAME: Film Audience Industries, 2009 Measurement and Evaluation report, 2010 • uropean Audiovisual Observatory, DDM and NPA E Conseil – Video on Demand and catch-up TV in Europe, October 2009 Chapters 15 to 21: British film certification, film production, public investment in film in the UK, film education, film companies, the UK film economy and employment. Sources from previous chapters, plus: • epartment for Culture Media and Sport, British film D certification data • K Film Council Film Certification Unit, British film U certification data • orthern Alliance, public investment in film 2008/09, N March 2010 • ESA Student Record 2002/03 – 2009/10, Higher H Education Statistics Agency Limited • oint Council for Qualifications (JCQ), National Results J 2002–2009 • cottish Qualifications Authority, Pre-Appeals Data S 2002–2009 • uropean Audiovisual Observatory, 2009 Yearbook, E Volume 3 • ffice for National Statistics, Annual Business O Inquiry, 2009 • ffice for National Statistics, Size Analysis of UK O Businesses (VAT and PAYE data), 2009 • ricewaterhouseCoopers, Global Entertainment and P Media Outlook 2010–14, June 2010 • ffice for National Statistics, International O transactions of the UK film and television industries 2008, 9 December 2009 • xford Economics, The Economic Impact of the UK O Film Industry, June 2010 • ffice for National Statistics, Labour Force Survey, O Quarterly to September 2009 • orthern Ireland Department of Enterprise, Trade N and Investment, Northern Ireland Census of Employment, 2007 200 – UK Film Council Statistical Yearbook 2010
  • 204.
    Statistical Yearbook 2010 UKFilm Council 10 Little Portland Street London W1W 7JG T +44 (0)20 7861 7861 F +44 (0)20 7861 7862 This Statistical Yearbook is available online at www.ukfilmcouncil.org.uk