Downloaded 11 times

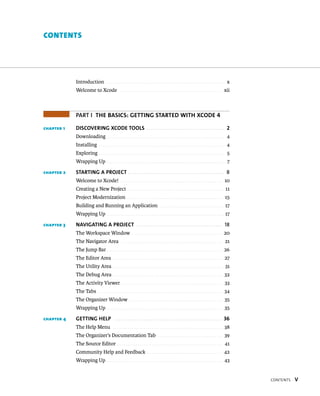
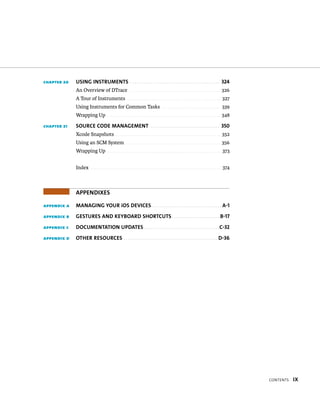
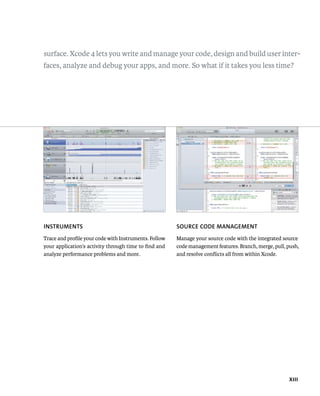


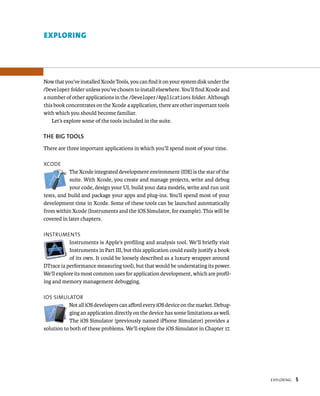

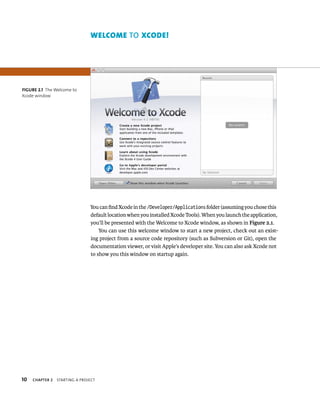
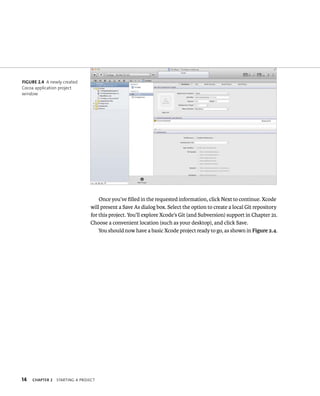
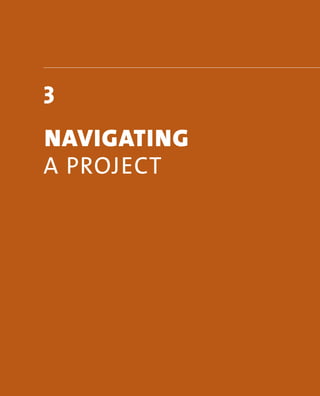
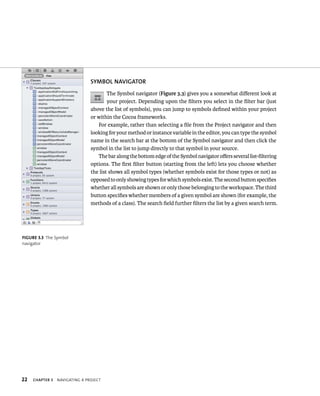
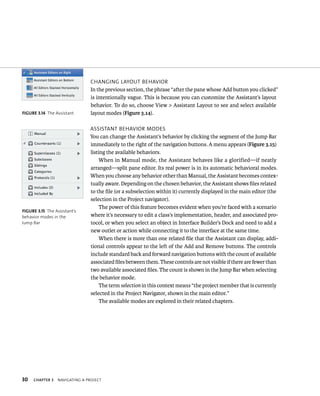
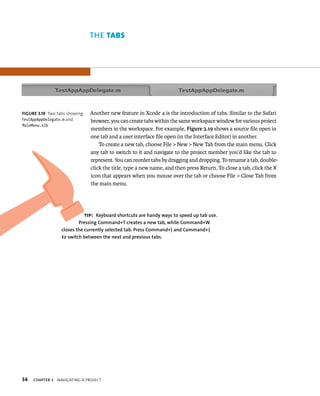

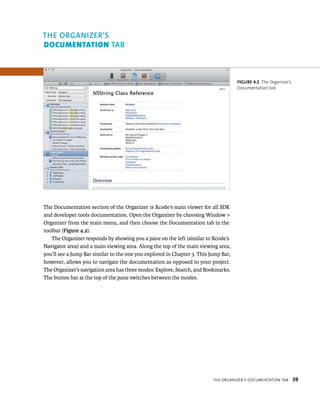
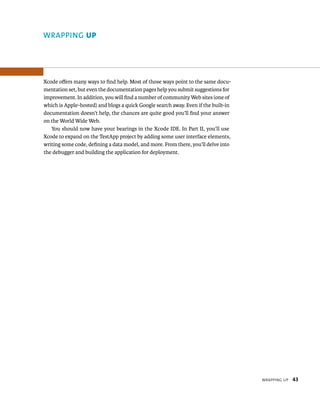


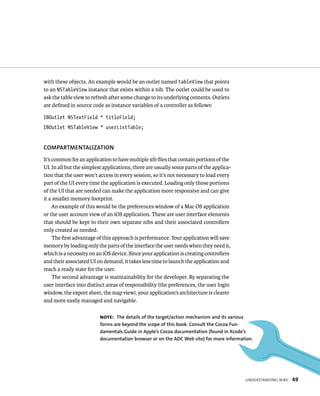
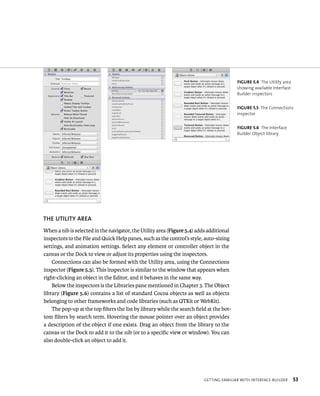
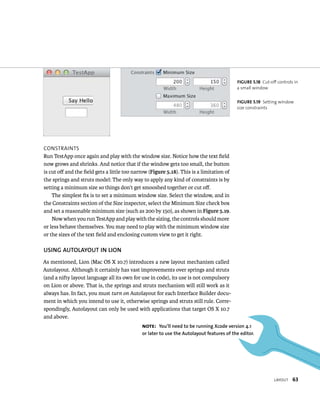
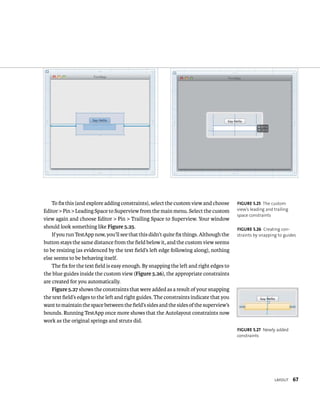
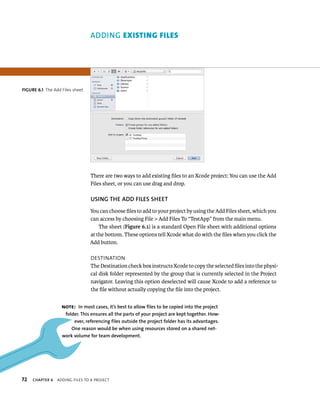
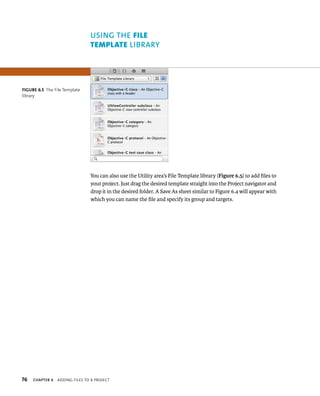
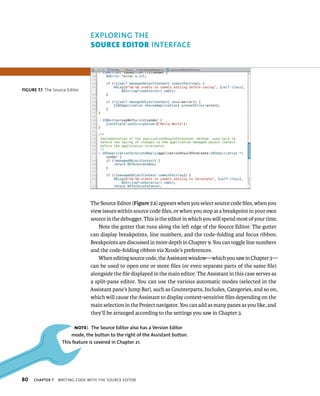
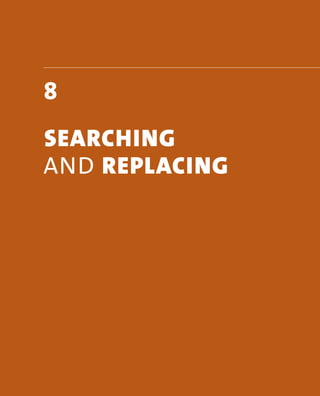
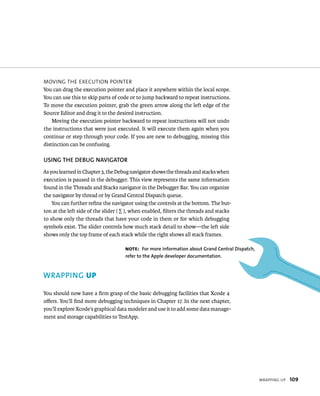
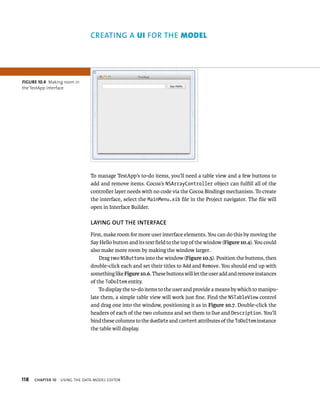
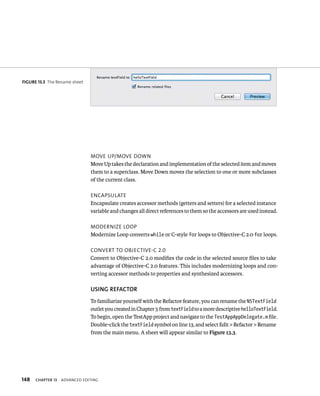
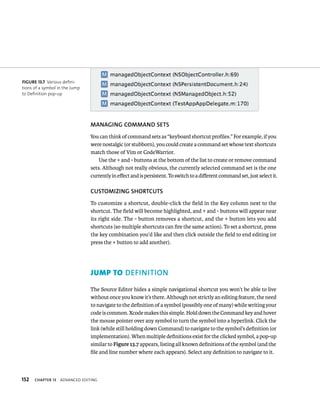
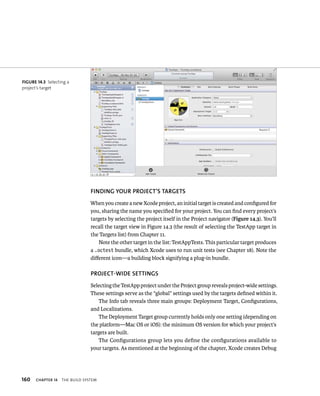
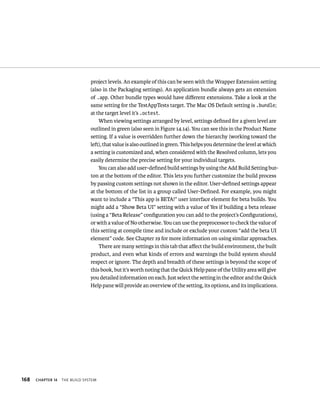
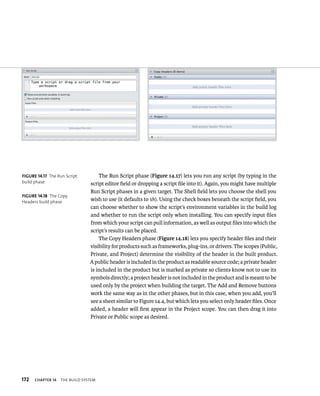
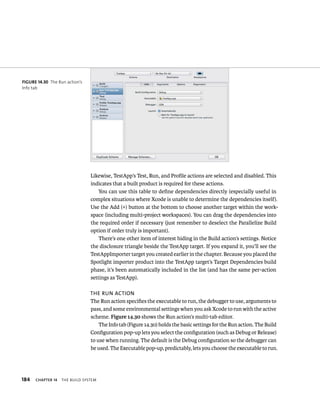
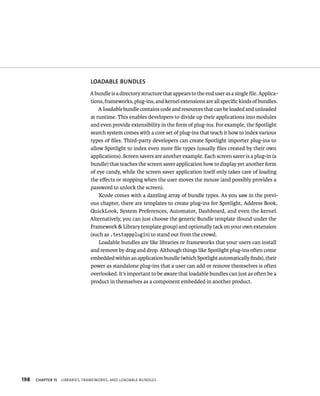
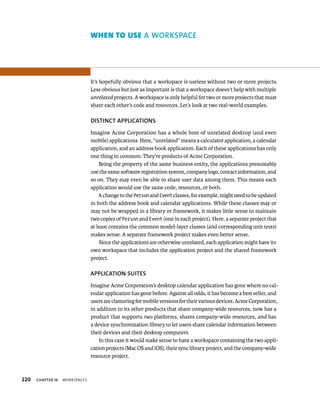
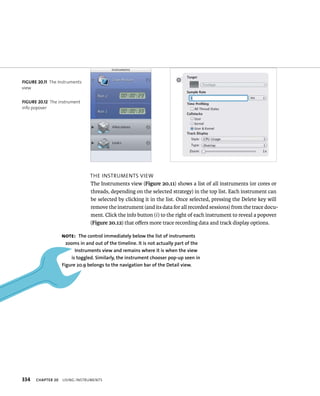
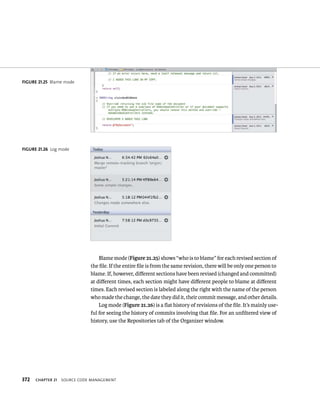
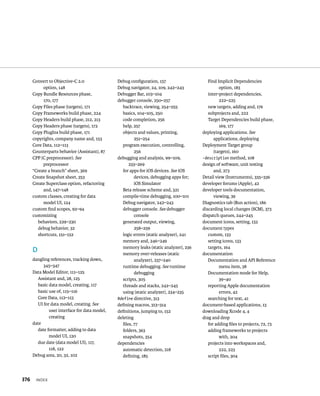
![56 You’ll need to add some code to make the action do something interesting.
Navigate to the TestAppAppDelegate.m file (the implementation file for the
TestAppAppDelegate class), and scroll down to find the -sayHello: method. Edit
it to look like the following:
- (IBAction)sayHello:(id)sender {
[[NSAlert alertWithMessageText:@”Important Message”
ChAPTER 5 CreatIng user InterFaCes
defaultButton:@”Hello Yourself”
alternateButton:nil
otherButton:nil
informativeTextWithFormat:@”Hello World”] runModal];
}
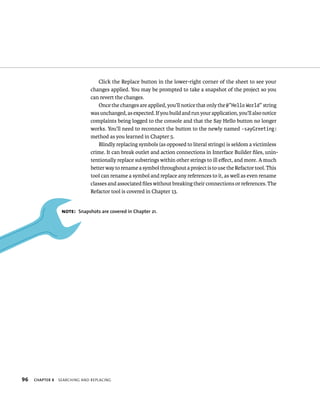
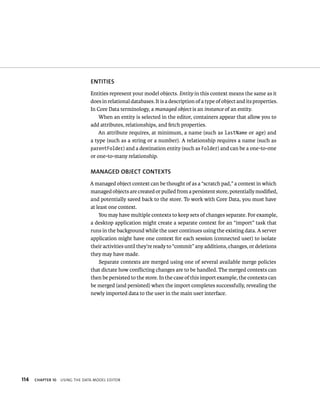
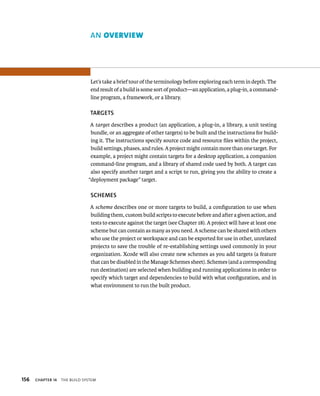
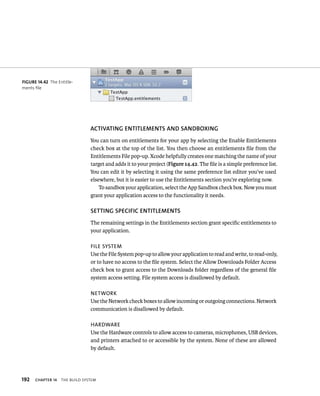
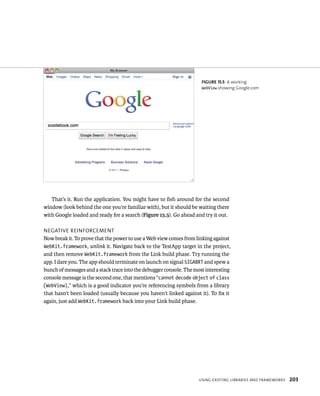
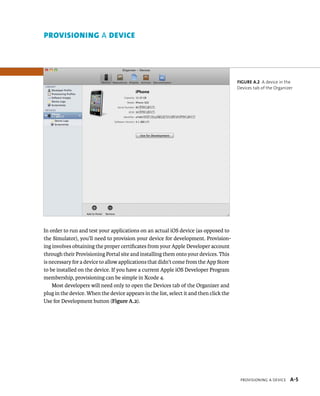
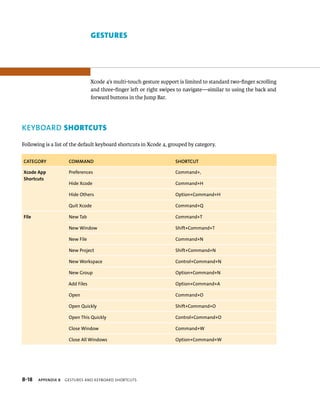
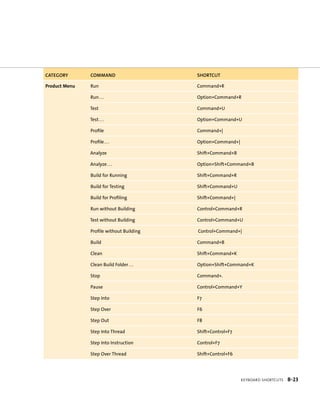
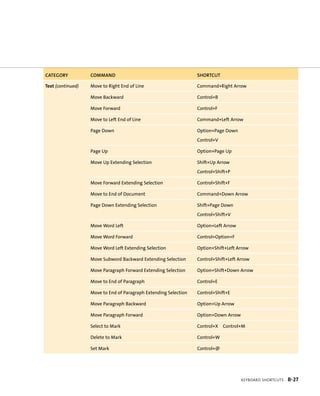
Click the Run button to build and run the application. Give your Say Hello
button a test click to make sure it’s working. You should see something similar to
Figure 5.9. When you’re satisfied, quit the application and navigate back to the
MainMenu.nib file.
fiGURe 5 9 TestApp displaying
its Hello World dialog box](https://image.slidesharecdn.com/peachpit-141129150150-conversion-gate01/85/Peachpit-mastering-xcode-4-develop-and-design-sep-2011-71-320.jpg)
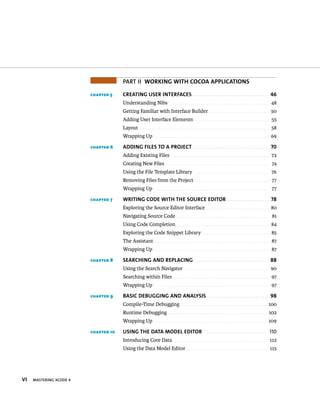
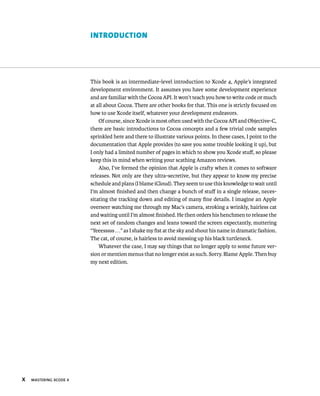
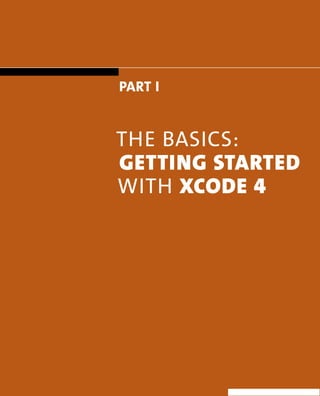
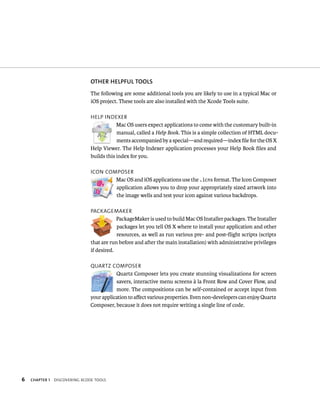
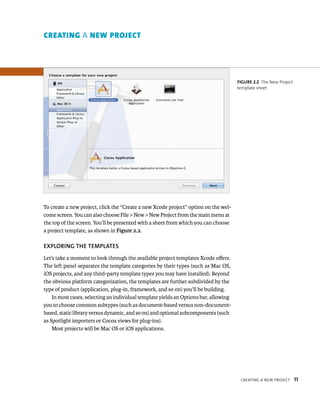
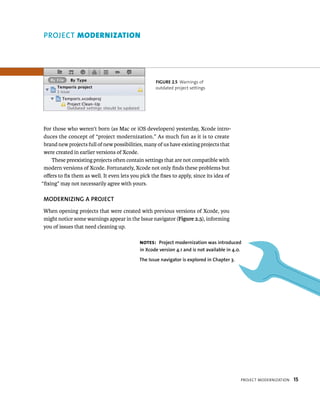
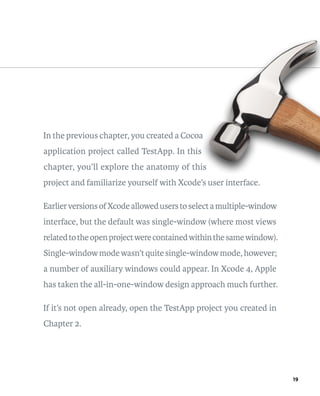
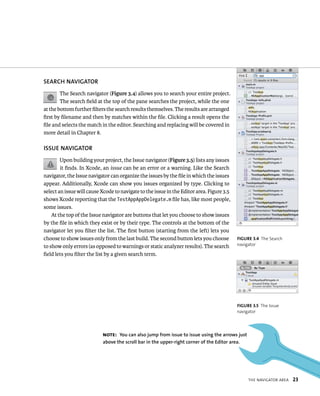
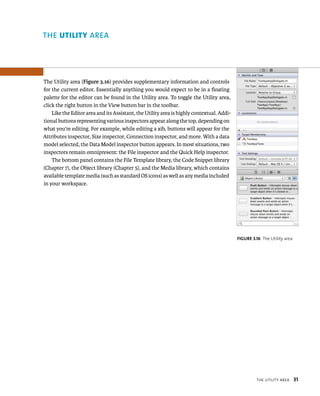
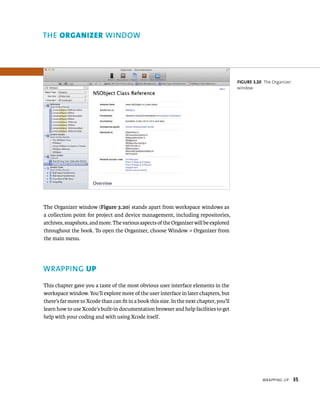
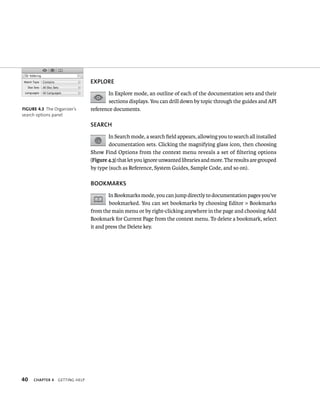
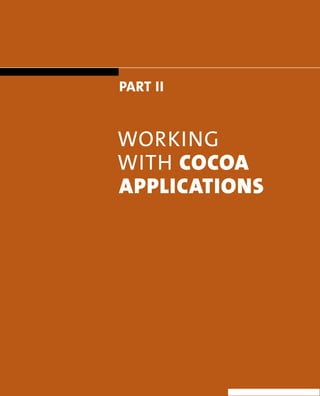
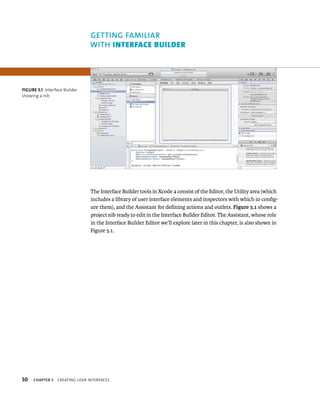
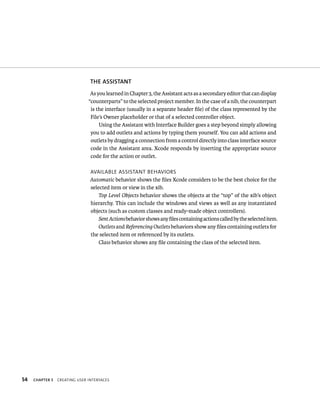
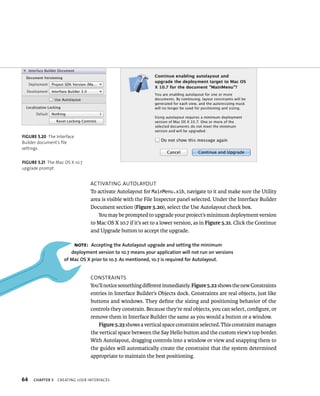
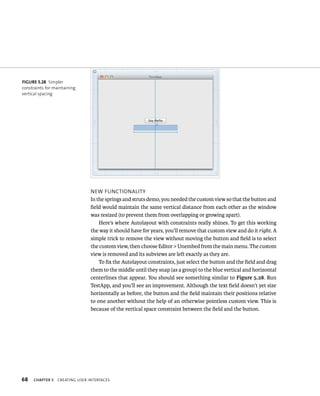
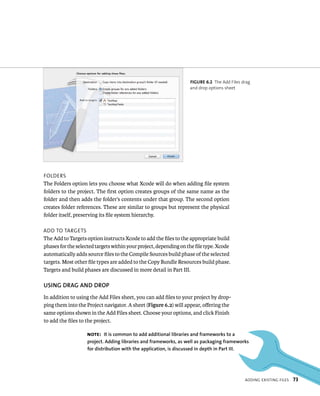
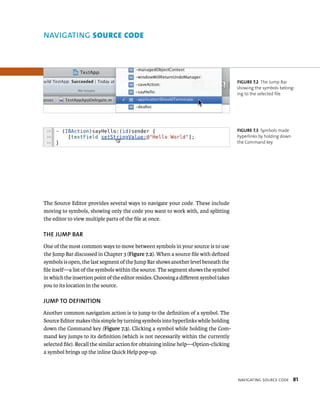
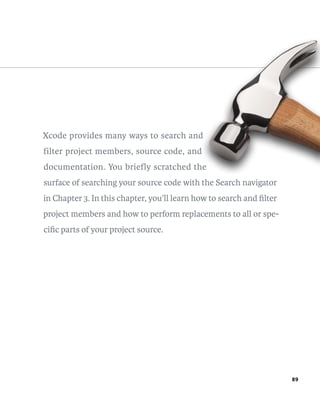
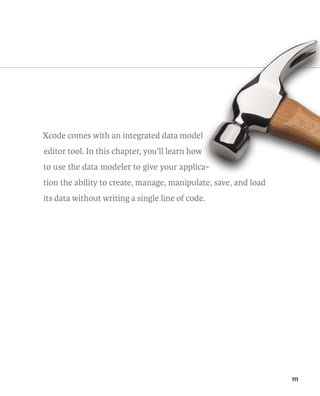
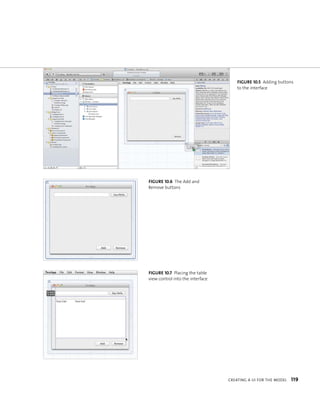
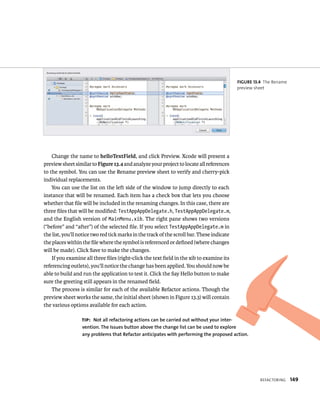
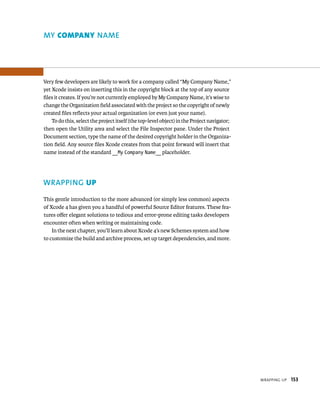
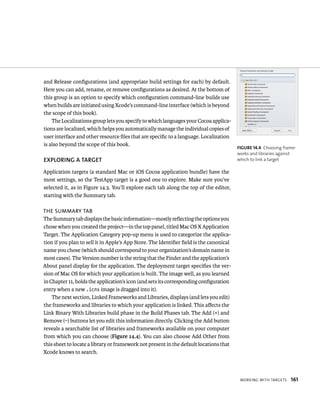
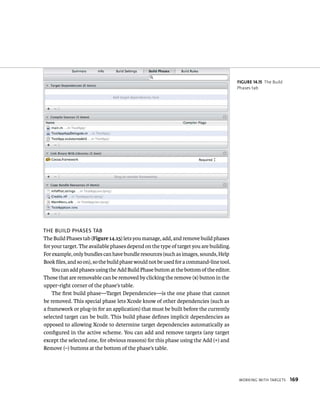
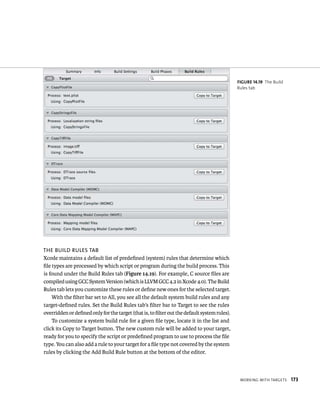
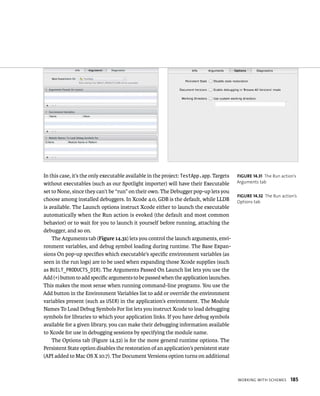
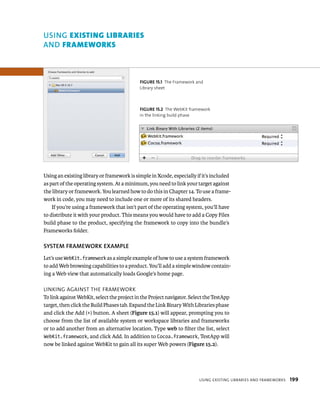
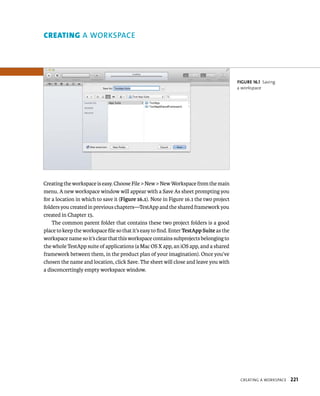
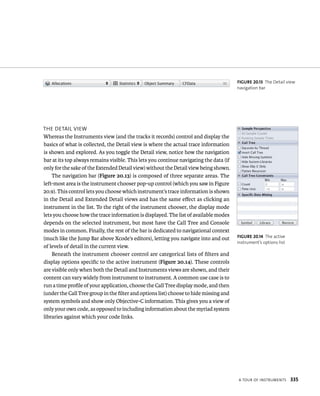
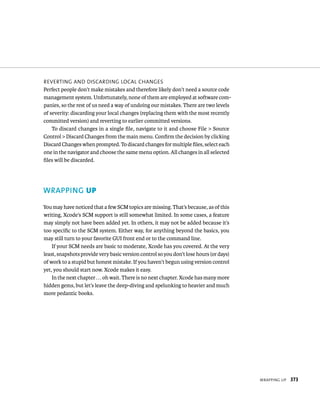
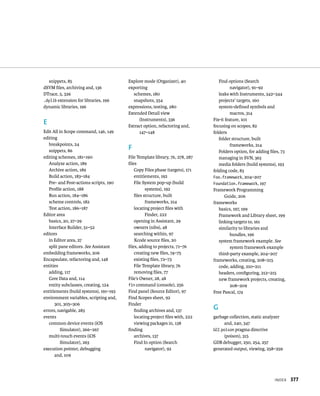
![ADDING A TEXT fIElD
Perhaps you believe modal dialog boxes are overused, so you’ll want to put that
text into a text field in the application’s window. Find the Text Field control in the
Object library, and drag it into your window. To communicate with the text field
and set its string value to Hello World, you’ll need to create an outlet for it.
To add the outlet, drag a connection from the text field to the source code in
the Assistant. This time, place the connection within the curly braces (because
outlets are instance variables of a class). Choose the Outlet connection type, name
it textField, and then press Return to finish adding the outlet.
Now that your code has a reference to the text field, you can change the action
to display the message there rather than in a modal dialog box. Navigate back to
the –sayHello: action in the TestAppAppDelegate.m file, and change it to look
like the following:
- (IBAction)sayHello:(id)sender {
[textField setStringValue:@”Hello World”];
}
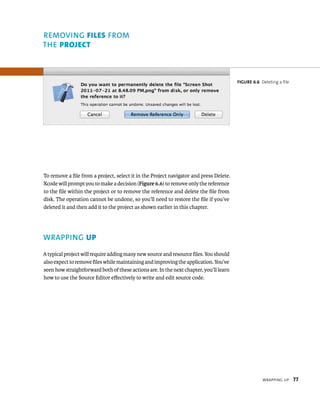
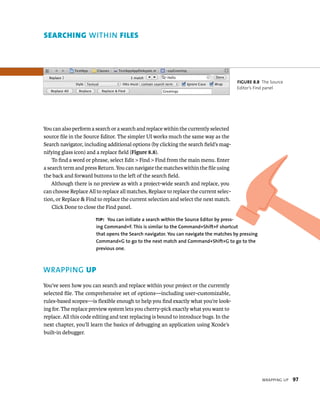
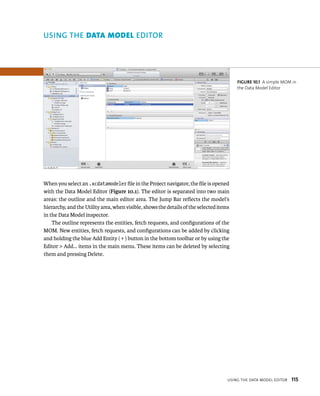
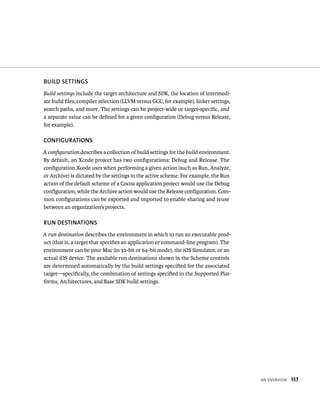
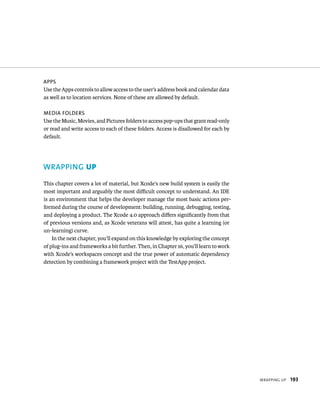
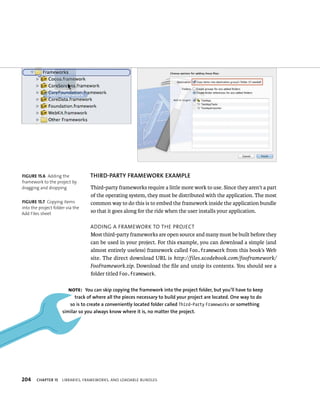
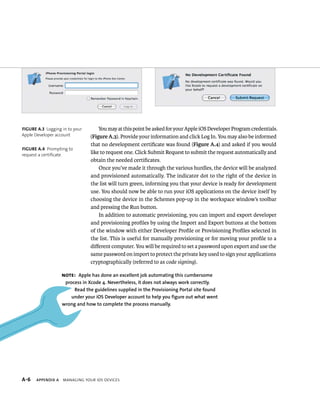
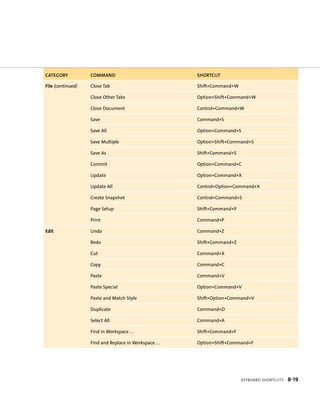
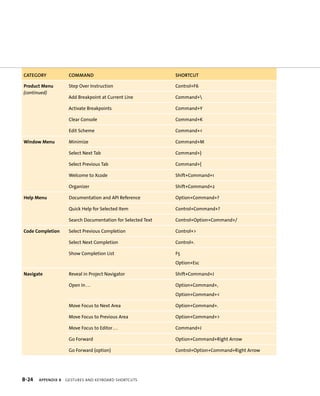
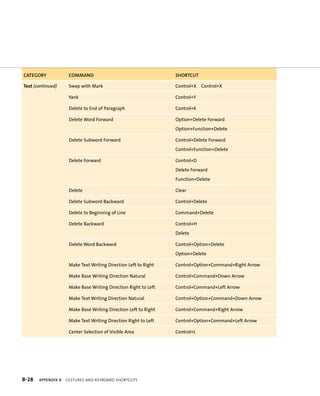
Build and run the application, and verify everything is working. Your applica-tion
should look something like Figure 5.10.
fiGURe 5 10 TestApp showing
its Hello World message in a
text field
addIng user InterFaCe elements 57](https://image.slidesharecdn.com/peachpit-141129150150-conversion-gate01/85/Peachpit-mastering-xcode-4-develop-and-design-sep-2011-72-320.jpg)
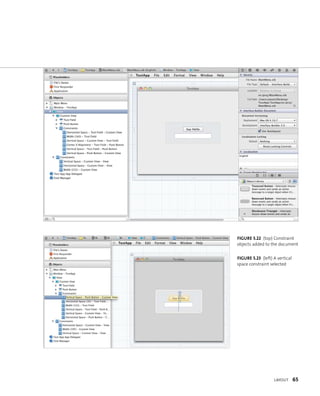
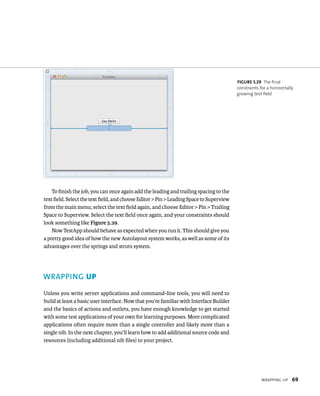

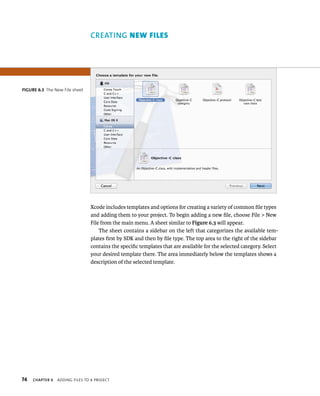
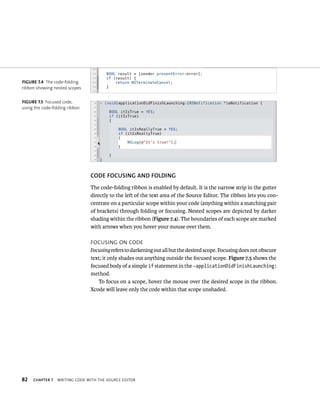


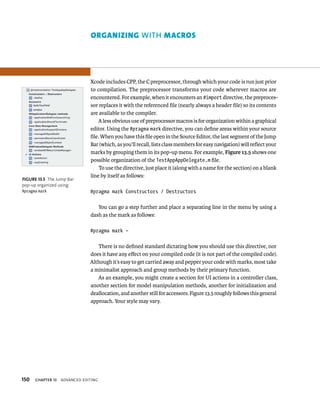
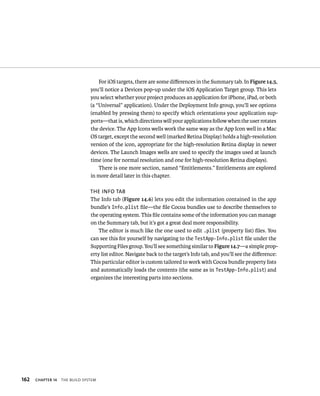
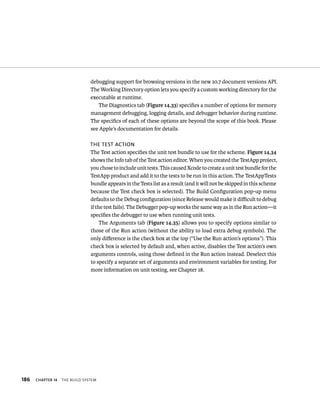


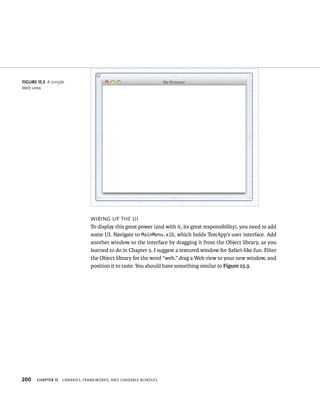
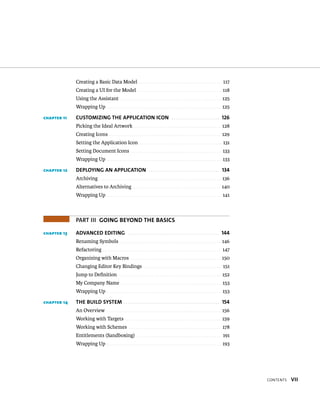
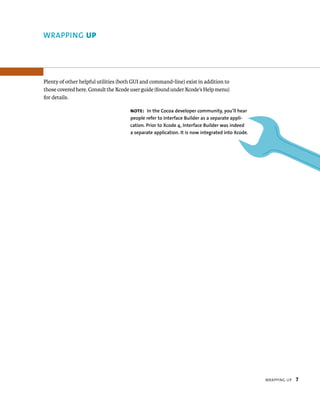
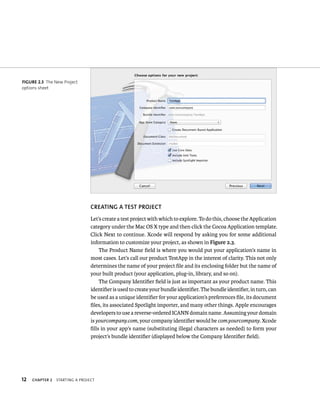
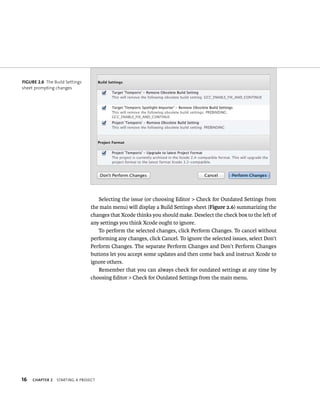
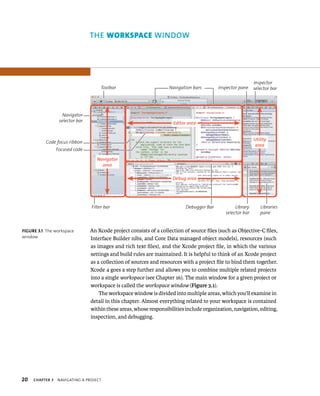
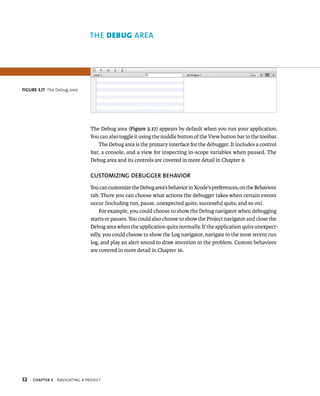
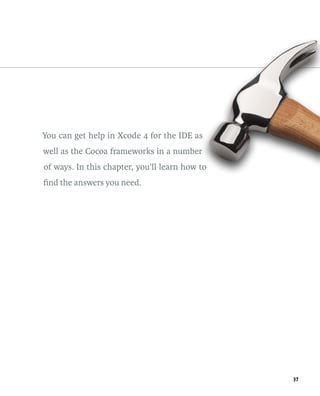
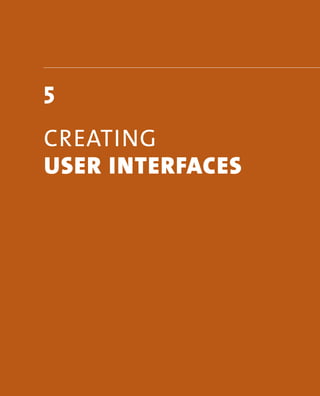
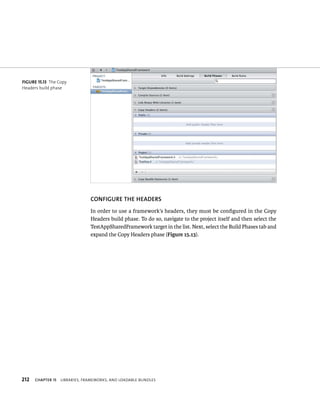
![202 usIng tHe FrameWork In Code
Now you just need to add some code to load Google.com into the Web view when
the application launches. Before you can use symbols from WebKit, you have to
include its main header. Since you reference a WebView as an outlet in the app del-egate’s
header, it’s easiest to import the WebKit header there. Since the Assistant
window is already open to it, find the #import statement near the top of the source
file and add the following code on a new line after it:
#import <WebKit/WebKit.h>
Navigate to the implementation file (TestAppAppController.m) and find
the -applicationDidFinishLaunching: method. Add the following code into the
body of the method:
NSURL * googleURL = [NSURL URLWithString:@”http://google.com”];
NSURLRequest * request = [NSURLRequest requestWithURL:googleURL];
[[webView mainFrame] loadRequest:request];
tip: The WebKit.h header is an “umbrella” header that includes
any other headers in the WebKit framework. Referencing this
header includes all headers from WebKit.
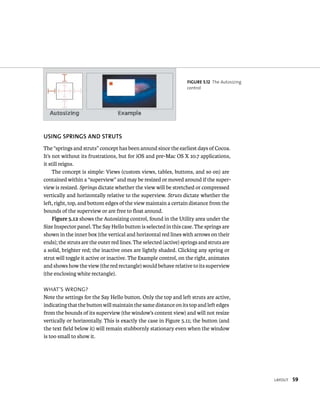
ChAPTER 15 lIBrarIes, FrameWorks, and loadaBle Bundles](https://image.slidesharecdn.com/peachpit-141129150150-conversion-gate01/85/Peachpit-mastering-xcode-4-develop-and-design-sep-2011-217-320.jpg)
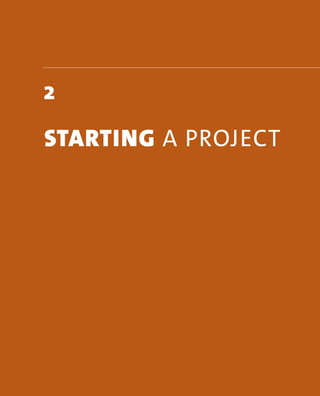
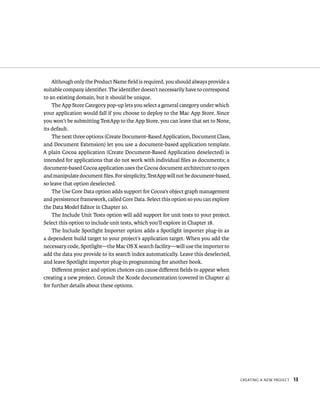
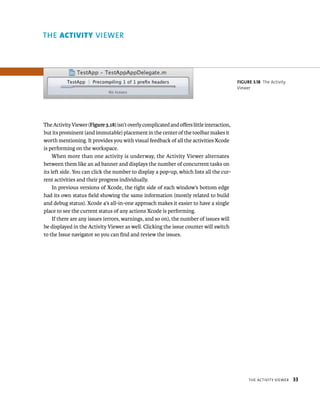
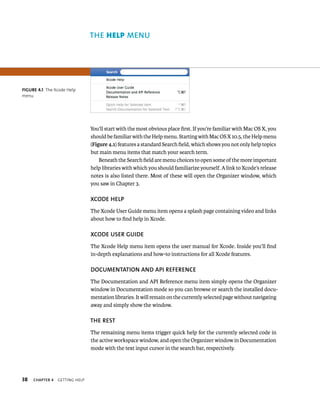
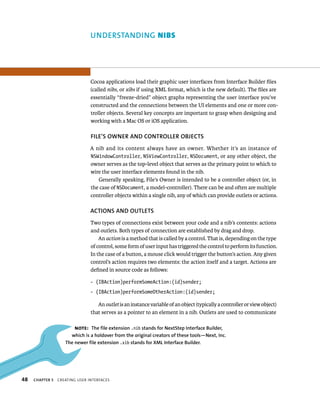
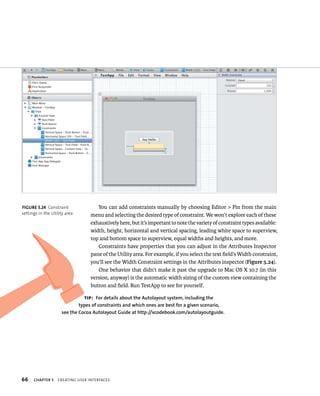
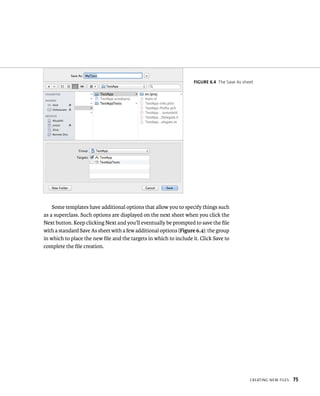
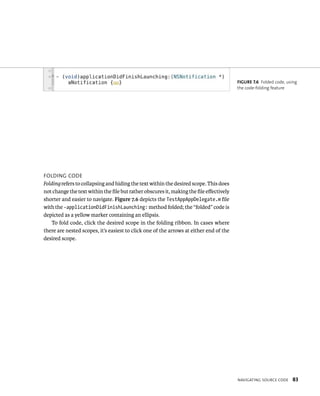
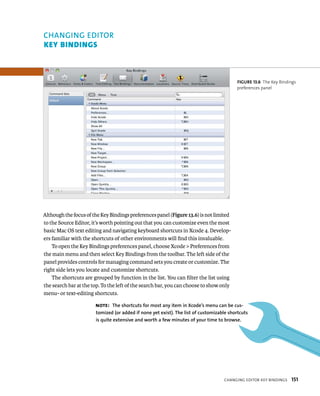
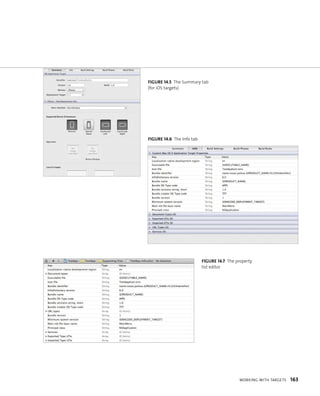
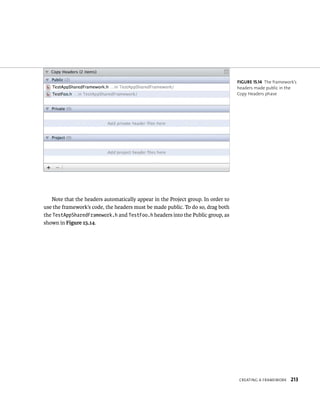
![usIng tHe FrameWork In Code
Foo.framework doesn’t have any UI components, but it provides two classes:
MyFoo and MyBar. You can verify this by creating an instance of two classes
provided by the framework and logging their descriptions to the console. You’ll
do this at application launch, as in the previous example, so navigate to the
-applicationDidFinishLaunching: method of the TestAppAppDelegate.m source
file and add the following to its body:
MyFoo * foo = [[[MyFoo alloc] init] autorelease];
MyBar * bar = [[[MyBar alloc] init] autorelease];
NSLog(@”Foo says: %@”, foo);
NSLog(@”Bar says: %@”, bar);
Remember to add the following to import the framework’s header so Xcode is
tip: If you’re unsure which header to include, you can either use AutoComplete or
expand the framework itself in the Project navigator list, open its headers subfolder,
and take a look around. Also, most frameworks have an umbrella header named for the
framework itself, such as “Foo.h” for Foo.framework or “WebKit.h” for WebKit.framework.
usIng eXIstIng lIBrarIes and FrameWorks 207
aware of the new symbols the framework provides:
#import <Foo/Foo.h>
Run TestApp and watch the debugger console’s output. You should see some-thing
like the following:
2011-03-05 15:50:57.623 TestApp[40877:903] Foo says: <MyFoo:
p0x1006f0b10> - Foo!
2011-03-05 15:50:57.623 TestApp[40877:903] Bar says: <MyBar:
p0x1006f1670> - Bar!
To summarize, the extra steps to use a third-party framework are: adding it
to your project, optionally copying it into the project folder when adding it, and
embedding it into your application bundle so it’s distributed with the application.](https://image.slidesharecdn.com/peachpit-141129150150-conversion-gate01/85/Peachpit-mastering-xcode-4-develop-and-design-sep-2011-222-320.jpg)
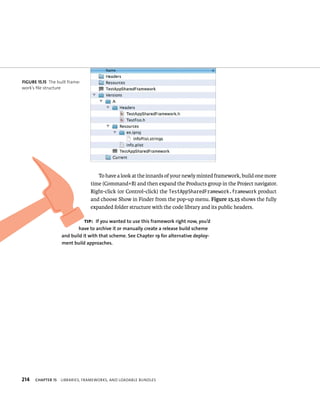
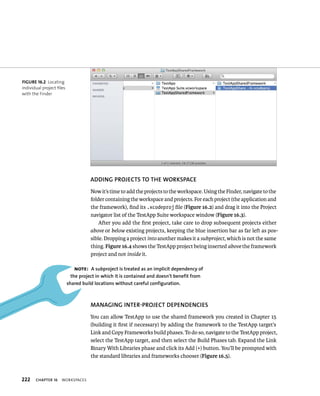
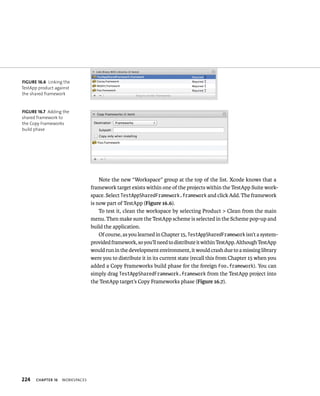
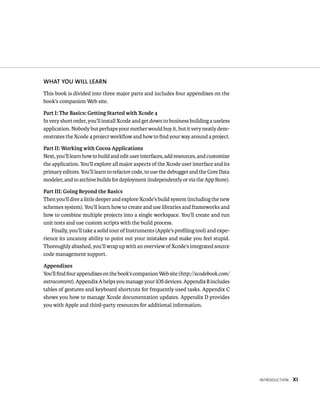
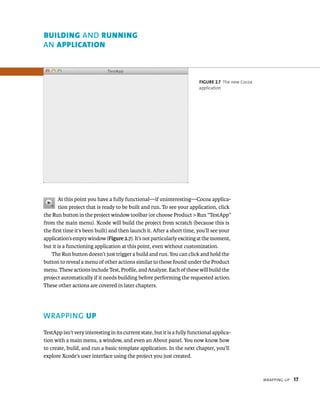
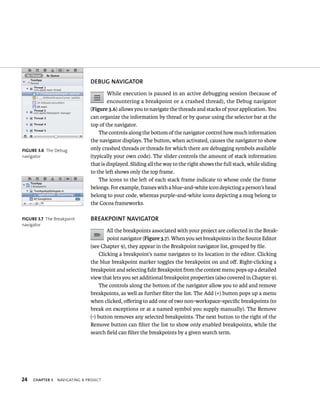
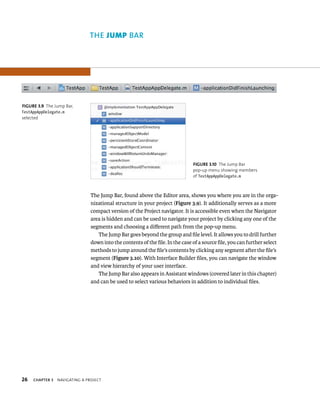
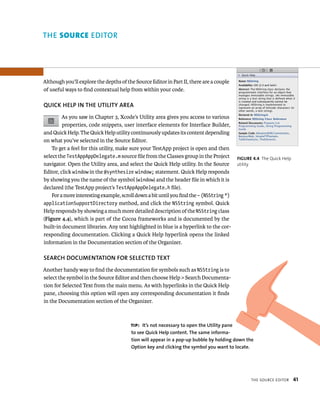
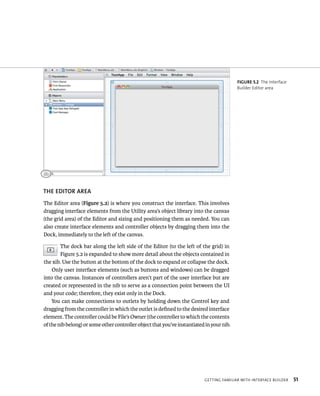
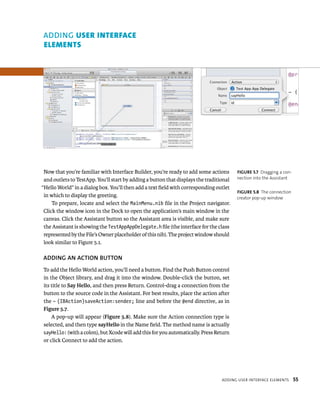
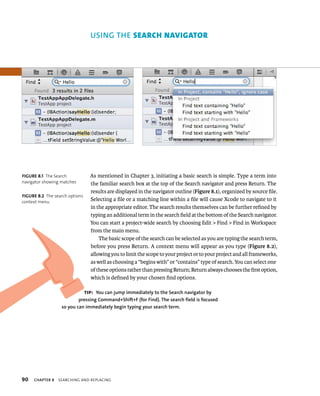
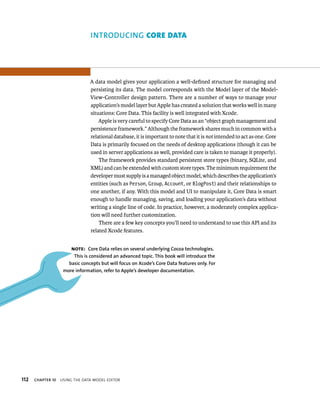
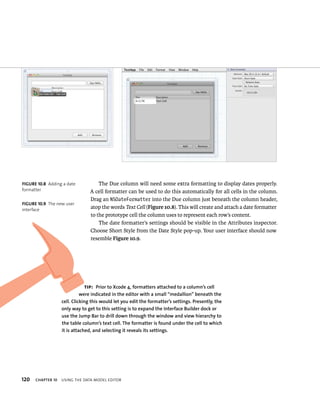
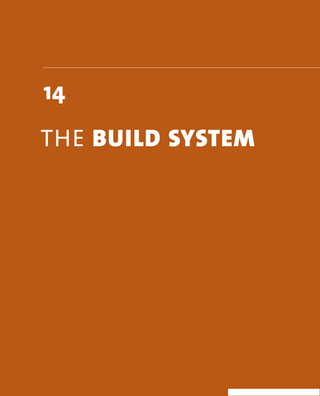
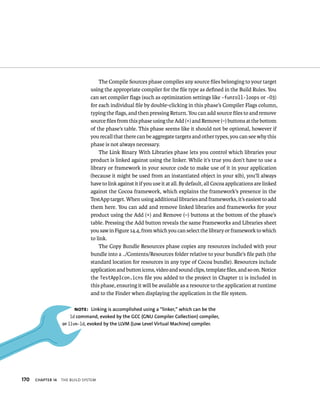
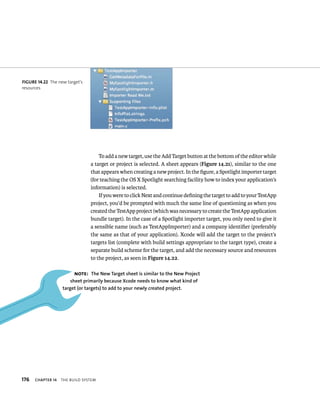
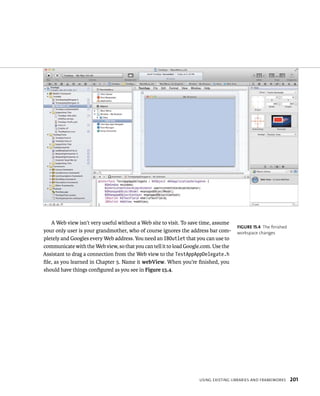
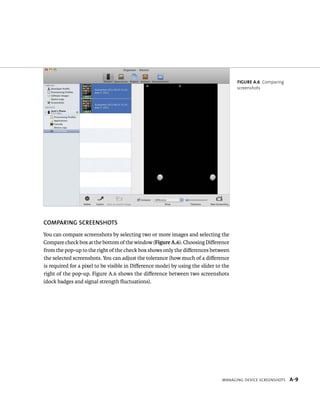
![CreatIng a WorkspaCe 225
As you may also recall from Chapter 15, in order to use the framework, you’ll
need to include its header. To verify that everything is working, add the follow-ing
to the header include section near the top of the TestAppAppDelegate.m file:
#import <TestAppSharedFramework/TestAppSharedFramework.h>
At the end of the -applicationDidFinishLaunching: method—which should
now be familiar to you—add the following:
TestFoo * testFoo = [[[TestFoo alloc] init] autorelease];
NSLog(@”TestFoo says: %@”, testFoo);
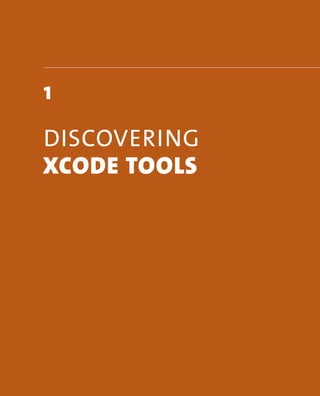
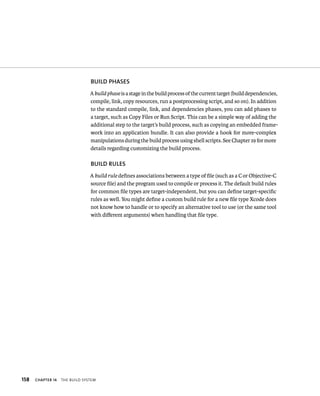
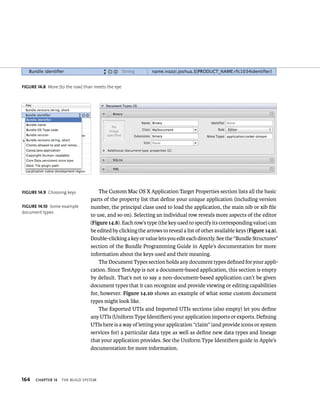
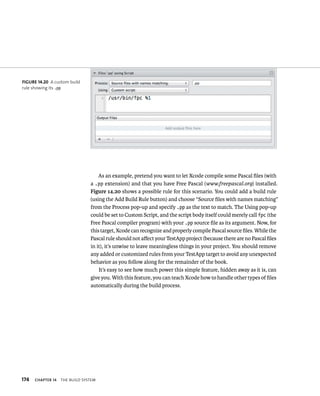
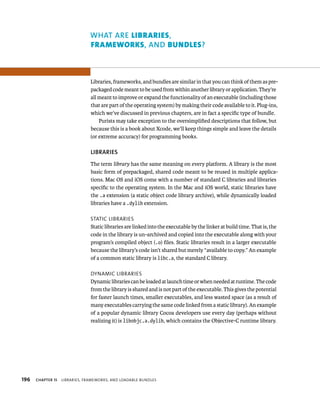
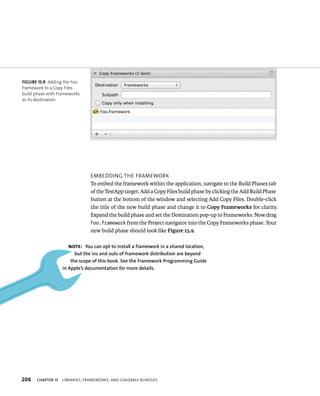
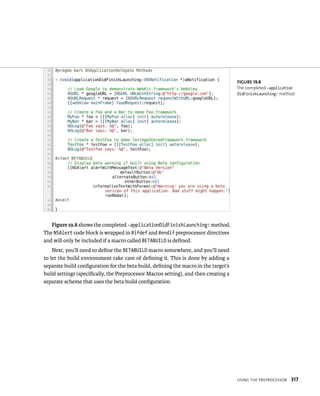
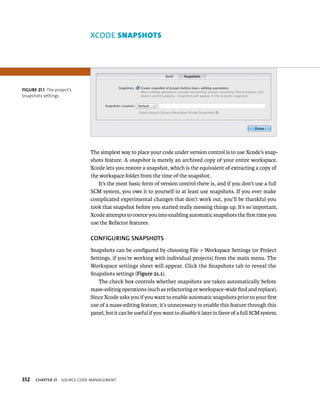
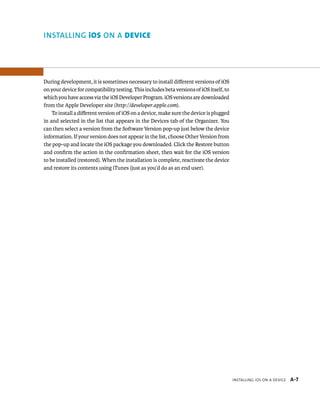
Figure 16.8 shows the complete -applicationDidFinishLaunching: method.
Once you’ve finished, run TestApp and check the debugger console for a success-ful
message from the TestFoo class that comes from TestAppSharedFramework.
fiGURe 16 8 The complete
-applicationDidFinish
Launching: method](https://image.slidesharecdn.com/peachpit-141129150150-conversion-gate01/85/Peachpit-mastering-xcode-4-develop-and-design-sep-2011-240-320.jpg)
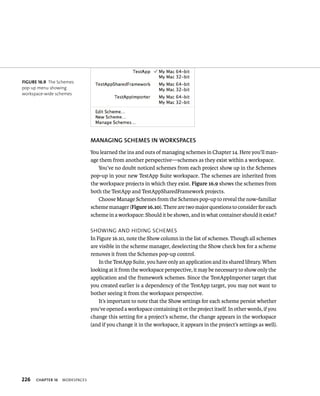
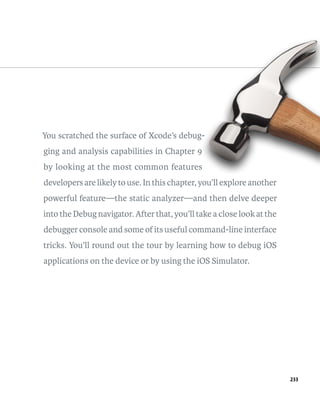
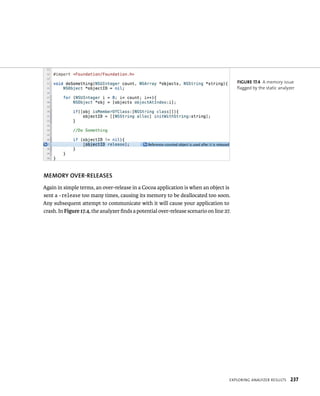
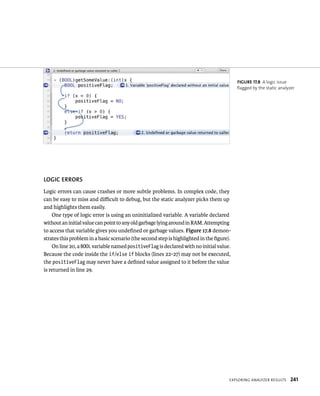
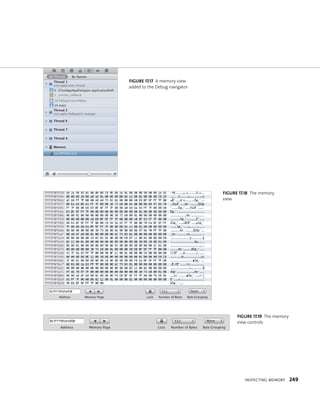
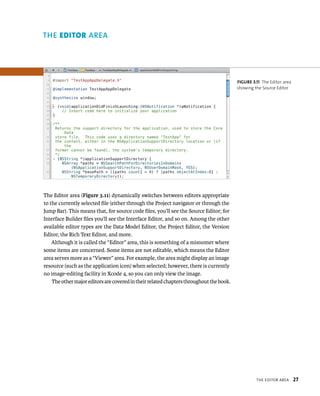
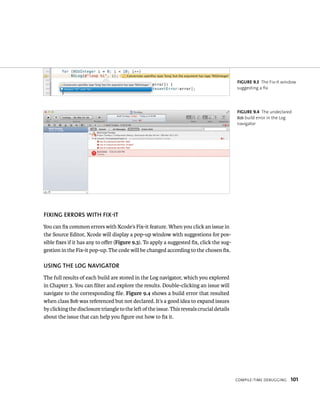
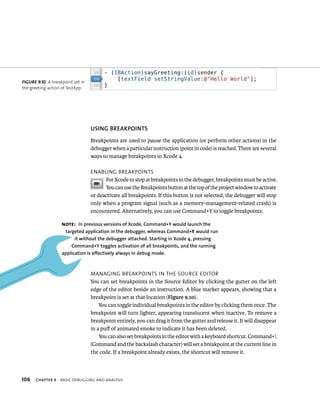
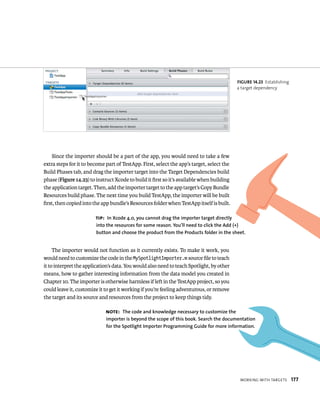
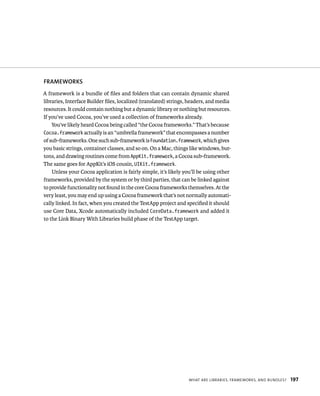
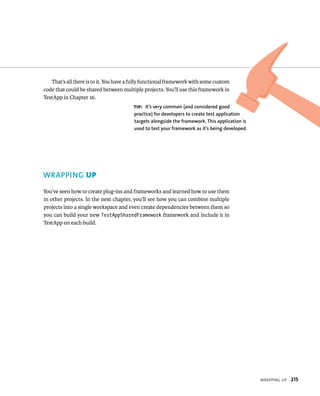
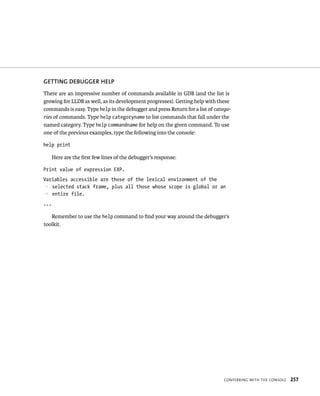
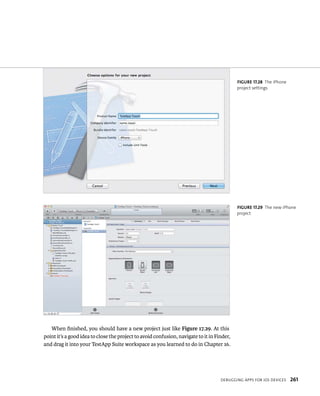
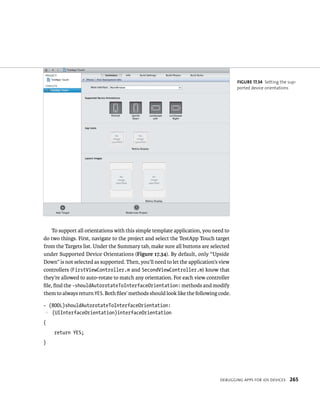
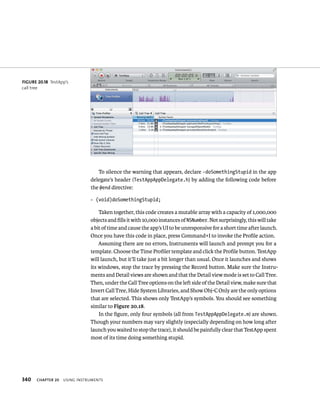
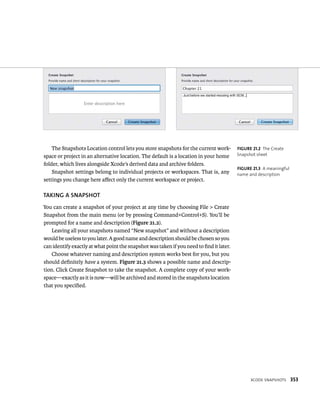
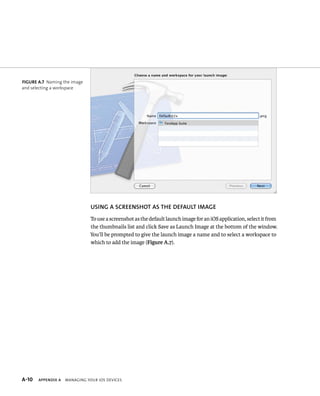
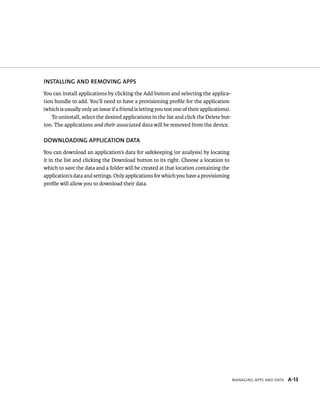
![The debugger will respond by logging the string returned when the NSURL object
is asked for its -description. Figure 17.22 shows the results in the debugger console.
You can also print self when stopped within a method belonging to an
instance of an Objective-C class. In the current scope of the example, self refers
to an instance of the TestAppAppDelegate class. Figure 17.23 shows the result of
printing self in this scope. In this case, the TestAppAppDelegate class doesn’t
override -description, so the information displayed is the default description
format inherited from NSObject. That is, the class name and address of the instance
being printed are given.
Of course you can also print objects through the accessors of other objects.
For example, NSURL has a string property called -scheme. To print the scheme of
the NSURL instance assigned to googleURL, you can issue the following command:
po [googleURL scheme]
fiGURe 17 22 Printing an
object in the debugger console
fiGURe 17 23 Printing self
h](https://image.slidesharecdn.com/peachpit-141129150150-conversion-gate01/85/Peachpit-mastering-xcode-4-develop-and-design-sep-2011-267-320.jpg)
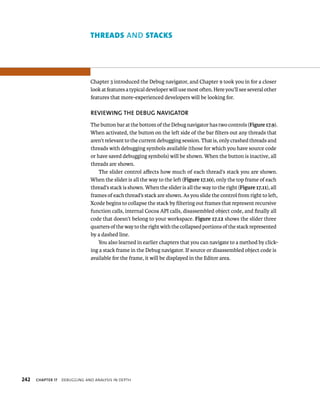
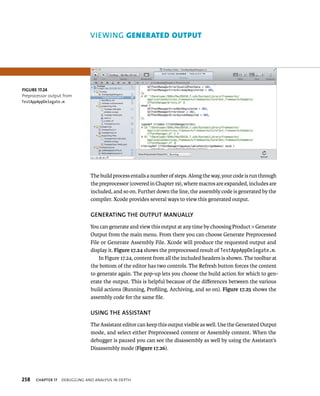
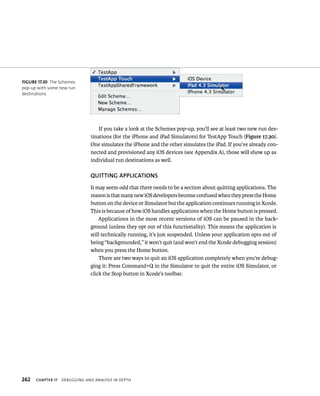
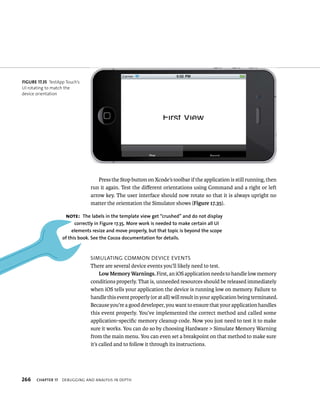
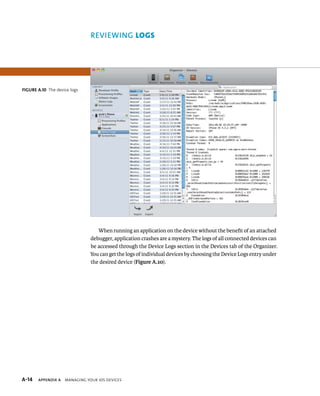
![The debugger calls the URL object’s -scheme method, then calls the returned
ConFerrIng WItH tHe Console 253
object’s -description and prints this:
http
The information you see in the examples isn’t particularly exciting, but it can be
enough to differentiate two similar objects inside a printed NSArray or NSDictionary
object. While many objects in the Cocoa API come with reasonably useful descrip-tions,
it’s up to the developer to override -description in their own objects and
provide meaningful descriptions for their own debugging.
prIntIng values
The po command works only on objects. What about values of primitives? What if
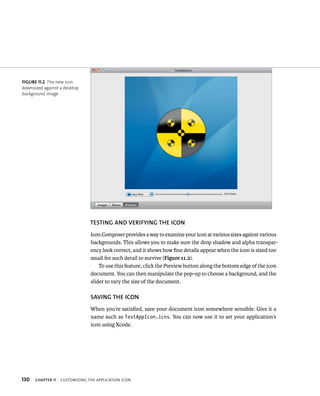
you wanted to know the length of the string returned by the URL object’s scheme
for some reason? You might expect the following command to work:
po [[googleURL scheme] length]
It won’t work because the -length method of NSString returns an NSUInteger—a
primitive type, not an object. For primitive values, you use a different print command.
p (NSUInteger)[[googleURL scheme] length]
The debugger responds with this:
$1 = 4
There certainly are four characters in the string http. Let’s take a quick look at
the structure of the command and its response.
The command p (short for print) expects the result of the statement you give
it to evaluate ([[googleURL scheme] length]) to be cast to the expected type
(NSUInteger) so it knows how to represent it. This type should be the return type
of the method or function that ultimately returns the value (the outermost call
in nested calls). In the case of NSString’s -length method, that’s an NSUInteger.](https://image.slidesharecdn.com/peachpit-141129150150-conversion-gate01/85/Peachpit-mastering-xcode-4-develop-and-design-sep-2011-268-320.jpg)
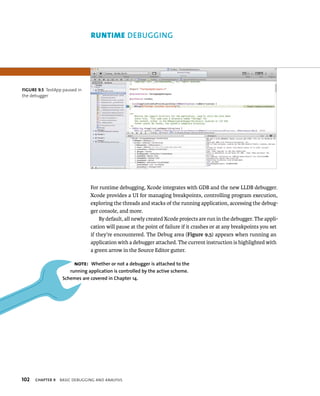
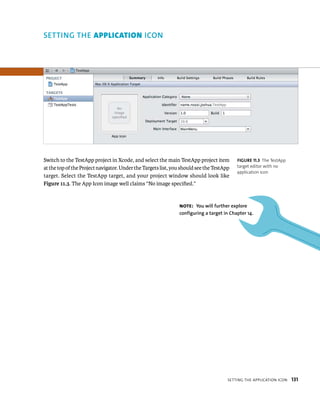
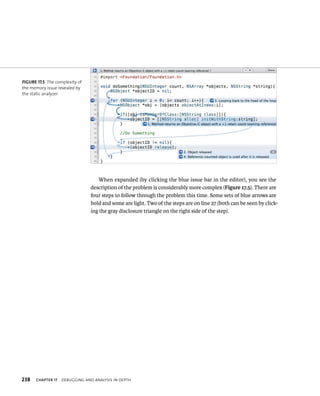
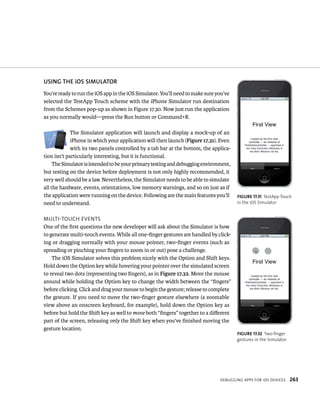
![The response is actually more interesting than it looks. The debugger not only
prints the result but kindly assigns it to a local variable for you to use in future
evaluations. In this example, the number 4 (the length of the scheme string) was
assigned to the variable $1. To use this is simple. Imagine you can’t work out in
your head the math necessary to multiply the length by two. No problem! GDB
can do it for you!
p (NSUInteger)($1 * 2)
GDB performs this complex computation and responds with:
$2 = 8
Notice how even that evaluation was assigned to a new variable, $2. There are
many more tricks up print’s sleeves, which you can find at http://xcodebook.com
/printf, but let’s move on.
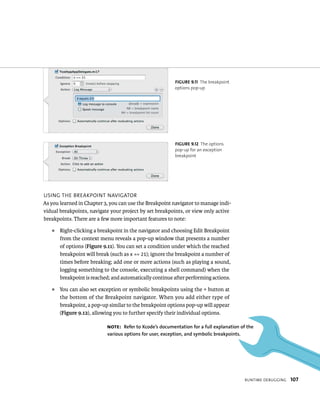
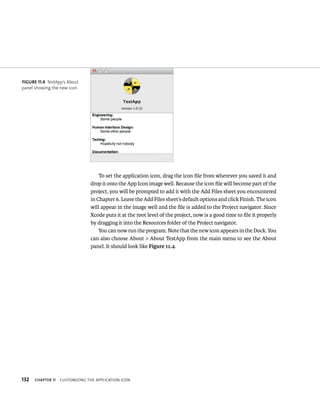
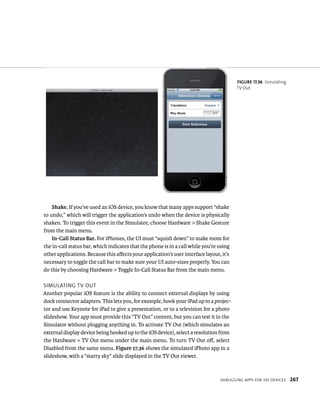
vIEWING ThE BACKTRACE
The backtrace in the current (paused) point in the application is the same infor-mation
that is displayed under a paused thread in the Debug navigator: the stack.
While Xcode’s user interface gives you nicely formatted information that can be
used to navigate and control the debugging session, it’s not very handy for sharing
information with others on a forum or mailing list, for example. It’s often helpful
to be able to obtain a textual representation of the backtrace. Assuming TestApp
is still paused in the same place as in the previous examples, issuing a backtrace
command (bt for short) produces the following output:
#0 -[TestAppAppDelegate applicationDidFinishLaunching:]
p (self=0x10015e520, _cmd=0x7fff84ad29c5, aNotification=
p 0x114029af0) at /Users/jnozzi/Path/To/TestApp Suite/TestApp/
p TestApp/TestAppAppDelegate.m:42
#1 0x00007fff83b568ea in _nsnote_callback ()
#2 0x00007fff835f1000 in __CFXNotificationPost ()
#3 0x00007fff835dd578 in _CFXNotificationPostNotification ()
h](https://image.slidesharecdn.com/peachpit-141129150150-conversion-gate01/85/Peachpit-mastering-xcode-4-develop-and-design-sep-2011-269-320.jpg)
![ConFerrIng WItH tHe Console 255
#4 0x00007fff83b4d84e in -[NSNotificationCenter
p postNotificationName:object:userInfo:] ()
#5 0x00007fff83e3e3d6 in -[NSApplication
p _postDidFinishNotification] ()
#6 0x00007fff83e3e30b in -[NSApplication
p _sendFinishLaunchingNotification] ()
#7 0x00007fff83f09305 in -[NSApplication(NSAppleEventHandling)
p _handleAEOpen:] ()
#8 0x00007fff83f08f81 in -[NSApplication(NSAppleEventHandling)
p _handleCoreEvent:withReplyEvent:] ()
#9 0x00007fff83b84e42 in -[NSAppleEventManager
p dispatchRawAppleEvent:withRawReply:handlerRefCon:] ()
#10 0x00007fff83b84c72 in _NSAppleEventManagerGenericHandler ()
#11 0x00007fff88b50323 in aeDispatchAppleEvent ()
#12 0x00007fff88b5021c in dispatchEventAndSendReply ()
#13 0x00007fff88b50123 in aeProcessAppleEvent ()
#14 0x00007fff84e2c619 in AEProcessAppleEvent ()
#15 0x00007fff83e0e04b in _DPSNextEvent ()
#16 0x00007fff83e0d7a9 in -[NSApplication nextEventMatchingMask:
p untilDate:inMode:dequeue:] ()
#17 0x00007fff83dd348b in -[NSApplication run] ()
#18 0x00007fff83dcc1a8 in NSApplicationMain ()
#19 0x00000001000010c2 in main (argc=1, argv=0x7fff5fbff670) at
p /Users/jnozzi/Path/To/TestApp Suite/TestApp/TestApp/main.m:12
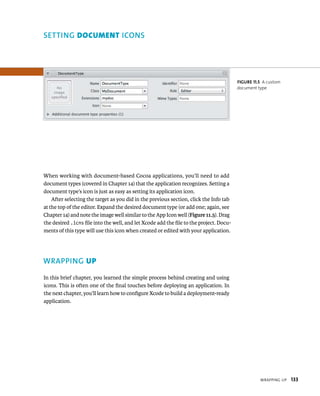
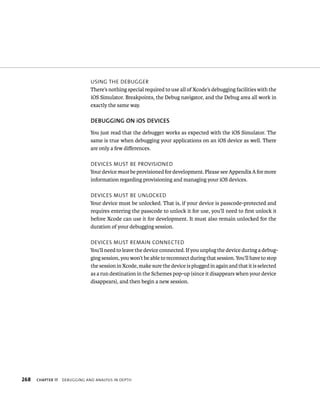
If you expand the frames under Thread 1 in the Debug navigator and then slide
the detail slider all the way to the right (to reveal all stack frames), you’ll see that
the information truly is the same. It’s nowhere near as pretty as what you see in
Xcode’s UI, but it’s helpful when sharing your misery with other developers in
hopes that they can help you.](https://image.slidesharecdn.com/peachpit-141129150150-conversion-gate01/85/Peachpit-mastering-xcode-4-develop-and-design-sep-2011-270-320.jpg)

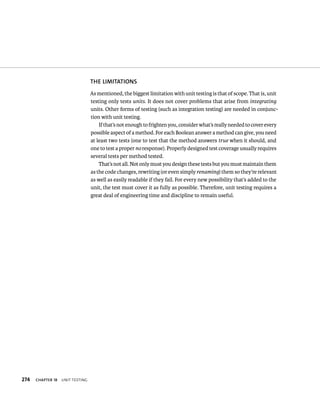
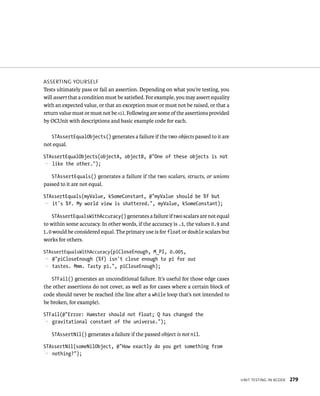
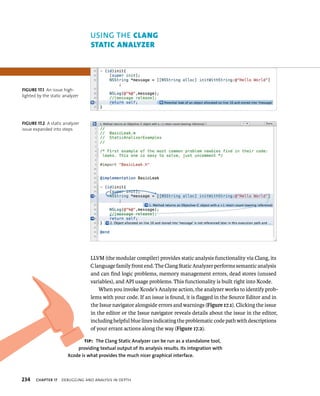
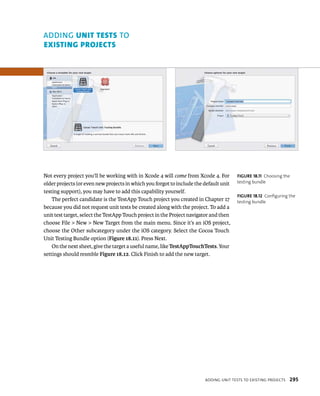
![280 ChAPTER 18 unIt testIng
STAssertNotNil() generates a failure if the passed object is nil.
STAssertNotNil(aValidObject, @”I visited this method and all I got
p was this lousy nil.”);
STAssertTrue() generates a failure if the passed Boolean (BOOL) expression
evaluates to false.
STAssertTrue((M_PI == 3.0f), @”Professor Frink says pi is exactly
p three!”);
STAssertFalse() generates a failure if the passed Boolean (BOOL) expression
evaluates to true.
STAssertFalse((1 == 1), @”We don’t BELIEVE in equality ‘round THESE
p parts, stranger!”);
STAssertNoThrow() generates a failure if the expression throws an Objective-C
exception.
STAssertNoThrow([someCalculatorObject addOneToThree], “The answer
p is 4, you dolt. What went wrong?”);
STAssertThrows() generates a failure if the expression does not throw an
Objective-C exception.
STAssertThrows([someCalculatorObject divideByZero], @”Wait, what?
p What result did YOU get?!”);
Each test should contain at least one assertion. Some argue that each test
should include only one assertion so that the test’s name (the method signature)
is precisely descriptive of what is being tested, making the precise failure easier
to identify should it arise.](https://image.slidesharecdn.com/peachpit-141129150150-conversion-gate01/85/Peachpit-mastering-xcode-4-develop-and-design-sep-2011-295-320.jpg)
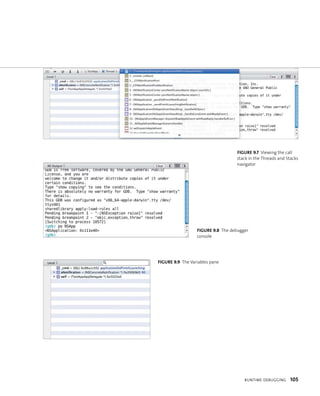
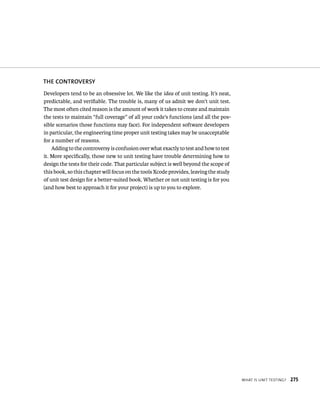
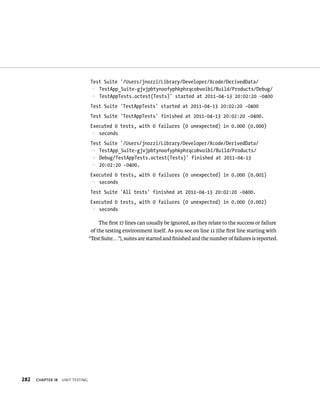
![unIt testIng In XCode 281
test results log
As mentioned previously, the test result output shows up in the Log navigator.
Following is the output from the first run of the TestApp scheme’s Test action.
GNU gdb 6.3.50-20050815 (Apple version gdb-1518) (Sat Feb 12
p 02:52:12 UTC 2011)
Copyright 2004 Free Software Foundation, Inc.
GDB is free software, covered by the GNU General Public License, and
p you are welcome to change it and/or distribute copies of it under
p certain conditions.
Type “show copying” to see the conditions.
There is absolutely no warranty for GDB. Type “show warranty” for
p details.
This GDB was configured as “x86_64-apple-darwin”.tty /dev/ttys000
p sharedlibrary apply-load-rules all
[Switching to process 12421 thread 0x0]
objc[12421]: GC: forcing GC OFF because OBJC_DISABLE_GC is set
Test Suite ‘All tests’ started at 2011-04-13 20:02:20 -0400
Test Suite ‘/Developer/Library/Frameworks/SenTestingKit.
p framework(Tests)’ started at 2011-04-13 20:02:20 -0400
Test Suite ‘SenInterfaceTestCase’ started at 2011-04-13 20:02:20
p -0400
Test Suite ‘SenInterfaceTestCase’ finished at 2011-04-13 20:02:20
p -0400.
Executed 0 tests, with 0 failures (0 unexpected) in 0.000 (0.000)
p seconds
Test Suite ‘/Developer/Library/Frameworks/SenTestingKit.
p framework(Tests)’ finished at 2011-04-13 20:02:20 -0400.
Executed 0 tests, with 0 failures (0 unexpected) in 0.000 (0.001)
p seconds](https://image.slidesharecdn.com/peachpit-141129150150-conversion-gate01/85/Peachpit-mastering-xcode-4-develop-and-design-sep-2011-296-320.jpg)
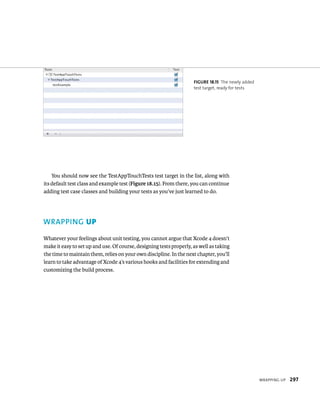
![WrItIng a unIt test 285
Build a basic Objective-C class using the code below. Replace the entire contents
of your Person.m file with the following code:
#import “Person.h”
@implementation Person
- (id)init
{
self = [super init];
if (self)
{
firstName = nil;
lastName = nil;
}
return self;
}
- (void)dealloc
{
[firstName release];
firstName = nil;
[lastName release];
lastName = nil;
[super dealloc];
}
@synthesize firstName;
@synthesize lastName;
@end](https://image.slidesharecdn.com/peachpit-141129150150-conversion-gate01/85/Peachpit-mastering-xcode-4-develop-and-design-sep-2011-300-320.jpg)
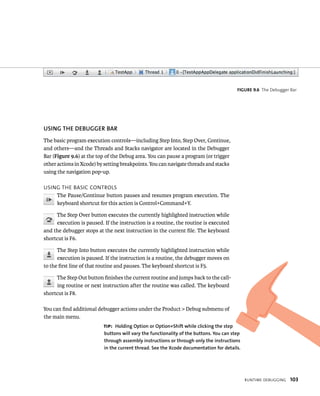
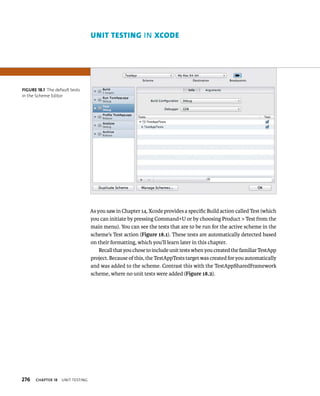
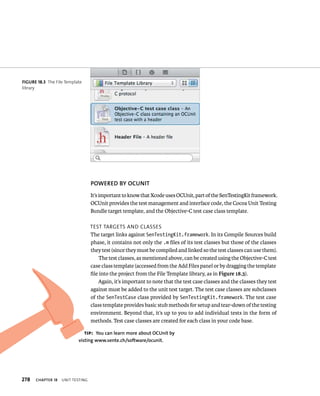
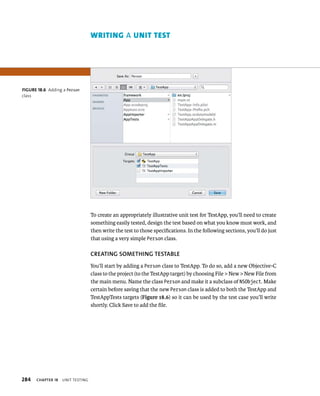
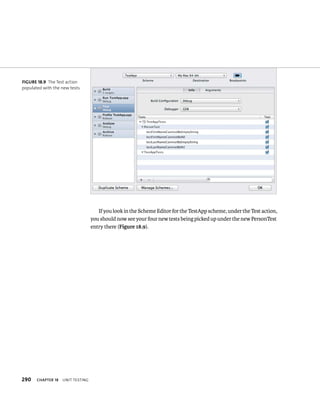
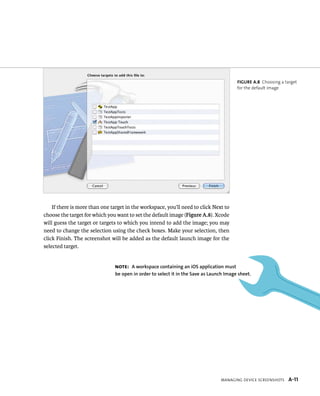
![WrItIng a unIt test 287
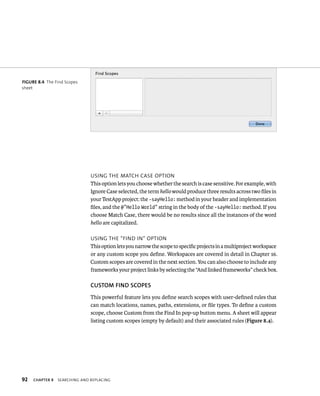
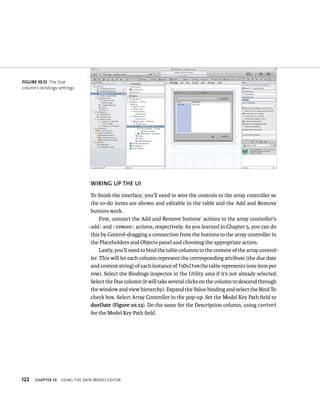
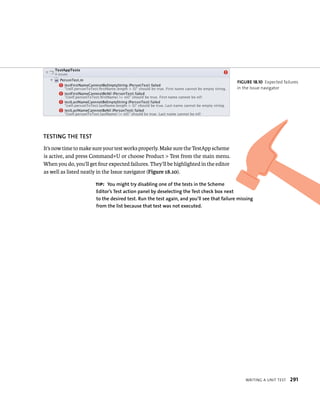
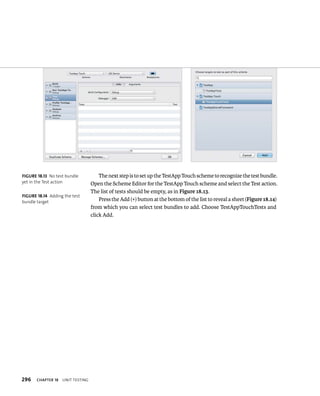
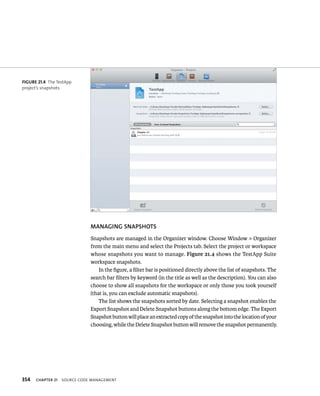
WRITING ThE TEST
To write the test, you’ll need to add an Objective-C test case class to the project. You
can do this by dragging an Objective-C test case class from the File Template library
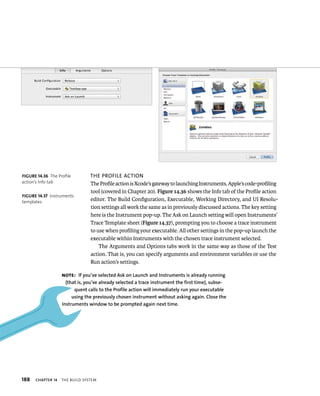
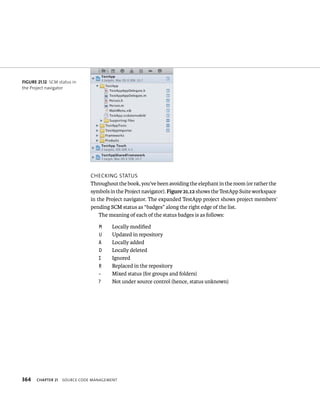
into the Project navigator (under the TestAppTests group), as seen in Figure 18.7.
Name the class PersonTest.m so it’s clear to which class this test belongs. Also
add the test only to the TestAppTests target (since it does not need to be built for
TestApp to run). Your settings should resemble Figure 18.8. Click Save.
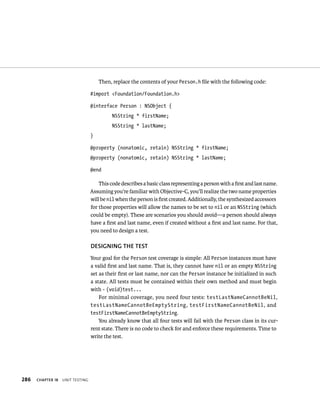
Replace the contents of PersonTest.m with the following code:
#import “PersonTest.h”
#import “Person.h”
@implementation PersonTest
@synthesize personToTest;
- (void)setUp {
[super setUp];
fiGURe 18 7 Adding a test
case class to the project
fiGURe 18 8 Naming and
configuring the test case class](https://image.slidesharecdn.com/peachpit-141129150150-conversion-gate01/85/Peachpit-mastering-xcode-4-develop-and-design-sep-2011-302-320.jpg)
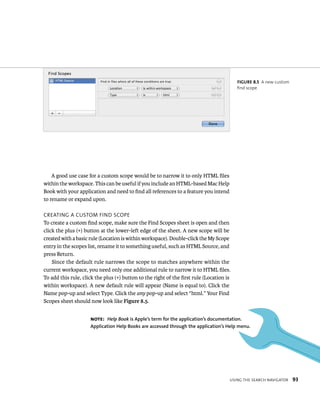
![288 ChAPTER 18 unIt testIng
// Create a person to test
Person * newTestPerson = [[Person alloc] init];
[self setPersonToTest:newTestPerson];
[newTestPerson release];
}
- (void)tearDown {
// Kill the test person
[self setPersonToTest:nil];
[super tearDown];
}
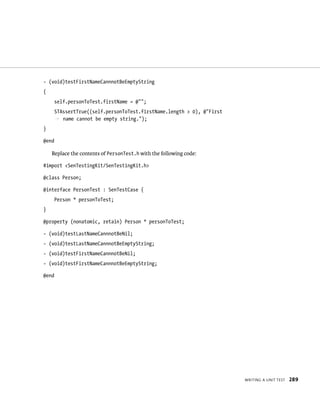
- (void)testLastNameCannnotBeNil
{
self.personToTest.lastName = nil;
STAssertNotNil(self.personToTest.lastName, @”Last name cannot
p be nil!”);
}
- (void)testLastNameCannnotBeEmptyString
{
self.personToTest.lastName = @””;
STAssertTrue((self.personToTest.lastName.length > 0), @”Last
p name cannot be empty string.”);
}
- (void)testFirstNameCannnotBeNil
{
self.personToTest.firstName = nil;
STAssertNotNil(self.personToTest.firstName, @”First name cannot
p be nil!”);
}](https://image.slidesharecdn.com/peachpit-141129150150-conversion-gate01/85/Peachpit-mastering-xcode-4-develop-and-design-sep-2011-303-320.jpg)
![292 ChAPTER 18 unIt testIng
PASSING ThE TEST
To pass the test, your Person class clearly needs to guard against nil or blank names.
Not only does it need smarter setter accessors but some default values in the -init
method as well. Replace the entire contents of Person.m with the following code:
#import “Person.h”
@implementation Person
- (id)init
{
self = [super init];
if (self)
{
self.firstName = @”John”;
self.lastName = @”Smith”;
}
return self;
}
- (void)dealloc
{
[firstName release];
firstName = nil;
[lastName release];
lastName = nil;
[super dealloc];
}
- (NSString *)firstName
{
return firstName;
}](https://image.slidesharecdn.com/peachpit-141129150150-conversion-gate01/85/Peachpit-mastering-xcode-4-develop-and-design-sep-2011-307-320.jpg)
![WrItIng a unIt test 293
- (void)setFirstName:(NSString *)newFirstName
{
if (firstName != newFirstName &&
newFirstName &&
newFirstName.length > 0)
{
[firstName release];
firstName = [newFirstName retain];
}
}
- (NSString *)lastName
{
return lastName;
}
- (void)setLastName:(NSString *)newLastName
{
if (lastName != newLastName &&
newLastName &&
newLastName.length > 0)
{
[lastName release];
lastName = [newLastName retain];
}
}
@end](https://image.slidesharecdn.com/peachpit-141129150150-conversion-gate01/85/Peachpit-mastering-xcode-4-develop-and-design-sep-2011-308-320.jpg)
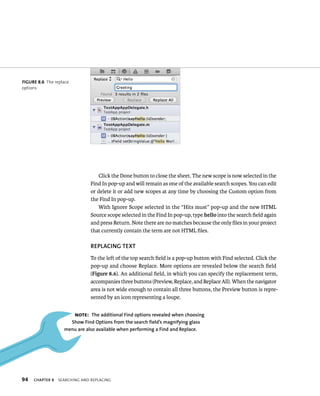
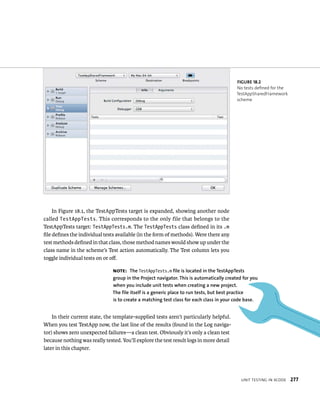
![294 ChAPTER 18 unIt testIng
The changes to Person.m ensure several things. First, that the -init method
always makes sure there’s a default first and last name. Second, that the custom
accessor methods (the setters in particular) make sure the newly passed name is
neither nil nor an empty NSString.
Now you can check to make sure the code works as desired by repeating the
tests. This time, all four tests should pass. Press Command+U to run the unit tests
and notice happily that no errors come up in the Issue navigator. You can further
verify the tests passed by finding the test results in the Log navigator.
You can see that the tests were run and were individually successful with the
following lines in the log:
Test Case ‘-[PersonTest testFirstNameCannnotBeEmptyString]’ started.
Test Case ‘-[PersonTest testFirstNameCannnotBeEmptyString]’ passed
p (0.000 seconds).
Test Case ‘-[PersonTest testFirstNameCannnotBeNil]’ started.
Test Case ‘-[PersonTest testFirstNameCannnotBeNil]’ passed (0.000
p seconds).
Test Case ‘-[PersonTest testLastNameCannnotBeEmptyString]’ started.
Test Case ‘-[PersonTest testLastNameCannnotBeEmptyString]’ passed
p (0.000 seconds).
Test Case ‘-[PersonTest testLastNameCannnotBeNil]’ started.
Test Case ‘-[PersonTest testLastNameCannnotBeNil]’ passed (0.000
p seconds).
The summary of the PersonTest tests is as follows:
Executed 4 tests, with 0 failures (0 unexpected) in 0.000 (0.000)
p seconds
Congratulations! You’ve just passed your first code-driven design-and-test cycle.](https://image.slidesharecdn.com/peachpit-141129150150-conversion-gate01/85/Peachpit-mastering-xcode-4-develop-and-design-sep-2011-309-320.jpg)
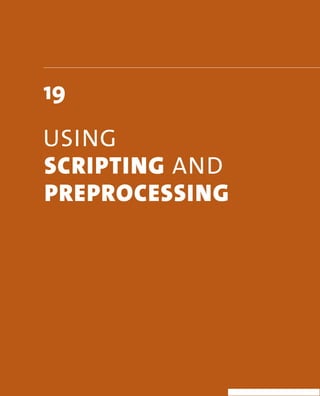
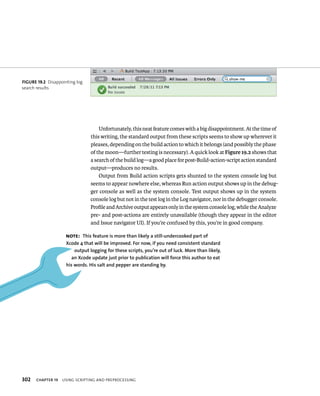
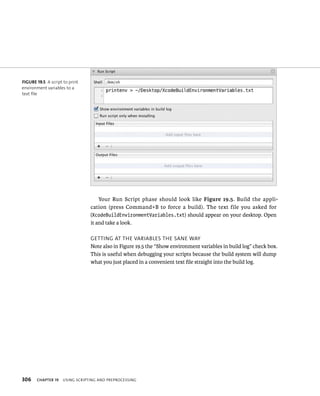
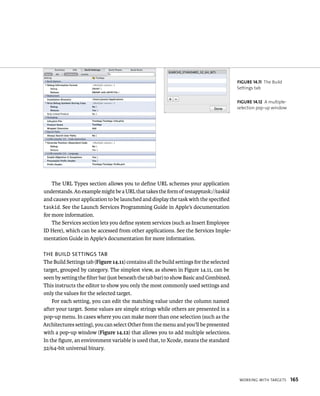
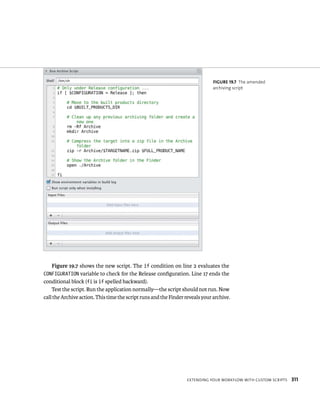
![310 trIggerIng tHe sCrIpt on release BuIlds only
You’re not quite finished yet. Currently the script will run every time the target
is built. Run the application (which builds for debugging). The archiving script
also runs and pops up in a Finder window when the application is running. This
is less than ideal. Since the stated goal was to run this script only when archiving
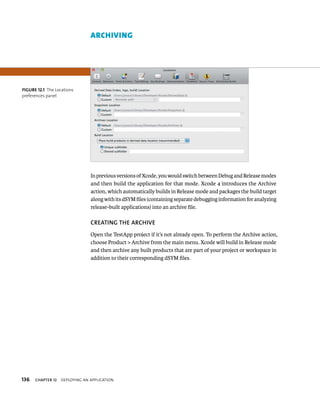
(synonymous with “building for release”), a little more customization is necessary.
Why not use an Archive action post-action script? (See the “Pre- and Post-Action
Scripts” section.) Xcode’s environment variables (such as BUILT_PRODUCTS_DIR,
TARGETNAME, and FULL_PRODUCT_NAME) are unavailable in pre- and post-action scripts
in the current version of Xcode 4. Until that changes, it’s easiest (in terms of there
being far fewer and far-more-flexible lines of script) to use a Run Script build phase.
The on-archive-only problem is easy to solve using just one more environment
variable: CONFIGURATION. You can use an if conditional to check if the script is run
under the Release configuration. Replace the existing script with the following:
# Only under Release configuration ...
if [ $CONFIGURATION = Release ]; then
# Move to the built products directory
cd $BUILT_PRODUCTS_DIR
# Clean up any previous archiving folder and create a new one
rm -Rf Archive
mkdir Archive
# Compress the target into a zip file in the Archive folder
zip -r Archive/$TARGETNAME.zip $FULL_PRODUCT_NAME
# Show the Archive folder in the Finder
open ./Archive
fi
ChAPTER 19 usIng sCrIptIng and preproCessIng](https://image.slidesharecdn.com/peachpit-141129150150-conversion-gate01/85/Peachpit-mastering-xcode-4-develop-and-design-sep-2011-325-320.jpg)
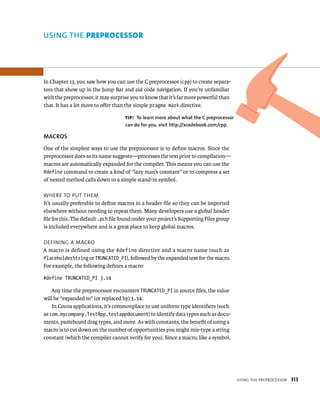
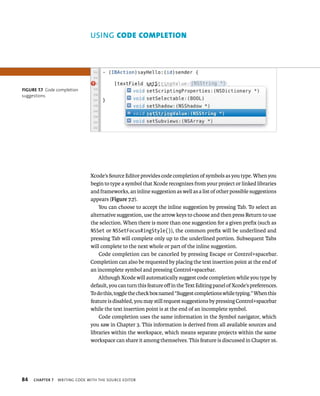
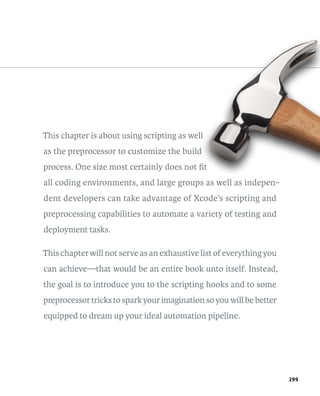
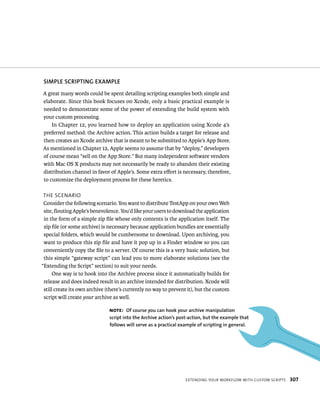
![314 must be typed properly (and participates in code completion), Xcode will help you
spell it correctly and the compiler will flag it as an error if you miss. A simple string
macro can be defined like this:
#define TestAppDocType @”com.mycompany.TestApp.testappdocument”
This will define the macro TestAppDocType, which will be expanded to
@”com.mycompany.TestApp.testappdocument” anywhere it’s used.
Another handy use for macros is to shorten long, deeply nested method calls.
Many non-document-based Cocoa applications “hang” top-level controllers from
the application delegate to provide an easy means of reaching them from anywhere
else in the application’s code. A call to such a controller might look like this:
[[[NSApp delegate] importantController] doSomethingImportant];
You can shorten the call by defining a macro for the controller:
#define ImportantController [[NSApp delegate] importantController]
The shortened call is now:
[ImportantController doSomethingImportant];
Macros can be used as functions as well. In fact, many common (but ver-bose)
evaluations have macros predefined in the Foundation.framework (under
NSObjCRuntime.h). For example, finding the larger of two values can be evaluated
as follows:
int largest = (a > b) ? a : b;
The MAX macro, however, simplifies this (for any type, not just int) as:
int largest = MAX(a, b);
tip: An easy way to find system-defined symbols and macros is to type
them into the Source Editor and then Command-click them. The editor will
navigate to the definition. Try it by typing MAX and Command-clicking the word.
ChAPTER 19 usIng sCrIptIng and preproCessIng](https://image.slidesharecdn.com/peachpit-141129150150-conversion-gate01/85/Peachpit-mastering-xcode-4-develop-and-design-sep-2011-329-320.jpg)
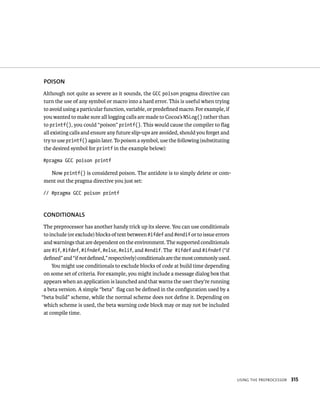
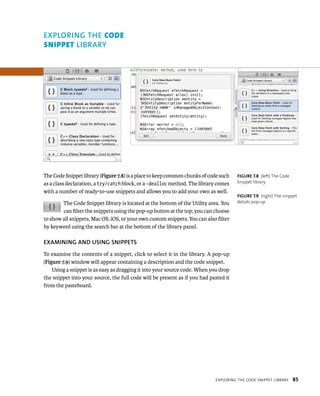
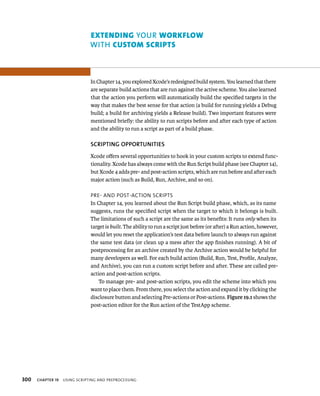
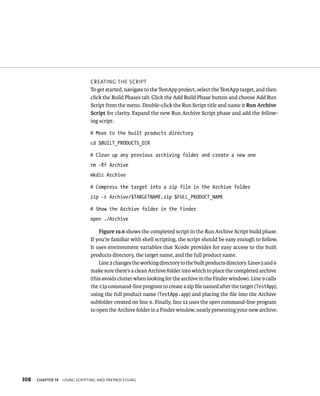
![316 You can write a conditional block of code as follows:
#ifdef SOMEMACRO
NSLog(@”This code will only be included if SOMEMACRO is
p defined... “);
#endif
The NSLog() statement will not be included in the compiled code unless
SOMEMACRO is defined. The #ifdef directive doesn’t care what SOMEMACRO represents,
only that it is defined. Recall that you can define SOMEMACRO like this:
#define SOMEMACRO 1
DEfINING MACROS IN ThE BuIlD ENvIRONMENT
Defining a macro and then checking if it’s defined is easy enough. Whether a macro
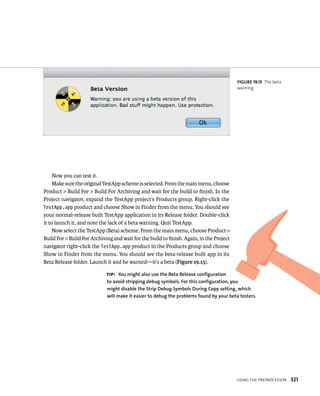
is defined can also be based on the current build settings, as the BETABUILD flag is.
To try this scenario out for yourself, start by adding the following code to the
end of the TestApp delegate class’s -applicationDidFinishLaunching: method:
#ifdef BETABUILD
[[NSAlert alertWithMessageText:@”Beta Version”
defaultButton:@”Ok”
alternateButton:nil
otherButton:nil
informativeTextWithFormat:@”Warning: you are using a beta
p version of this application. Bad stuff might happen.”]
p runModal];
#endif
ChAPTER 19 usIng sCrIptIng and preproCessIng](https://image.slidesharecdn.com/peachpit-141129150150-conversion-gate01/85/Peachpit-mastering-xcode-4-develop-and-design-sep-2011-331-320.jpg)

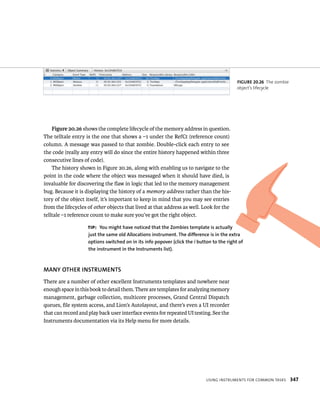
![uSING Instruments
fOR common tAsks
Now that you know the Instruments basics, it’s time to apply them to common
debugging and profiling tasks. You’ll start by using the Time Profiler to track down
a contrived performance problem. You’ll then find a memory leak and track down
and kill a zombie invasion.
TIME PROfIlING
You don’t get very far in a moderate-to-complex application without encountering
performance problems. Such problems have traditionally been difficult to track
down. More often than not, the cause is entirely different from what you suspected.
Instruments’ Time Profiler template has an uncanny ability to show you inefficien-cies
in your code you may not even have suspected.
To begin, open TestApp’s TestAppAppDelegate.m file and change the
-applicationDidFinishLaunching: method so that it includes this line:
[self doSomethingStupid];
After the closing curly brace of the -applicationDidFinishLaunching: method,
usIng Instruments For Common tasks 339
add this new method:
- (void)doSomethingStupid
{
NSMutableArray * array = [NSMutableArray
p arrayWithCapacity:1000000];
NSNumber * number;
for (NSInteger i = 0; i < 10000; i++)
{
number = [NSNumber numberWithInteger:i];
[array addObject:number];
}
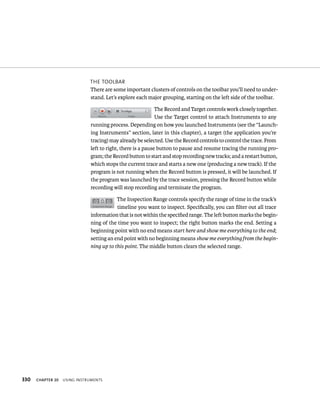
}](https://image.slidesharecdn.com/peachpit-141129150150-conversion-gate01/85/Peachpit-mastering-xcode-4-develop-and-design-sep-2011-354-320.jpg)
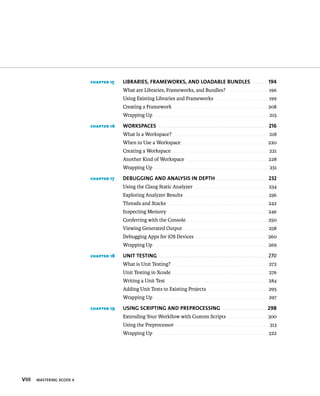
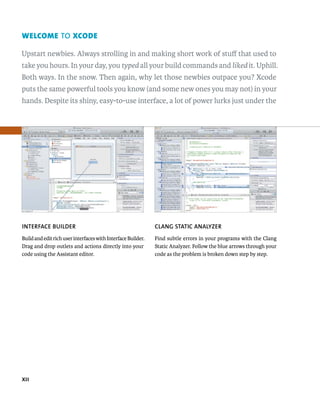
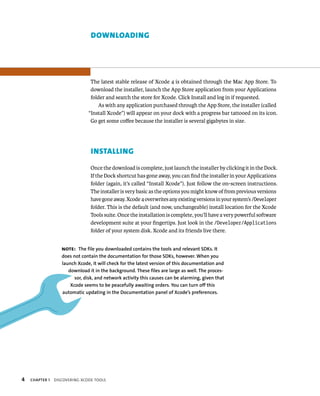
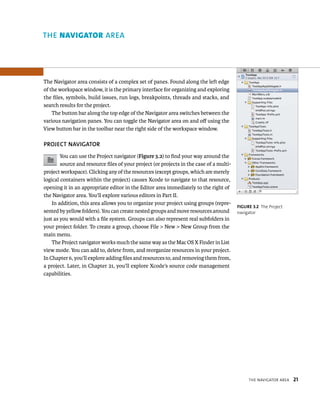
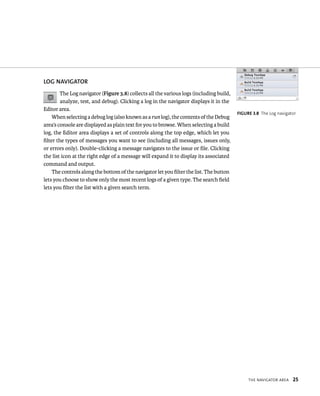
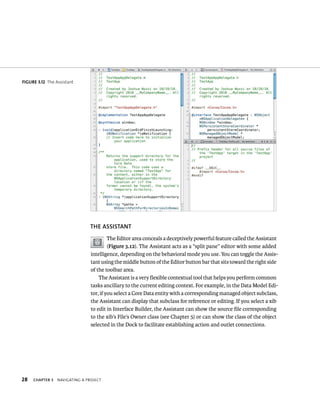
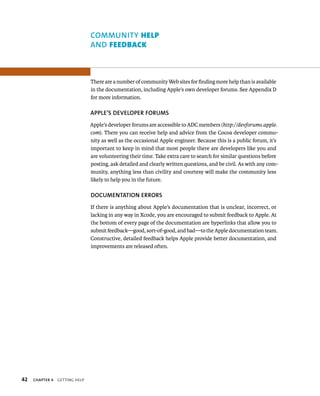
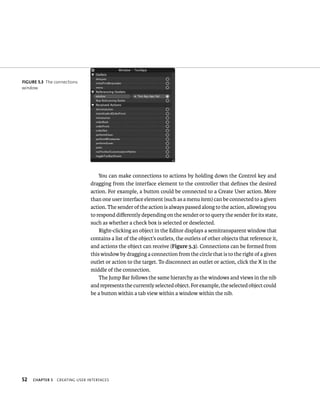
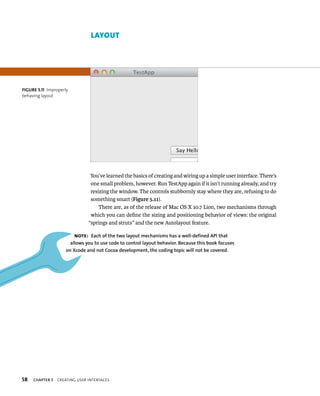
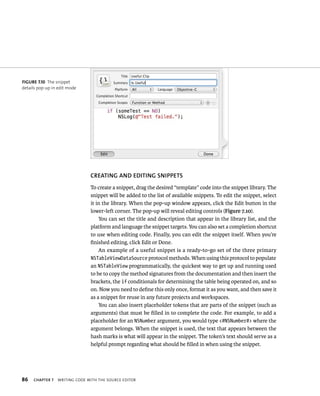
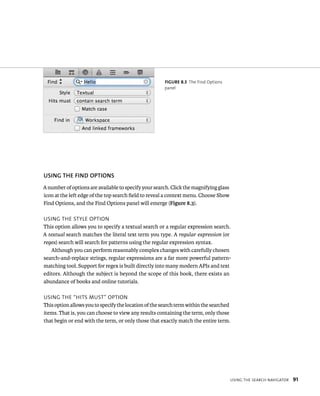
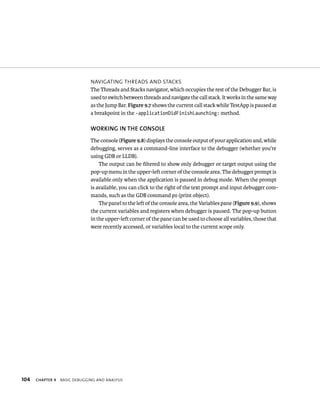
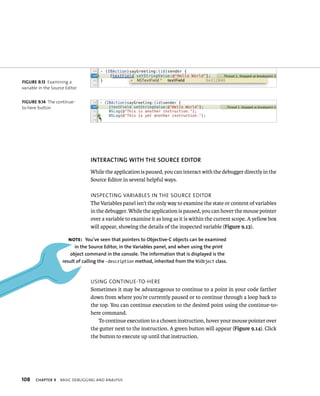
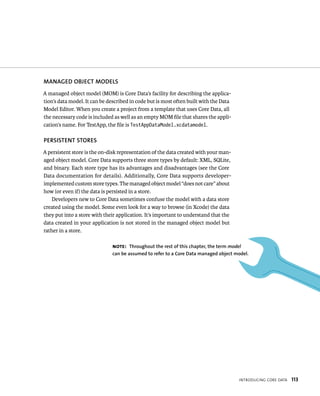
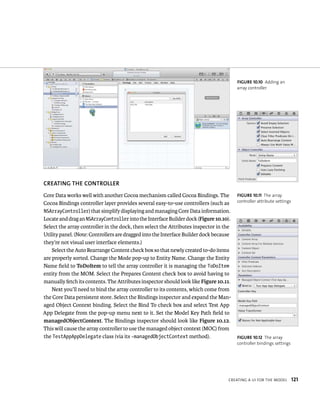
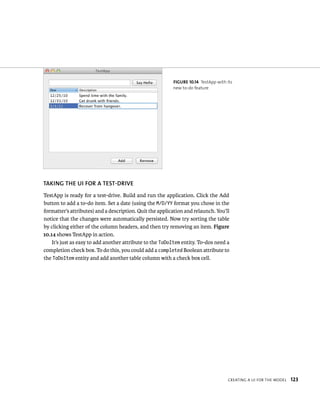
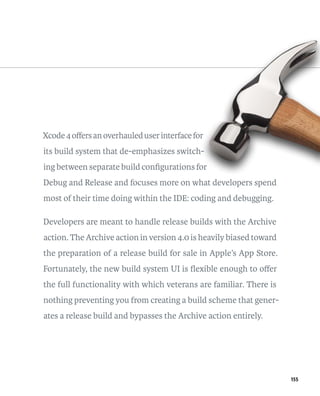
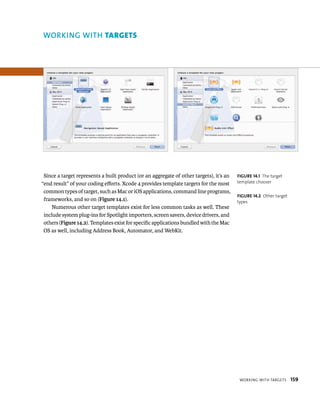
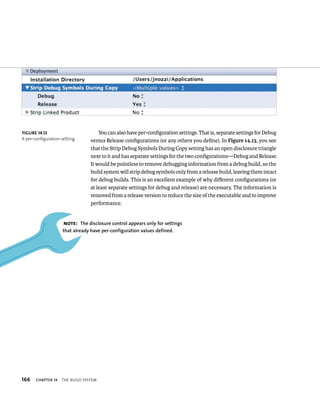
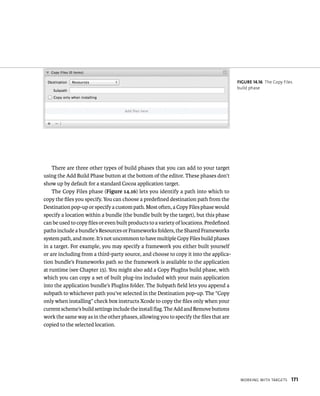
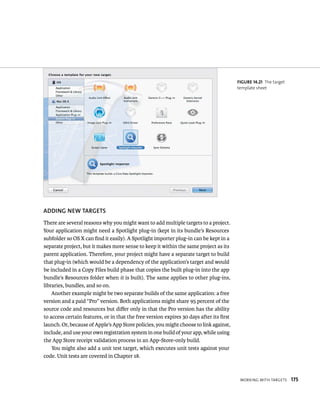
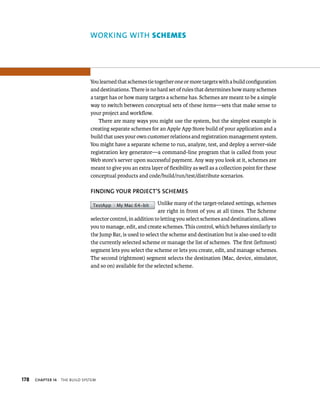
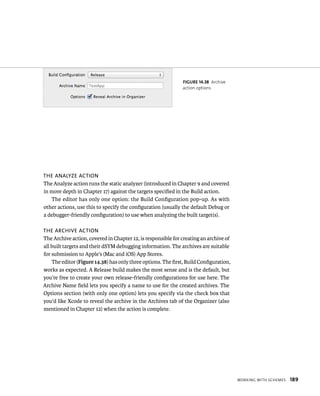
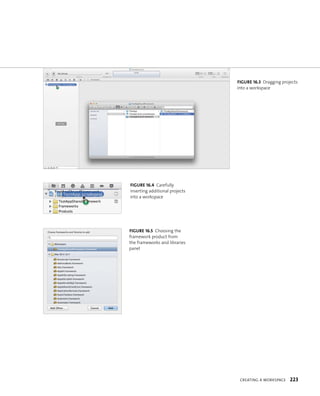
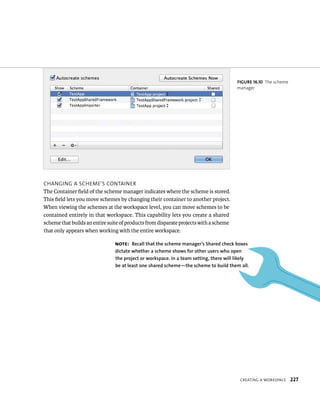
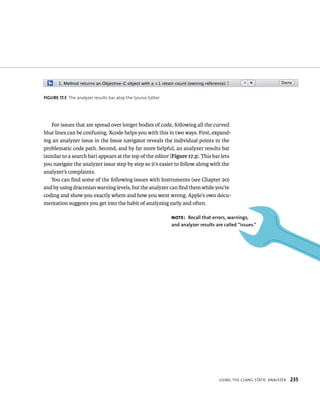
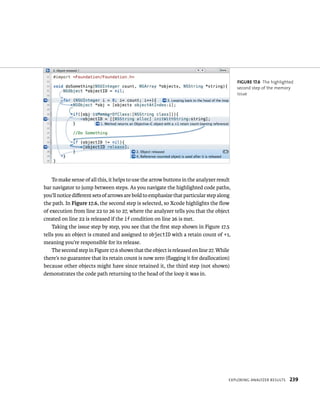
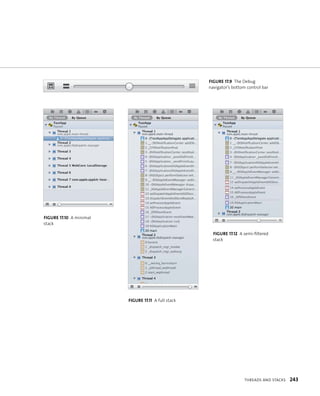
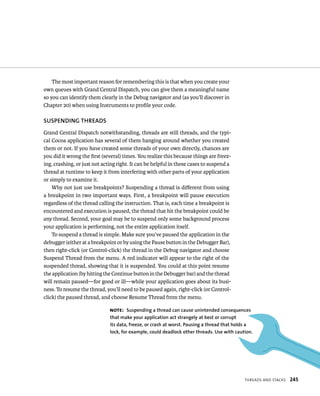
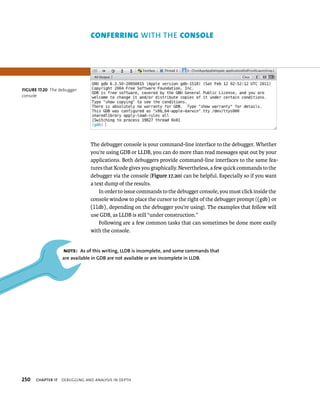
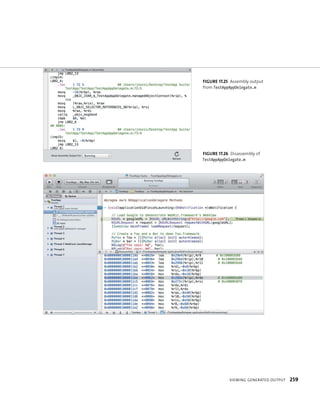
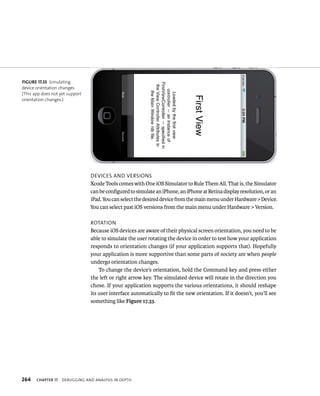
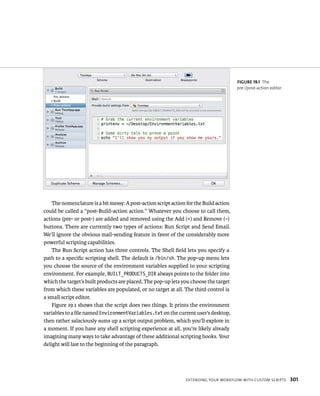
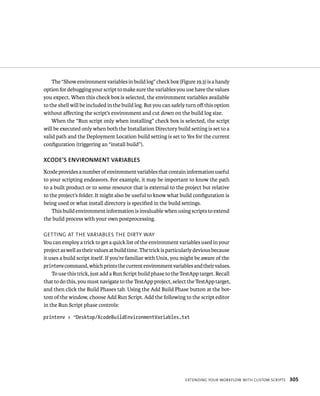
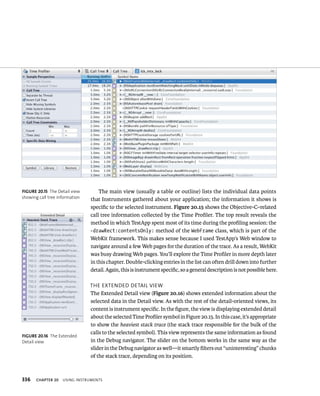
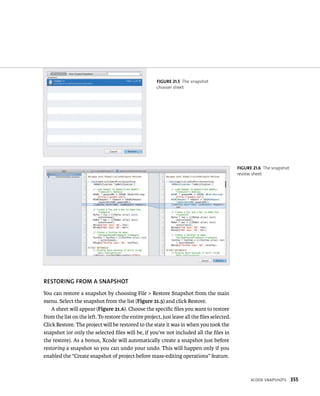
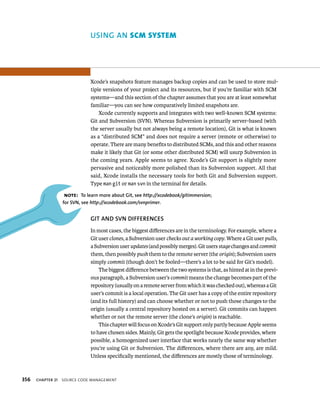
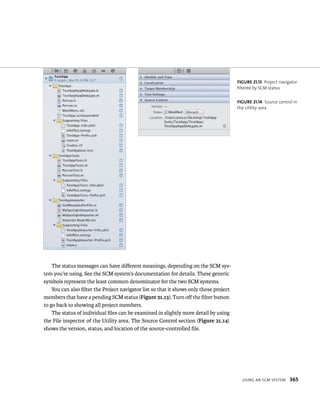
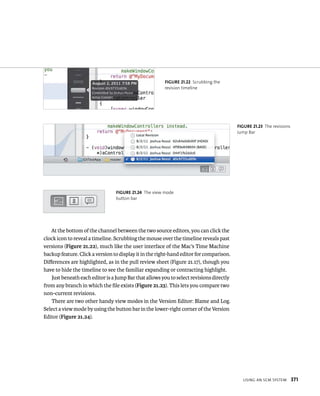
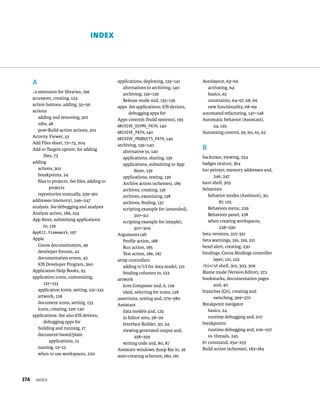
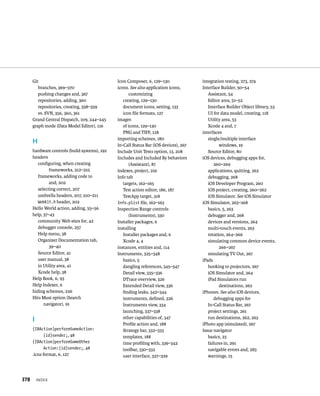
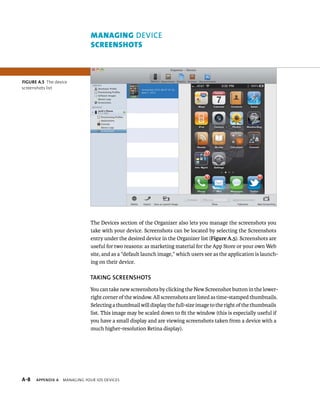
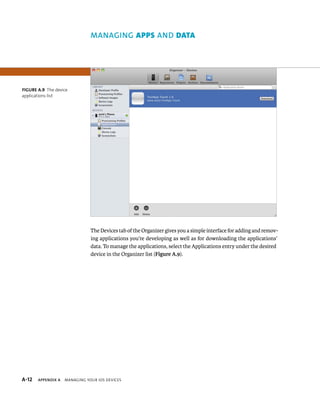
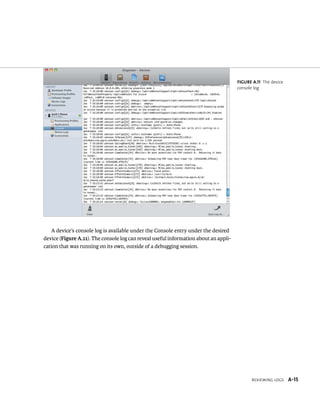
![fiGURe 20 19 Source code
overlaid with a heat map
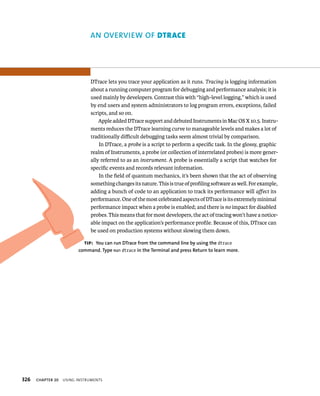
Many developers’ knee-jerk reaction would be to blame the tight for loop.
Of course it’s going to take a while to create ten thousand objects. Astute Cocoa /
Objective-C developers will know better with such a contrived example, but here’s
where the Time Profiler really shines. Double-click the -[TestAppAppDelegate
doSomethingStupid] symbol in the list, and the Detail view will prove its name
(Figure 20.19).
In the figure, TestAppAppDelegate.m is displayed with some additional infor-mation
overlaid. Instruments has broken down the time spent in that symbol
(the -doSomethingStupid method) to highlight the most time-consuming instruc-tions
within it.
To see the percentages (as in Figure 20.19), you may need to click the gear button
in the upper-right corner and select View as Percentage from the menu. The overlay
is color-coded to serve as a sort of heat map, where the color (ranging from “red
hot” to “not-so-hot yellow” and beyond) represents how much time your computer
spent executing the most time-consuming instructions.
This makes one thing very obvious: The culprit isn’t the for loop, though it cer-tainly
takes time. The red-hot instruction (89.5 percent of the method’s time in the
example above) was the line where you allocated and initialized an NSMutableArray.
If you don’t already know why this is, here’s where Instruments gets even better.
Click the Call Tree segment of the Detail view’s navigation bar to get back to
the list of symbols. Deselect the Hide System Libraries check box to show all the
system library calls in addition to those of TestApp. TestApp’s symbols should be
gone, replaced by some system library symbols. Because the call tree is inverted,
the deepest call in the stack is shown as top-level objects, and the top results are
the calls that happened as a result of -doSomethingStupid.
usIng Instruments For Common tasks 341](https://image.slidesharecdn.com/peachpit-141129150150-conversion-gate01/85/Peachpit-mastering-xcode-4-develop-and-design-sep-2011-356-320.jpg)
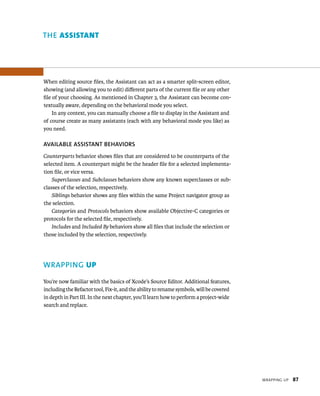
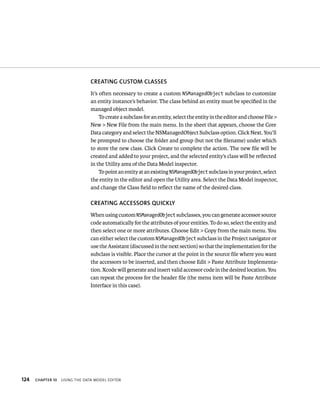
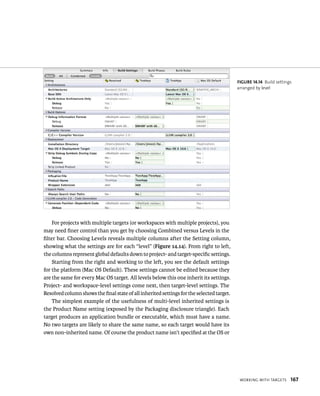
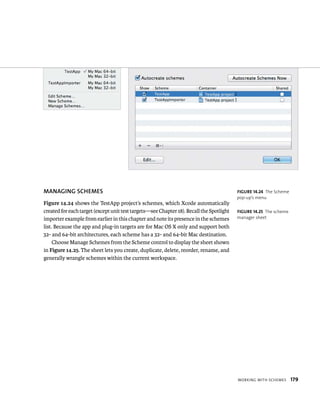
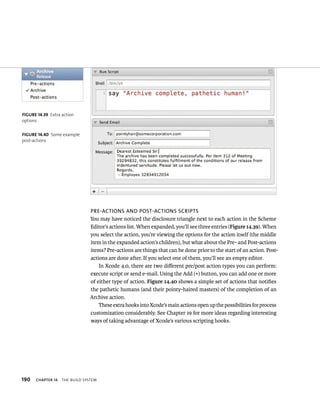
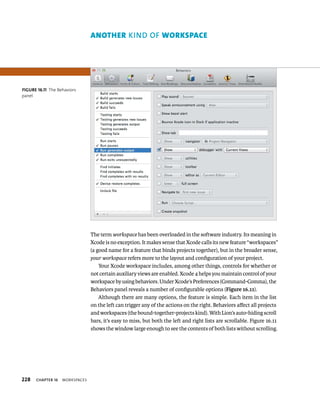
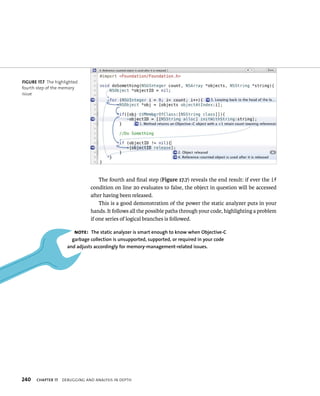
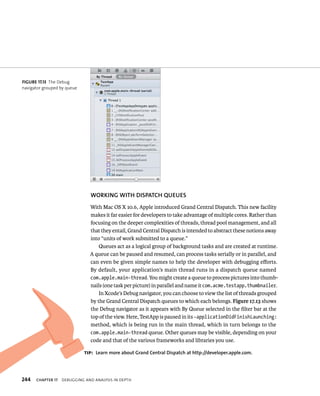
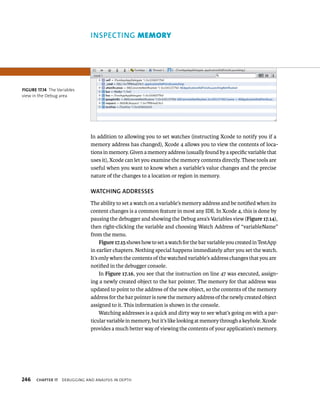
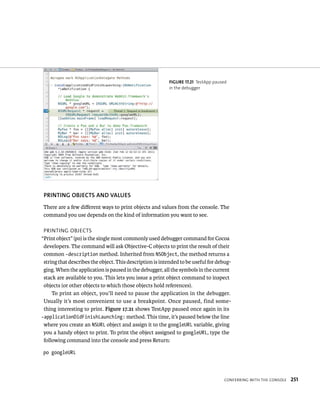
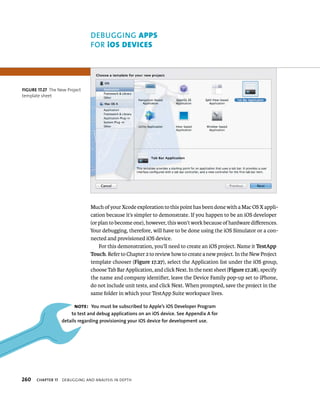
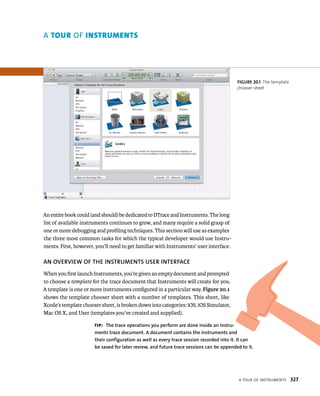
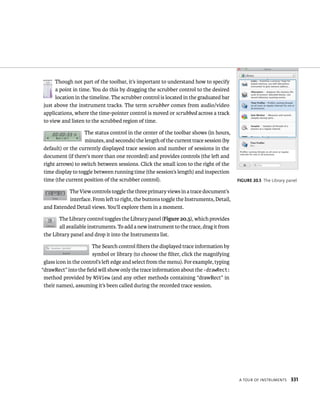
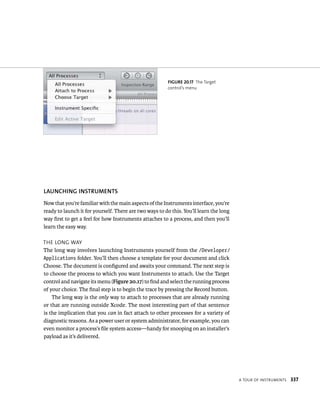
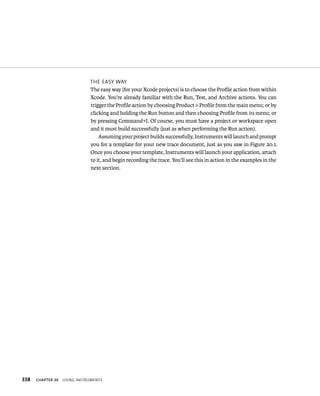
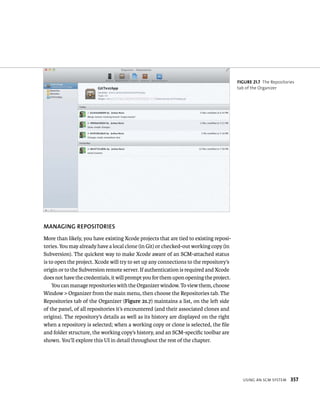
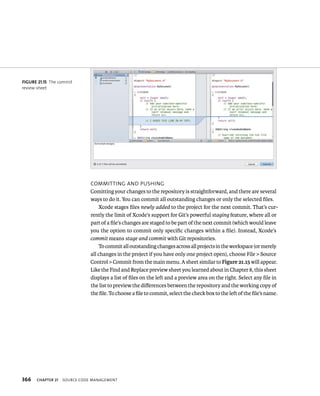
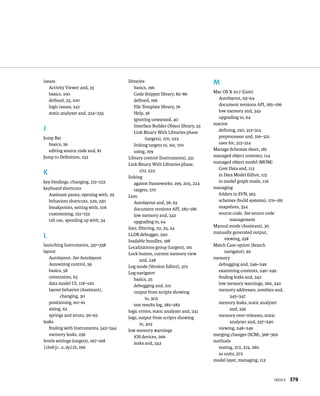
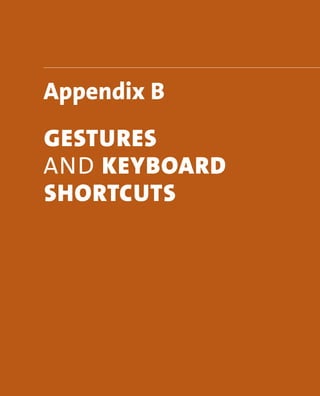
![fiGURe 20 20 TestApp call
tree with system libraries
342 Expand the items until you see something similar to Figure 20.20. You see
that -doSomethingStupid goes on to call into Cocoa, and it’s spending lots of
time just creating the array. While it doesn’t tell you why, it certainly draws
your attention to it. The reason, for those still wondering, is that you’re abusing
-[NSMutableArray arrayWithCapacity:] by allocating a ton of memory you
aren’t even using. Of course it’d take just as long to allocate all that space if you
were using it, but the point is that the problem wasn’t where so many developers
would’ve initially suspected (especially if that allocation were done in another
part of the code).
Although this was a contrived example, it neatly demonstrates Instruments’
powerfully intuitive way of visualizing trace information—a way that takes only
a few clicks to reveal the source of a performance problem. Now that you know
what the problem is, it might be easiest to use a saner capacity (especially since
you already know you need 10,000 objects). Contrast this approach with using
-[NSMutableArray array] to create the array by profiling both scenarios. You’ll
see that the -arrayWithCapacity: approach is the better way to go, as long as
you use it wisely.
fINDING lEAKS
Reference-counted memory management, as offered in Objective-C, is difficult.
It’s easy to “let go” of an object before you’ve had a chance to tell it that it’s no
longer needed. As you learned in Chapter 17, such an object—or, more specifically,
its memory—is said to have been leaked. This is because as long as the applica-tion
is still running, you no longer have a reference to the object and can’t release
it (hopefully causing it to be deallocated). That memory is now stuck until your
program terminates. Worse, if your leak is triggered by something that happens
often, your application will quickly eat up tons of memory. On iOS and (to a lesser
extent) Lion, this will result in your application receiving a low memory warning
and, eventually, being terminated by the OS.
ChAPTER 20 usIng Instruments](https://image.slidesharecdn.com/peachpit-141129150150-conversion-gate01/85/Peachpit-mastering-xcode-4-develop-and-design-sep-2011-357-320.jpg)
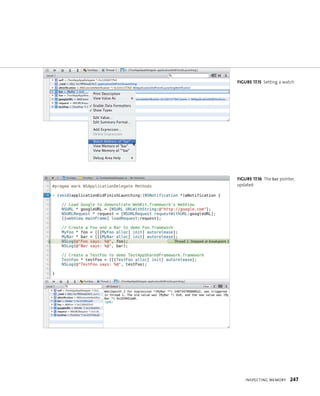
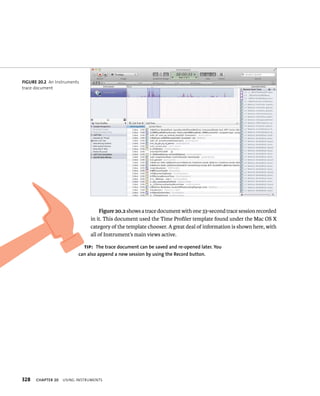
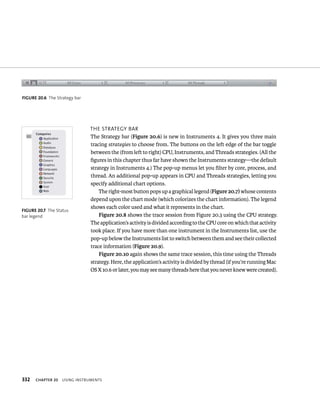
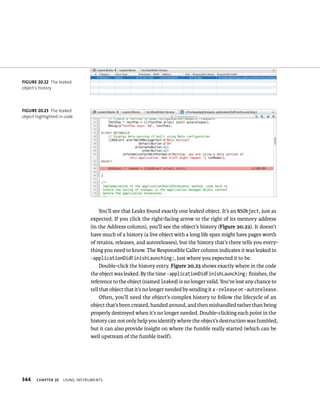
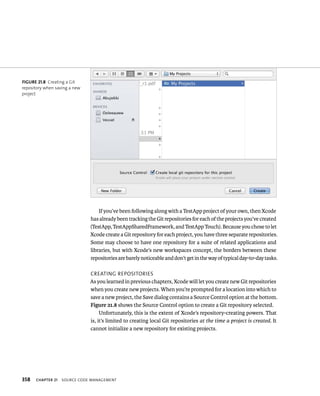
![Leaks have traditionally been difficult to track down. Fortunately, Instruments
makes it much simpler. To test this, let’s create and leak a single object in TestApp. You
don’t need anything fancy—a simple NSObject instance will do. Add the following
code to the -applicationDidFinishLaunching: method in TestAppAppDelegate.m,
just after the call to -doSomethingStupid:
NSObject * leaked = [[NSObject alloc] init];
Now press Command+I to invoke the Profile action. When Instruments asks
for a template, choose Leaks and click the Profile button. Since the Leaks instru-ment
only analyzes the data every 10 seconds or so (and needs a few seconds to
get started), let the trace run for 15–20 seconds before stopping it. Click the Leaks
instrument to select it (the Allocations instrument is at the top of the list and is
along for the ride to help out). You should see something similar to Figure 20.21.
fiGURe 20 21 The Leaks
instrument
usIng Instruments For Common tasks 343](https://image.slidesharecdn.com/peachpit-141129150150-conversion-gate01/85/Peachpit-mastering-xcode-4-develop-and-design-sep-2011-358-320.jpg)
![KIllING zOMBIES (GO fOR ThE hEAD)
If leaks had an opposite, the dangling reference, or accidentally over-released object,
would be it. A dangling reference is a pointer variable that wasn’t set to nil when
its object went away (was deallocated) and that now points to an invalid memory
address. It results in a crash with the telltale signal EXC_BAD_ACCESS, which is the
operating system’s way of telling you you’re not supposed to be poking your nose
around there anymore. These are officially many Cocoa developers’ least favorite
memory management bugs.
A mechanism, NSZombie, has existed for a long time that helps developers track
down these pesky bugs. When “zombies” are enabled, the runtime, rather than
deallocating objects, will turn the objects into zombies and keep them around. If a
zombie is messaged (indicating your code tried to reference an object it shouldn’t
have), the system flags it as a messaged zombie. Zombies aren’t bad things that
happen to an object; they do developers an invaluable service. Then the developer
bashes in their heads with a shovel.
In the past, you’d have to pass an argument into your application manually on
startup and then do a bunch of digging around to make sense of the results. You
should now expect how much simpler Instruments makes it. To find out, replace
the leaked object line from the previous example with these three lines (and make
sure you get the spelling right—that’s brraaiinns):
NSObject * brraaiinns = [[NSObject alloc] init];
[brraaiinns release];
NSLog(@”%@”, brraaiinns);
usIng Instruments For Common tasks 345](https://image.slidesharecdn.com/peachpit-141129150150-conversion-gate01/85/Peachpit-mastering-xcode-4-develop-and-design-sep-2011-360-320.jpg)

![modernization of projects, 15–16
Modernize Loop option, refactoring
and, 148
MOM (managed object model)
Core Data and, 113
in Data Model Editor, 115
in model graph mode, 116
mouse pointer, examining variables
with, 108
Move Up/Move Down option,
refactoring and, 148
multi-touch events (iOS
Simulator), 263
N
names
company name, changing, 153
testing, 286, 292
naming. See also renaming
applications, 12–13
clones, 362
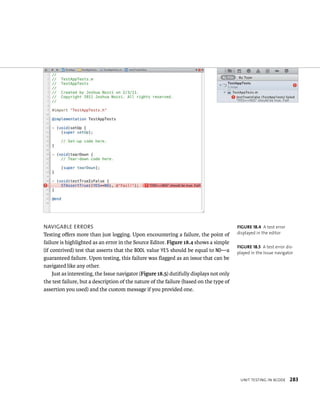
navigable errors, 283
navigating projects. See projects,
navigating
Navigator area, 20, 21–25
Breakpoint navigator, 24
Debug navigator, 24
Issue navigator, 23
Log navigator, 25
Project navigator, 21
Search navigator, 23
Symbol navigator, 22
network communication (build
systems), 192
New File sheet, 74
New Project options sheet, 12
New Project template sheet, 11, 260
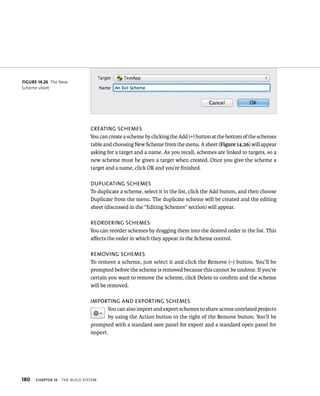
New Scheme sheet, 180
New Target sheet, 175
next command (console), 256
.nib extension (NextStep Interface
Builder), 48
x
nibs, 48–49
NSManagedObject subclass
creating custom, 124
generating accessor source
code, 124
NSZombie, 345
O
objects
printing from console, 251–253
testing, 274, 279, 280
unit testing and, 272
OCUnit, 278–283
assertions, 279–280
navigable errors, 283
test results log, 281–282
test targets and classes, 278
Options bar (templates), 11
Options tab (Run action), 185–186
Organizer
preventing opening of, 309
Organizer Documentation tab for
Help, 39–40
Organizer window
basics, 35
snapshots and, 354
orientation, changing (iOS devices),
264–266
outdated projects, modernizing,
15–16
outlets
nibs, 48–49
Outlets and Referencing Outlets
behaviors (Assistant), 54
over-releases, memory, 237–240
owners (nibs), 48
P
p (NSUInteger)[[googleURL scheme]
length] command, 253
PackageMaker, 6
packages, defined, 138
panes, adding and removing
(Assistant), 29
Parallelize Build option, 183, 184
Pause/Continue button (Debugger
Bar), 103
.pch file, for macros, 313
persistent stores, 113
Person class, adding for unit testing,
284–286
plug-ins, Copy PlugIns build
phase, 171
PNG (.png) images, 128
po command, 251, 253
poison, 315
positioning (layout), 60–61
positiveFlag variable, 241
post-action scripts
custom, 300–302
schemes, 190
post-Build-action actions, 301
pragma mark directive, 150, 313
pre- and post-action editor,
300–301
pre- and post-actions scripts
custom, 300–302
schemes, 190
preprocessor, 313–322
compile or build time vs.
runtime, 322
conditionals, 315–316
macros, 150, 313–314, 316–321
poison, 315
previewing replacements, 95–96
printenv command, environment
variables and, 305
printing objects and values,
251–254
probes, defined, 326
Product Name field, 12–13
Profile action (schemes), 188
program execution, controlling, 256
Project navigator, 21, 363, 365
project options sheet, 208, 209](https://image.slidesharecdn.com/peachpit-141129150150-conversion-gate01/85/Peachpit-mastering-xcode-4-develop-and-design-sep-2011-395-320.jpg)


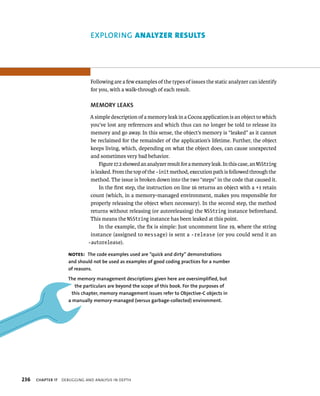
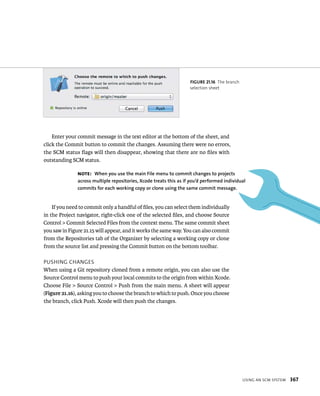
![cAtegOry cOmmAnd shOrtcUt
editor Menu for
interface Builder
align Left Edges Command+[
align right Edges Command+]
Size to Fit Command+=
add Horizontal Guide Command+_
add Vertical Guide Command+|
editor Menu
for PDF
next Page option+Command+down arrow
Previous Page option+Command+down arrow
editor Menu for
Scripting Definition
Make Text Bigger Command++
Make Text Smaller Command+–
editor Menu for
Source Code
Show Completions Control+Space
Edit all in Scope Control+Command+E
Fix all in Scope Control+Command+F
Show all Issues Control+Command+M
re-Indent Control+|
Shift right Command+]
Shift Left Command+[
Move Line up option+Command+[
Move Line down option+Command+]
Comment Selection Command+/
Fold option+Command+Left arrow
unfold option+Command+right arrow
Fold Methods & Functions option+Shift+Command+Left arrow
unfold Methods & Functions option+Shift+Command+right arrow
Fold Comment Blocks Control+Shift+Command+Left arrow
unfold Comment Blocks Control+Shift+Command+right arrow
B-22 Appendix B geStureS anD KeYboarD ShortcutS](https://image.slidesharecdn.com/peachpit-141129150150-conversion-gate01/85/Peachpit-mastering-xcode-4-develop-and-design-sep-2011-423-320.jpg)


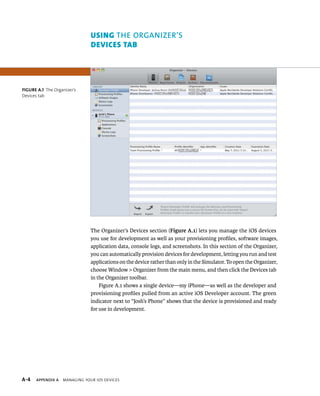
This document provides information about the book "Mastering Xcode 4: Develop and Design" by Joshua Nozzi. It was published by Peachpit Press in 2012 and covers using Xcode 4 to develop applications for iOS and Mac OS X. The book includes chapters on using the Xcode interface, creating user interfaces, adding and managing files in a project, writing and debugging code, and using the data model editor. It is intended to help readers master the development tools and workflows in Xcode 4.


![[DSC Europe 25] Milos Belcevic - Product Professional's Journey to Full-Stack...](https://cdn.slidesharecdn.com/ss_thumbnails/1zovd6fgsycdg4wvgvls-milos-belcevic-product-professionals-journey-to-full-stack-product-developer-260123083019-d993120d-thumbnail.jpg?width=640&height=640&fit=bounds)
![[DSC Europe 25] Tali Fulman - Guild Meetings, Then What? Building Data Commun...](https://cdn.slidesharecdn.com/ss_thumbnails/fgohhi33rwmhqdowdj5k-tali-fulman-guild-meetings-then-what-building-data-communities-that-actually-ch-260120105855-528492c3-thumbnail.jpg?width=640&height=640&fit=bounds)
![[DSC Europe 25] Mikhail Rozhkov - AI Product Canvas: From Business Goals to T...](https://cdn.slidesharecdn.com/ss_thumbnails/d53doddtpgfqivmzqel6-mikhail-rozhkov-ai-product-canvas-v1-260121115910-9dd517a7-thumbnail.jpg?width=640&height=640&fit=bounds)
![[DSC Europe 25] Andrzej Kowalczyk - AI - how to start small and grow in the f...](https://cdn.slidesharecdn.com/ss_thumbnails/oy1zmo94qv6vpcqjvno2-andrzej-kowalczyk-ai-how-to-start-small-and-grow-in-the-future-1-260119121559-cf093b23-thumbnail.jpg?width=640&height=640&fit=bounds)
![[DSC Europe 25] Marcos Heidemann - Beyond the Hype: Making AI Coding Assistan...](https://cdn.slidesharecdn.com/ss_thumbnails/eexkhvldrjsopspdjbur-marcos-heidemann-beyond-the-hype-getting-real-value-out-of-ai-assisted-coding-260121115910-7e9d41ec-thumbnail.jpg?width=640&height=640&fit=bounds)

![[DSC Europe 25] Jovan Sumarac - Real-World Applications of Computer Vision in...](https://cdn.slidesharecdn.com/ss_thumbnails/fiksms22smcpopvvld03-jovan-sumarac-real-life-applications-of-computer-vision-in-automotive-systems-260120105855-de622abb-thumbnail.jpg?width=640&height=640&fit=bounds)


![[DSC Europe 25] Gordana Milutinovic Dumbelovic - From Insight to Oversight: A...](https://cdn.slidesharecdn.com/ss_thumbnails/t7dkjsfxqwwzceropjv4-gordana-milutinovicdumbelovic-from-insight-to-oversight-ai-driven-power-bi-moni-260119121559-9e0bf11b-thumbnail.jpg?width=640&height=640&fit=bounds)

![[DSC Europe 25] Egor Krasheninnikov - The Control Stack: Building Guardrails ...](https://cdn.slidesharecdn.com/ss_thumbnails/3lzcz7hxqmo51mtalv4u-the-control-stack-260119101520-ea90841a-thumbnail.jpg?width=640&height=640&fit=bounds)


