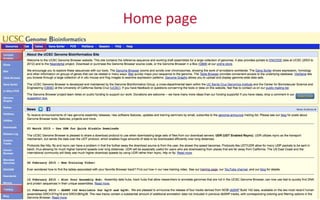
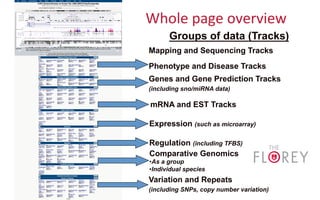
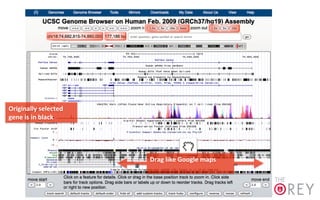
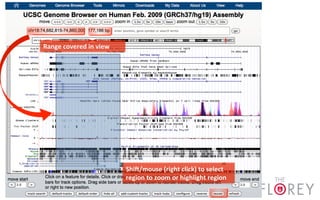
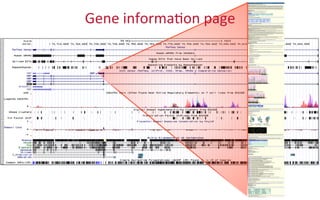
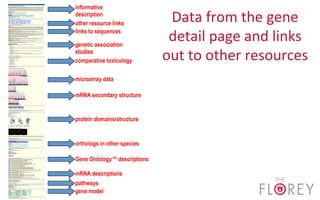
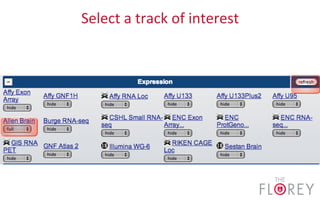
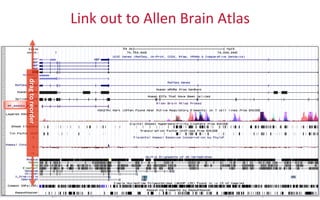
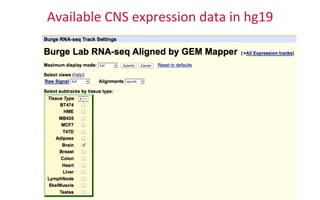
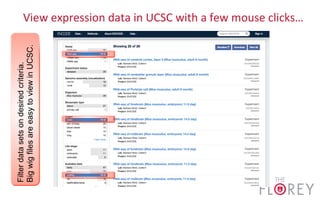
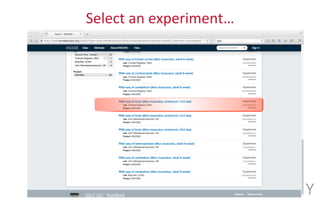
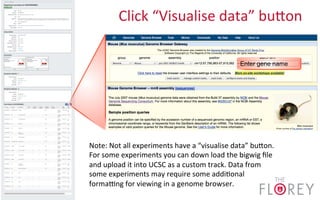
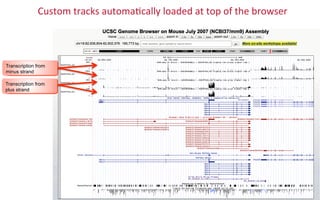
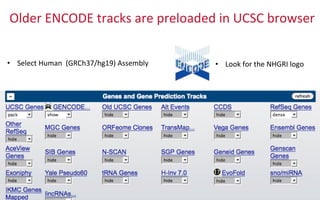
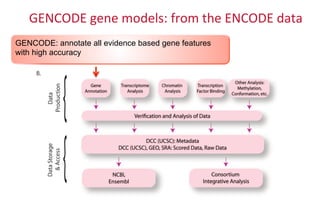
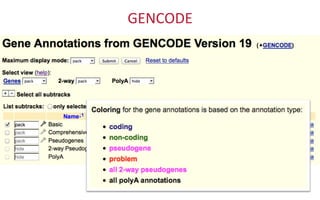
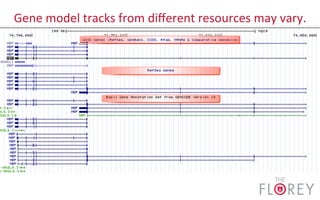
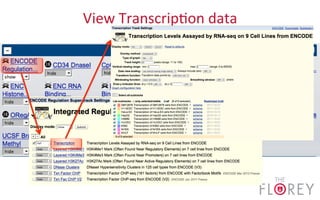
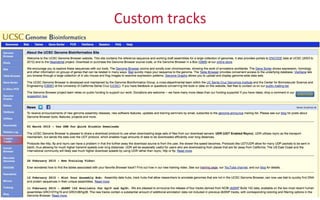
An self guided tutorial based overview of the UCSC genome browser for accessing public neuroscience data, in particular data from the ENCODE project. Including additional transcriptomic resources for the Neurosciences.
These are the first lecture slides of the BITS bioinformatics training session on the UCSC Genome Browser.
See http://www.bits.vib.be/index.php?option=com_content&view=article&id=17203990:orange-genome-browsers-ucsc-training&catid=81:training-pages&Itemid=190
INTRODUCTION OF BIOINFORMATICS
HISTORY
WHAT IS DATABASE
NEED FOR DATABASE
TYPES OF DATABASE
PRIMARY DATABASE
NUCLEIC ACID SEQUENCE DATABASE
GENE BANK
INTRODUCTION
GENE BANK SUBMISSION TOOL
GENE BANK SUBMISSION TYPE
HOW TO RETRIEVE DATA FROM GENEBANK
APPLICATION
CONCLUSION
REFERENCE
Protein Sequence, Structure, and Functional Databases: UniProtKB, Swiss-Prot, TrEMBL, PIR, MIPS, PROSITE, PRINTS, BLOCKS, Pfam, NDRB, OWL, PDB, SCOP, CATH, NDB, PQS, SYSTERS, and Motif. Presented at UGC Sponsored National Workshop on Bioinformatics and Sequence Analysis conducted by Nesamony Memorial Christian College, Marthandam on 9th and 10th October, 2017 by Prof. T. Ashok Kumar
Genomic databases are referred to as online repositories of genomic variants, described for a single (locus-specific) or more (general) genes or specifically for a population or ethnic group (national/ethnic).
Functional proteomics, methods and toolsKAUSHAL SAHU
INTRODUCTION
HISTORY
DEFINITION
PROTEOMICS
FUNCTIONAL PROTEOMICS
PROTEOMICS SOFTWARE
PROTEOMICS ANALYSIS
TOOLS FOR PROTEOM ANALYSIS
DIFFERENTS METHODS FOR STUDY OF FUNCTIONAL PROTEOMICS
APLLICATIONS
LIMITATIONS
CONCLUSION
protein structure prediction methods. homology modelling, fold recognition, threading, ab initio methods. in short and easy form slides. after one time read you can easily understand methods for protein structure prediction.
The DNA Data Bank of Japan (DDBJ) is a biological database that collects DNA sequences. It is located at the National Institute of Genetics (NIG) in the Shizuoka prefecture of Japan. It is also a member of the International Nucleotide Sequence Database Collaboration or INSDC.
These is the second part of the lecture slides of the BITS bioinformatics training session on the UCSC Genome Browser.
See http://www.bits.vib.be/index.php?option=com_content&view=article&id=17203990:orange-genome-browsers-ucsc-training&catid=81:training-pages&Itemid=190
Apollo is a web-based, collaborative genomic annotation editing platform. We need annotation editing tools to modify and refine precise location and structure of the genome elements that predictive algorithms cannot yet resolve automatically.
This presentation is an introduction to how the manual annotation process takes place using Apollo. It is addressed to the members of the American Chestnut & Chinese Chestnut Genomics research community.
Exploring DNA/RNA-Seq Analysis Results with Golden Helix GenomeBrowse and SVSGolden Helix Inc
GenomeBrowse, a free visualization tool for all types of sequence data, was introduced in 2012 to broad acclaim. Researchers using GenomeBrowse discovered a product far beyond the status quo with seamless navigation of sequence alignments and other genomic data using a fluid, fast, and intuitive interface that just "made sense." Recent updates to GenomeBrowse, including support for VCF files and BED files and the ability to export tables of data extracted from viewable annotation tracks, further improved the product and created new synergy with Golden Helix SNP & Variation Suite (SVS).
This webcast will demonstrate the ability of GenomeBrowse to stream sequence alignment data from the Amazon Cloud, seamlessly transitioning between whole genome views and base-pair resolution in the context of both public and custom annotation tracks. We will show how GenomeBrowse can be used in conjunction with SVS to highlight false variant calls, confirm the inheritance pattern of putative functional variants, and aid in the interpretation of a variant's impact. Examples of RNA-seq expression analysis, somatic variation in cancer, and family-based DNA-seq analysis will be included.
Apollo: A workshop for the Manakin Research Coordination NetworkMonica Munoz-Torres
Apollo is a web-based, collaborative genomic annotation editing platform. We need annotation editing tools to modify and refine precise location and structure of the genome elements that predictive algorithms cannot yet resolve automatically.
This presentation is an introduction to how the manual annotation process takes place using Apollo. It is addressed to the members of the Manakin Genomics research community.
Course: Bioinformatics for Biomedical Research (2014).
Session: 4.1- Introduction to RNA-seq and RNA-seq Data Analysis.
Statistics and Bioinformatisc Unit (UEB) & High Technology Unit (UAT) from Vall d'Hebron Research Institute (www.vhir.org), Barcelona.
Apollo is a web-based application that supports and enables collaborative genome curation in real time, allowing teams of curators to improve on existing automated gene models through an intuitive interface. Apollo allows researchers to break down large amounts of data into manageable portions to mobilize groups of researchers with shared interests.
The i5K, an initiative to sequence the genomes of 5,000 insect and related arthropod species, is a broad and inclusive effort that seeks to involve scientists from around the world in their genome curation process, and Apollo is serving as the platform to empower this community.
This presentation is an introduction to Apollo for the members of the i5K Pilot Project working on species of the order Hemiptera.
A microarray is a laboratory tool used to detect the expression of thousands of genes at the same time. DNA microarrays are microscope slides that are printed with thousands of tiny spots in defined positions, with each spot containing a known DNA sequence or gene.
DeepBlue epigenomic data server: programmatic data retrieval and analysis of ...Felipe Albrecht
Short description and updates about DeepBlue Epigenomic Data Server that I presented during the last Blueprint (http://www.blueprint-epigenome.eu/) Jamboree in Madrid (June 2016)
Similar to The UCSC genome browser: A Neuroscience focused overview (20)
THE IMPORTANCE OF MARTIAN ATMOSPHERE SAMPLE RETURN.Sérgio Sacani
The return of a sample of near-surface atmosphere from Mars would facilitate answers to several first-order science questions surrounding the formation and evolution of the planet. One of the important aspects of terrestrial planet formation in general is the role that primary atmospheres played in influencing the chemistry and structure of the planets and their antecedents. Studies of the martian atmosphere can be used to investigate the role of a primary atmosphere in its history. Atmosphere samples would also inform our understanding of the near-surface chemistry of the planet, and ultimately the prospects for life. High-precision isotopic analyses of constituent gases are needed to address these questions, requiring that the analyses are made on returned samples rather than in situ.
This presentation explores a brief idea about the structural and functional attributes of nucleotides, the structure and function of genetic materials along with the impact of UV rays and pH upon them.
This pdf is about the Schizophrenia.
For more details visit on YouTube; @SELF-EXPLANATORY;
https://www.youtube.com/channel/UCAiarMZDNhe1A3Rnpr_WkzA/videos
Thanks...!
(May 29th, 2024) Advancements in Intravital Microscopy- Insights for Preclini...Scintica Instrumentation
Intravital microscopy (IVM) is a powerful tool utilized to study cellular behavior over time and space in vivo. Much of our understanding of cell biology has been accomplished using various in vitro and ex vivo methods; however, these studies do not necessarily reflect the natural dynamics of biological processes. Unlike traditional cell culture or fixed tissue imaging, IVM allows for the ultra-fast high-resolution imaging of cellular processes over time and space and were studied in its natural environment. Real-time visualization of biological processes in the context of an intact organism helps maintain physiological relevance and provide insights into the progression of disease, response to treatments or developmental processes.
In this webinar we give an overview of advanced applications of the IVM system in preclinical research. IVIM technology is a provider of all-in-one intravital microscopy systems and solutions optimized for in vivo imaging of live animal models at sub-micron resolution. The system’s unique features and user-friendly software enables researchers to probe fast dynamic biological processes such as immune cell tracking, cell-cell interaction as well as vascularization and tumor metastasis with exceptional detail. This webinar will also give an overview of IVM being utilized in drug development, offering a view into the intricate interaction between drugs/nanoparticles and tissues in vivo and allows for the evaluation of therapeutic intervention in a variety of tissues and organs. This interdisciplinary collaboration continues to drive the advancements of novel therapeutic strategies.
Earliest Galaxies in the JADES Origins Field: Luminosity Function and Cosmic ...Sérgio Sacani
We characterize the earliest galaxy population in the JADES Origins Field (JOF), the deepest
imaging field observed with JWST. We make use of the ancillary Hubble optical images (5 filters
spanning 0.4−0.9µm) and novel JWST images with 14 filters spanning 0.8−5µm, including 7 mediumband filters, and reaching total exposure times of up to 46 hours per filter. We combine all our data
at > 2.3µm to construct an ultradeep image, reaching as deep as ≈ 31.4 AB mag in the stack and
30.3-31.0 AB mag (5σ, r = 0.1” circular aperture) in individual filters. We measure photometric
redshifts and use robust selection criteria to identify a sample of eight galaxy candidates at redshifts
z = 11.5 − 15. These objects show compact half-light radii of R1/2 ∼ 50 − 200pc, stellar masses of
M⋆ ∼ 107−108M⊙, and star-formation rates of SFR ∼ 0.1−1 M⊙ yr−1
. Our search finds no candidates
at 15 < z < 20, placing upper limits at these redshifts. We develop a forward modeling approach to
infer the properties of the evolving luminosity function without binning in redshift or luminosity that
marginalizes over the photometric redshift uncertainty of our candidate galaxies and incorporates the
impact of non-detections. We find a z = 12 luminosity function in good agreement with prior results,
and that the luminosity function normalization and UV luminosity density decline by a factor of ∼ 2.5
from z = 12 to z = 14. We discuss the possible implications of our results in the context of theoretical
models for evolution of the dark matter halo mass function.
Introduction:
RNA interference (RNAi) or Post-Transcriptional Gene Silencing (PTGS) is an important biological process for modulating eukaryotic gene expression.
It is highly conserved process of posttranscriptional gene silencing by which double stranded RNA (dsRNA) causes sequence-specific degradation of mRNA sequences.
dsRNA-induced gene silencing (RNAi) is reported in a wide range of eukaryotes ranging from worms, insects, mammals and plants.
This process mediates resistance to both endogenous parasitic and exogenous pathogenic nucleic acids, and regulates the expression of protein-coding genes.
What are small ncRNAs?
micro RNA (miRNA)
short interfering RNA (siRNA)
Properties of small non-coding RNA:
Involved in silencing mRNA transcripts.
Called “small” because they are usually only about 21-24 nucleotides long.
Synthesized by first cutting up longer precursor sequences (like the 61nt one that Lee discovered).
Silence an mRNA by base pairing with some sequence on the mRNA.
Discovery of siRNA?
The first small RNA:
In 1993 Rosalind Lee (Victor Ambros lab) was studying a non- coding gene in C. elegans, lin-4, that was involved in silencing of another gene, lin-14, at the appropriate time in the
development of the worm C. elegans.
Two small transcripts of lin-4 (22nt and 61nt) were found to be complementary to a sequence in the 3' UTR of lin-14.
Because lin-4 encoded no protein, she deduced that it must be these transcripts that are causing the silencing by RNA-RNA interactions.
Types of RNAi ( non coding RNA)
MiRNA
Length (23-25 nt)
Trans acting
Binds with target MRNA in mismatch
Translation inhibition
Si RNA
Length 21 nt.
Cis acting
Bind with target Mrna in perfect complementary sequence
Piwi-RNA
Length ; 25 to 36 nt.
Expressed in Germ Cells
Regulates trnasposomes activity
MECHANISM OF RNAI:
First the double-stranded RNA teams up with a protein complex named Dicer, which cuts the long RNA into short pieces.
Then another protein complex called RISC (RNA-induced silencing complex) discards one of the two RNA strands.
The RISC-docked, single-stranded RNA then pairs with the homologous mRNA and destroys it.
THE RISC COMPLEX:
RISC is large(>500kD) RNA multi- protein Binding complex which triggers MRNA degradation in response to MRNA
Unwinding of double stranded Si RNA by ATP independent Helicase
Active component of RISC is Ago proteins( ENDONUCLEASE) which cleave target MRNA.
DICER: endonuclease (RNase Family III)
Argonaute: Central Component of the RNA-Induced Silencing Complex (RISC)
One strand of the dsRNA produced by Dicer is retained in the RISC complex in association with Argonaute
ARGONAUTE PROTEIN :
1.PAZ(PIWI/Argonaute/ Zwille)- Recognition of target MRNA
2.PIWI (p-element induced wimpy Testis)- breaks Phosphodiester bond of mRNA.)RNAse H activity.
MiRNA:
The Double-stranded RNAs are naturally produced in eukaryotic cells during development, and they have a key role in regulating gene expression .
Comparing Evolved Extractive Text Summary Scores of Bidirectional Encoder Rep...University of Maribor
Slides from:
11th International Conference on Electrical, Electronics and Computer Engineering (IcETRAN), Niš, 3-6 June 2024
Track: Artificial Intelligence
https://www.etran.rs/2024/en/home-english/
Cancer cell metabolism: special Reference to Lactate PathwayAADYARAJPANDEY1
Normal Cell Metabolism:
Cellular respiration describes the series of steps that cells use to break down sugar and other chemicals to get the energy we need to function.
Energy is stored in the bonds of glucose and when glucose is broken down, much of that energy is released.
Cell utilize energy in the form of ATP.
The first step of respiration is called glycolysis. In a series of steps, glycolysis breaks glucose into two smaller molecules - a chemical called pyruvate. A small amount of ATP is formed during this process.
Most healthy cells continue the breakdown in a second process, called the Kreb's cycle. The Kreb's cycle allows cells to “burn” the pyruvates made in glycolysis to get more ATP.
The last step in the breakdown of glucose is called oxidative phosphorylation (Ox-Phos).
It takes place in specialized cell structures called mitochondria. This process produces a large amount of ATP. Importantly, cells need oxygen to complete oxidative phosphorylation.
If a cell completes only glycolysis, only 2 molecules of ATP are made per glucose. However, if the cell completes the entire respiration process (glycolysis - Kreb's - oxidative phosphorylation), about 36 molecules of ATP are created, giving it much more energy to use.
IN CANCER CELL:
Unlike healthy cells that "burn" the entire molecule of sugar to capture a large amount of energy as ATP, cancer cells are wasteful.
Cancer cells only partially break down sugar molecules. They overuse the first step of respiration, glycolysis. They frequently do not complete the second step, oxidative phosphorylation.
This results in only 2 molecules of ATP per each glucose molecule instead of the 36 or so ATPs healthy cells gain. As a result, cancer cells need to use a lot more sugar molecules to get enough energy to survive.
introduction to WARBERG PHENOMENA:
WARBURG EFFECT Usually, cancer cells are highly glycolytic (glucose addiction) and take up more glucose than do normal cells from outside.
Otto Heinrich Warburg (; 8 October 1883 – 1 August 1970) In 1931 was awarded the Nobel Prize in Physiology for his "discovery of the nature and mode of action of the respiratory enzyme.
WARNBURG EFFECT : cancer cells under aerobic (well-oxygenated) conditions to metabolize glucose to lactate (aerobic glycolysis) is known as the Warburg effect. Warburg made the observation that tumor slices consume glucose and secrete lactate at a higher rate than normal tissues.
Deep Behavioral Phenotyping in Systems Neuroscience for Functional Atlasing a...Ana Luísa Pinho
Functional Magnetic Resonance Imaging (fMRI) provides means to characterize brain activations in response to behavior. However, cognitive neuroscience has been limited to group-level effects referring to the performance of specific tasks. To obtain the functional profile of elementary cognitive mechanisms, the combination of brain responses to many tasks is required. Yet, to date, both structural atlases and parcellation-based activations do not fully account for cognitive function and still present several limitations. Further, they do not adapt overall to individual characteristics. In this talk, I will give an account of deep-behavioral phenotyping strategies, namely data-driven methods in large task-fMRI datasets, to optimize functional brain-data collection and improve inference of effects-of-interest related to mental processes. Key to this approach is the employment of fast multi-functional paradigms rich on features that can be well parametrized and, consequently, facilitate the creation of psycho-physiological constructs to be modelled with imaging data. Particular emphasis will be given to music stimuli when studying high-order cognitive mechanisms, due to their ecological nature and quality to enable complex behavior compounded by discrete entities. I will also discuss how deep-behavioral phenotyping and individualized models applied to neuroimaging data can better account for the subject-specific organization of domain-general cognitive systems in the human brain. Finally, the accumulation of functional brain signatures brings the possibility to clarify relationships among tasks and create a univocal link between brain systems and mental functions through: (1) the development of ontologies proposing an organization of cognitive processes; and (2) brain-network taxonomies describing functional specialization. To this end, tools to improve commensurability in cognitive science are necessary, such as public repositories, ontology-based platforms and automated meta-analysis tools. I will thus discuss some brain-atlasing resources currently under development, and their applicability in cognitive as well as clinical neuroscience.
Slide 1: Title Slide
Extrachromosomal Inheritance
Slide 2: Introduction to Extrachromosomal Inheritance
Definition: Extrachromosomal inheritance refers to the transmission of genetic material that is not found within the nucleus.
Key Components: Involves genes located in mitochondria, chloroplasts, and plasmids.
Slide 3: Mitochondrial Inheritance
Mitochondria: Organelles responsible for energy production.
Mitochondrial DNA (mtDNA): Circular DNA molecule found in mitochondria.
Inheritance Pattern: Maternally inherited, meaning it is passed from mothers to all their offspring.
Diseases: Examples include Leber’s hereditary optic neuropathy (LHON) and mitochondrial myopathy.
Slide 4: Chloroplast Inheritance
Chloroplasts: Organelles responsible for photosynthesis in plants.
Chloroplast DNA (cpDNA): Circular DNA molecule found in chloroplasts.
Inheritance Pattern: Often maternally inherited in most plants, but can vary in some species.
Examples: Variegation in plants, where leaf color patterns are determined by chloroplast DNA.
Slide 5: Plasmid Inheritance
Plasmids: Small, circular DNA molecules found in bacteria and some eukaryotes.
Features: Can carry antibiotic resistance genes and can be transferred between cells through processes like conjugation.
Significance: Important in biotechnology for gene cloning and genetic engineering.
Slide 6: Mechanisms of Extrachromosomal Inheritance
Non-Mendelian Patterns: Do not follow Mendel’s laws of inheritance.
Cytoplasmic Segregation: During cell division, organelles like mitochondria and chloroplasts are randomly distributed to daughter cells.
Heteroplasmy: Presence of more than one type of organellar genome within a cell, leading to variation in expression.
Slide 7: Examples of Extrachromosomal Inheritance
Four O’clock Plant (Mirabilis jalapa): Shows variegated leaves due to different cpDNA in leaf cells.
Petite Mutants in Yeast: Result from mutations in mitochondrial DNA affecting respiration.
Slide 8: Importance of Extrachromosomal Inheritance
Evolution: Provides insight into the evolution of eukaryotic cells.
Medicine: Understanding mitochondrial inheritance helps in diagnosing and treating mitochondrial diseases.
Agriculture: Chloroplast inheritance can be used in plant breeding and genetic modification.
Slide 9: Recent Research and Advances
Gene Editing: Techniques like CRISPR-Cas9 are being used to edit mitochondrial and chloroplast DNA.
Therapies: Development of mitochondrial replacement therapy (MRT) for preventing mitochondrial diseases.
Slide 10: Conclusion
Summary: Extrachromosomal inheritance involves the transmission of genetic material outside the nucleus and plays a crucial role in genetics, medicine, and biotechnology.
Future Directions: Continued research and technological advancements hold promise for new treatments and applications.
Slide 11: Questions and Discussion
Invite Audience: Open the floor for any questions or further discussion on the topic.
Nutraceutical market, scope and growth: Herbal drug technologyLokesh Patil
As consumer awareness of health and wellness rises, the nutraceutical market—which includes goods like functional meals, drinks, and dietary supplements that provide health advantages beyond basic nutrition—is growing significantly. As healthcare expenses rise, the population ages, and people want natural and preventative health solutions more and more, this industry is increasing quickly. Further driving market expansion are product formulation innovations and the use of cutting-edge technology for customized nutrition. With its worldwide reach, the nutraceutical industry is expected to keep growing and provide significant chances for research and investment in a number of categories, including vitamins, minerals, probiotics, and herbal supplements.
Nutraceutical market, scope and growth: Herbal drug technology
The UCSC genome browser: A Neuroscience focused overview
1. The UCSC genome browser: A Neuroscience focused overview
Vicky Perreau, The Florey Bioinformatics Core
Tuesday 17th March 2015
vperreau@unimelb.edu.au
2. Overview
• Browser
– Training
– Configura2on
– Manipula2on
– naviga2on
• Loca2ng
and
loading
Encode
data
• Data
types
3. UCSC
genome
browser
• Purpose
– Lots
of
data
– Customisable
– Detailed
info
pages
– Access
images
(visigene)
– Access
sequence
informa2on-‐FASTA
– Do
sequence
alignments-‐
• BLAT
• Virtual
PCR
4. UCSC
genome
browser
• Structure
– Built
upon
tables
of
data
– Each
table
must
have
genomic
coordinates
• Eg.
list
of
known
genes
– Browser
visualizes
the
data
– Endless
customizable
searches
• Correla2ng
one
type
of
data
with
another
8. Default
view
for
tracks
in
human
hg19
MBP
String
search
or
loca8on
9. Organisa2on
of
genomic
data
(customizable)
• Chromosome
band
• Gap
loca2ons
• Known
genes
• Predicted
genes
• Phenotype
and
disease
• Enhancer/promoter
data
• Microarray
expression
data
• Evolu2onary
conserva2on
• SNPs
and
structural
varia2on
• Repeated
regions
10. Types
of
Data
Reference
sequence
Annota8on
tracks
Gene/protein
informa8on
Comparision
with
other
species
SNPs
11. NGS
data:
raw
data
to
bigwig
files
filename.fastq
=raw
sequence
data,
sequence
and
quality
scores
only.
filename.bam
=aligned
sequence
data,
sequence
data
preserved.
filename.bedgraph
=
posi2on
data
only
for
reads,
no
sequence
data
preserved.
filename.bigwig
=
histogram
of
coverage
for
genomic
posi2on
only,
reads
and
sequence
data
not
preserved.
Small
file
size
allowing
for
ease
of
use
in
genome
browsers
and
overlay
of
mul2ple
bigwig
files.
12. NGS
data:
coverage
plots
for
RNAseq
data
Sebastian Schubert et al. Blood
2014;124:493-502
General
features
of
an
mRNA
transcript
as
visualized
by
RNA-‐seq.
13. Types
of
Data
NGS
data
coverage
plot
(histogram)
is
con8nuous.
SNP
posi8ons
are
discrete
Gene
models:
Line
height
denotes
exon,
intron
or
UTR
Arrows
show
direc8on
of
transcripton
14. Whole
page
overview
Expression (such as microarray)
Variation and Repeats
(including SNPs, copy number variation)
Groups of data (Tracks)
Mapping and Sequencing Tracks
Genes and Gene Prediction Tracks
(including sno/miRNA data)
Phenotype and Disease Tracks
Regulation (including TFBS)
mRNA and EST Tracks
Comparative Genomics
• As a group
• Individual species
18. Data
from
the
gene
detail
page
and
links
out
to
other
resources
informative
description
other resource links
microarray data
mRNA secondary structure
links to sequences
protein domains/structure
orthologs in other species
Gene Ontology™ descriptions
mRNA descriptions
pathways
genetic association
studies
comparative toxicology
gene model
23. ENCODE
project
• In
2003
the
Na2onal
Human
Genome
Research
Ins2tute
embarked
upon:
• The
ENClyopedia
Of
DNA
Elements
(ENCODE)
• Aim
to
delineate
all
of
the
func2onal
elements
in
the
human
genome.
More
recent
data
includes
a
lot
of
mouse
data.
• Goal:
• To
provide
the
scien2fic
community
with
high
quality,
comprehensive
annota2ons
of
candidate
func2onal
elements
in
the
human
genome.
• Func2onal
elements?
• “discrete
region
of
the
genome
that
encodes
a
defined
product
(eg
protein)
or
a
reproducible
biochemical
signature,
such
as
transcrip2on
or
specific
chroma2n
structure”
• Developed
detailed
experiment
guidelines.
•
A
great
resources
if
you
are
considering
designing
your
own
NGS
experiment
(hdps://www.encodeproject.org/about/experiment-‐guidelines/)
24. ENCODE:
data
use
policy
• Early
phase:
• Moratorium
on
public
presenta2on
or
publica2on
of
data
un2l
9
months
aeer
release.
• Now:
• All
data
produced
will
be
available
for
unrestricted
use
immediately
upon
release
to
public
databases,
elimina2ng
the
nine-‐month
moratorium
previously
used
by
ENCODE.
• External
data
users
may
freely
download,
analyze
and
publish
results
based
on
any
ENCODE
data
without
restric8ons
as
soon
as
they
are
released.
• Must
include
appropriate
cita2on.
hdps://www.encodeproject.org/about/data-‐use-‐policy
25. ENCODE:
accessing
data
• 2003-‐2007:
Pilot
phase
examining
1%
of
the
genome
• 2007:
expanded
to
study
en2re
genome
• 2012:
30
high
profile
ar2cles
published
• 2014:
>150
experiments
using
brain
or
spinal
cord
released
• UCSC
was
the
original
Data
Coordina2on
Center
for
ENCODE
and
data
prior
to
2013
is
fully
integrated.
• ENCODE
results
from
2013
and
later
are
available
from
the
ENCODE
Project
Portal.
32. Click
“Visualise
data”
budon
Enter gene name
Note:
Not
all
experiments
have
a
“visualise
data”
budon.
For
some
experiments
you
can
down
load
the
bigwig
file
and
upload
it
into
UCSC
as
a
custom
track.
Data
from
some
experiments
may
require
some
addi2onal
formalng
for
viewing
in
a
genome
browser.
39. MBP
expression
in
7
cell
lines
Select
region
and
add
ver2cal
highlight
40. Transcriptome
data
• Other
tracks
in
the
“expression”
block
of
tracks
supply
data
on
– Poly
A
status
– Subcellular
localisa2on
– Proteogenomics-‐mapping
pep2de
loca2ons
– Start
and
end
points
of
RNA
molecules
in
cells
– Exon
array
and
RNAseq
data
both
available
• Choose
them
all,
but
one
at
a
2me
to
start
with.
It’s
a
lot
of
data!
41. Drill
down
to
mul2ple
layers
• Tracks
with
similar
data
collected
together:
– Super
tracks
• View
meta
data
• Many
customizable
op2ons
– Custom
filtering
thresholds-‐
• level
of
detec2on
• Dependent
on
project
and
technology
– Cell
lines
on
or
off
– Replicates
on
or
off
– Viewing
op2ons
48. Monoallelic
expression
in
mouse
CNS
cell
lines
Li
SM,
Valo
Z,
Wang
J,
Gao
H,
Bowers
CW,
et
al.
(2012)
Transcriptome-‐Wide
Survey
of
Mouse
CNS-‐Derived
Cells
Reveals
Monoallelic
Expression
within
Novel
Gene
Families.
PLoS
ONE
7(2):
e31751.
doi:10.1371/journal.pone.0031751
hdp://127.0.0.1:8081/plosone/ar2cle?id=info:doi/10.1371/journal.pone.0031751
49. Glutamate
Receptor,
Ionotropic,
AMPA
3
Use configure to increase the width of the track
name column to view complete cell line names
50. Monoallelic
expression
preserved
aeer
differen2a2on
into
neurons
an
astrocytes
Li
SM,
Valo
Z,
Wang
J,
Gao
H,
Bowers
CW,
et
al.
(2012)
Transcriptome-‐Wide
Survey
of
Mouse
CNS-‐Derived
Cells
Reveals
Monoallelic
Expression
within
Novel
Gene
Families.
PLoS
ONE
7(2):
e31751.
doi:10.1371/journal.pone.0031751
hdp://127.0.0.1:8081/plosone/ar2cle?id=info:doi/10.1371/journal.pone.0031751
56. Type
gene
of
interest
into
search
bar.
Click here to get RNAseq
expression data.
Find genes with similar
expression profiles across region
and/or developmental age.
First
select
gene
57. RNAseq
data
view:
sorted
by
2ssue
region
Exon location (grey box)
White arrow
denotes sample
Change sort
order from
region to age
Download
58. RNAseq
data
view:
sorted
by
age
Change sort
order from
region to age
Increasing age 8 pcw to 40 years
62. Viewing
BDNF
in
human
brain
RNAseq
data
in
UCSC
Peak
expression
does
not
correspond
with
the
genomic
loca2on
of
a
coding
exon
for
BDNF,
but
rather
to
a
region
of
the
processed
non
coding
an2sense
transcript,
transcribed
off
the
opposite
strand.
63. Inhibi2on
of
BDNF
an2sense
transcript
increased
BDNF
protein
BDNF
an2sense
transcript
level
reduced
BDNF
protein
levels
increased
65. Acknowledgements
If
you
use
a
database
in
your
research
please
acknowledge
it.
• Most
websites
have
a
page
where
they
specify
how
to
acknowledge
them,
usually
by
most
recent
pub.
• Cita8on
or
acknowledgement
is
their
main
means
of
applying
for
con8nued
funding.
If
they
cant
get
funding
one
of
three
things
will
happen:
• They
are
no
longer
free.
• They
are
no
longer
maintained.
• They
no
longer
exist!
Cau8on:
• Check
update/news
page
of
an
unfamiliar
website.
Some
are
s8ll
accessible
but
not
maintained.
Informa8cs
resources
go
out
of
date
quickly
in
this
field.
Look
for
recent
NAR
pub.
• Be
sure
of
your
gene/protein
ID.
Synonyms
can
cause
havoc
when
searching
the
literature
and
databases
(esp
PPI
databases).
If
necessary
check
the
DNA/AA
sequence.