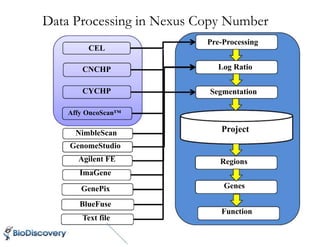
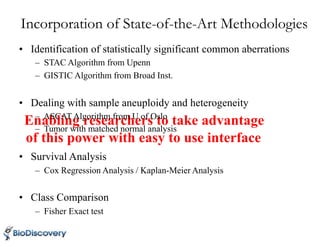
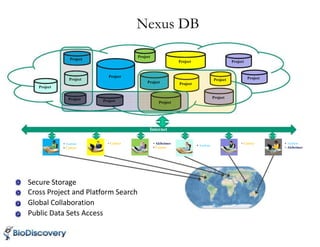
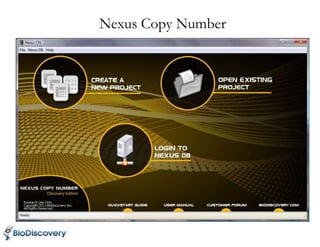
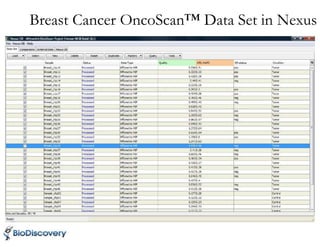
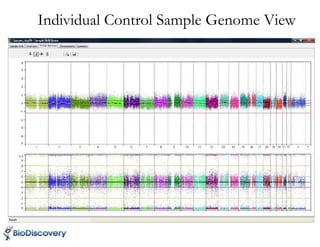
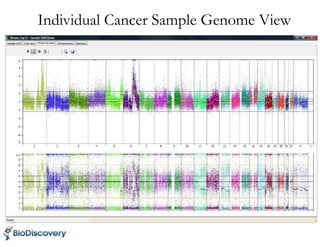
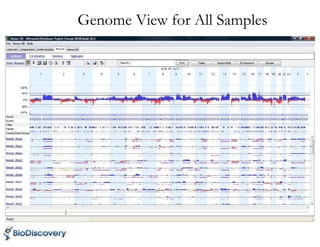
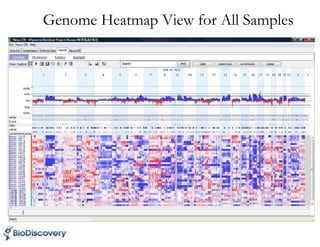
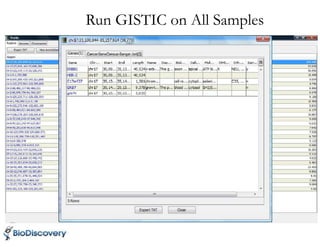
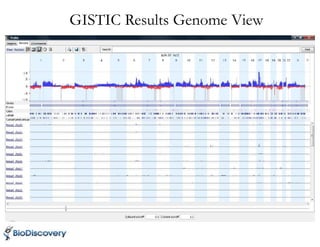
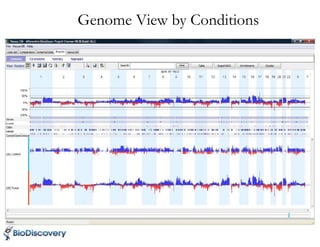
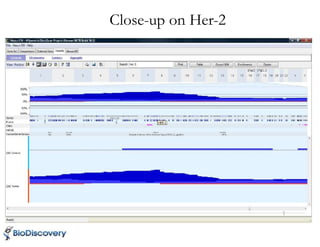
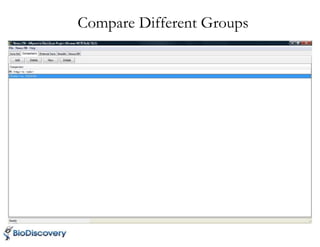
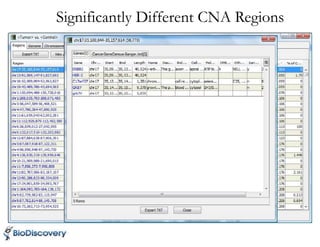
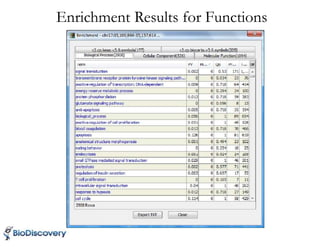
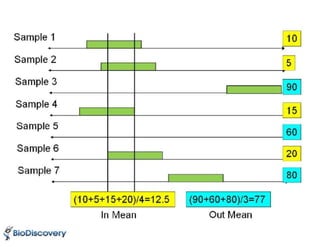
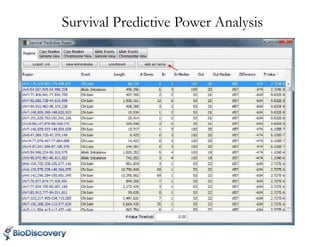
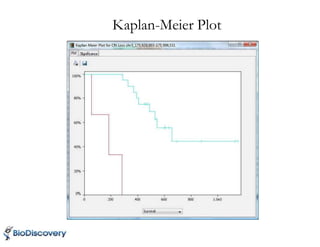
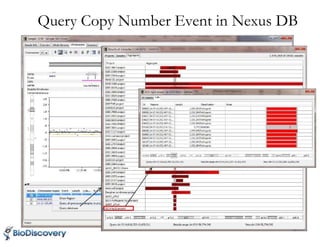
Affymetrix OncoScan™ Data Analysis with
Nexus Copy Number ™
Zhiwei Che, Ph.D.
BioDiscovery, Inc.
Researchers’ needs with OncoScan™ Data
1. Visualize the data in an easy and straightforward way
2. How to identify common aberrations in group of samples
– Based on set minimum frequency
– Using the STAC algorithm
– Using the GISTIC algorithm
3. How to identify regions of significant difference between
two sample populations
4. How to find common biological themes using Gene
Enrichment Analysis
Researchers’ needs with OncoScan™ Data
(cont.)
5. How to identify genomic regions that are predictive of a
numerical value (e.g. age of onset) using Predictive
Power analysis
6. How to identify genomic regions that are predictive of
survival and generate Kaplan-Meier plots
7. How to access public cancer data sets and compare
with their own data
Data Processing in Nexus Copy Number
Pre-Processing
Log Ratio
Segmentation
Project
Regions
Genes
Function
CEL
CNCHP
CYCHP
Affy OncoScan™
NimbleScan
GenomeStudio
Agilent FE
ImaGene
GenePix
BlueFuse
Text file
Enabling researchers to take advantage
Incorporation of State-of-the-Art Methodologies
• Identification of statistically significant common aberrations
– STAC Algorithm from Upenn
– GISTIC Algorithm from Broad Inst.
• Dealing with sample aneuploidy and heterogeneity
– ASCAT Algorithm from U of Oslo
– Tumor with matched normal analysis
of this power with easy to use interface
• Survival Analysis
– Cox Regression Analysis / Kaplan-Meier Analysis
• Class Comparison
– Fisher Exact test
Nexus DB
Project
Project Project
Project
Project
Project
Project
Project ProjectProject
Project
ProjectProject Project
Project
Internet
• Autism
• Cancer
• Autism
• Alzheimer
• Cancer • Cancer• Alzheimer
• Cancer
• Autism
Secure Storage
Cross Project and Platform Search
Global Collaboration
Public Data Sets Access
Nexus Copy Number
Breast Cancer OncoScan™ Data Set in Nexus
Individual Control Sample Genome View
Individual Cancer Sample Genome View
Genome View for All Samples
Genome Heatmap View for All Samples
Run GISTIC on All Samples
GISTIC Results Genome View
Genome View by Conditions
Close-up on Her-2
Compare Different Groups
Significantly Different CNA Regions
Enrichment Results for Functions
Survival Predictive Power Analysis
Kaplan-Meier Plot
Query Copy Number Event in Nexus DB

Affymetrix OncoScan®* data analysis with Nexus Copy Number™