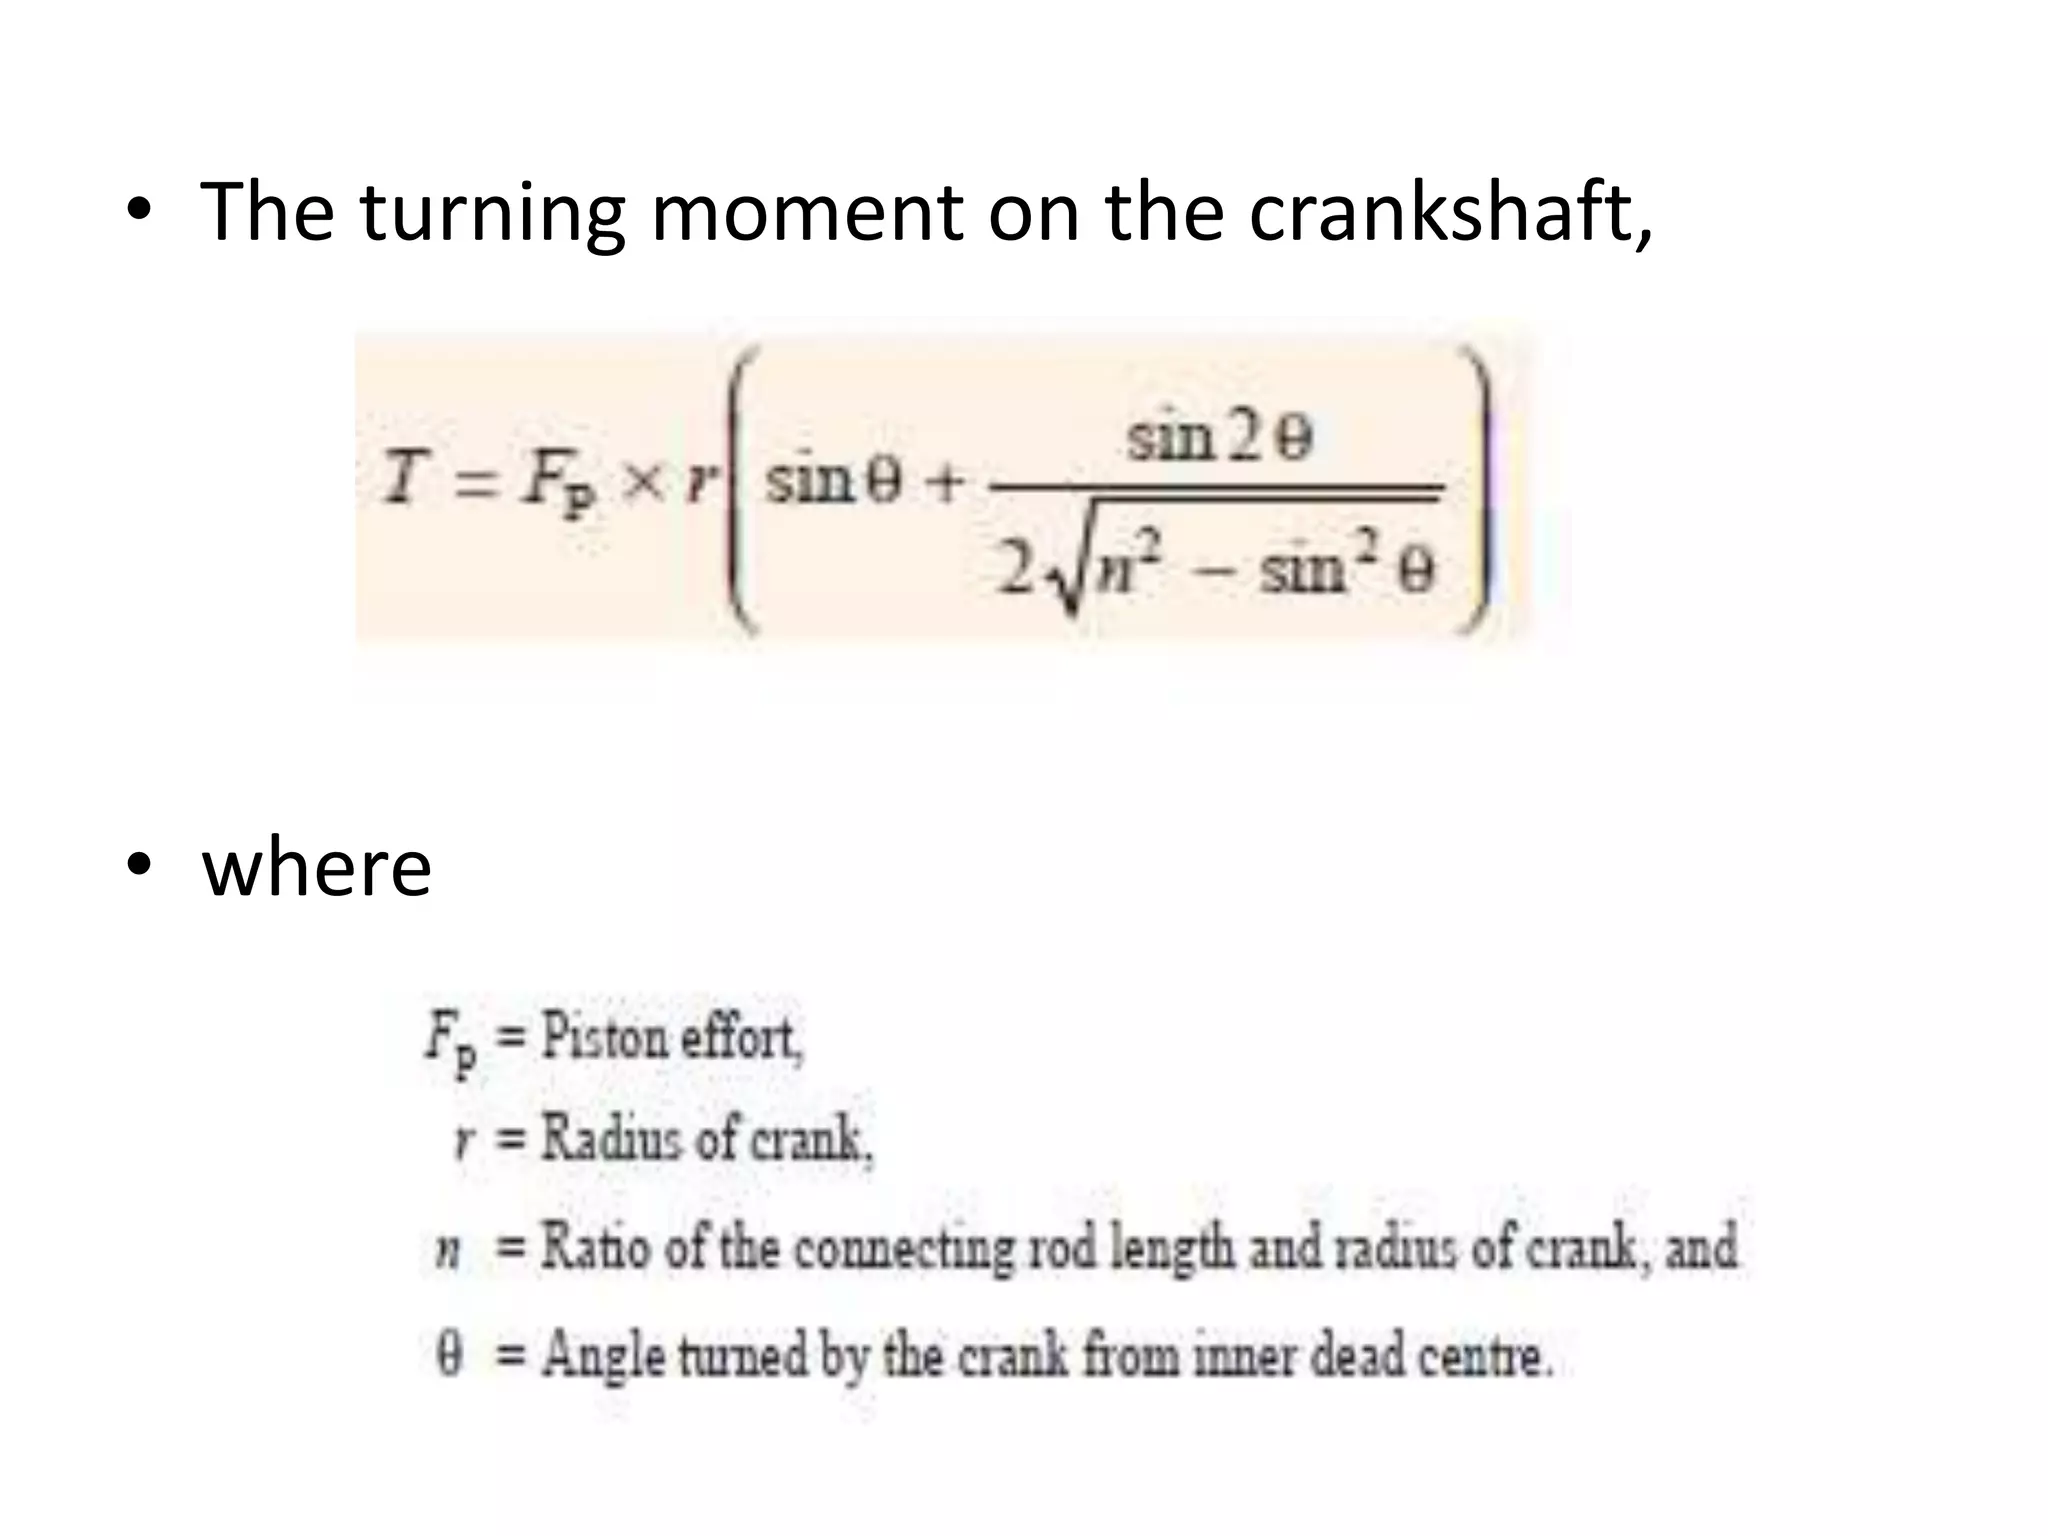
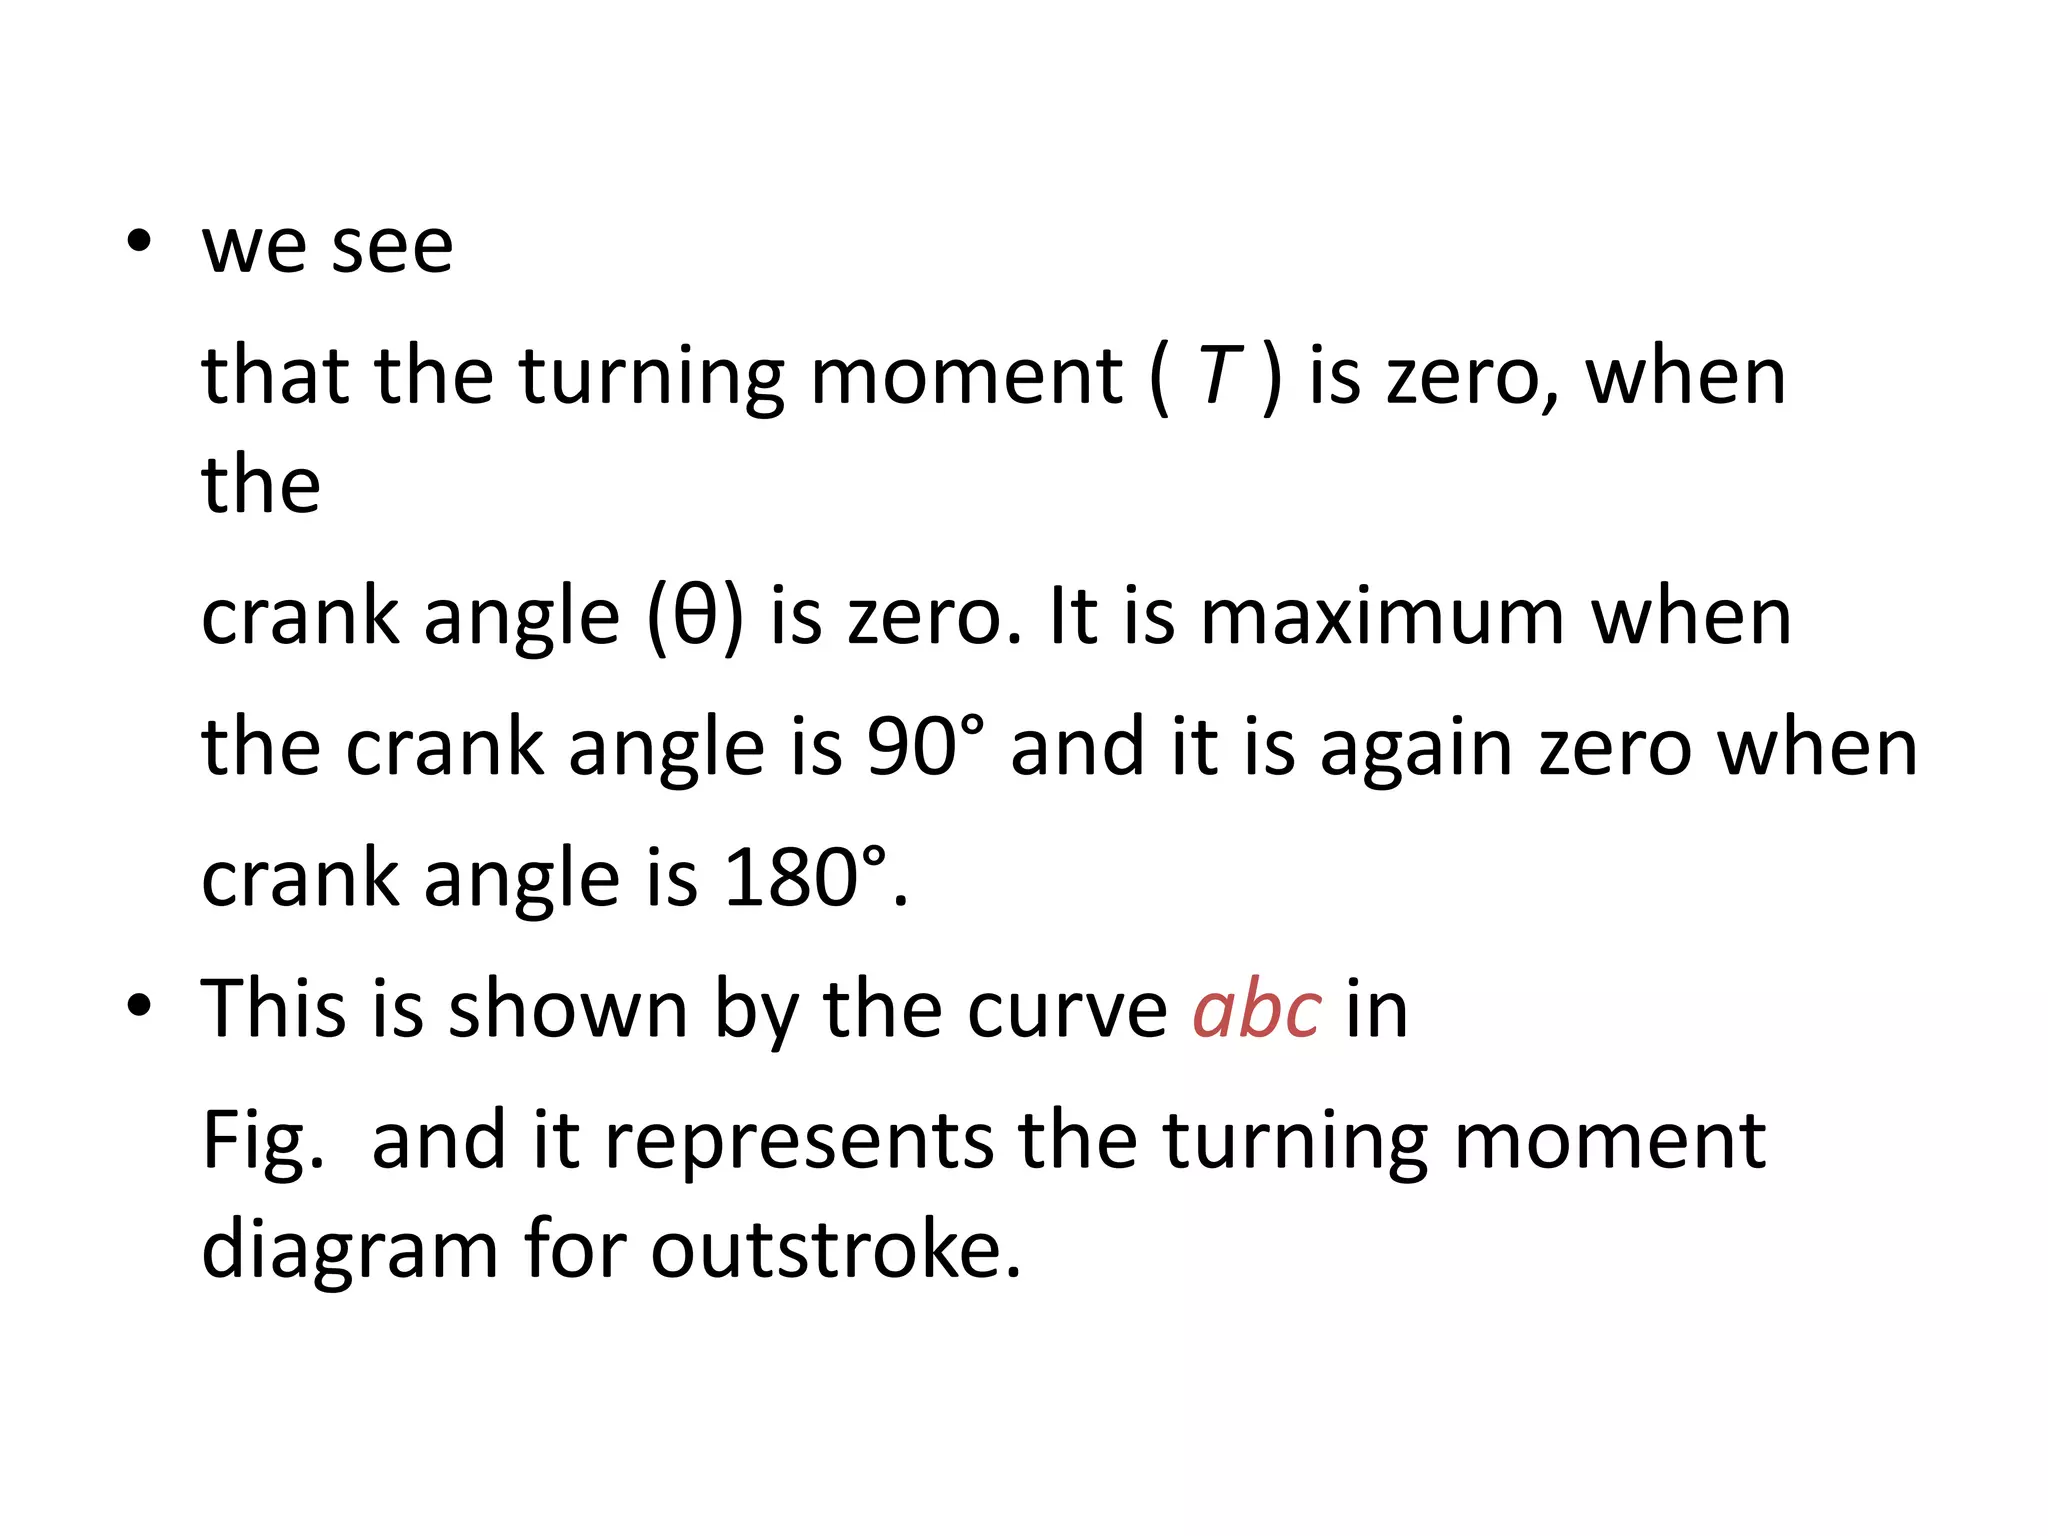
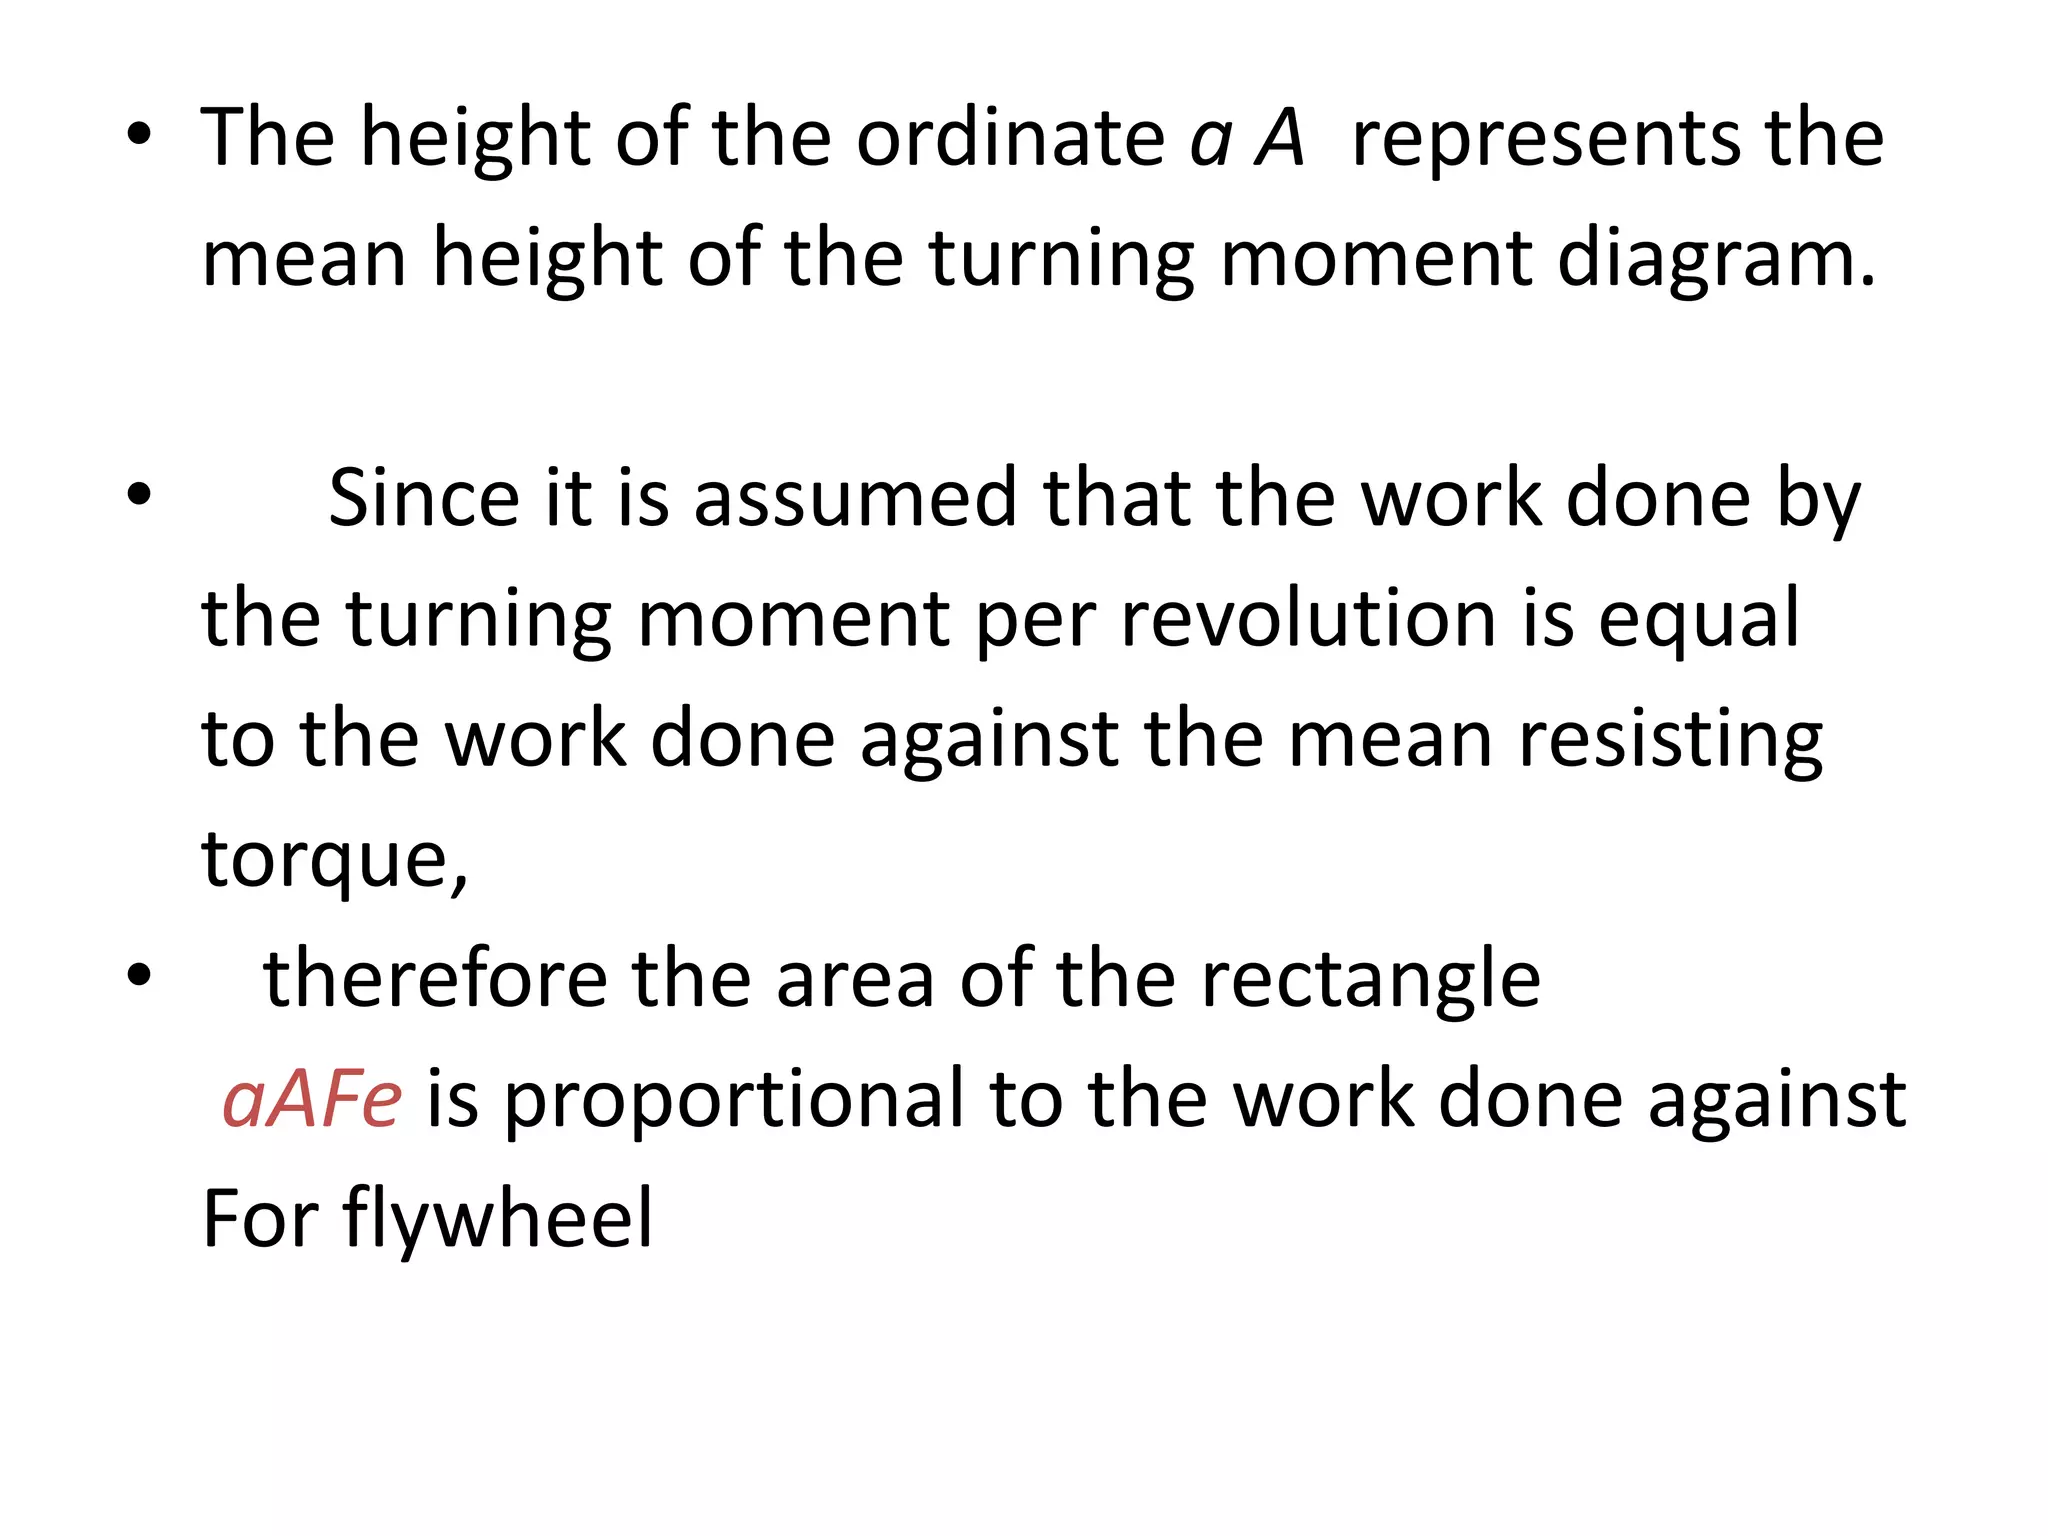
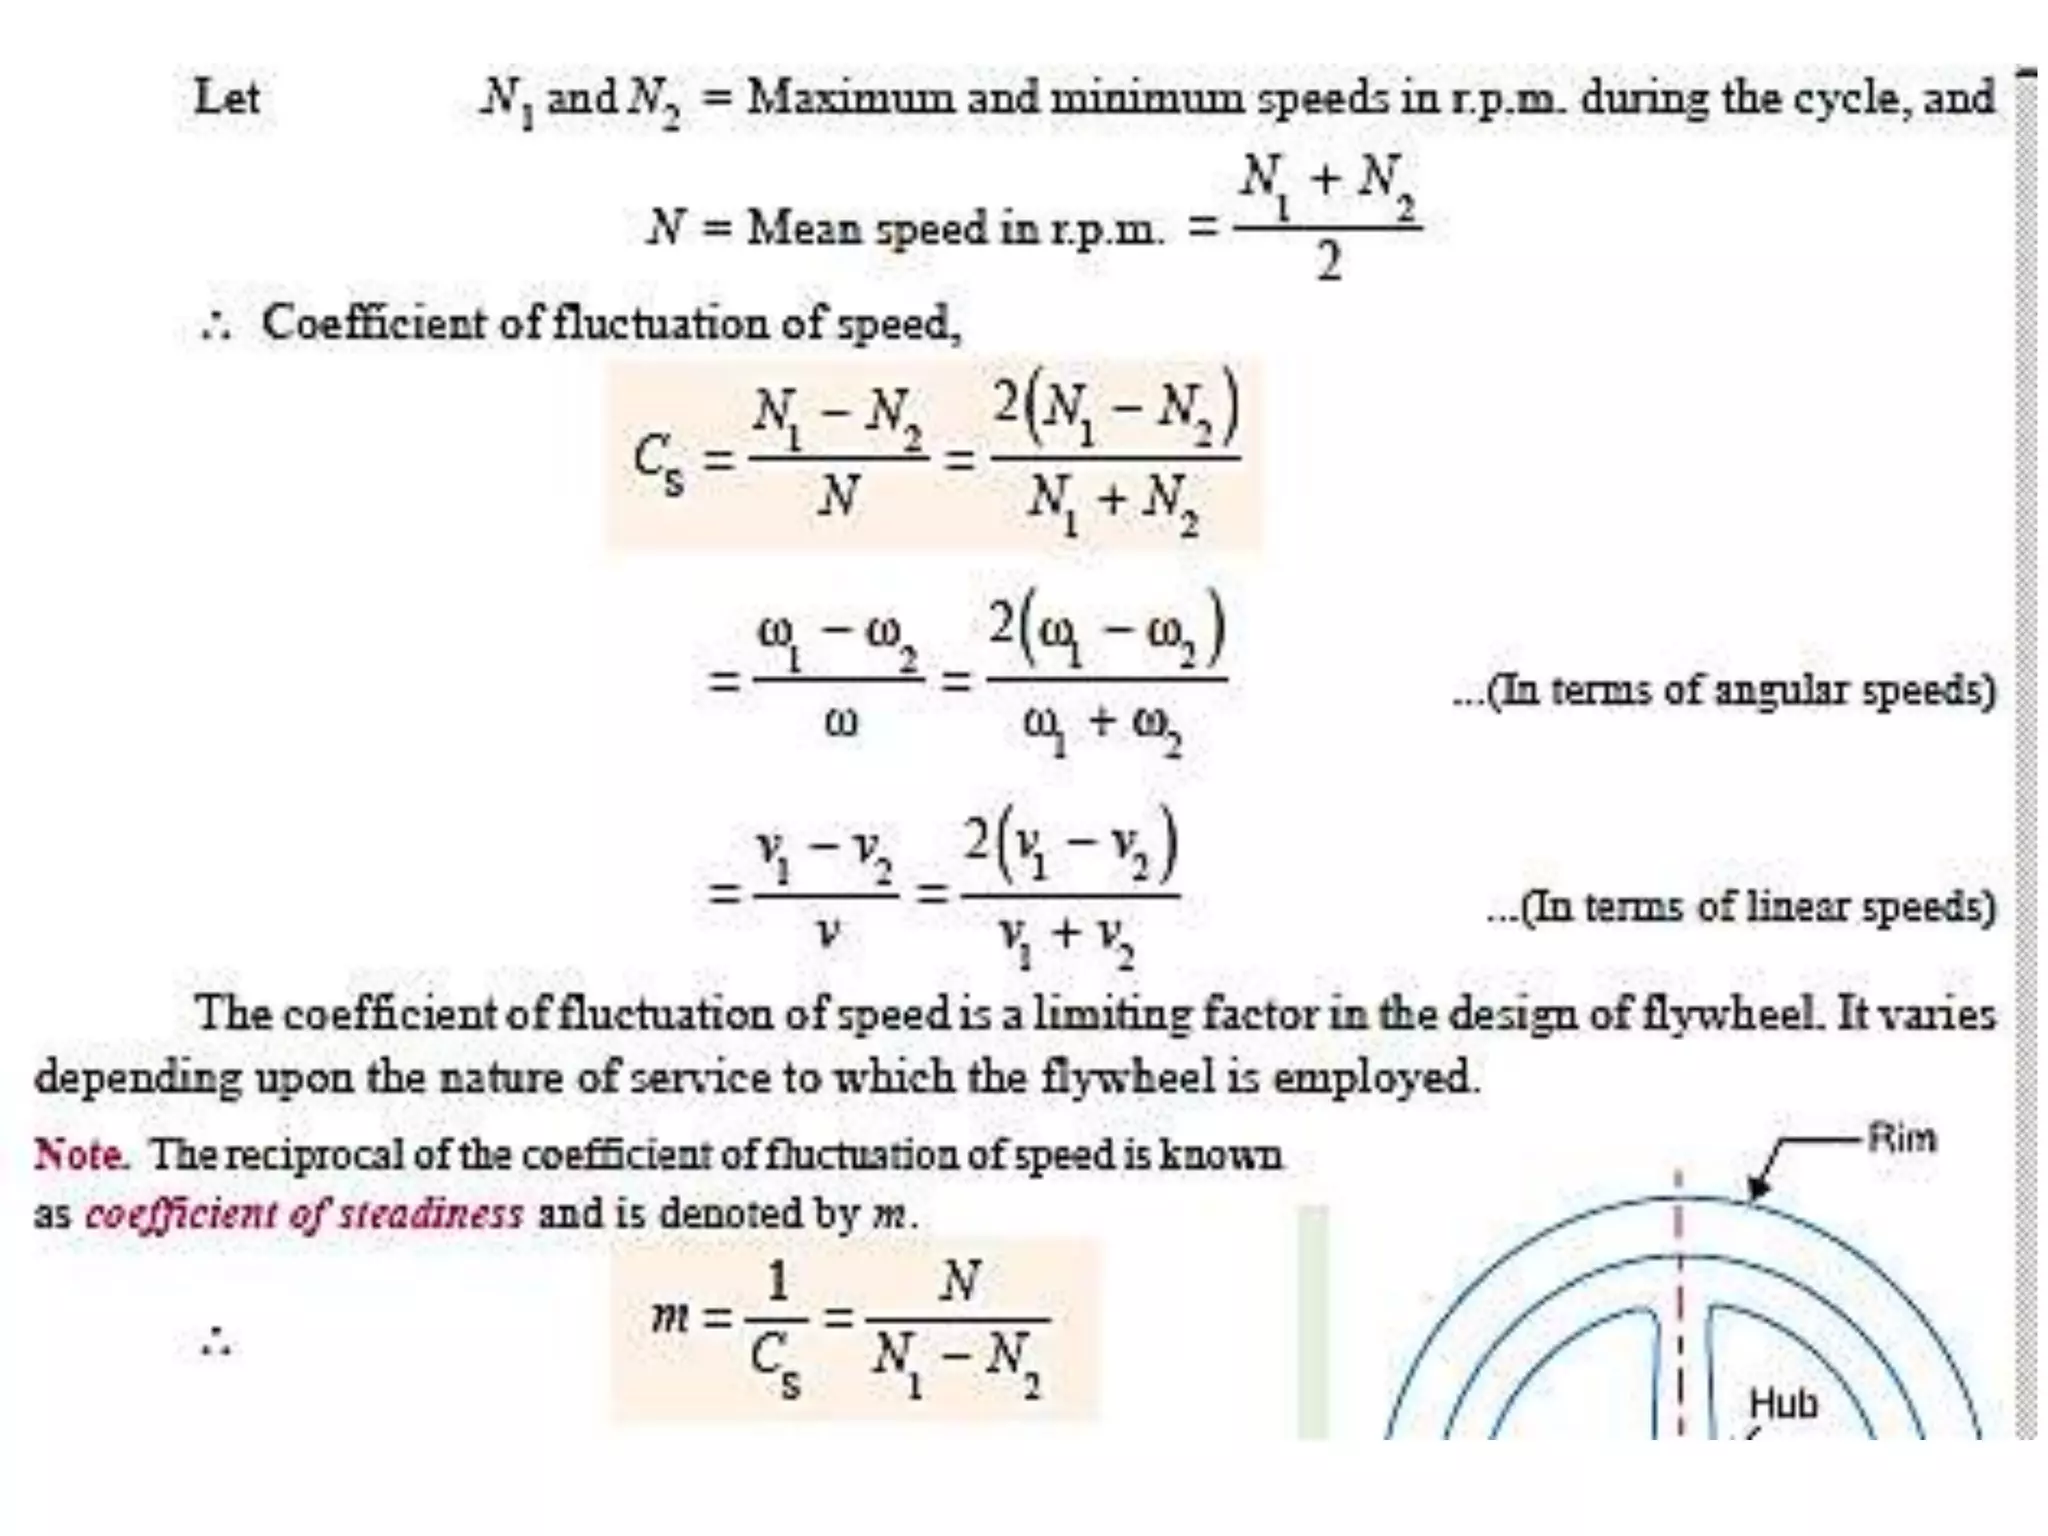
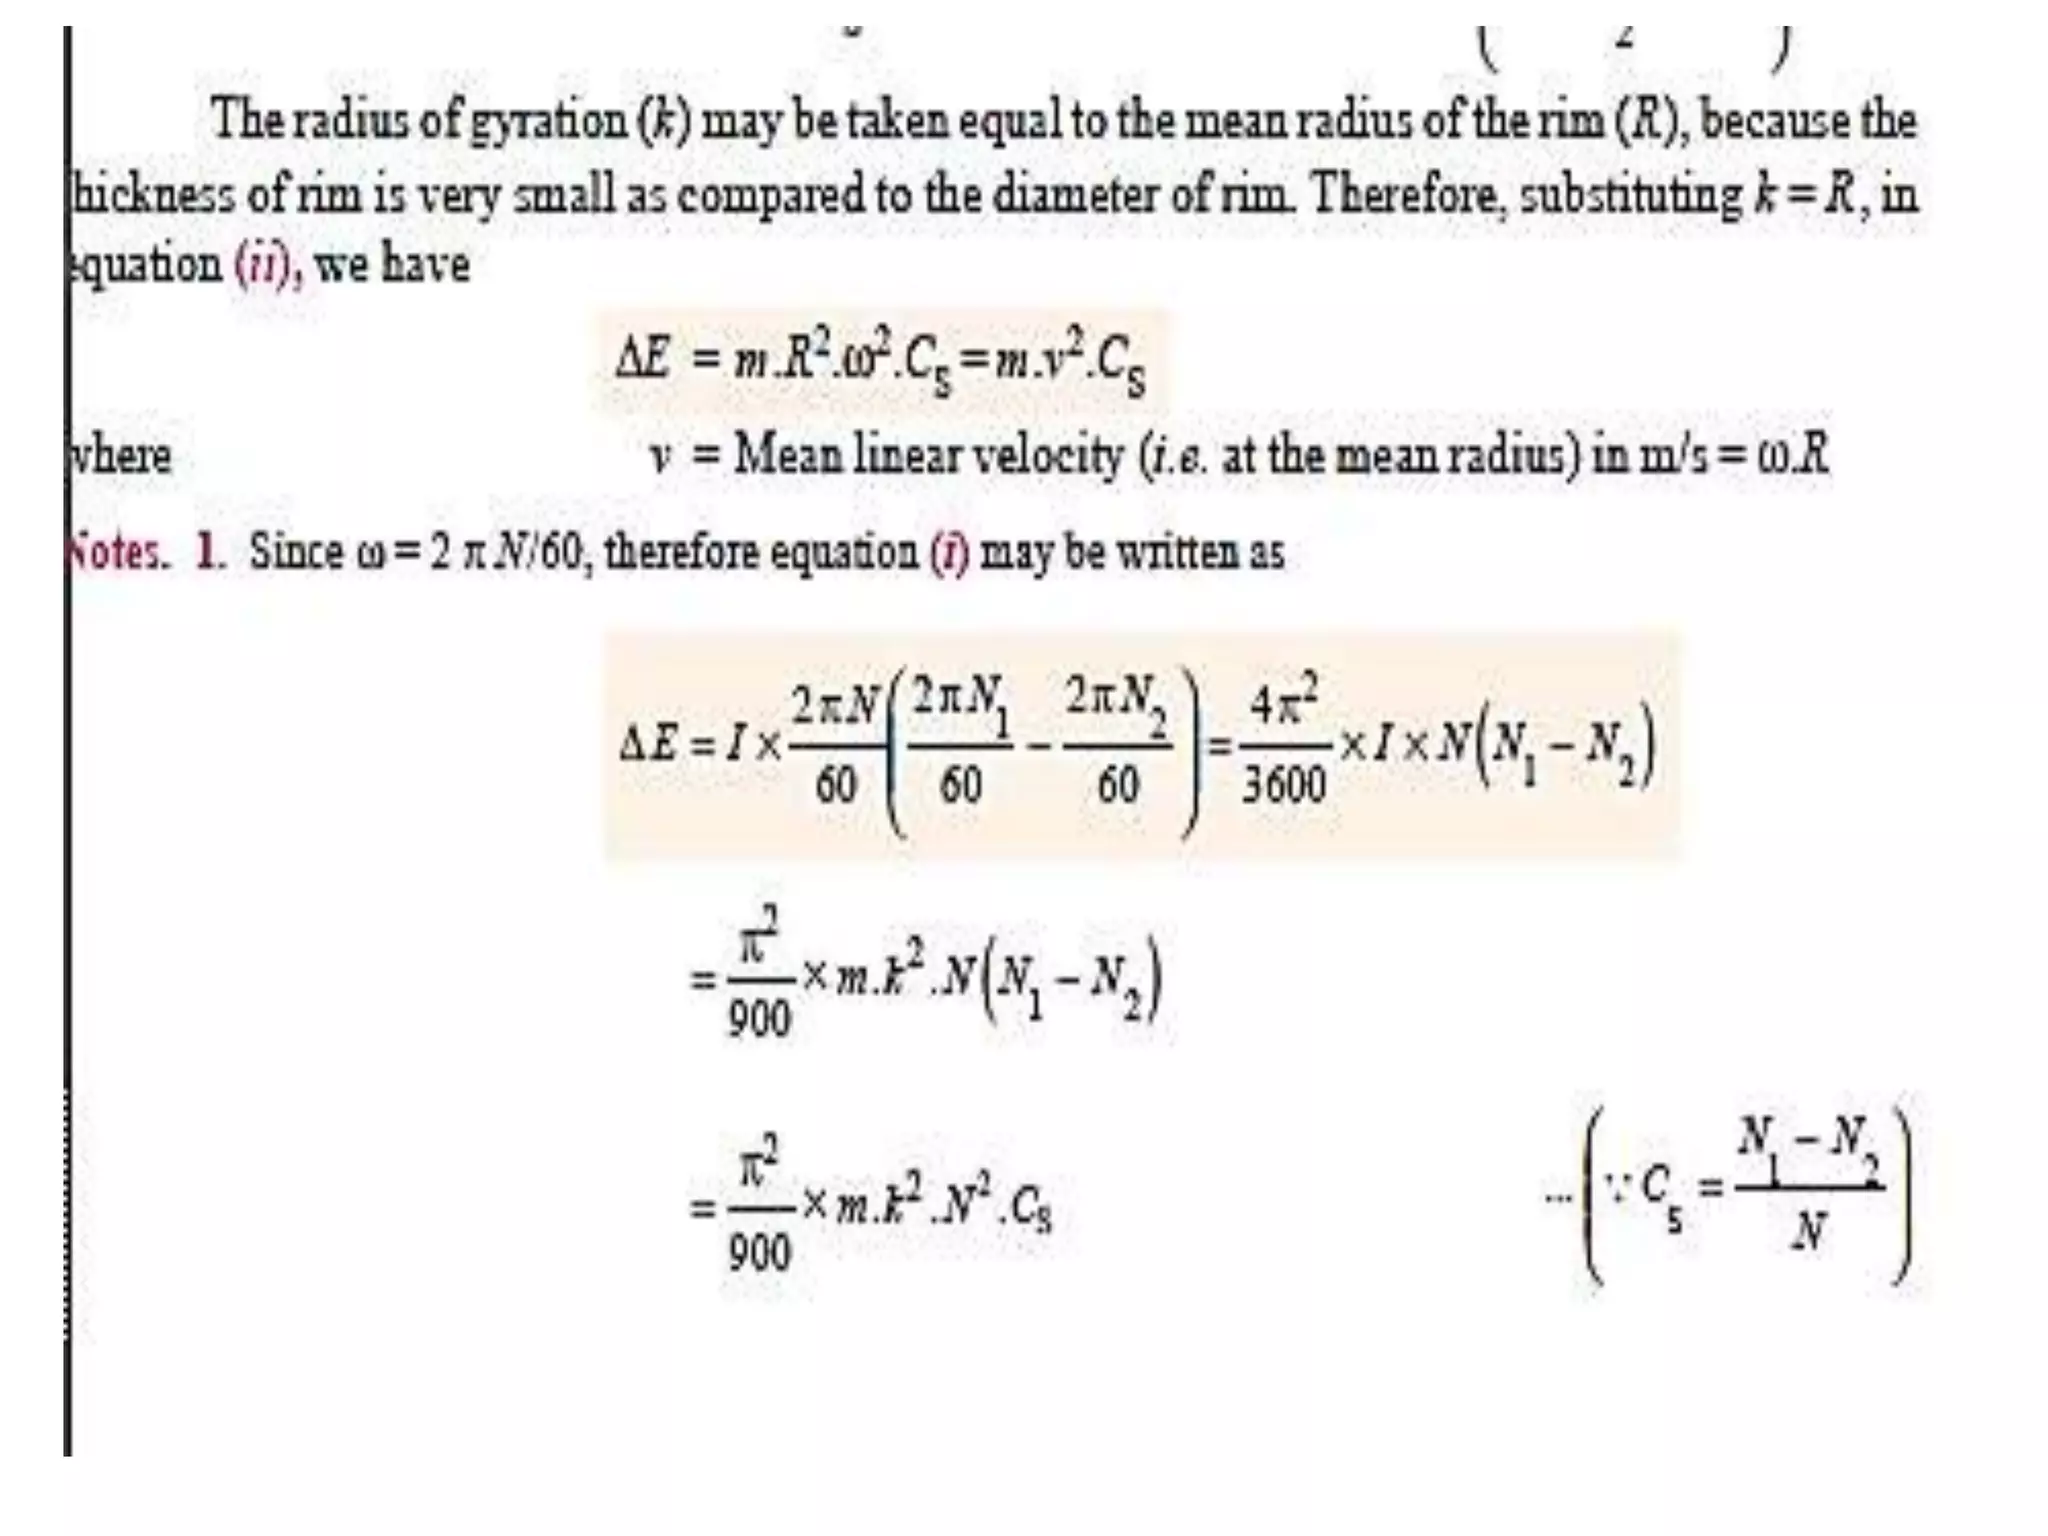
TURNING MOMENT DIAGRAMS
AND FLYWHEEL
INTRODUCTION
• The turning moment diagram also known as
crank effort diagram
• The turning moment diagram is the graphical
representation of the turning moment or
crank effort for various positions of crank
• It is plotted on Cartesian coordinates ,in which
the turning moment is taken as the ordinate
and crank .
•The vertical
ordinate
represents the
turning moment
and
• the horizontal
ordinate
represents the
crank angle
• The turning moment on the crankshaft,
• where
• we see
that the turning moment ( T ) is zero, when
the
crank angle (θ) is zero. It is maximum when
the crank angle is 90° and it is again zero when
crank angle is 180°.
• This is shown by the curve abc in
Fig. and it represents the turning moment
diagram for outstroke.
• The curve instroke cde is the turning
moment diagram for
• the work done is the product
of the turning moment and the angle turned,
therefore the area of the turning moment
diagram represents the work done per
revolution.
• The height of the ordinate a A represents the
mean height of the turning moment diagram.
• Since it is assumed that the work done by
the turning moment per revolution is equal
to the work done against the mean resisting
torque,
• therefore the area of the rectangle
aAFe is proportional to the work done against
For flywheel
• Notes: 1. When the turning moment is
positive ,the crankshaft accelerates and the
work is done by the steam.
• 2. When the turning moment is negative ,the
crankshaft retards and the work is done on
the steam.
• 3. Then accelerating torque on the rotating
parts of the engine
= T – Tmean
• We know that in a four stroke cycle internal combustion
engine, there is one working stroke after the crank has turned
through two revolutions, i.e. 720° (or 4 π radians).
• Since the pressure inside the engine cylinder is less than the
atmospheric pressure during
the suction stroke, therefore a negative loop is formed as
shown in Fig.
• During the compression stroke, the work is done on the
gases, therefore a higher negative loop is obtained.
• During the expansion or working stroke, the fuel burns and
the gases expand, therefore a large positive loop is obtained.
In this stroke, the work is done by the gases
• During exhaust stroke, the work is done on the gases,
therefore a negative loop is formed. It may be noted that the
effect of the inertia forces on the piston is taken into account
• diagram for a compound steam engine having
three cylinders ,and the resultant turning
moment diagram is shown in Fig.
• It may be noted that the first cylinder is the
high pressure cylinder, second cylinder is the
intermediate cylinder and the third cylinder is
the low pressure cylinder.
• The cranks, in case of three cylinders, are
usually placed at 120° to each other.
The variations of energy above and below the
mean resisting torque line are called
fluctuations of energy.
Maximum fluctuation of energy:-
The difference between the maximum and the
minimum energies is known as maximum
fluctuation of energy.
• A turning moment diagram for a multi-
cylinder engine is shown by a wavy curve
• The horizontal line A G represents the mean
torque line, let a1,a3,a5 represents above the
mean torque line and a2,a4,a6 be the below
the torque line, Let the energy in the flywheel
at A = E,
• It may be defined as the ratio of the
maximum fluctuation of energy to the work
done per cycle.
Mathematically,
•The work done per cycle (in N-m or joules)
may be obtained by using the following two
relations :
•A flywheel used in machines serves as a reservoir
•which stores energy during the period
when the supply of energy is more than the requirement,
•, and releases it during the period when the requirement of
energy is more than the supply.
•. A little consideration will show that when the flywheel absorbs
energy, its speed increases and when it releases energy, the speed
decreases. Hence a flywheel does not maintain a constant speed, it
simply reduces the fluctuation of speed.
•In other words, a flywheel controls the speed variations caused
by the fluctuation of the engine turning moment during each
cycle of operation.
• The difference between the maximum and
minimum speeds during a cycle is called the
maximum fluctuation of speed.
• The ratio of the maximum fluctuation of
speed to the mean speed is called the
coefficient of fluctuation of speed.
that when a flywheel absorbs energy, its
speed increases and when it gives up
energy, its speed decreases.
Let
m = Mass of the flywheel in kg,
k = Radius of gyration of the
flywheel in metres,
I = Mass moment of inertia of the flywheel
about its axis of rotation in kg-m2 = m. k 2,
N and N = Maximum and minimum
speeds during the cycle in r.p.m.,
Thank You

Turning Moment Diagram and Flywheel (TOM)

  • 1.
  • 2.
    INTRODUCTION • The turningmoment diagram also known as crank effort diagram • The turning moment diagram is the graphical representation of the turning moment or crank effort for various positions of crank • It is plotted on Cartesian coordinates ,in which the turning moment is taken as the ordinate and crank .
  • 3.
    •The vertical ordinate represents the turningmoment and • the horizontal ordinate represents the crank angle
  • 4.
    • The turningmoment on the crankshaft, • where
  • 5.
    • we see thatthe turning moment ( T ) is zero, when the crank angle (θ) is zero. It is maximum when the crank angle is 90° and it is again zero when crank angle is 180°. • This is shown by the curve abc in Fig. and it represents the turning moment diagram for outstroke.
  • 6.
    • The curveinstroke cde is the turning moment diagram for • the work done is the product of the turning moment and the angle turned, therefore the area of the turning moment diagram represents the work done per revolution.
  • 7.
    • The heightof the ordinate a A represents the mean height of the turning moment diagram. • Since it is assumed that the work done by the turning moment per revolution is equal to the work done against the mean resisting torque, • therefore the area of the rectangle aAFe is proportional to the work done against For flywheel
  • 8.
    • Notes: 1.When the turning moment is positive ,the crankshaft accelerates and the work is done by the steam. • 2. When the turning moment is negative ,the crankshaft retards and the work is done on the steam. • 3. Then accelerating torque on the rotating parts of the engine = T – Tmean
  • 10.
    • We knowthat in a four stroke cycle internal combustion engine, there is one working stroke after the crank has turned through two revolutions, i.e. 720° (or 4 π radians). • Since the pressure inside the engine cylinder is less than the atmospheric pressure during the suction stroke, therefore a negative loop is formed as shown in Fig. • During the compression stroke, the work is done on the gases, therefore a higher negative loop is obtained. • During the expansion or working stroke, the fuel burns and the gases expand, therefore a large positive loop is obtained. In this stroke, the work is done by the gases • During exhaust stroke, the work is done on the gases, therefore a negative loop is formed. It may be noted that the effect of the inertia forces on the piston is taken into account
  • 12.
    • diagram fora compound steam engine having three cylinders ,and the resultant turning moment diagram is shown in Fig. • It may be noted that the first cylinder is the high pressure cylinder, second cylinder is the intermediate cylinder and the third cylinder is the low pressure cylinder. • The cranks, in case of three cylinders, are usually placed at 120° to each other.
  • 13.
    The variations ofenergy above and below the mean resisting torque line are called fluctuations of energy. Maximum fluctuation of energy:- The difference between the maximum and the minimum energies is known as maximum fluctuation of energy.
  • 15.
    • A turningmoment diagram for a multi- cylinder engine is shown by a wavy curve • The horizontal line A G represents the mean torque line, let a1,a3,a5 represents above the mean torque line and a2,a4,a6 be the below the torque line, Let the energy in the flywheel at A = E,
  • 17.
    • It maybe defined as the ratio of the maximum fluctuation of energy to the work done per cycle. Mathematically,
  • 18.
    •The work doneper cycle (in N-m or joules) may be obtained by using the following two relations :
  • 19.
    •A flywheel usedin machines serves as a reservoir •which stores energy during the period when the supply of energy is more than the requirement, •, and releases it during the period when the requirement of energy is more than the supply. •. A little consideration will show that when the flywheel absorbs energy, its speed increases and when it releases energy, the speed decreases. Hence a flywheel does not maintain a constant speed, it simply reduces the fluctuation of speed. •In other words, a flywheel controls the speed variations caused by the fluctuation of the engine turning moment during each cycle of operation.
  • 20.
    • The differencebetween the maximum and minimum speeds during a cycle is called the maximum fluctuation of speed. • The ratio of the maximum fluctuation of speed to the mean speed is called the coefficient of fluctuation of speed.
  • 22.
    that when aflywheel absorbs energy, its speed increases and when it gives up energy, its speed decreases. Let m = Mass of the flywheel in kg, k = Radius of gyration of the flywheel in metres, I = Mass moment of inertia of the flywheel about its axis of rotation in kg-m2 = m. k 2, N and N = Maximum and minimum speeds during the cycle in r.p.m.,
  • 25.