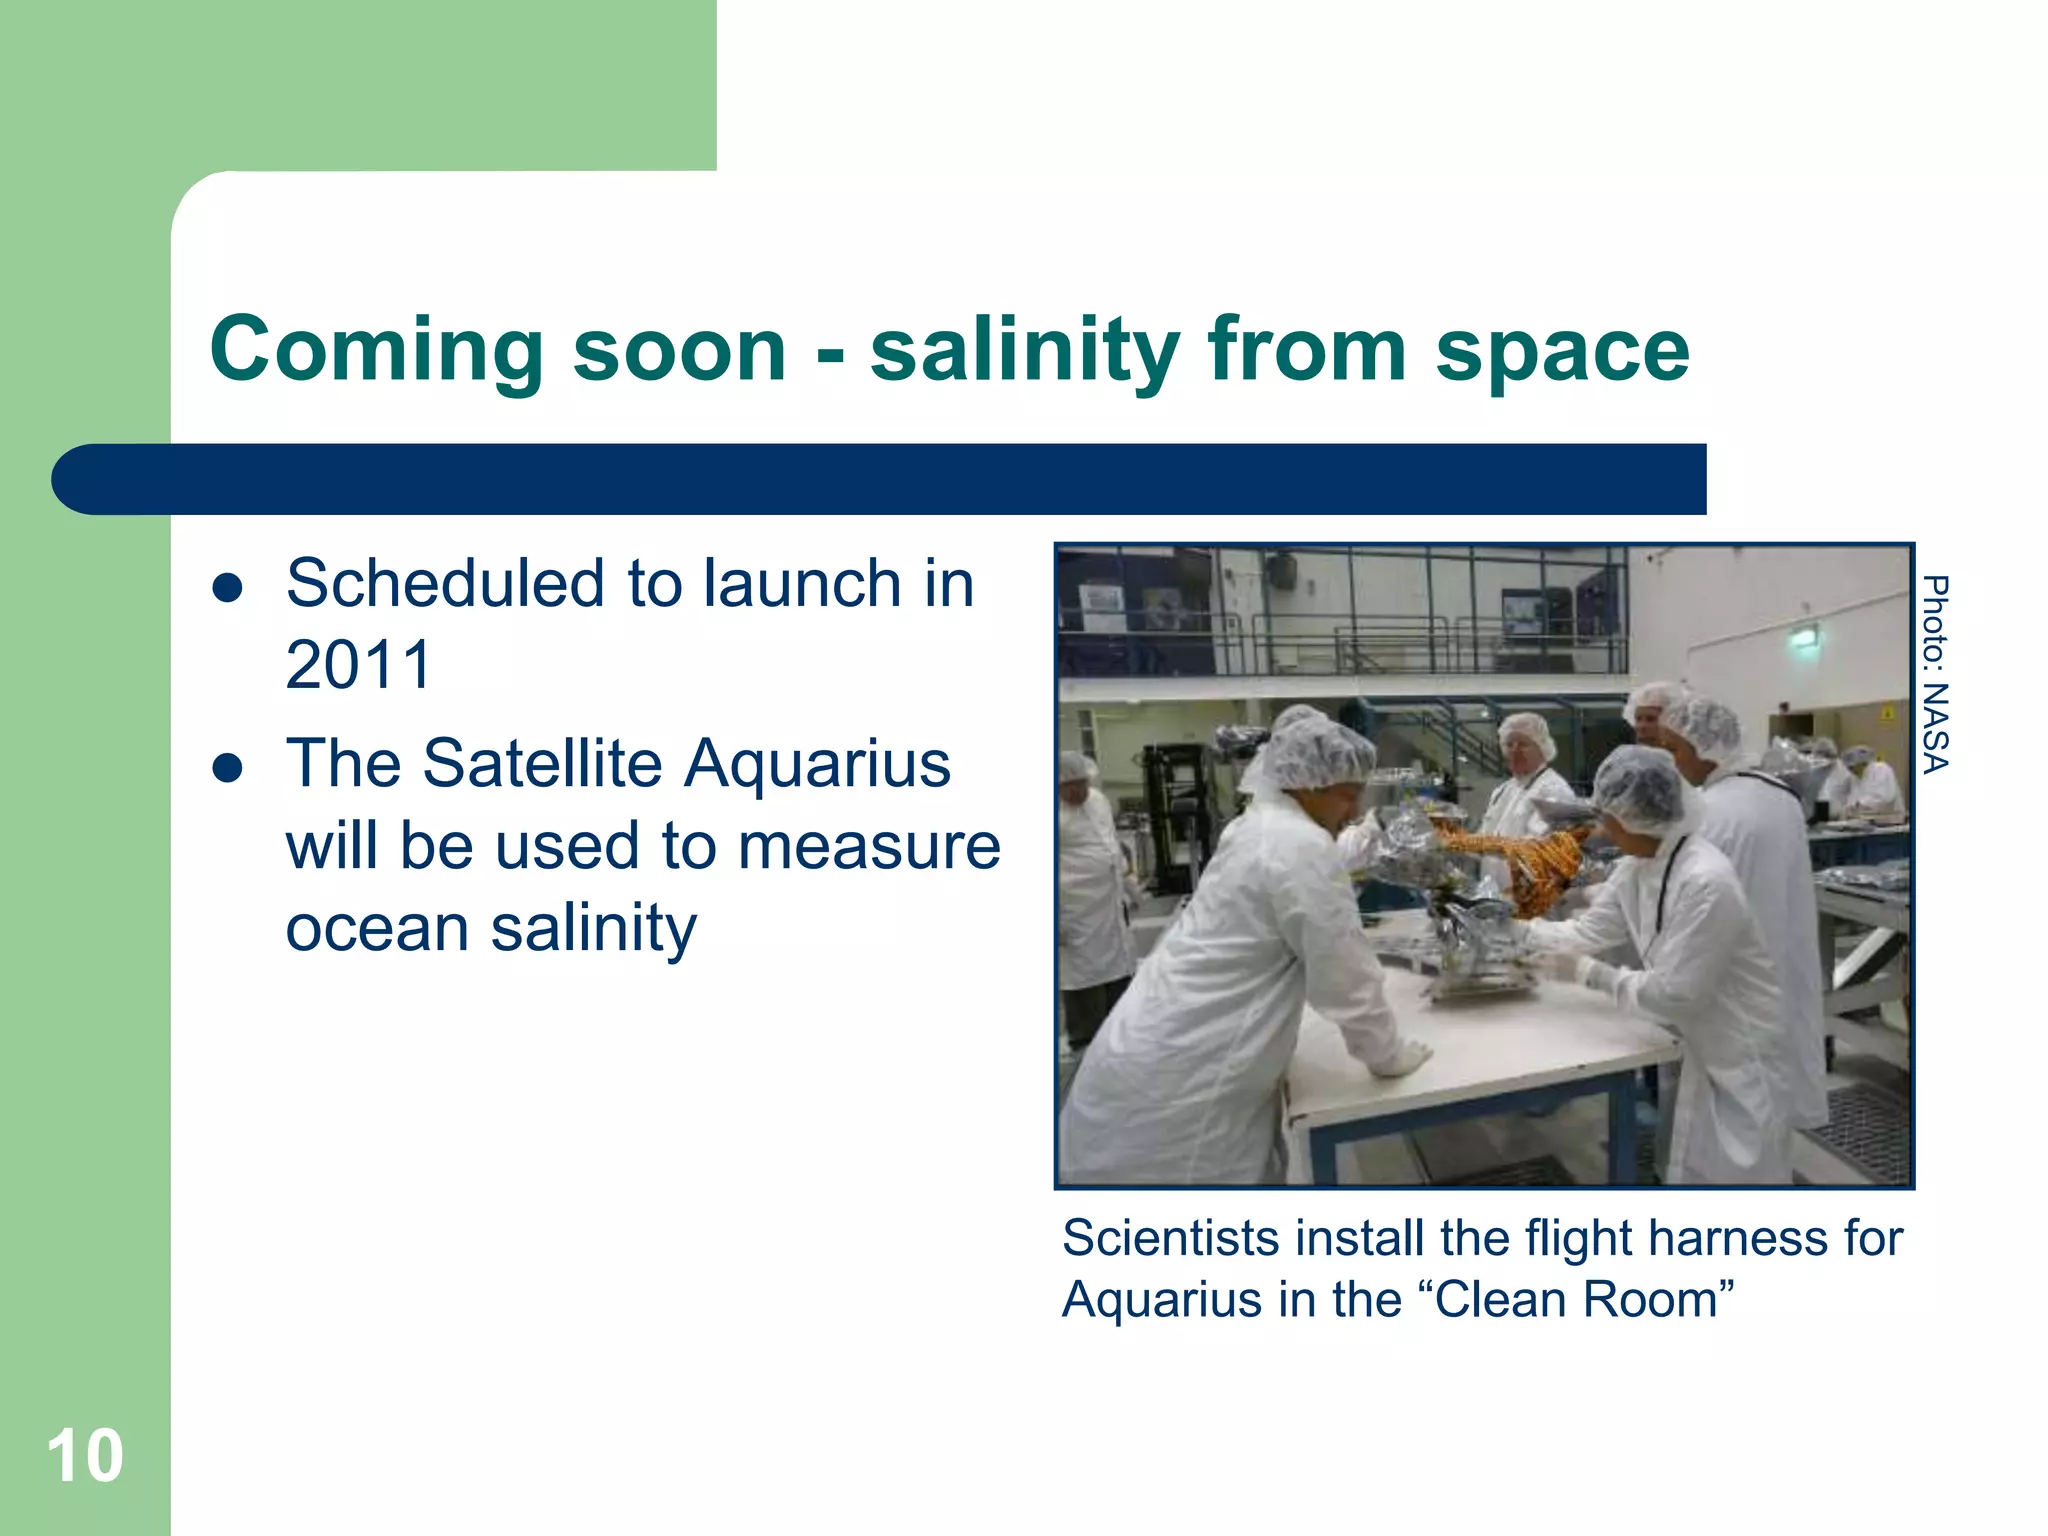
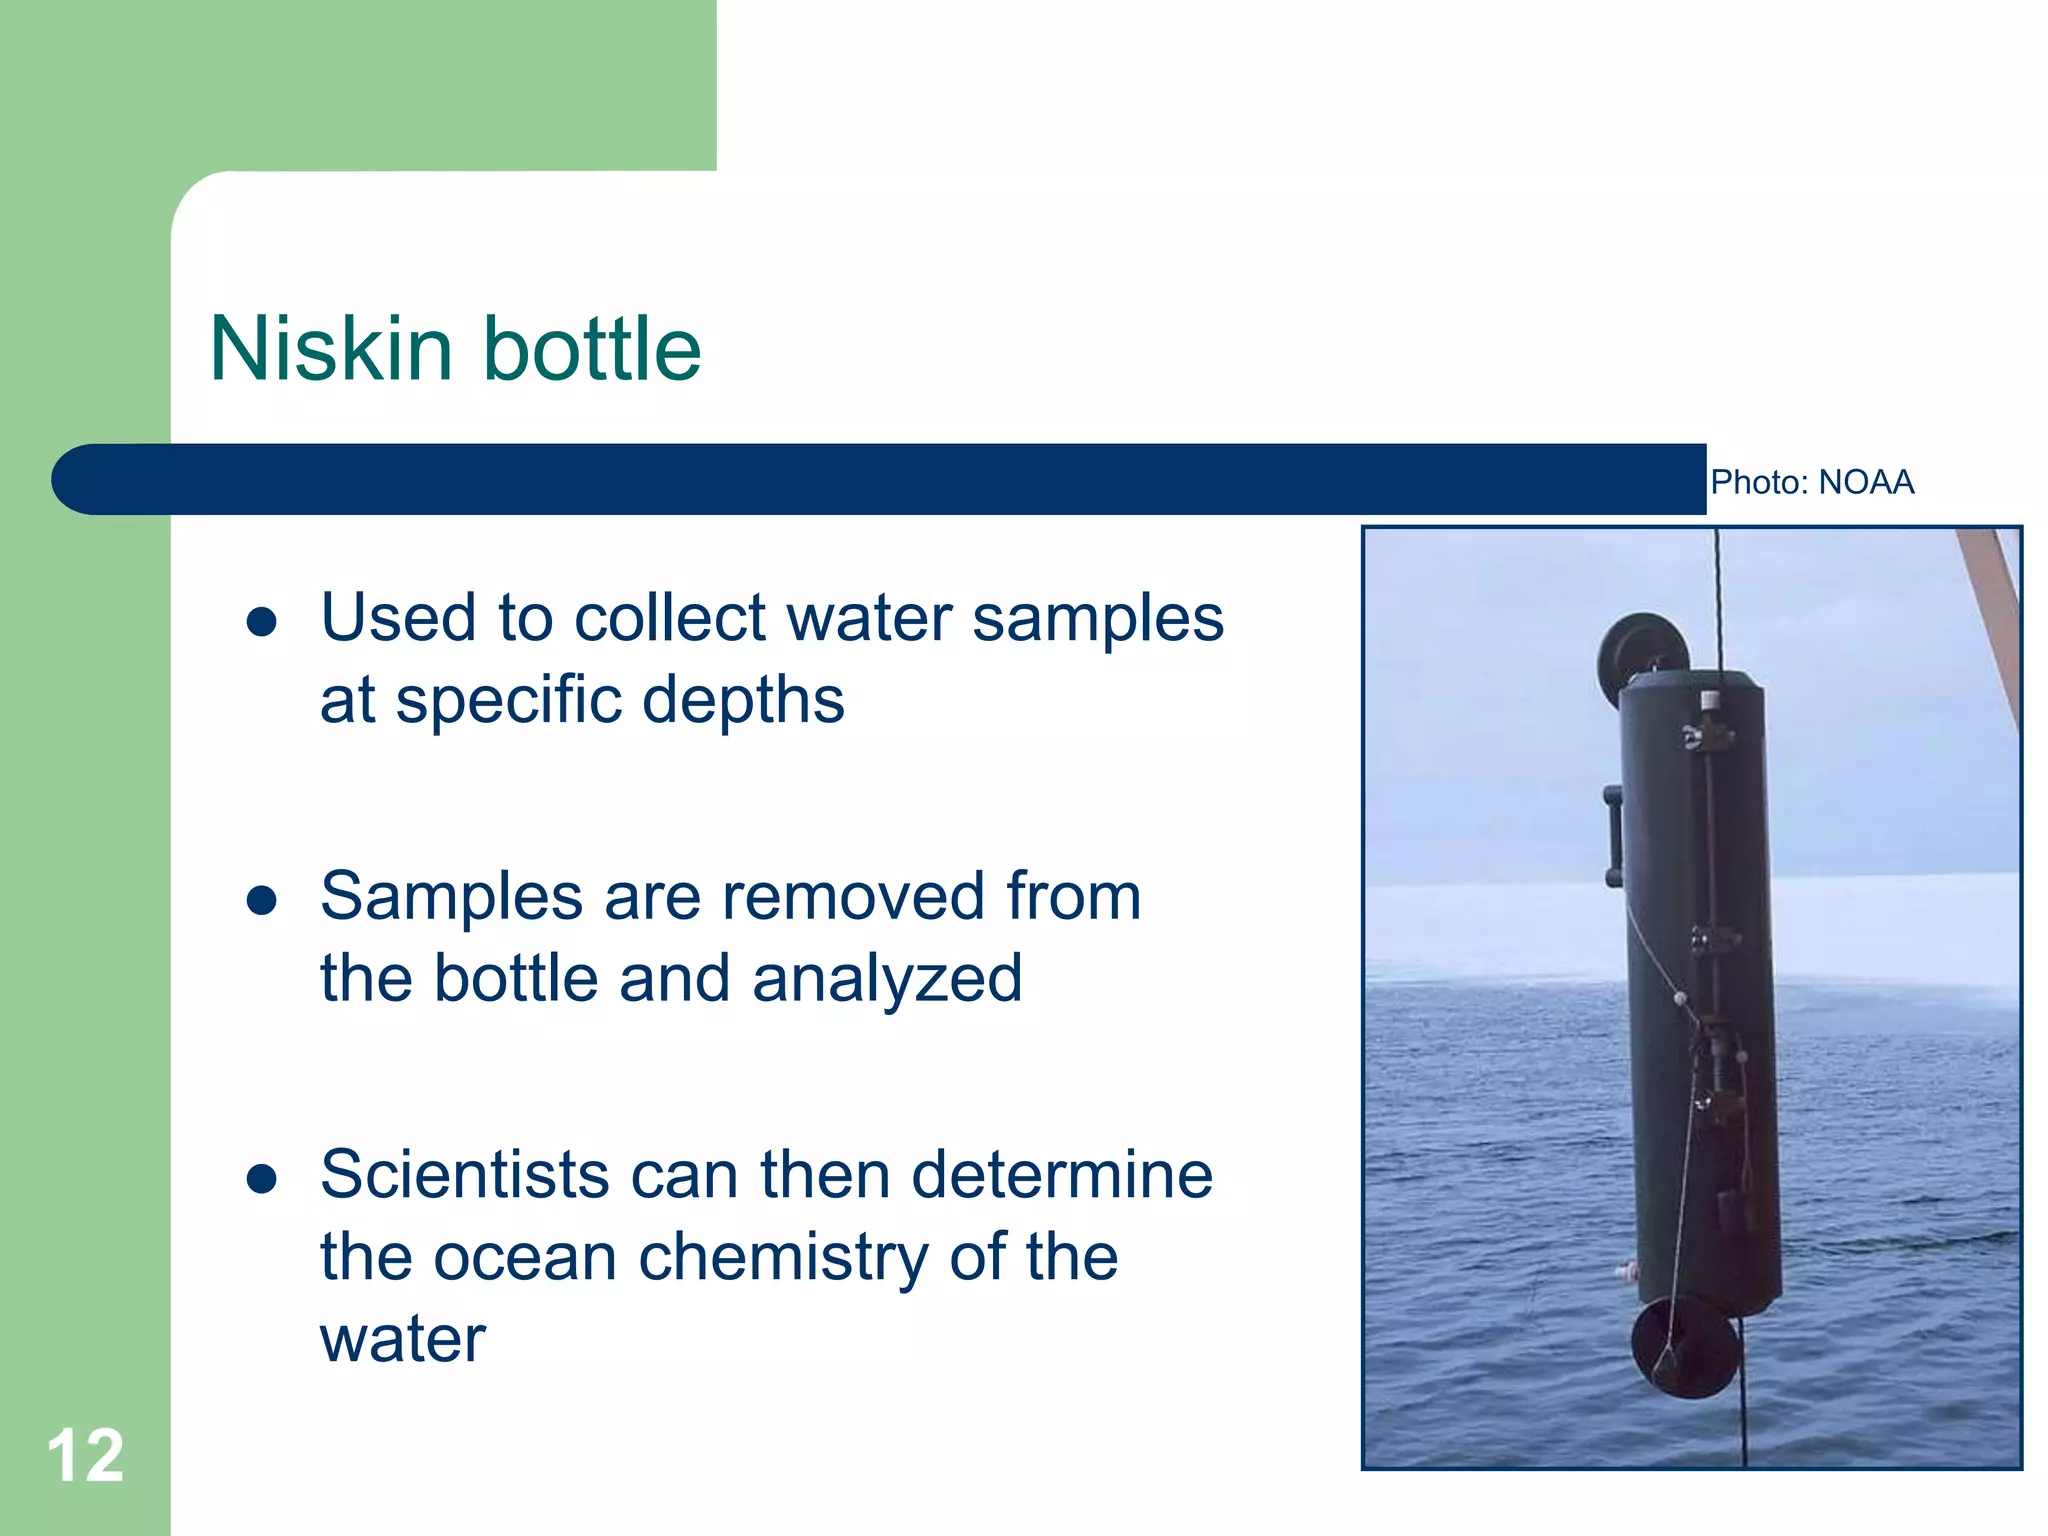
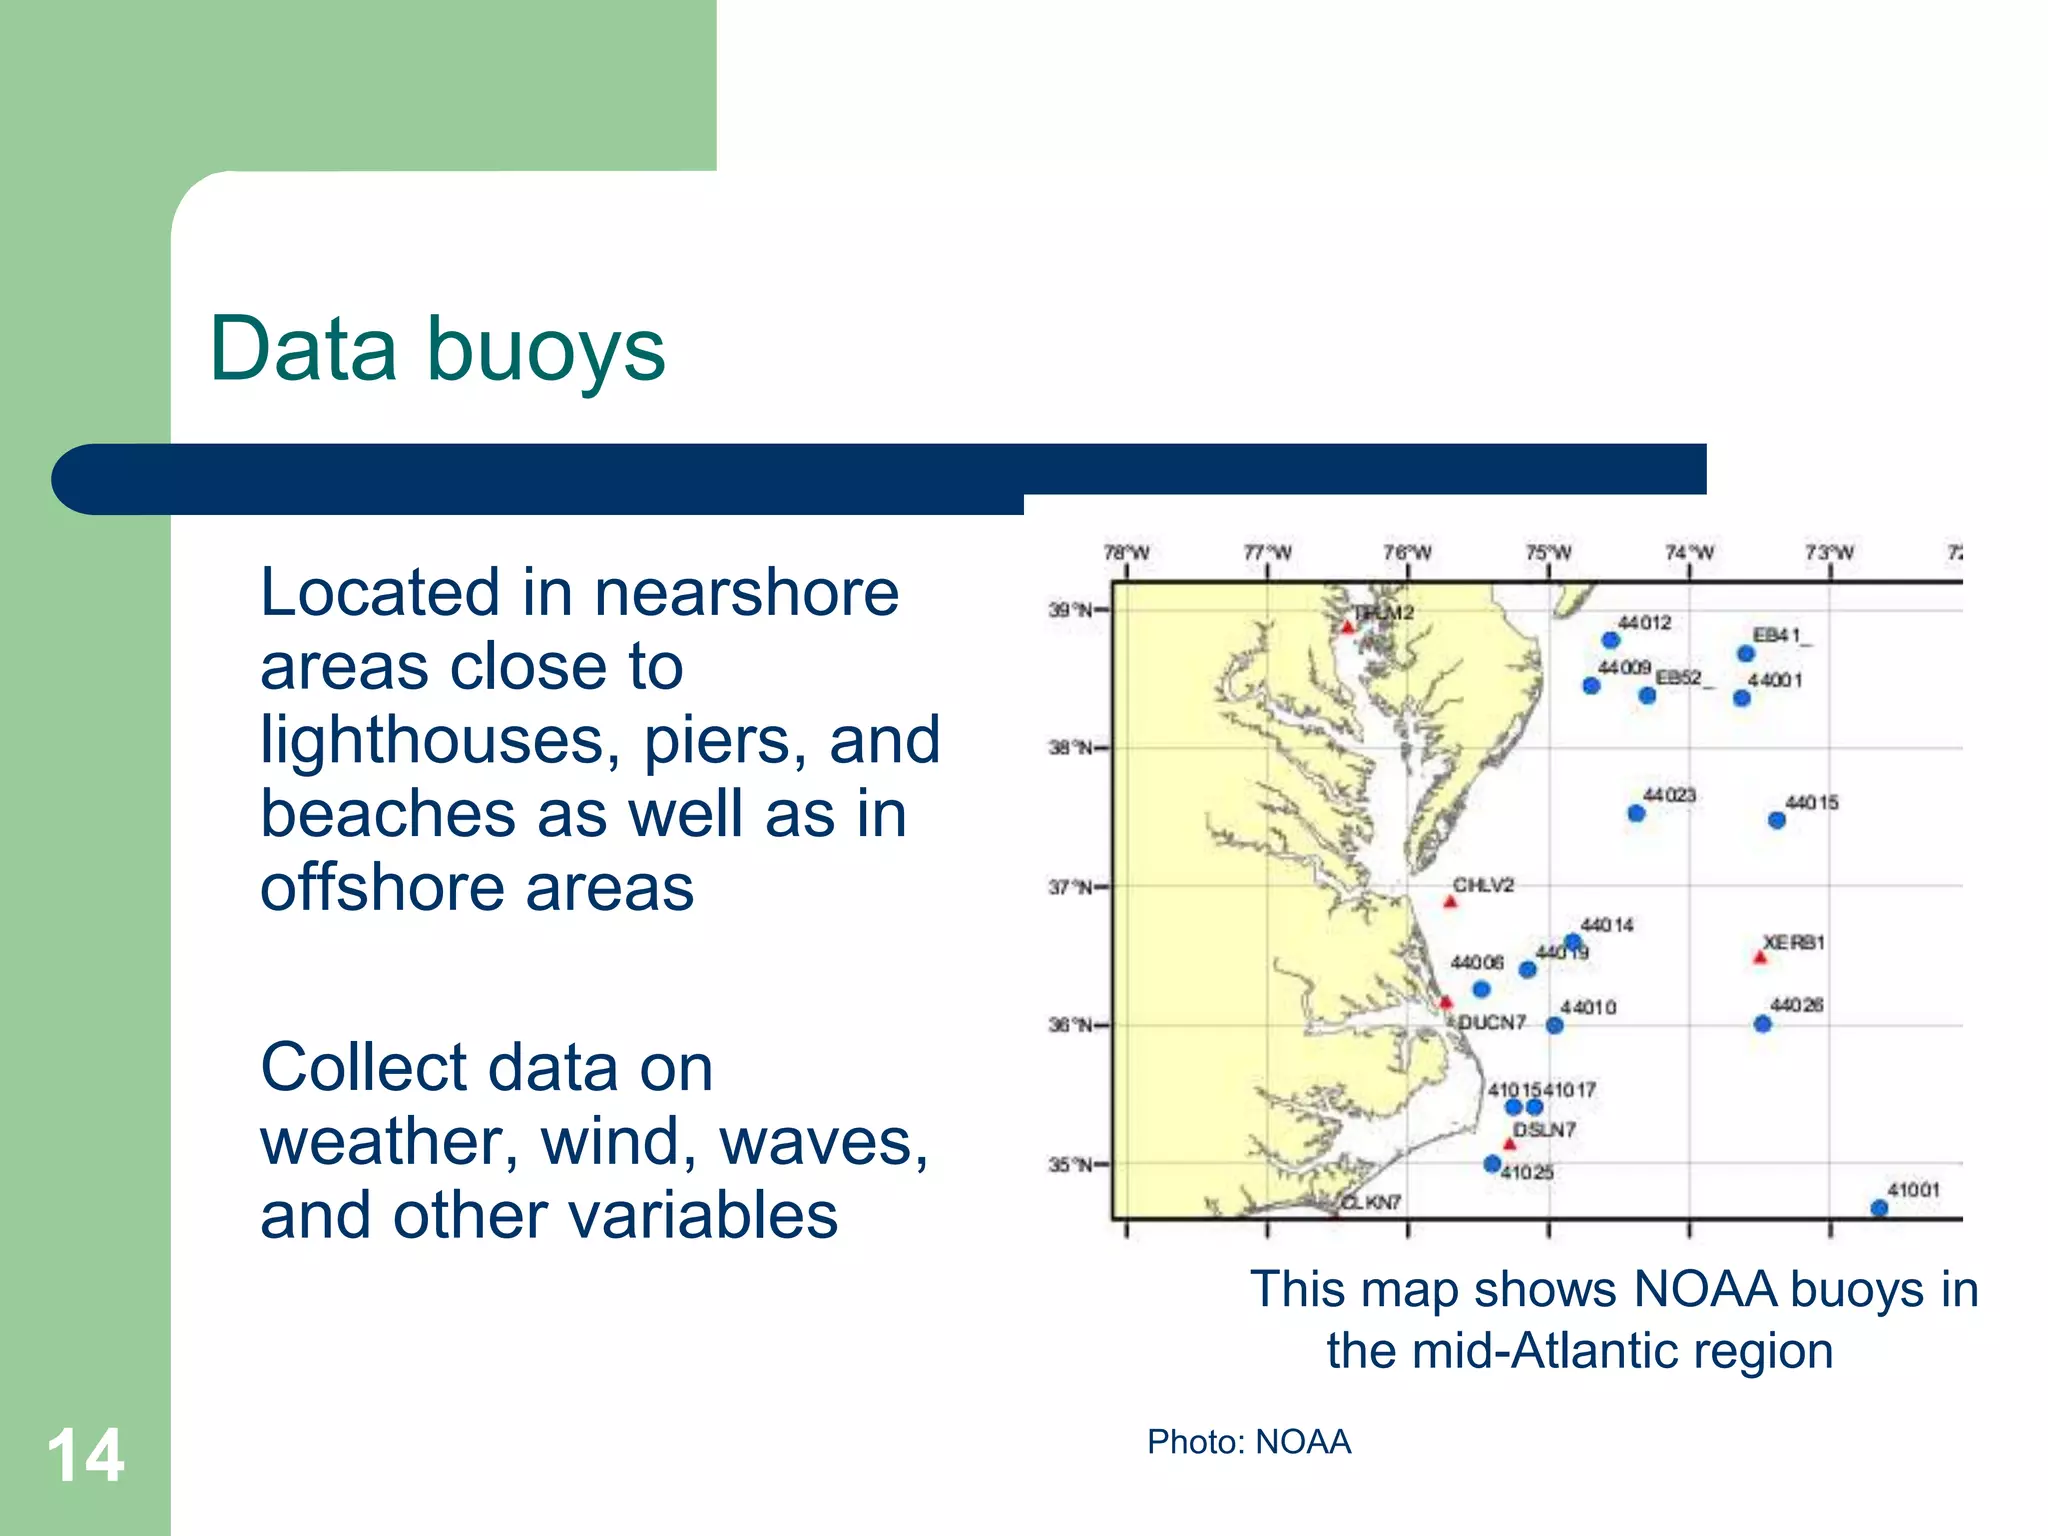
Lesson 12:
Technology I
Technology matters
Most of the topics we’ve learned so far rely
on measurement and observation:
– Ocean acidification
– Salinity
– Currents
– Wind speed and direction
– Sea surface temperature
2
Technology matters
 Scientists use many instruments for these
measurements and observations
 Today we’ll learn about:
– Satellites
– CTD & sonde
– Buoys
– Drifters
– Niskin bottle
3
Different types of satellites
 Polar-Orbiting Operational Environmental Satellite (POES)
– Orbit from pole to pole about 14.1 times per day
– Key for providing weather forecasts
 Geostationary Operational Environmental Satellites (GOES)
– Match Earth’s rotational speed so that they appear to hover over
a single, fixed spot on Earth
– Key for predicting and monitoring storms (e.g., hurricanes)
 Satellites capture visible imagery and can be used to measure sea
surface temperature, sea surface height, presence of chlorophyll
and wind patterns
4
Image from a GOES Satellite
 These Earth-orbiting spacecraft can monitor:
– Hurricanes and tropical storms
– Sea surface temperature
– Salinity
– Phytoplankton blooms
This photo of
Tropical Storm
Ida was taken
by a NOAA
Satellite on
11/9/09
5
Satellites are also used to study climate
change and sea-level rise
 Just as the land surface has hills and valleys,
so does the ocean surface
 Ocean surface topography refers to the
overall shape of the sea surface
– Scientists use satellites to measure sea surface
heights on a global scale and study ocean surface
topography
– Data on sea surface topography help scientists
study and model ocean circulation, climate
change, hurricanes and sea-level rise
6
Recent missions to measure ocean
surface topography from space
 Topex/Poseidon: Joint U.S./French mission
(1992 – 2005)
 Jason-1: Joint U.S./French mission
launched 2001, Still in operation (April 2011)
 Ocean Surface Topography Mission
(OSTM)/Jason-2: Joint U.S./French mission
launched in 2008; Still in operation (April
2011)
7
Estimates of sea level rise 1992 - 2010
(using data from Jason 2 satellite and its predecessors)
•Based on this image, how much is sea level rising off the U.S. east coast on
average per year?
• 2-3 mm/yr
8
Ocean color can also be measured from
space
 Instruments aboard satellites
can measure ocean color
 Examples
– MODIS (aboard Terra & Aqua
satellites)
– SeaWiFS (aboard SeaStar
satellite)
 Ocean color can help scientists
study
– Phytoplankton (small ocean
plants)
– Global biogeochemistry
– Climate variability Phytoplankton Bloom about
size of Wisconsin in Barents
Sea
Photo: MODIS, 2007
9
Coming soon - salinity from space
 Scheduled to launch in
2011
 The Satellite Aquarius
will be used to measure
ocean salinity
Scientists install the flight harness for
Aquarius in the “Clean Room”
Photo:
NASA
10
Remote and “in situ” measurement
 So far the technology we have seen measure the
ocean remotely from space
– What do you think are the advantages of taking
measurements so far away from the ocean?
 Other devices sample the ocean “in situ” or in the
actual ocean
– What do you think are the advantages of in situ
measurement?
 Both measurement types have advantages and they
are often used to complement one another
11
Niskin bottle
 Used to collect water samples
at specific depths
 Samples are removed from
the bottle and analyzed
 Scientists can then determine
the ocean chemistry of the
water
Photo: NOAA
12
CTD
 A CTD measures
Conductivity, Temperature
and Depth, which can be used
to calculate salinity
 A CTD is typically deployed
on a frame with several Niskin
bottles for water sampling at
different depths
 The full instrument (CTD and
niskin bottles) is called a
rosette
 A sonde looks similar to a
CTD but is more complex and
can also be used to measure
pH, DO, temperature and
turbidity
CTD rosette loaded with Niskin bottles
Photo:
NOAA
13
Data buoys
Located in nearshore
areas close to
lighthouses, piers, and
beaches as well as in
offshore areas
Collect data on
weather, wind, waves,
and other variables
6-Meter Buoy prior to deployment.
Source:
NOAA
National
Data
Buoy
Center
This map shows NOAA buoys in
the mid-Atlantic region
Photo: NOAA
14
DART: NOAA’s U.S. tsunami warning
system
Deep ocean
Assessment and
Reporting of
Tsunamis
A network of buoys
provides NOAA
researchers with data
about tsunamis that
could possibly impact
the U.S., its territories
and other areas of the
world
NOAA DART buoy locations
Photo:
NOAA
15
Drifters
 Simple device suspended a few
feet below the water surface,
attached to 4 small floats
 Measures current data, which is
sent to a polar satellite and then
relayed to a monitoring station
 They can be used to study wind,
temperature, pressure, ocean
color, salinity, and plankton
Photo: NOAA
Shallow-water drifters float on the
surface and are carried through
currents by their blue “sails”
16
Technology in action
In today’s student activity, we will look at
ocean temperature data to identify the
presence of hydrothermal vent communities
17

noaa_16266_DS4.ppt

  • 1.
  • 2.
    Technology matters Most ofthe topics we’ve learned so far rely on measurement and observation: – Ocean acidification – Salinity – Currents – Wind speed and direction – Sea surface temperature 2
  • 3.
    Technology matters  Scientistsuse many instruments for these measurements and observations  Today we’ll learn about: – Satellites – CTD & sonde – Buoys – Drifters – Niskin bottle 3
  • 4.
    Different types ofsatellites  Polar-Orbiting Operational Environmental Satellite (POES) – Orbit from pole to pole about 14.1 times per day – Key for providing weather forecasts  Geostationary Operational Environmental Satellites (GOES) – Match Earth’s rotational speed so that they appear to hover over a single, fixed spot on Earth – Key for predicting and monitoring storms (e.g., hurricanes)  Satellites capture visible imagery and can be used to measure sea surface temperature, sea surface height, presence of chlorophyll and wind patterns 4
  • 5.
    Image from aGOES Satellite  These Earth-orbiting spacecraft can monitor: – Hurricanes and tropical storms – Sea surface temperature – Salinity – Phytoplankton blooms This photo of Tropical Storm Ida was taken by a NOAA Satellite on 11/9/09 5
  • 6.
    Satellites are alsoused to study climate change and sea-level rise  Just as the land surface has hills and valleys, so does the ocean surface  Ocean surface topography refers to the overall shape of the sea surface – Scientists use satellites to measure sea surface heights on a global scale and study ocean surface topography – Data on sea surface topography help scientists study and model ocean circulation, climate change, hurricanes and sea-level rise 6
  • 7.
    Recent missions tomeasure ocean surface topography from space  Topex/Poseidon: Joint U.S./French mission (1992 – 2005)  Jason-1: Joint U.S./French mission launched 2001, Still in operation (April 2011)  Ocean Surface Topography Mission (OSTM)/Jason-2: Joint U.S./French mission launched in 2008; Still in operation (April 2011) 7
  • 8.
    Estimates of sealevel rise 1992 - 2010 (using data from Jason 2 satellite and its predecessors) •Based on this image, how much is sea level rising off the U.S. east coast on average per year? • 2-3 mm/yr 8
  • 9.
    Ocean color canalso be measured from space  Instruments aboard satellites can measure ocean color  Examples – MODIS (aboard Terra & Aqua satellites) – SeaWiFS (aboard SeaStar satellite)  Ocean color can help scientists study – Phytoplankton (small ocean plants) – Global biogeochemistry – Climate variability Phytoplankton Bloom about size of Wisconsin in Barents Sea Photo: MODIS, 2007 9
  • 10.
    Coming soon -salinity from space  Scheduled to launch in 2011  The Satellite Aquarius will be used to measure ocean salinity Scientists install the flight harness for Aquarius in the “Clean Room” Photo: NASA 10
  • 11.
    Remote and “insitu” measurement  So far the technology we have seen measure the ocean remotely from space – What do you think are the advantages of taking measurements so far away from the ocean?  Other devices sample the ocean “in situ” or in the actual ocean – What do you think are the advantages of in situ measurement?  Both measurement types have advantages and they are often used to complement one another 11
  • 12.
    Niskin bottle  Usedto collect water samples at specific depths  Samples are removed from the bottle and analyzed  Scientists can then determine the ocean chemistry of the water Photo: NOAA 12
  • 13.
    CTD  A CTDmeasures Conductivity, Temperature and Depth, which can be used to calculate salinity  A CTD is typically deployed on a frame with several Niskin bottles for water sampling at different depths  The full instrument (CTD and niskin bottles) is called a rosette  A sonde looks similar to a CTD but is more complex and can also be used to measure pH, DO, temperature and turbidity CTD rosette loaded with Niskin bottles Photo: NOAA 13
  • 14.
    Data buoys Located innearshore areas close to lighthouses, piers, and beaches as well as in offshore areas Collect data on weather, wind, waves, and other variables 6-Meter Buoy prior to deployment. Source: NOAA National Data Buoy Center This map shows NOAA buoys in the mid-Atlantic region Photo: NOAA 14
  • 15.
    DART: NOAA’s U.S.tsunami warning system Deep ocean Assessment and Reporting of Tsunamis A network of buoys provides NOAA researchers with data about tsunamis that could possibly impact the U.S., its territories and other areas of the world NOAA DART buoy locations Photo: NOAA 15
  • 16.
    Drifters  Simple devicesuspended a few feet below the water surface, attached to 4 small floats  Measures current data, which is sent to a polar satellite and then relayed to a monitoring station  They can be used to study wind, temperature, pressure, ocean color, salinity, and plankton Photo: NOAA Shallow-water drifters float on the surface and are carried through currents by their blue “sails” 16
  • 17.
    Technology in action Intoday’s student activity, we will look at ocean temperature data to identify the presence of hydrothermal vent communities 17