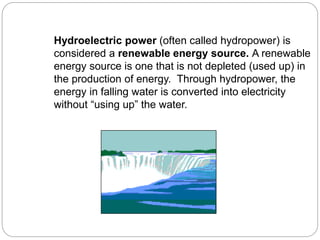
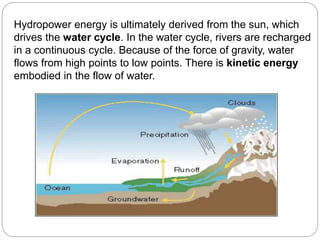
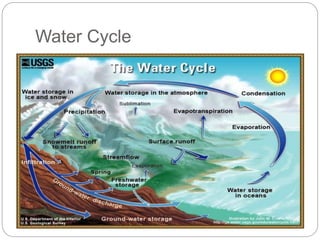
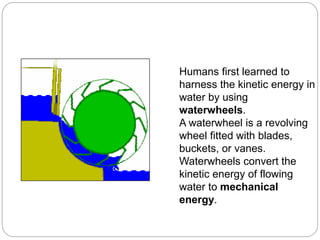
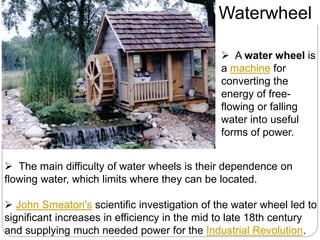
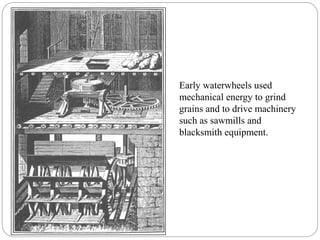
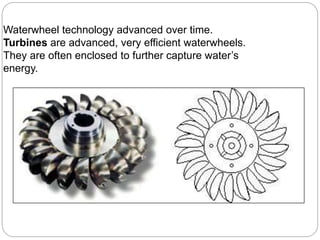
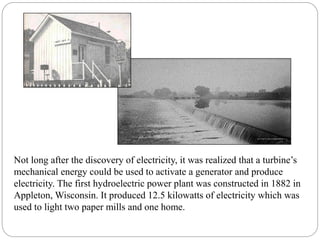
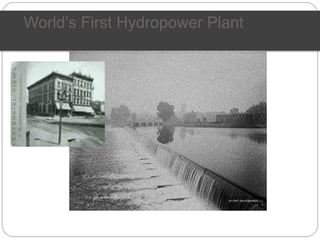
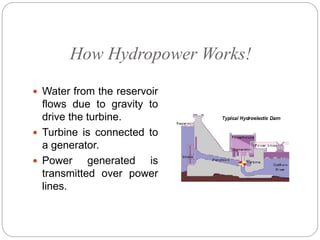
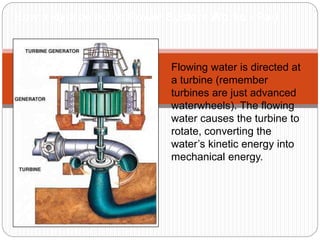
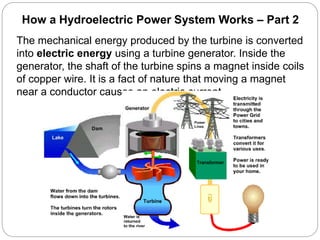
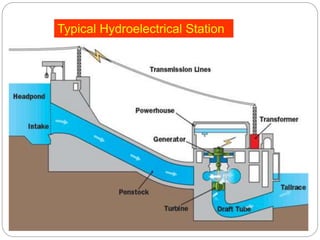
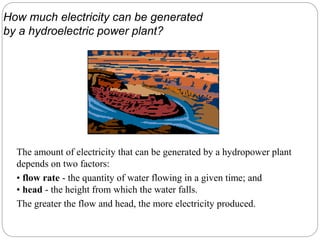
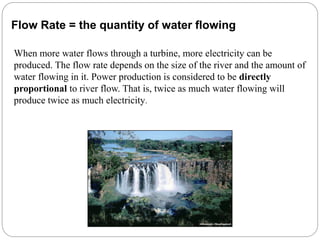
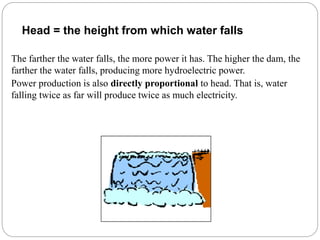
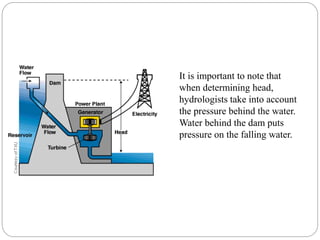
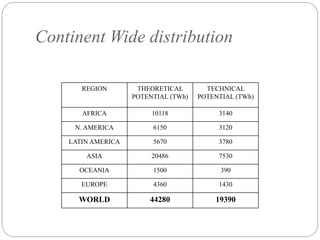
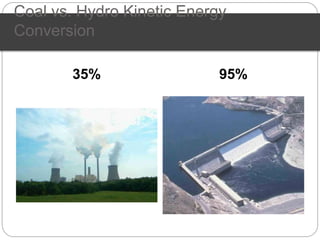
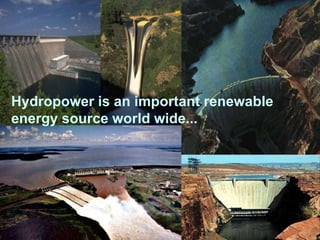
SlideShare a Scribd company logo
1 of 82
Saurabh Chinchole
141020001
Tushar Dighe Mahesh
Bachute 141020031
141020036
Sandesh Gole Anurag Shukla
151020968
141020042
Manish Jagtap
Astitva Rajput
141020012
141020041
Amol Khandait Vishal Chavan
Hydroelectric power (often called hydropower) is
considered a renewable energy source. A renewable
energy source is one that is not depleted (used up) in
the production of energy. Through hydropower, the
energy in falling water is converted into electricity
without “using up” the water.
Hydropower energy is ultimately derived from the sun, which
drives the water cycle. In the water cycle, rivers are recharged
in a continuous cycle. Because of the force of gravity, water
flows from high points to low points. There is kinetic energy
embodied in the flow of water.
Water Cycle
Humans first learned to
harness the kinetic energy in
water by using
waterwheels.
A waterwheel is a revolving
wheel fitted with blades,
buckets, or vanes.
Waterwheels convert the
kinetic energy of flowing
water to mechanical
energy.
 A water wheel is
a machine for
converting the
energy of free-
flowing or falling
water into useful
forms of power.
 The main difficulty of water wheels is their dependence on
flowing water, which limits where they can be located.
 John Smeaton's scientific investigation of the water wheel led to
significant increases in efficiency in the mid to late 18th century
and supplying much needed power for the Industrial Revolution.
Waterwheel
Early waterwheels used
mechanical energy to grind
grains and to drive machinery
such as sawmills and
blacksmith equipment.
Waterwheel technology advanced over time.
Turbines are advanced, very efficient waterwheels.
They are often enclosed to further capture water’s
energy.
Not long after the discovery of electricity, it was realized that a turbine’s
mechanical energy could be used to activate a generator and produce
electricity. The first hydroelectric power plant was constructed in 1882 in
Appleton, Wisconsin. It produced 12.5 kilowatts of electricity which was
used to light two paper mills and one home.
World’s First Hydropower Plant
How Hydropower Works!
 Water from the reservoir
flows due to gravity to
drive the turbine.
 Turbine is connected to
a generator.
 Power generated is
transmitted over power
lines.
Flowing water is directed at
a turbine (remember
turbines are just advanced
waterwheels). The flowing
water causes the turbine to
rotate, converting the
water’s kinetic energy into
mechanical energy.
How a Hydroelectric Power System Works - Part 1
The mechanical energy produced by the turbine is converted
into electric energy using a turbine generator. Inside the
generator, the shaft of the turbine spins a magnet inside coils
of copper wire. It is a fact of nature that moving a magnet
near a conductor causes an electric current.
How a Hydroelectric Power System Works – Part 2
Typical Hydroelectrical Station
Selection of site for
Dam
1. Good topographical location along the path of river.
2. Right geological structure.
3. For economy, the length of the dam should be as small as possible,
and for a given height, it should store the maximum volume of
water.
4. The general bed level at dam site should preferably be higher than
that of the river basin. This will reduce the height of the dam.
5. The value of land and property submerged by the proposed dam
should be as low as possible.
6. The dam site should be easily accessible, so that it can be
economically connected to important towns and cities.
7. Site for establishing labor colonies and a healthy environment
should be available near the site.
8. If dam is situated in an earthquake zone, its design must include
earthquake forces. The type of structure best suited to resist
earthquake shocks without danger are earthen dams and concrete
gravity dams.
Factors governing selection of turbine
Selection of turbine type and determination of
plant capacity, turbines require the detailed
information on head and possible plant
discharge be collected accurately of different
conditions.
1) High specific speed is essential where the
head is low and output is large, because
otherwise the rotational speed will be low which
means cost of turbo-generator and powerhouse
will be high. On the other hand there is
practically no need of choosing a high value of
specific speed for high installations, because
even with lo specific speed high rotational speed
2) Rotational speed depends upon specific speed.
Also the rotational speed of an electrical generator
with which the turbine is to be directly coupled
depends on the frequency and number of pair of
poles. The value of specific speed adopted should
be such that it will give the synchronous speed of
the generator.
3) The efficiency selected should be such that it
gives the highest overall efficiency of various
conditions.
Factors governing selection of turbine
The amount of electricity that can be generated by a hydropower plant
depends on two factors:
• flow rate - the quantity of water flowing in a given time; and
• head - the height from which the water falls.
The greater the flow and head, the more electricity produced.
How much electricity can be generated
by a hydroelectric power plant?
When more water flows through a turbine, more electricity can be
produced. The flow rate depends on the size of the river and the amount of
water flowing in it. Power production is considered to be directly
proportional to river flow. That is, twice as much water flowing will
produce twice as much electricity.
Flow Rate = the quantity of water flowing
The farther the water falls, the more power it has. The higher the dam, the
farther the water falls, producing more hydroelectric power.
Power production is also directly proportional to head. That is, water
falling twice as far will produce twice as much electricity.
Head = the height from which water falls
It is important to note that
when determining head,
hydrologists take into account
the pressure behind the water.
Water behind the dam puts
pressure on the falling water.
Power = the electric power in kilowatts or kW
Head = the distance the water falls (measured in feet)
Flow = the amount of water flowing (measured in cubic feet per second
or cfs)
Efficiency = How well the turbine and generator convert the power of
falling water into electric power. This can range from 60% (0.60) for older,
poorly maintained hydroplants to 90% (0.90) for newer, well maintained plants.
11.8 = Index that converts units of feet and seconds into kilowatts
A standard equation for calculating energy production:
Power = (Head) x (Flow) x (Efficiency)
11.8
Potential
 THEORETICAL- The maximum potential that exists.
 TECHNICAL- It takes into account the cost involved in
exploiting a source (including the environmental and
engineering restrictions)
 ECONOMIC- Calculated after detailed environmental,
geological, and other economic constraints.
REGION THEORETICAL
POTENTIAL (TWh)
TECHNICAL
POTENTIAL (TWh)
AFRICA 10118 3140
N. AMERICA 6150 3120
LATIN AMERICA 5670 3780
ASIA 20486 7530
OCEANIA 1500 390
EUROPE 4360 1430
WORLD 44280 19390
Continent Wide distribution
Top Hydropower Producing States
1. Washington 89,464
2. Oregon 39,410
3. California 26,837
4. New York 24,652
5. Montana 11,283
Other major hydropower producing states
include Idaho, Tennessee, Arizona, Alabama,
and South Dakota. They all produce over 5,000
Mwh annually.
2012 (thousand megawatt hours)
Hydroelectric Generation by Country
Billion kilowatt-hours
Data: EIA
0 100 200 300 400 500 600 700 800 900 1000
France
Japan
Venezuela
Norway
India
Russia
United States
Brazil
Canada
China
2013
2012
2011
U.S. Electricity Production 2013
Data provided by US EIA Net Generation by Energy Source
Natural Gas
27.44%
Coal
39.08%
Hydroelectric
6.52%
Nuclear
19.44%
Biomass
1.48%
Wind
4.13%
Petroleum
0.66%
Solar
0.23%
Geothermal
0.41%
Other
0.61%
COUNTRY POWER
CAPACITY
(GWh)
INSTALLED
CAPACITY (GW)
TAJIKISTAN 527000 4000
CANADA 341312 66954
USA 319484 79511
BRAZIL 285603 57517
CHINA 204300 65000
RUSSIA 160500 44000
NORWAY 121824 27528
JAPAN 84500 27229
INDIA 82237 22083
FRANCE 77500 77500
Top ten countries (in terms of capacity)
UNDP estimates
 Theoretical potential is about 40,500 TWh per year.
 The technical potential is about 14,300 TWh per year.
 The economic potential is about 8100 TWh per year.
 The world installed hydro capacity currently stands at 694
GW.
 In the 1980s the percentage of contribution by hydroelectric
power was about 8 to 9%.
 The total power generation in 2000 was 2675 Billion KWh
or close to 20% of the total energy generation.
Continued…
 Most of the undeveloped potential lies in the erstwhile
USSR and the developing countries.
 Worldwide about 125 GW of power is under construction.
 The largest project under construction is the Three Gorges
at the Yangtze river in China. Proposed potential is 18.2
GW and the proposed power output is 85 TWh per year.
Global Installed Capacity
Under Construction…
The Indian Scenario
 The potential is about 84000 MW at 60% load factor spread
across six major basins in the country.
 Pumped storage sites have been found recently which
leads to a further addition of a maximum of 94000 MW.
 Annual yield is assessed to be about 420 billion units per
year though with seasonal energy the value crosses600
billion mark.
 The possible installed capacity is around 150000 MW
(Based on the report submitted by CEA to the Ministry of
Power)
Continued …
 The proportion of hydro power increased from 35% from
the first five year plan to 46% in the third five year plan but
has since then decreased continuously to 25% in 2001.
 The theoretical potential of small hydro power is 10071
MW.
 Currently about 17% of the potential is being harnessed
 About 6.3% is still under construction.
India’s Basin wise potential
Rivers Potential at 60%LF (MW) Probable installed capacity (MW)
Indus 19988 33832
Ganga 10715 20711
Central Indian rivers 2740 4152
West flowing 6149 9430
East flowing 9532 14511
Brahmaputra 34920 66065
Total 84044 148701
Region wise status of hydro development
REGION POTENTIAL
ASSESSED
(60% LF)
POTENTIAL
DEVELOPED
(MW)
%
DEVELOPED
UNDER
DEVELOPMENT
NORTH 30155 4591 15.2 2514
WEST 5679 1858 32.7 1501
SOUTH 10763 5797 53.9 632
EAST 5590 1369 24.5 339
NORTH
EAST
31857 389 1.2 310
INDIA 84044 14003 16.7 5294
Major Hydropower generating units
NAME STATA CAPACITY (MW)
BHAKRA PUNJAB 1100
NAGARJUNA ANDHRA PRADESH 960
KOYNA MAHARASHTRA 920
DEHAR HIMACHAL PRADESH 990
SHARAVATHY KARNATAKA 891
KALINADI KARNATAKA 810
SRISAILAM ANDHRA PRADESH 770
Installed Capacity
REGION HYDRO THERMAL WIND NUCLEAR TOTAL
NORTH 8331.57 17806.99 4.25 1320 27462.81
WEST 4307.13 25653.98 346.59 760 31067.7
SOUTH 9369.64 14116.78 917.53 780 25183.95
EAST 2453.51 13614.58 1.10 0 16069.19
N.EAST 679.93 1122.32 0.16 0 1802.41
INDIA 25141.78 72358.67 1269.63 2860 101630.08
Region wise contribution of Hydropower
REGION PERCENTAGE
NORTH 30.34
WEST 13.86
SOUTH 37.2
EAST 15.27
NORTH-EAST 37.72
INDIA 24.74
Annual gross generation (GWh)
YEAR GROSS GENERATION
85/86 51021
90/91 71641
91/92 72757
92/93 69869
93/94 70643
94/95 82712
95/96 72579
96/97 68901
97/98 74582
98/99 82690
99/2000 80533
00/01 74346
Annual Gross Generation (GWh)
60000
65000
70000
75000
80000
85000
1991 1993 1995 1997 1999 2001
Year
Electricity
Generated
(GWh)
Potential of Small Hydropower
 Total estimated potential of 180000 MW.
 Total potential developed in the late 1990s was about 47000
MW with China contributing as much as one-third total
potentials.
 570 TWh per year from plants less than 2 MW capacity.
 The technical potential of micro, mini and small hydro in
India is placed at 6800 MW.
Small Hydro in India
STATE TOTAL CAPACITY (MW)
ARUNACHAL PRADESH 1059.03
HIMACHAL PRADESH 1624.78
UTTAR PRADESH & UTTARANCHAL 1472.93
JAMMU & KASHMIR 1207.27
KARNATAKA 652.51
MAHARASHTRA 599.47
Sites (up to 3 MW) identified by UNDP
STATE TOTAL SITES CAPACITY
NORTH 562 370
EAST 164 175
NORTH EAST 640 465
TOTAL 1366 1010
Small Hydro in other countries
 China has 43000 small hydro-electric power stations
nationwide to produce 23 million KWh a year. It has 100
million kilowatts of explorable small hydro-electric power
resources in mountainous areas of which only 29% has
been tapped.
 Philippines has a total identified mini-hydropower resource
potential is about 1132.476 megawatts (MW) of which only
7.2% has been utilized.
 There is about 3000 MW of small hydro capacity in
operation in the USA. A further 40 MW is planned.
Advantages
 Renewable Energy
 Clean Energy Source
 Domestic Energy Source
 Generally Available As
Needed
 Provides Recreational
Opportunities
 Water Supply and Flood
Control
Benefits…
 Environmental Benefits of Hydro
• No operational greenhouse gas emissions
• Savings (kg of CO2 per MWh of electricity):
– Coal 1000 kg
– Oil 800 kg
– Gas 400 kg
• No SO2 or NOX
 Non-environmental benefits
– flood control, irrigation, transportation,
fisheries and
– tourism.
Coal vs. Hydro Kinetic Energy
Conversion
35% 95%
•There are many disadvantages of
hydroelectric power due to which it is not
used on a very large scale all around the
globe.
•Before employing something on an
industrial level, you should consider pros and
cons of hydropower.
1. Disturbance of habitat
 The formation of large and huge dams destroys
the living beings around them.
 Local life is disturbed as human can’t live in
such a flooded area and plants are destroyed.
People living nearby have to relocate.
2. Installation costs
 Although the effective cost is zero but the
manufacturing and building a dam and
installation of the turbines is very costly due to
which many countries do not employ this
alternative source of energy.
3. Limited use
 As the hydroelectric power is produced by the
water which depend on the yearly rain falls so
only those areas can use this method which
receives a good amount of rainfall water because
this method needs a huge reservoir of water.
4. Divert natural waterway
 Dams and rivers collect water for the production
of electricity which alters the natural system of
water flow thus depriving houses of the water
they need.
5. Effects on agriculture
 Making dams on rivers affect the amount, quality
and temperature of water that flow in streams which
has drastic effects on agriculture and drinking water.
6. Fish killing
 The water while flowing through the dam collects
nitrogen which can damage and also kills fish. They
can also damage the reproduction of fishes thus
eliminating the whole species of fishes.
7. Disputes between people
 Changing the river pathway and shortage of
water can cause serious disputes between
people.
8. Breaking of dams
 Many dams which were built for industrial use or
for mills are not now used and occupying a great
space but they can’t be broken or removed as it
would cause serious flooding. This would not
only affect the humans but also many buildings
and property.
ENVIRONMENTAL IMPACT
 The impact of hydroelectric power plant on the
environment is varied and depends upon the
size and type of the project. Although
hydropower generation does not burn any fuel
to produce power and hence does not emit
greenhouse gases, there are definite negative
effects that arise from the creation of reservoir
and alteration of natural water flow. It is a fact
that dams, inter-basin transfers and diversion
of water for irrigation purposes have resulted
in the fragmentation of 60% of the world’s
rivers.
IMPACTS OF
HYDROELECTRIC
POWER PLANT ON
ENVIRONMENT
1. Land Use
 The size of the reservoir created by a hydroelectric
project can vary widely, depending largely on the
size of the hydroelectric generators and the
topography of the land.
 Hydroelectric plants in flat areas tend to require
much more land than those in hilly areas or canyons
where deeper reservoirs can hold more volume of
water in a smaller space.
2. Emission of methane and carbon
dioxide
 The reservoir of water for hydroelectric power
releases a large amount of carbon dioxide and
methane.
 The area around the dam is filled with water. The
plants and trees in them start rotting and
decompose by other method without the use of
oxygen.
 So this type of decomposition dumps a great
amount of methane and carbon dioxide which
increase pollution.
3. Wildlife Impacts
 Dammed reservoirs are used for multiple purposes, such as
agricultural irrigation, flood control, and recreation, so not all
wildlife impacts associated with dams can be directly
attributed to hydroelectric power.
 Apart from direct contact, there can also be wildlife impacts
both within the dammed reservoirs and downstream from the
facility. Reservoir water is usually more stagnant than normal
river water.
 As a result, the reservoir will have higher than normal
amounts of sediments and nutrients, which can cultivate
an excess of algae and other aquatic weeds.
 These weeds can crowd out other river animal and plant-
life, and they must be controlled through manual
harvesting or by introducing fish that eat these plants.
 In addition, water is lost through evaporation in dammed
reservoirs at a much higher rate than in flowing rivers.
4. Life-cycle Global Warming
Emissions
 Global warming emissions are produced during
the installation and dismantling of hydroelectric
power plants, but recent research suggests that
emissions during a facility’s operation can also
be significant.
 Such emissions vary greatly depending on the
size of the reservoir and the nature of the land
that was flooded by the reservoir.
 Small run-of-the-river plants emit between 4.53
and 13.60 grams of carbon dioxide equivalent
per kilowatt-hour. Life-cycle emissions from
large-scale hydroelectric plants built in semi-arid
regions are also modest: approximately 27.21
5. Impact of Size and Type of
Hydropower Plant
 It is difficult to correlate the damage caused by
dams to their size or type, as the impacts depend
on local conditions. Generally plants with smaller
dams are considered less environmentally
damaging than those with larger dams. Also, run-
of-river (ROR) hydropower plants are generally
less damaging than reservoir power plants,
because it is not necessary to flood large areas
upstream of the project for storage. Yet in some
cases run of river impacts can also be severe due
to river diversion over long stretches of the river.
6. Impact of River Diversion
 While both ROR and reservoir types of
hydropower dams may divert water, this is
always the case with ROR plants, since they
seek to increase kinetic energy with an
increased head. The length of diversion can
range from a few meters or less to kilometers
(km). For example, the Teesta-V ROR dam in
north eastern India diverts water for a 23 km
long stretch of the river. Eventually the
diverted water is returned to the river.
7.Impact of the Reservoir
 Dams have major impacts on the physical, chemical
and geo-morphological properties of a river.
Environmental impacts of dams have largely been
negative. Worldwide, at least 400,000 square
kilometers have been flooded by reservoirs.
 Once the barrier is put in place, the free flow of water
stops and water will begin to accumulate behind the
dam in the new reservoir. This land may have been
used for other things such as agriculture, forestry,
and even residences, but it is now unusable. The
loss of habitat may not seem severe but if this area
was home to a threatened or endangered species,
the dam construction could further threaten that
species risk of extinction.
8.Sedimentation
 Large dams with reservoirs significantly
alter the timing, amount and pattern of river
flow. This changes erosion patterns and the
quantity and type of sediments transported
by the river. Sedimentation rate is primarily
related to the ratio of the size of the river to
the flux of sediments. The reservoir that has
been rapidly filling up with water
immediately begins filling up with sediment
as well. The trapping of sediments behind
the dam is a major problem. Every year it is
estimated that 0.5 to 1% of reservoir
storage capacity is lost due to
sedimentation. The engineering problem
9. Downstream Erosion
 Trapping of sediments at the dam also has
downstream impacts by reducing the flux of
sediments downstream which can lead to the
gradual loss of soil fertility in floodplain soils.
Clean water stripped of its sediment load is
now flowing downstream of the dam. This
clean water has more force and velocity then
water carrying a high sediment load and thus
erosion of the riverbed and banks becomes
problematic. Since this is unnatural and a
form of “forced erosion” it occurs at a much
faster rate then natural river process erosion
to which the local ecosystem would be able to
adapt.
10.Impact on Local Climate
 Another often-ignored environmental effect of the
reservoir is the impact on the micro-climate level.
Studies indicate that man-made lakes in tropical
climates tend to reduce convection and thus limit
cloud cover. Temperate regions are also impacted
with “steam-fog” in the time period before
freezing. Since water cools and warms slower
then land, coastal regions tend to be much more
moderate then land-locked regions in terms of
temperature. Therefore, large dams have a slight
moderating effect on the local climate.
11.Greenhouse Gas Emission from
Dams
 Freshwater reservoirs can emit substantial
amounts of the greenhouse gases methane
and carbon dioxide as organic matter
submerged in a reservoir decays under
anaerobic and aerobic conditions,
respectively. Studies indicate that GHG
emissions from hydropower reservoirs in
boreal and temperate region are low relative
to the emissions from fossil fuel power plants,
but higher relative to life cycle emissions from
wind and solar power.
12. Dams Inducing Earthquakes?
 Finally, a least studied and most disputed
physical impact of reservoirs is the possibility
of inducing earthquakes. Many scientists
believe that seismic activity can be attributed
to the creation of dams and their adjacent
storage reservoirs. They postulate that the
added forces of the dam along inactive faults
seem to free much stronger orogenic
tensions.
13. Impact on Fisheries
 Dams and river diversion can impact
freshwater, as well as marine fisheries.
Estuarine and marine fisheries are dependent
on estuaries and rivers as spawning grounds
and the transport of nutrients from the river to
the sea. Migratory fish are especially
vulnerable to the impacts of dam construction.
Dams can prevent migrating fish such as
salmon and eel to reach their spawn grounds.
 Health issues-The changes brought
about by hydropower developments
have the capacity to affect human
health. Issues relating to the
transmission of disease, human health
risks associated with flow regulation
downstream and the consumption of
contaminated food sources (e.g, raised
mercury levels in fish) need to be
considered. The potential health benefits
of the development should also be
identified.
 HYDROPOWER DEVELOPMENT POLICY ACT ,1992
AND ELECTRICITY ACT, 1993 :-
1. The major objectives of the Hydropower Development Policy 1992
was to involve private Investment in hydropower generation.
2. In order to fulfill these objectives, concept of BOOT (Build,
Operate, Own and Transfer) in developing hydro projects was
introduced.
3. No license required for projects size >100 kW & upto 1000kW.
But, needs to be endorsed at DoED with necessary clearance from
VDC’s.
4. License required for Survey, Generation, Transmission and
Distribution for projects more than 1 MW. Provision of Survey
License (Generation, Transmission, Distribution) and
construction/Operation Licenses (Generation Transmission
POLICIES RELATED TO
HYDROPOWER PLANTS
LEGAL FRAMEWWORK
For Hydro projects > 100 kW and = 1 MW:
• Extend distribution system in rural areas.
• Import tax exemptions.
• Period of Ownership/Exclusive water rights is
unlimited .
• The power can be sold to national grid.
• No royalty to be paid by the project.
Provisions of Hydropower
Development Policy, 2001;
Institutional arrangement
• Electricity Tariff Fixation Commission to be replaced with Nepal
Electricity
Commission (NERC) as a regulatory body with main functions as;
• To act as the regulator of the sector,
• To regulating the transactions of electricity at every stage of
transaction,
• To fix electricity tariffs,
• To monitor and supervise the safety of the electric system,
• To prepare grid codes , and Hydropower related Policies and Legal
provisions HDP,2001
• To prepare grid codes , and to protect the interest of consumers.
• DOED to act as a study and promotional body
SUGGESTION OF NEW POLICY TO DEVELOP
HYDROPOWER IN SUSTAINABLE WAY
• Stability in political regime OR Arrangement during transition.
• Issue of ownership of natural resources : Legal definition of ownership and
Partnership.
• Transformation to Federal structure and sharing of rights on resources.
• Implementation of projects; Security situation; Law less-ness at local level
and local demand.
• Remoteness of project sites ; Development of other related infrastructure
(access road, transmission lines etc).
• Effective single service window for License, permits.
• Development of Power market; Domestic and regional.
• Transmission line expansion; Strengthen high voltage (domestic and cross
border), transmission and low voltage distribution network.
• Acquisition of land and comprehensive R & R policy.
• Environmental concerns including forest clearance process.
Construction Costs
 Hydro costs are highly site specific
 Dams are very expensive
 Civil works form two-thirds of total cost
– Varies 25 to 80%
 Large Western schemes: $ 1200/kW
 Developing nations: $ 800 to $ 2000/kW
 Compare with CCGT: $ 600 to $800/kW
Production Costs
 Compared with fossil-fuelled plant
– No fuel costs
– Low O&M cost
– Long lifetime
Cost and Revenue of HP
Hydropower is an important renewable
energy source world wide...
T&S_ppt final for Hydro Electric Power Plant Presentation

More Related Content

Similar to T&S_ppt final for Hydro Electric Power Plant Presentation

Hydroelectric Power Generation. Hydroelectric Power Generation. Hydroelectric...
Hydroelectric Power Generation. Hydroelectric Power Generation. Hydroelectric...Hydroelectric Power Generation. Hydroelectric Power Generation. Hydroelectric...
Hydroelectric Power Generation. Hydroelectric Power Generation. Hydroelectric...Alana Cartwright
 
1st year summer training report
1st year summer training report 1st year summer training report
1st year summer training report HIMANSHUKACHHAWA1
 
Ayushassignment5thsem pe
Ayushassignment5thsem peAyushassignment5thsem pe
Ayushassignment5thsem peAyush Soni
 
Hydroelectric Power Plant ppt for electrical engineering
Hydroelectric Power Plant ppt for electrical engineeringHydroelectric Power Plant ppt for electrical engineering
Hydroelectric Power Plant ppt for electrical engineeringsudiptomahato2345
 
Report on-water-turbines
Report on-water-turbinesReport on-water-turbines
Report on-water-turbinesKANAIYABHATT
 
hydro power plant .ppt.pptx
hydro power plant .ppt.pptxhydro power plant .ppt.pptx
hydro power plant .ppt.pptxAbhigyanAdarsh
 
MICRO PROJECT ON , HYDROELECTRICITY & HYDROELECTRIC POWER PLANT
MICRO PROJECT ON , HYDROELECTRICITY & HYDROELECTRIC POWER PLANT MICRO PROJECT ON , HYDROELECTRICITY & HYDROELECTRIC POWER PLANT
MICRO PROJECT ON , HYDROELECTRICITY & HYDROELECTRIC POWER PLANT Al KAREEM SHAIKH
 
Hydro electric power
Hydro electric powerHydro electric power
Hydro electric powerLEE-MALAK
 
Hydroelectric Power Plant.ppt
Hydroelectric Power Plant.pptHydroelectric Power Plant.ppt
Hydroelectric Power Plant.pptArthHarper
 
Hydroelectric Power Plant.ppt
Hydroelectric Power Plant.pptHydroelectric Power Plant.ppt
Hydroelectric Power Plant.pptGHANSHYAMGUPTA51
 
Hydroelectric Power Plant Presentation.ppt
Hydroelectric Power Plant Presentation.pptHydroelectric Power Plant Presentation.ppt
Hydroelectric Power Plant Presentation.pptBonaventureNzeyimana2
 

Similar to T&S_ppt final for Hydro Electric Power Plant Presentation (20)

Hydro power plant
Hydro power plantHydro power plant
Hydro power plant
 
Hydroelectric Power Generation. Hydroelectric Power Generation. Hydroelectric...
Hydroelectric Power Generation. Hydroelectric Power Generation. Hydroelectric...Hydroelectric Power Generation. Hydroelectric Power Generation. Hydroelectric...
Hydroelectric Power Generation. Hydroelectric Power Generation. Hydroelectric...
 
1st year summer training report
1st year summer training report 1st year summer training report
1st year summer training report
 
Ayushassignment5thsem pe
Ayushassignment5thsem peAyushassignment5thsem pe
Ayushassignment5thsem pe
 
Generating Electricity
Generating ElectricityGenerating Electricity
Generating Electricity
 
Hydroelectric Power Plant ppt for electrical engineering
Hydroelectric Power Plant ppt for electrical engineeringHydroelectric Power Plant ppt for electrical engineering
Hydroelectric Power Plant ppt for electrical engineering
 
Hydro Power
Hydro PowerHydro Power
Hydro Power
 
Report on-water-turbines
Report on-water-turbinesReport on-water-turbines
Report on-water-turbines
 
hydro power plant .ppt.pptx
hydro power plant .ppt.pptxhydro power plant .ppt.pptx
hydro power plant .ppt.pptx
 
Final
FinalFinal
Final
 
Hydro power
Hydro powerHydro power
Hydro power
 
MICRO PROJECT ON , HYDROELECTRICITY & HYDROELECTRIC POWER PLANT
MICRO PROJECT ON , HYDROELECTRICITY & HYDROELECTRIC POWER PLANT MICRO PROJECT ON , HYDROELECTRICITY & HYDROELECTRIC POWER PLANT
MICRO PROJECT ON , HYDROELECTRICITY & HYDROELECTRIC POWER PLANT
 
Hydro electric power plant
Hydro electric power plantHydro electric power plant
Hydro electric power plant
 
Hydro electric power
Hydro electric powerHydro electric power
Hydro electric power
 
Hydroelectric Power Plant.ppt
Hydroelectric Power Plant.pptHydroelectric Power Plant.ppt
Hydroelectric Power Plant.ppt
 
Hydroelectric Power Plant.ppt
Hydroelectric Power Plant.pptHydroelectric Power Plant.ppt
Hydroelectric Power Plant.ppt
 
Hydroelectric Power Plant Presentation.ppt
Hydroelectric Power Plant Presentation.pptHydroelectric Power Plant Presentation.ppt
Hydroelectric Power Plant Presentation.ppt
 
06 Hydro.ppt
06 Hydro.ppt06 Hydro.ppt
06 Hydro.ppt
 
hydro power
hydro powerhydro power
hydro power
 
06 Hydro.ppt
06 Hydro.ppt06 Hydro.ppt
06 Hydro.ppt
 

Recently uploaded

Crayon Activity Handout For the Crayon A
Crayon Activity Handout For the Crayon ACrayon Activity Handout For the Crayon A
Crayon Activity Handout For the Crayon AUnboundStockton
 
Introduction to ArtificiaI Intelligence in Higher Education
Introduction to ArtificiaI Intelligence in Higher EducationIntroduction to ArtificiaI Intelligence in Higher Education
Introduction to ArtificiaI Intelligence in Higher Educationpboyjonauth
 
Full Stack Web Development Course for Beginners
Full Stack Web Development Course  for BeginnersFull Stack Web Development Course  for Beginners
Full Stack Web Development Course for BeginnersSabitha Banu
 
Earth Day Presentation wow hello nice great
Earth Day Presentation wow hello nice greatEarth Day Presentation wow hello nice great
Earth Day Presentation wow hello nice greatYousafMalik24
 
Types of Journalistic Writing Grade 8.pptx
Types of Journalistic Writing Grade 8.pptxTypes of Journalistic Writing Grade 8.pptx
Types of Journalistic Writing Grade 8.pptxEyham Joco
 
Like-prefer-love -hate+verb+ing & silent letters & citizenship text.pdf
Like-prefer-love -hate+verb+ing & silent letters & citizenship text.pdfLike-prefer-love -hate+verb+ing & silent letters & citizenship text.pdf
Like-prefer-love -hate+verb+ing & silent letters & citizenship text.pdfMr Bounab Samir
 
Gas measurement O2,Co2,& ph) 04/2024.pptx
Gas measurement O2,Co2,& ph) 04/2024.pptxGas measurement O2,Co2,& ph) 04/2024.pptx
Gas measurement O2,Co2,& ph) 04/2024.pptxDr.Ibrahim Hassaan
 
Framing an Appropriate Research Question 6b9b26d93da94caf993c038d9efcdedb.pdf
Framing an Appropriate Research Question 6b9b26d93da94caf993c038d9efcdedb.pdfFraming an Appropriate Research Question 6b9b26d93da94caf993c038d9efcdedb.pdf
Framing an Appropriate Research Question 6b9b26d93da94caf993c038d9efcdedb.pdfUjwalaBharambe
 
ACC 2024 Chronicles. Cardiology. Exam.pdf
ACC 2024 Chronicles. Cardiology. Exam.pdfACC 2024 Chronicles. Cardiology. Exam.pdf
ACC 2024 Chronicles. Cardiology. Exam.pdfSpandanaRallapalli
 
Atmosphere science 7 quarter 4 .........
Atmosphere science 7 quarter 4 .........Atmosphere science 7 quarter 4 .........
Atmosphere science 7 quarter 4 .........LeaCamillePacle
 
Planning a health career 4th Quarter.pptx
Planning a health career 4th Quarter.pptxPlanning a health career 4th Quarter.pptx
Planning a health career 4th Quarter.pptxLigayaBacuel1
 
ECONOMIC CONTEXT - PAPER 1 Q3: NEWSPAPERS.pptx
ECONOMIC CONTEXT - PAPER 1 Q3: NEWSPAPERS.pptxECONOMIC CONTEXT - PAPER 1 Q3: NEWSPAPERS.pptx
ECONOMIC CONTEXT - PAPER 1 Q3: NEWSPAPERS.pptxiammrhaywood
 
ENGLISH 7_Q4_LESSON 2_ Employing a Variety of Strategies for Effective Interp...
ENGLISH 7_Q4_LESSON 2_ Employing a Variety of Strategies for Effective Interp...ENGLISH 7_Q4_LESSON 2_ Employing a Variety of Strategies for Effective Interp...
ENGLISH 7_Q4_LESSON 2_ Employing a Variety of Strategies for Effective Interp...JhezDiaz1
 
Alper Gobel In Media Res Media Component
Alper Gobel In Media Res Media ComponentAlper Gobel In Media Res Media Component
Alper Gobel In Media Res Media ComponentInMediaRes1
 
DATA STRUCTURE AND ALGORITHM for beginners
DATA STRUCTURE AND ALGORITHM for beginnersDATA STRUCTURE AND ALGORITHM for beginners
DATA STRUCTURE AND ALGORITHM for beginnersSabitha Banu
 
Romantic Opera MUSIC FOR GRADE NINE pptx
Romantic Opera MUSIC FOR GRADE NINE pptxRomantic Opera MUSIC FOR GRADE NINE pptx
Romantic Opera MUSIC FOR GRADE NINE pptxsqpmdrvczh
 

Recently uploaded (20)

Crayon Activity Handout For the Crayon A
Crayon Activity Handout For the Crayon ACrayon Activity Handout For the Crayon A
Crayon Activity Handout For the Crayon A
 
Introduction to ArtificiaI Intelligence in Higher Education
Introduction to ArtificiaI Intelligence in Higher EducationIntroduction to ArtificiaI Intelligence in Higher Education
Introduction to ArtificiaI Intelligence in Higher Education
 
OS-operating systems- ch04 (Threads) ...
OS-operating systems- ch04 (Threads) ...OS-operating systems- ch04 (Threads) ...
OS-operating systems- ch04 (Threads) ...
 
9953330565 Low Rate Call Girls In Rohini Delhi NCR
9953330565 Low Rate Call Girls In Rohini  Delhi NCR9953330565 Low Rate Call Girls In Rohini  Delhi NCR
9953330565 Low Rate Call Girls In Rohini Delhi NCR
 
Full Stack Web Development Course for Beginners
Full Stack Web Development Course  for BeginnersFull Stack Web Development Course  for Beginners
Full Stack Web Development Course for Beginners
 
Earth Day Presentation wow hello nice great
Earth Day Presentation wow hello nice greatEarth Day Presentation wow hello nice great
Earth Day Presentation wow hello nice great
 
Types of Journalistic Writing Grade 8.pptx
Types of Journalistic Writing Grade 8.pptxTypes of Journalistic Writing Grade 8.pptx
Types of Journalistic Writing Grade 8.pptx
 
Like-prefer-love -hate+verb+ing & silent letters & citizenship text.pdf
Like-prefer-love -hate+verb+ing & silent letters & citizenship text.pdfLike-prefer-love -hate+verb+ing & silent letters & citizenship text.pdf
Like-prefer-love -hate+verb+ing & silent letters & citizenship text.pdf
 
Gas measurement O2,Co2,& ph) 04/2024.pptx
Gas measurement O2,Co2,& ph) 04/2024.pptxGas measurement O2,Co2,& ph) 04/2024.pptx
Gas measurement O2,Co2,& ph) 04/2024.pptx
 
Framing an Appropriate Research Question 6b9b26d93da94caf993c038d9efcdedb.pdf
Framing an Appropriate Research Question 6b9b26d93da94caf993c038d9efcdedb.pdfFraming an Appropriate Research Question 6b9b26d93da94caf993c038d9efcdedb.pdf
Framing an Appropriate Research Question 6b9b26d93da94caf993c038d9efcdedb.pdf
 
Model Call Girl in Bikash Puri Delhi reach out to us at 🔝9953056974🔝
Model Call Girl in Bikash Puri  Delhi reach out to us at 🔝9953056974🔝Model Call Girl in Bikash Puri  Delhi reach out to us at 🔝9953056974🔝
Model Call Girl in Bikash Puri Delhi reach out to us at 🔝9953056974🔝
 
ACC 2024 Chronicles. Cardiology. Exam.pdf
ACC 2024 Chronicles. Cardiology. Exam.pdfACC 2024 Chronicles. Cardiology. Exam.pdf
ACC 2024 Chronicles. Cardiology. Exam.pdf
 
Atmosphere science 7 quarter 4 .........
Atmosphere science 7 quarter 4 .........Atmosphere science 7 quarter 4 .........
Atmosphere science 7 quarter 4 .........
 
Planning a health career 4th Quarter.pptx
Planning a health career 4th Quarter.pptxPlanning a health career 4th Quarter.pptx
Planning a health career 4th Quarter.pptx
 
ECONOMIC CONTEXT - PAPER 1 Q3: NEWSPAPERS.pptx
ECONOMIC CONTEXT - PAPER 1 Q3: NEWSPAPERS.pptxECONOMIC CONTEXT - PAPER 1 Q3: NEWSPAPERS.pptx
ECONOMIC CONTEXT - PAPER 1 Q3: NEWSPAPERS.pptx
 
ENGLISH 7_Q4_LESSON 2_ Employing a Variety of Strategies for Effective Interp...
ENGLISH 7_Q4_LESSON 2_ Employing a Variety of Strategies for Effective Interp...ENGLISH 7_Q4_LESSON 2_ Employing a Variety of Strategies for Effective Interp...
ENGLISH 7_Q4_LESSON 2_ Employing a Variety of Strategies for Effective Interp...
 
TataKelola dan KamSiber Kecerdasan Buatan v022.pdf
TataKelola dan KamSiber Kecerdasan Buatan v022.pdfTataKelola dan KamSiber Kecerdasan Buatan v022.pdf
TataKelola dan KamSiber Kecerdasan Buatan v022.pdf
 
Alper Gobel In Media Res Media Component
Alper Gobel In Media Res Media ComponentAlper Gobel In Media Res Media Component
Alper Gobel In Media Res Media Component
 
DATA STRUCTURE AND ALGORITHM for beginners
DATA STRUCTURE AND ALGORITHM for beginnersDATA STRUCTURE AND ALGORITHM for beginners
DATA STRUCTURE AND ALGORITHM for beginners
 
Romantic Opera MUSIC FOR GRADE NINE pptx
Romantic Opera MUSIC FOR GRADE NINE pptxRomantic Opera MUSIC FOR GRADE NINE pptx
Romantic Opera MUSIC FOR GRADE NINE pptx
 

T&S_ppt final for Hydro Electric Power Plant Presentation

  • 1. Saurabh Chinchole 141020001 Tushar Dighe Mahesh Bachute 141020031 141020036 Sandesh Gole Anurag Shukla 151020968 141020042 Manish Jagtap Astitva Rajput 141020012 141020041 Amol Khandait Vishal Chavan
  • 2. Hydroelectric power (often called hydropower) is considered a renewable energy source. A renewable energy source is one that is not depleted (used up) in the production of energy. Through hydropower, the energy in falling water is converted into electricity without “using up” the water.
  • 3. Hydropower energy is ultimately derived from the sun, which drives the water cycle. In the water cycle, rivers are recharged in a continuous cycle. Because of the force of gravity, water flows from high points to low points. There is kinetic energy embodied in the flow of water.
  • 5. Humans first learned to harness the kinetic energy in water by using waterwheels. A waterwheel is a revolving wheel fitted with blades, buckets, or vanes. Waterwheels convert the kinetic energy of flowing water to mechanical energy.
  • 6.  A water wheel is a machine for converting the energy of free- flowing or falling water into useful forms of power.  The main difficulty of water wheels is their dependence on flowing water, which limits where they can be located.  John Smeaton's scientific investigation of the water wheel led to significant increases in efficiency in the mid to late 18th century and supplying much needed power for the Industrial Revolution. Waterwheel
  • 7. Early waterwheels used mechanical energy to grind grains and to drive machinery such as sawmills and blacksmith equipment.
  • 8. Waterwheel technology advanced over time. Turbines are advanced, very efficient waterwheels. They are often enclosed to further capture water’s energy.
  • 9. Not long after the discovery of electricity, it was realized that a turbine’s mechanical energy could be used to activate a generator and produce electricity. The first hydroelectric power plant was constructed in 1882 in Appleton, Wisconsin. It produced 12.5 kilowatts of electricity which was used to light two paper mills and one home.
  • 11. How Hydropower Works!  Water from the reservoir flows due to gravity to drive the turbine.  Turbine is connected to a generator.  Power generated is transmitted over power lines.
  • 12. Flowing water is directed at a turbine (remember turbines are just advanced waterwheels). The flowing water causes the turbine to rotate, converting the water’s kinetic energy into mechanical energy. How a Hydroelectric Power System Works - Part 1
  • 13. The mechanical energy produced by the turbine is converted into electric energy using a turbine generator. Inside the generator, the shaft of the turbine spins a magnet inside coils of copper wire. It is a fact of nature that moving a magnet near a conductor causes an electric current. How a Hydroelectric Power System Works – Part 2
  • 15.
  • 16. Selection of site for Dam 1. Good topographical location along the path of river. 2. Right geological structure. 3. For economy, the length of the dam should be as small as possible, and for a given height, it should store the maximum volume of water. 4. The general bed level at dam site should preferably be higher than that of the river basin. This will reduce the height of the dam. 5. The value of land and property submerged by the proposed dam should be as low as possible. 6. The dam site should be easily accessible, so that it can be economically connected to important towns and cities. 7. Site for establishing labor colonies and a healthy environment should be available near the site. 8. If dam is situated in an earthquake zone, its design must include earthquake forces. The type of structure best suited to resist earthquake shocks without danger are earthen dams and concrete gravity dams.
  • 17.
  • 18. Factors governing selection of turbine Selection of turbine type and determination of plant capacity, turbines require the detailed information on head and possible plant discharge be collected accurately of different conditions. 1) High specific speed is essential where the head is low and output is large, because otherwise the rotational speed will be low which means cost of turbo-generator and powerhouse will be high. On the other hand there is practically no need of choosing a high value of specific speed for high installations, because even with lo specific speed high rotational speed
  • 19. 2) Rotational speed depends upon specific speed. Also the rotational speed of an electrical generator with which the turbine is to be directly coupled depends on the frequency and number of pair of poles. The value of specific speed adopted should be such that it will give the synchronous speed of the generator. 3) The efficiency selected should be such that it gives the highest overall efficiency of various conditions. Factors governing selection of turbine
  • 20. The amount of electricity that can be generated by a hydropower plant depends on two factors: • flow rate - the quantity of water flowing in a given time; and • head - the height from which the water falls. The greater the flow and head, the more electricity produced. How much electricity can be generated by a hydroelectric power plant?
  • 21. When more water flows through a turbine, more electricity can be produced. The flow rate depends on the size of the river and the amount of water flowing in it. Power production is considered to be directly proportional to river flow. That is, twice as much water flowing will produce twice as much electricity. Flow Rate = the quantity of water flowing
  • 22. The farther the water falls, the more power it has. The higher the dam, the farther the water falls, producing more hydroelectric power. Power production is also directly proportional to head. That is, water falling twice as far will produce twice as much electricity. Head = the height from which water falls
  • 23. It is important to note that when determining head, hydrologists take into account the pressure behind the water. Water behind the dam puts pressure on the falling water.
  • 24. Power = the electric power in kilowatts or kW Head = the distance the water falls (measured in feet) Flow = the amount of water flowing (measured in cubic feet per second or cfs) Efficiency = How well the turbine and generator convert the power of falling water into electric power. This can range from 60% (0.60) for older, poorly maintained hydroplants to 90% (0.90) for newer, well maintained plants. 11.8 = Index that converts units of feet and seconds into kilowatts A standard equation for calculating energy production: Power = (Head) x (Flow) x (Efficiency) 11.8
  • 25. Potential  THEORETICAL- The maximum potential that exists.  TECHNICAL- It takes into account the cost involved in exploiting a source (including the environmental and engineering restrictions)  ECONOMIC- Calculated after detailed environmental, geological, and other economic constraints.
  • 26. REGION THEORETICAL POTENTIAL (TWh) TECHNICAL POTENTIAL (TWh) AFRICA 10118 3140 N. AMERICA 6150 3120 LATIN AMERICA 5670 3780 ASIA 20486 7530 OCEANIA 1500 390 EUROPE 4360 1430 WORLD 44280 19390 Continent Wide distribution
  • 27. Top Hydropower Producing States 1. Washington 89,464 2. Oregon 39,410 3. California 26,837 4. New York 24,652 5. Montana 11,283 Other major hydropower producing states include Idaho, Tennessee, Arizona, Alabama, and South Dakota. They all produce over 5,000 Mwh annually. 2012 (thousand megawatt hours)
  • 28. Hydroelectric Generation by Country Billion kilowatt-hours Data: EIA 0 100 200 300 400 500 600 700 800 900 1000 France Japan Venezuela Norway India Russia United States Brazil Canada China 2013 2012 2011
  • 29. U.S. Electricity Production 2013 Data provided by US EIA Net Generation by Energy Source Natural Gas 27.44% Coal 39.08% Hydroelectric 6.52% Nuclear 19.44% Biomass 1.48% Wind 4.13% Petroleum 0.66% Solar 0.23% Geothermal 0.41% Other 0.61%
  • 30. COUNTRY POWER CAPACITY (GWh) INSTALLED CAPACITY (GW) TAJIKISTAN 527000 4000 CANADA 341312 66954 USA 319484 79511 BRAZIL 285603 57517 CHINA 204300 65000 RUSSIA 160500 44000 NORWAY 121824 27528 JAPAN 84500 27229 INDIA 82237 22083 FRANCE 77500 77500 Top ten countries (in terms of capacity)
  • 31. UNDP estimates  Theoretical potential is about 40,500 TWh per year.  The technical potential is about 14,300 TWh per year.  The economic potential is about 8100 TWh per year.  The world installed hydro capacity currently stands at 694 GW.  In the 1980s the percentage of contribution by hydroelectric power was about 8 to 9%.  The total power generation in 2000 was 2675 Billion KWh or close to 20% of the total energy generation.
  • 32. Continued…  Most of the undeveloped potential lies in the erstwhile USSR and the developing countries.  Worldwide about 125 GW of power is under construction.  The largest project under construction is the Three Gorges at the Yangtze river in China. Proposed potential is 18.2 GW and the proposed power output is 85 TWh per year.
  • 35. The Indian Scenario  The potential is about 84000 MW at 60% load factor spread across six major basins in the country.  Pumped storage sites have been found recently which leads to a further addition of a maximum of 94000 MW.  Annual yield is assessed to be about 420 billion units per year though with seasonal energy the value crosses600 billion mark.  The possible installed capacity is around 150000 MW (Based on the report submitted by CEA to the Ministry of Power)
  • 36. Continued …  The proportion of hydro power increased from 35% from the first five year plan to 46% in the third five year plan but has since then decreased continuously to 25% in 2001.  The theoretical potential of small hydro power is 10071 MW.  Currently about 17% of the potential is being harnessed  About 6.3% is still under construction.
  • 37. India’s Basin wise potential Rivers Potential at 60%LF (MW) Probable installed capacity (MW) Indus 19988 33832 Ganga 10715 20711 Central Indian rivers 2740 4152 West flowing 6149 9430 East flowing 9532 14511 Brahmaputra 34920 66065 Total 84044 148701
  • 38. Region wise status of hydro development REGION POTENTIAL ASSESSED (60% LF) POTENTIAL DEVELOPED (MW) % DEVELOPED UNDER DEVELOPMENT NORTH 30155 4591 15.2 2514 WEST 5679 1858 32.7 1501 SOUTH 10763 5797 53.9 632 EAST 5590 1369 24.5 339 NORTH EAST 31857 389 1.2 310 INDIA 84044 14003 16.7 5294
  • 39. Major Hydropower generating units NAME STATA CAPACITY (MW) BHAKRA PUNJAB 1100 NAGARJUNA ANDHRA PRADESH 960 KOYNA MAHARASHTRA 920 DEHAR HIMACHAL PRADESH 990 SHARAVATHY KARNATAKA 891 KALINADI KARNATAKA 810 SRISAILAM ANDHRA PRADESH 770
  • 40. Installed Capacity REGION HYDRO THERMAL WIND NUCLEAR TOTAL NORTH 8331.57 17806.99 4.25 1320 27462.81 WEST 4307.13 25653.98 346.59 760 31067.7 SOUTH 9369.64 14116.78 917.53 780 25183.95 EAST 2453.51 13614.58 1.10 0 16069.19 N.EAST 679.93 1122.32 0.16 0 1802.41 INDIA 25141.78 72358.67 1269.63 2860 101630.08
  • 41. Region wise contribution of Hydropower REGION PERCENTAGE NORTH 30.34 WEST 13.86 SOUTH 37.2 EAST 15.27 NORTH-EAST 37.72 INDIA 24.74
  • 42. Annual gross generation (GWh) YEAR GROSS GENERATION 85/86 51021 90/91 71641 91/92 72757 92/93 69869 93/94 70643 94/95 82712 95/96 72579 96/97 68901 97/98 74582 98/99 82690 99/2000 80533 00/01 74346
  • 43. Annual Gross Generation (GWh) 60000 65000 70000 75000 80000 85000 1991 1993 1995 1997 1999 2001 Year Electricity Generated (GWh)
  • 44. Potential of Small Hydropower  Total estimated potential of 180000 MW.  Total potential developed in the late 1990s was about 47000 MW with China contributing as much as one-third total potentials.  570 TWh per year from plants less than 2 MW capacity.  The technical potential of micro, mini and small hydro in India is placed at 6800 MW.
  • 45. Small Hydro in India STATE TOTAL CAPACITY (MW) ARUNACHAL PRADESH 1059.03 HIMACHAL PRADESH 1624.78 UTTAR PRADESH & UTTARANCHAL 1472.93 JAMMU & KASHMIR 1207.27 KARNATAKA 652.51 MAHARASHTRA 599.47
  • 46. Sites (up to 3 MW) identified by UNDP STATE TOTAL SITES CAPACITY NORTH 562 370 EAST 164 175 NORTH EAST 640 465 TOTAL 1366 1010
  • 47. Small Hydro in other countries  China has 43000 small hydro-electric power stations nationwide to produce 23 million KWh a year. It has 100 million kilowatts of explorable small hydro-electric power resources in mountainous areas of which only 29% has been tapped.  Philippines has a total identified mini-hydropower resource potential is about 1132.476 megawatts (MW) of which only 7.2% has been utilized.  There is about 3000 MW of small hydro capacity in operation in the USA. A further 40 MW is planned.
  • 48. Advantages  Renewable Energy  Clean Energy Source  Domestic Energy Source  Generally Available As Needed  Provides Recreational Opportunities  Water Supply and Flood Control
  • 49. Benefits…  Environmental Benefits of Hydro • No operational greenhouse gas emissions • Savings (kg of CO2 per MWh of electricity): – Coal 1000 kg – Oil 800 kg – Gas 400 kg • No SO2 or NOX  Non-environmental benefits – flood control, irrigation, transportation, fisheries and – tourism.
  • 50. Coal vs. Hydro Kinetic Energy Conversion 35% 95%
  • 51. •There are many disadvantages of hydroelectric power due to which it is not used on a very large scale all around the globe. •Before employing something on an industrial level, you should consider pros and cons of hydropower.
  • 52. 1. Disturbance of habitat  The formation of large and huge dams destroys the living beings around them.  Local life is disturbed as human can’t live in such a flooded area and plants are destroyed. People living nearby have to relocate. 2. Installation costs  Although the effective cost is zero but the manufacturing and building a dam and installation of the turbines is very costly due to which many countries do not employ this alternative source of energy.
  • 53. 3. Limited use  As the hydroelectric power is produced by the water which depend on the yearly rain falls so only those areas can use this method which receives a good amount of rainfall water because this method needs a huge reservoir of water. 4. Divert natural waterway  Dams and rivers collect water for the production of electricity which alters the natural system of water flow thus depriving houses of the water they need.
  • 54. 5. Effects on agriculture  Making dams on rivers affect the amount, quality and temperature of water that flow in streams which has drastic effects on agriculture and drinking water. 6. Fish killing  The water while flowing through the dam collects nitrogen which can damage and also kills fish. They can also damage the reproduction of fishes thus eliminating the whole species of fishes.
  • 55. 7. Disputes between people  Changing the river pathway and shortage of water can cause serious disputes between people. 8. Breaking of dams  Many dams which were built for industrial use or for mills are not now used and occupying a great space but they can’t be broken or removed as it would cause serious flooding. This would not only affect the humans but also many buildings and property.
  • 56. ENVIRONMENTAL IMPACT  The impact of hydroelectric power plant on the environment is varied and depends upon the size and type of the project. Although hydropower generation does not burn any fuel to produce power and hence does not emit greenhouse gases, there are definite negative effects that arise from the creation of reservoir and alteration of natural water flow. It is a fact that dams, inter-basin transfers and diversion of water for irrigation purposes have resulted in the fragmentation of 60% of the world’s rivers.
  • 57. IMPACTS OF HYDROELECTRIC POWER PLANT ON ENVIRONMENT 1. Land Use  The size of the reservoir created by a hydroelectric project can vary widely, depending largely on the size of the hydroelectric generators and the topography of the land.  Hydroelectric plants in flat areas tend to require much more land than those in hilly areas or canyons where deeper reservoirs can hold more volume of water in a smaller space.
  • 58. 2. Emission of methane and carbon dioxide  The reservoir of water for hydroelectric power releases a large amount of carbon dioxide and methane.  The area around the dam is filled with water. The plants and trees in them start rotting and decompose by other method without the use of oxygen.  So this type of decomposition dumps a great amount of methane and carbon dioxide which increase pollution.
  • 59. 3. Wildlife Impacts  Dammed reservoirs are used for multiple purposes, such as agricultural irrigation, flood control, and recreation, so not all wildlife impacts associated with dams can be directly attributed to hydroelectric power.  Apart from direct contact, there can also be wildlife impacts both within the dammed reservoirs and downstream from the facility. Reservoir water is usually more stagnant than normal river water.  As a result, the reservoir will have higher than normal amounts of sediments and nutrients, which can cultivate an excess of algae and other aquatic weeds.  These weeds can crowd out other river animal and plant- life, and they must be controlled through manual harvesting or by introducing fish that eat these plants.  In addition, water is lost through evaporation in dammed reservoirs at a much higher rate than in flowing rivers.
  • 60. 4. Life-cycle Global Warming Emissions  Global warming emissions are produced during the installation and dismantling of hydroelectric power plants, but recent research suggests that emissions during a facility’s operation can also be significant.  Such emissions vary greatly depending on the size of the reservoir and the nature of the land that was flooded by the reservoir.  Small run-of-the-river plants emit between 4.53 and 13.60 grams of carbon dioxide equivalent per kilowatt-hour. Life-cycle emissions from large-scale hydroelectric plants built in semi-arid regions are also modest: approximately 27.21
  • 61. 5. Impact of Size and Type of Hydropower Plant  It is difficult to correlate the damage caused by dams to their size or type, as the impacts depend on local conditions. Generally plants with smaller dams are considered less environmentally damaging than those with larger dams. Also, run- of-river (ROR) hydropower plants are generally less damaging than reservoir power plants, because it is not necessary to flood large areas upstream of the project for storage. Yet in some cases run of river impacts can also be severe due to river diversion over long stretches of the river.
  • 62. 6. Impact of River Diversion  While both ROR and reservoir types of hydropower dams may divert water, this is always the case with ROR plants, since they seek to increase kinetic energy with an increased head. The length of diversion can range from a few meters or less to kilometers (km). For example, the Teesta-V ROR dam in north eastern India diverts water for a 23 km long stretch of the river. Eventually the diverted water is returned to the river.
  • 63. 7.Impact of the Reservoir  Dams have major impacts on the physical, chemical and geo-morphological properties of a river. Environmental impacts of dams have largely been negative. Worldwide, at least 400,000 square kilometers have been flooded by reservoirs.  Once the barrier is put in place, the free flow of water stops and water will begin to accumulate behind the dam in the new reservoir. This land may have been used for other things such as agriculture, forestry, and even residences, but it is now unusable. The loss of habitat may not seem severe but if this area was home to a threatened or endangered species, the dam construction could further threaten that species risk of extinction.
  • 64. 8.Sedimentation  Large dams with reservoirs significantly alter the timing, amount and pattern of river flow. This changes erosion patterns and the quantity and type of sediments transported by the river. Sedimentation rate is primarily related to the ratio of the size of the river to the flux of sediments. The reservoir that has been rapidly filling up with water immediately begins filling up with sediment as well. The trapping of sediments behind the dam is a major problem. Every year it is estimated that 0.5 to 1% of reservoir storage capacity is lost due to sedimentation. The engineering problem
  • 65. 9. Downstream Erosion  Trapping of sediments at the dam also has downstream impacts by reducing the flux of sediments downstream which can lead to the gradual loss of soil fertility in floodplain soils. Clean water stripped of its sediment load is now flowing downstream of the dam. This clean water has more force and velocity then water carrying a high sediment load and thus erosion of the riverbed and banks becomes problematic. Since this is unnatural and a form of “forced erosion” it occurs at a much faster rate then natural river process erosion to which the local ecosystem would be able to adapt.
  • 66. 10.Impact on Local Climate  Another often-ignored environmental effect of the reservoir is the impact on the micro-climate level. Studies indicate that man-made lakes in tropical climates tend to reduce convection and thus limit cloud cover. Temperate regions are also impacted with “steam-fog” in the time period before freezing. Since water cools and warms slower then land, coastal regions tend to be much more moderate then land-locked regions in terms of temperature. Therefore, large dams have a slight moderating effect on the local climate.
  • 67. 11.Greenhouse Gas Emission from Dams  Freshwater reservoirs can emit substantial amounts of the greenhouse gases methane and carbon dioxide as organic matter submerged in a reservoir decays under anaerobic and aerobic conditions, respectively. Studies indicate that GHG emissions from hydropower reservoirs in boreal and temperate region are low relative to the emissions from fossil fuel power plants, but higher relative to life cycle emissions from wind and solar power.
  • 68. 12. Dams Inducing Earthquakes?  Finally, a least studied and most disputed physical impact of reservoirs is the possibility of inducing earthquakes. Many scientists believe that seismic activity can be attributed to the creation of dams and their adjacent storage reservoirs. They postulate that the added forces of the dam along inactive faults seem to free much stronger orogenic tensions.
  • 69. 13. Impact on Fisheries  Dams and river diversion can impact freshwater, as well as marine fisheries. Estuarine and marine fisheries are dependent on estuaries and rivers as spawning grounds and the transport of nutrients from the river to the sea. Migratory fish are especially vulnerable to the impacts of dam construction. Dams can prevent migrating fish such as salmon and eel to reach their spawn grounds.
  • 70.  Health issues-The changes brought about by hydropower developments have the capacity to affect human health. Issues relating to the transmission of disease, human health risks associated with flow regulation downstream and the consumption of contaminated food sources (e.g, raised mercury levels in fish) need to be considered. The potential health benefits of the development should also be identified.
  • 71.
  • 72.
  • 73.
  • 74.  HYDROPOWER DEVELOPMENT POLICY ACT ,1992 AND ELECTRICITY ACT, 1993 :- 1. The major objectives of the Hydropower Development Policy 1992 was to involve private Investment in hydropower generation. 2. In order to fulfill these objectives, concept of BOOT (Build, Operate, Own and Transfer) in developing hydro projects was introduced. 3. No license required for projects size >100 kW & upto 1000kW. But, needs to be endorsed at DoED with necessary clearance from VDC’s. 4. License required for Survey, Generation, Transmission and Distribution for projects more than 1 MW. Provision of Survey License (Generation, Transmission, Distribution) and construction/Operation Licenses (Generation Transmission POLICIES RELATED TO HYDROPOWER PLANTS
  • 75. LEGAL FRAMEWWORK For Hydro projects > 100 kW and = 1 MW: • Extend distribution system in rural areas. • Import tax exemptions. • Period of Ownership/Exclusive water rights is unlimited . • The power can be sold to national grid. • No royalty to be paid by the project.
  • 76. Provisions of Hydropower Development Policy, 2001; Institutional arrangement • Electricity Tariff Fixation Commission to be replaced with Nepal Electricity Commission (NERC) as a regulatory body with main functions as; • To act as the regulator of the sector, • To regulating the transactions of electricity at every stage of transaction, • To fix electricity tariffs, • To monitor and supervise the safety of the electric system, • To prepare grid codes , and Hydropower related Policies and Legal provisions HDP,2001 • To prepare grid codes , and to protect the interest of consumers. • DOED to act as a study and promotional body
  • 77. SUGGESTION OF NEW POLICY TO DEVELOP HYDROPOWER IN SUSTAINABLE WAY • Stability in political regime OR Arrangement during transition. • Issue of ownership of natural resources : Legal definition of ownership and Partnership. • Transformation to Federal structure and sharing of rights on resources. • Implementation of projects; Security situation; Law less-ness at local level and local demand. • Remoteness of project sites ; Development of other related infrastructure (access road, transmission lines etc). • Effective single service window for License, permits. • Development of Power market; Domestic and regional. • Transmission line expansion; Strengthen high voltage (domestic and cross border), transmission and low voltage distribution network. • Acquisition of land and comprehensive R & R policy. • Environmental concerns including forest clearance process.
  • 78. Construction Costs  Hydro costs are highly site specific  Dams are very expensive  Civil works form two-thirds of total cost – Varies 25 to 80%  Large Western schemes: $ 1200/kW  Developing nations: $ 800 to $ 2000/kW  Compare with CCGT: $ 600 to $800/kW
  • 79. Production Costs  Compared with fossil-fuelled plant – No fuel costs – Low O&M cost – Long lifetime
  • 81. Hydropower is an important renewable energy source world wide...

Editor's Notes

  1. Understanding the water cycle is important in order to understand hydropower. The energy driving the water cycle comes from radiant energy released by the sun that heats the water and causes it to evaporate.
  2. In 1880, the Grand Rapids Electric Light and Power Company used a water turbine to generate enough electricity to power 16 lights. Soon after, in 1882, the world’s first hydroelectric power plant began operation on the Fox River in Appleton, WI. The plant, later named the Appleton Edison Light Company, was initiated by Appleton paper manufacturer H.F. Rogers, who had been inspired by Thomas Edison's plans for an electricity-producing station in New York. When you look at rushing waterfalls and rivers, you may not immediately think of electricity but hydroelectric power plants are responsible for lighting many of our homes and neighborhoods.
  3. Over one half of the total US hydroelectric capacity for electricity generated is concentrated in a few states (Washington, California and Oregon) Washington is home to the location of the nation’s largest hydroelectric facility—The Grand Coulee Dam. It is important to note that only a small percentage of all dams in the US produce electricity. Most dams were constructed solely to provide irrigation and flood control.
  4. Most electricity from water in US and the world is produced by conventional hydropower using gravitational energy. Almost 17% of the world’s electricity and 5-10 percent of US electricity, depending on the supply of water, is produced by hydropower. That’s enough power to supply 28 million households with electricity, or the equivalent of nearly 500 million barrels of oil. The total US hydropower capacity is about 95,000 megawatts.
  5. Hydropower is a fueled by water, so it's a clean fuel source. Hydropower doesn't pollute the air like power plants that burn fossil fuels, such as coal or natural gas. Hydropower is a domestic source of energy, produced in the United States. Hydropower relies on the water cycle, which is driven by the sun, thus it's a renewable power source.
  6. A hydropower plant, on the other hand, converts about 95 percent of kinetic energy of the water flowing through the system into electricity.