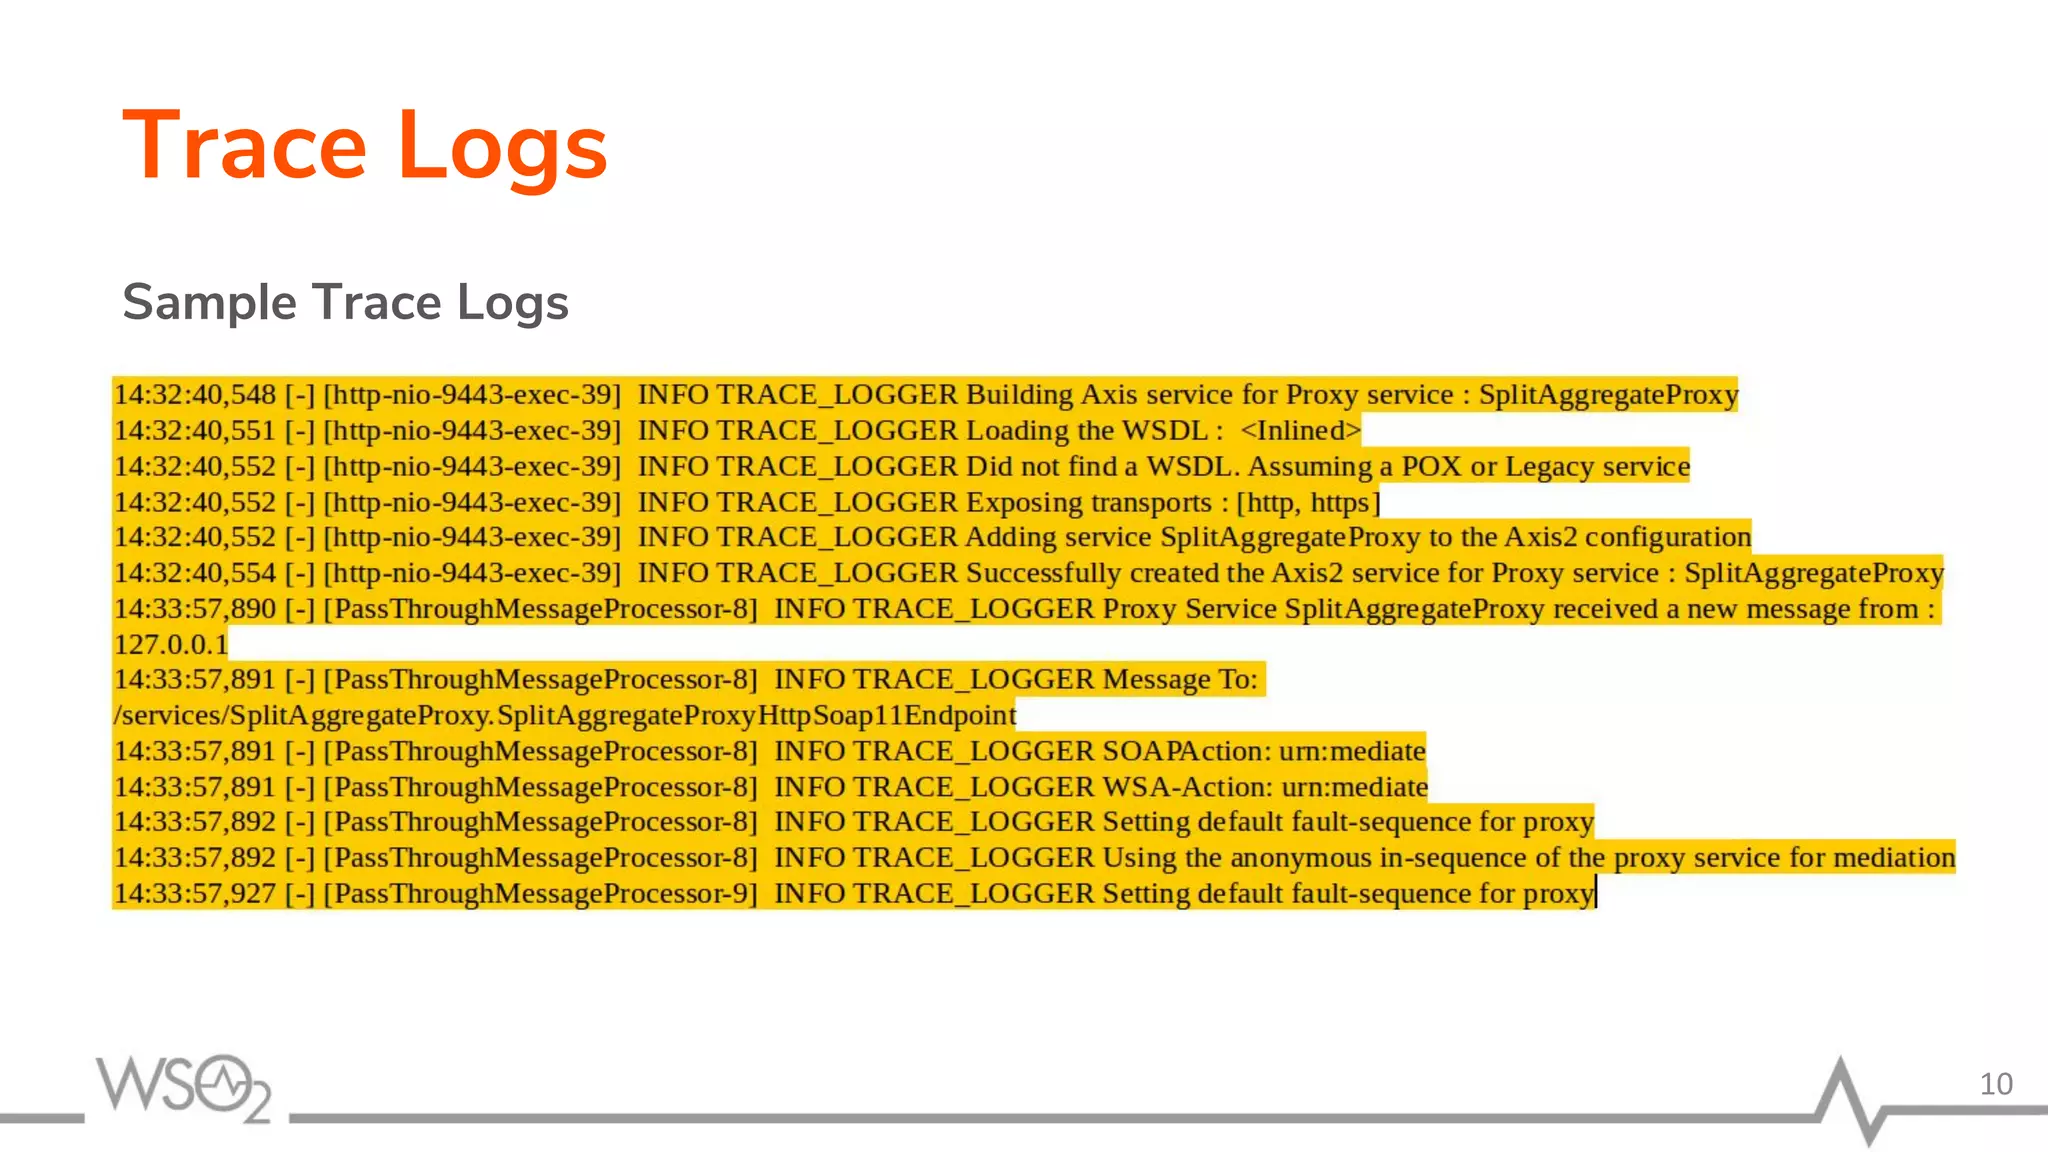
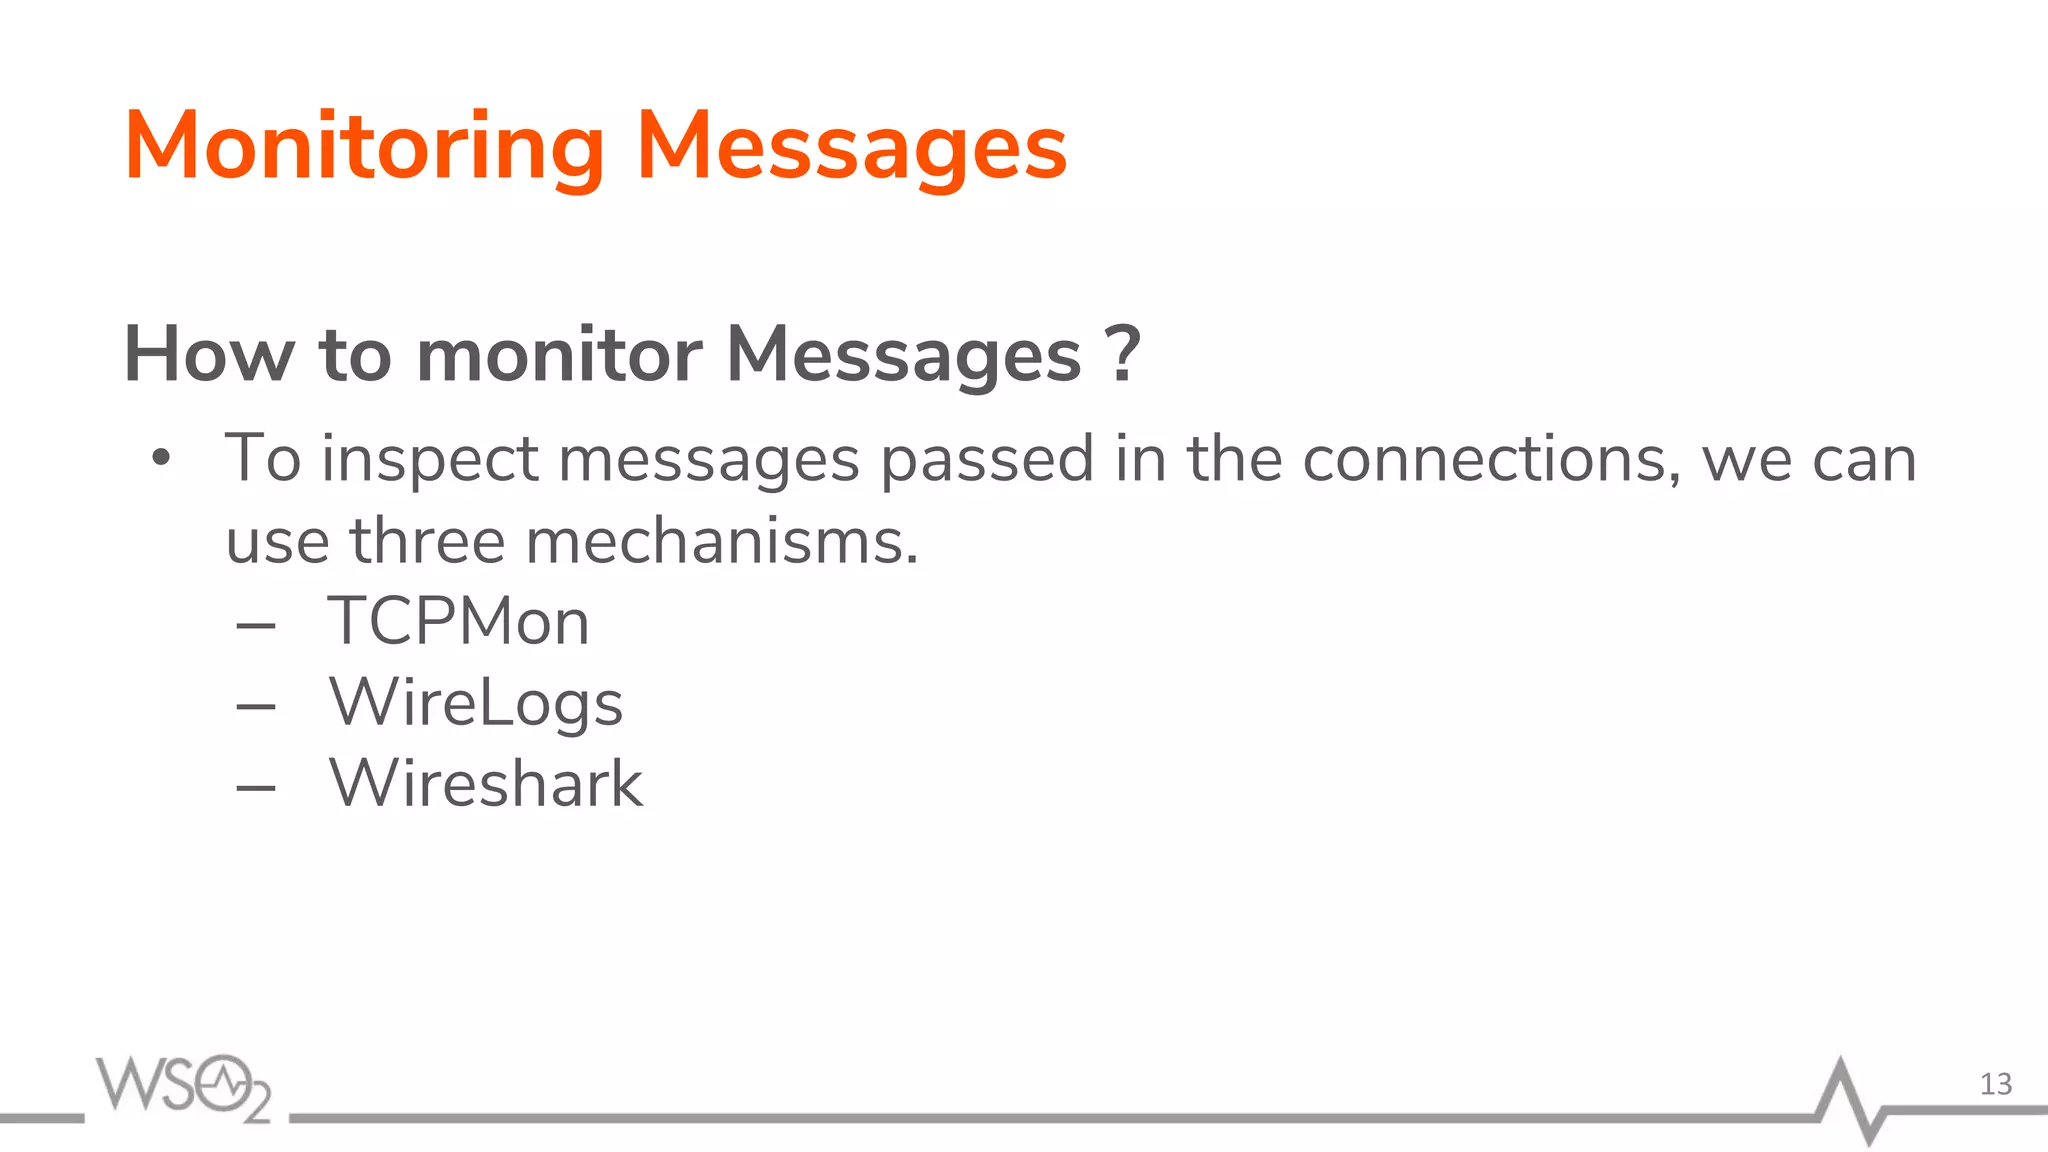
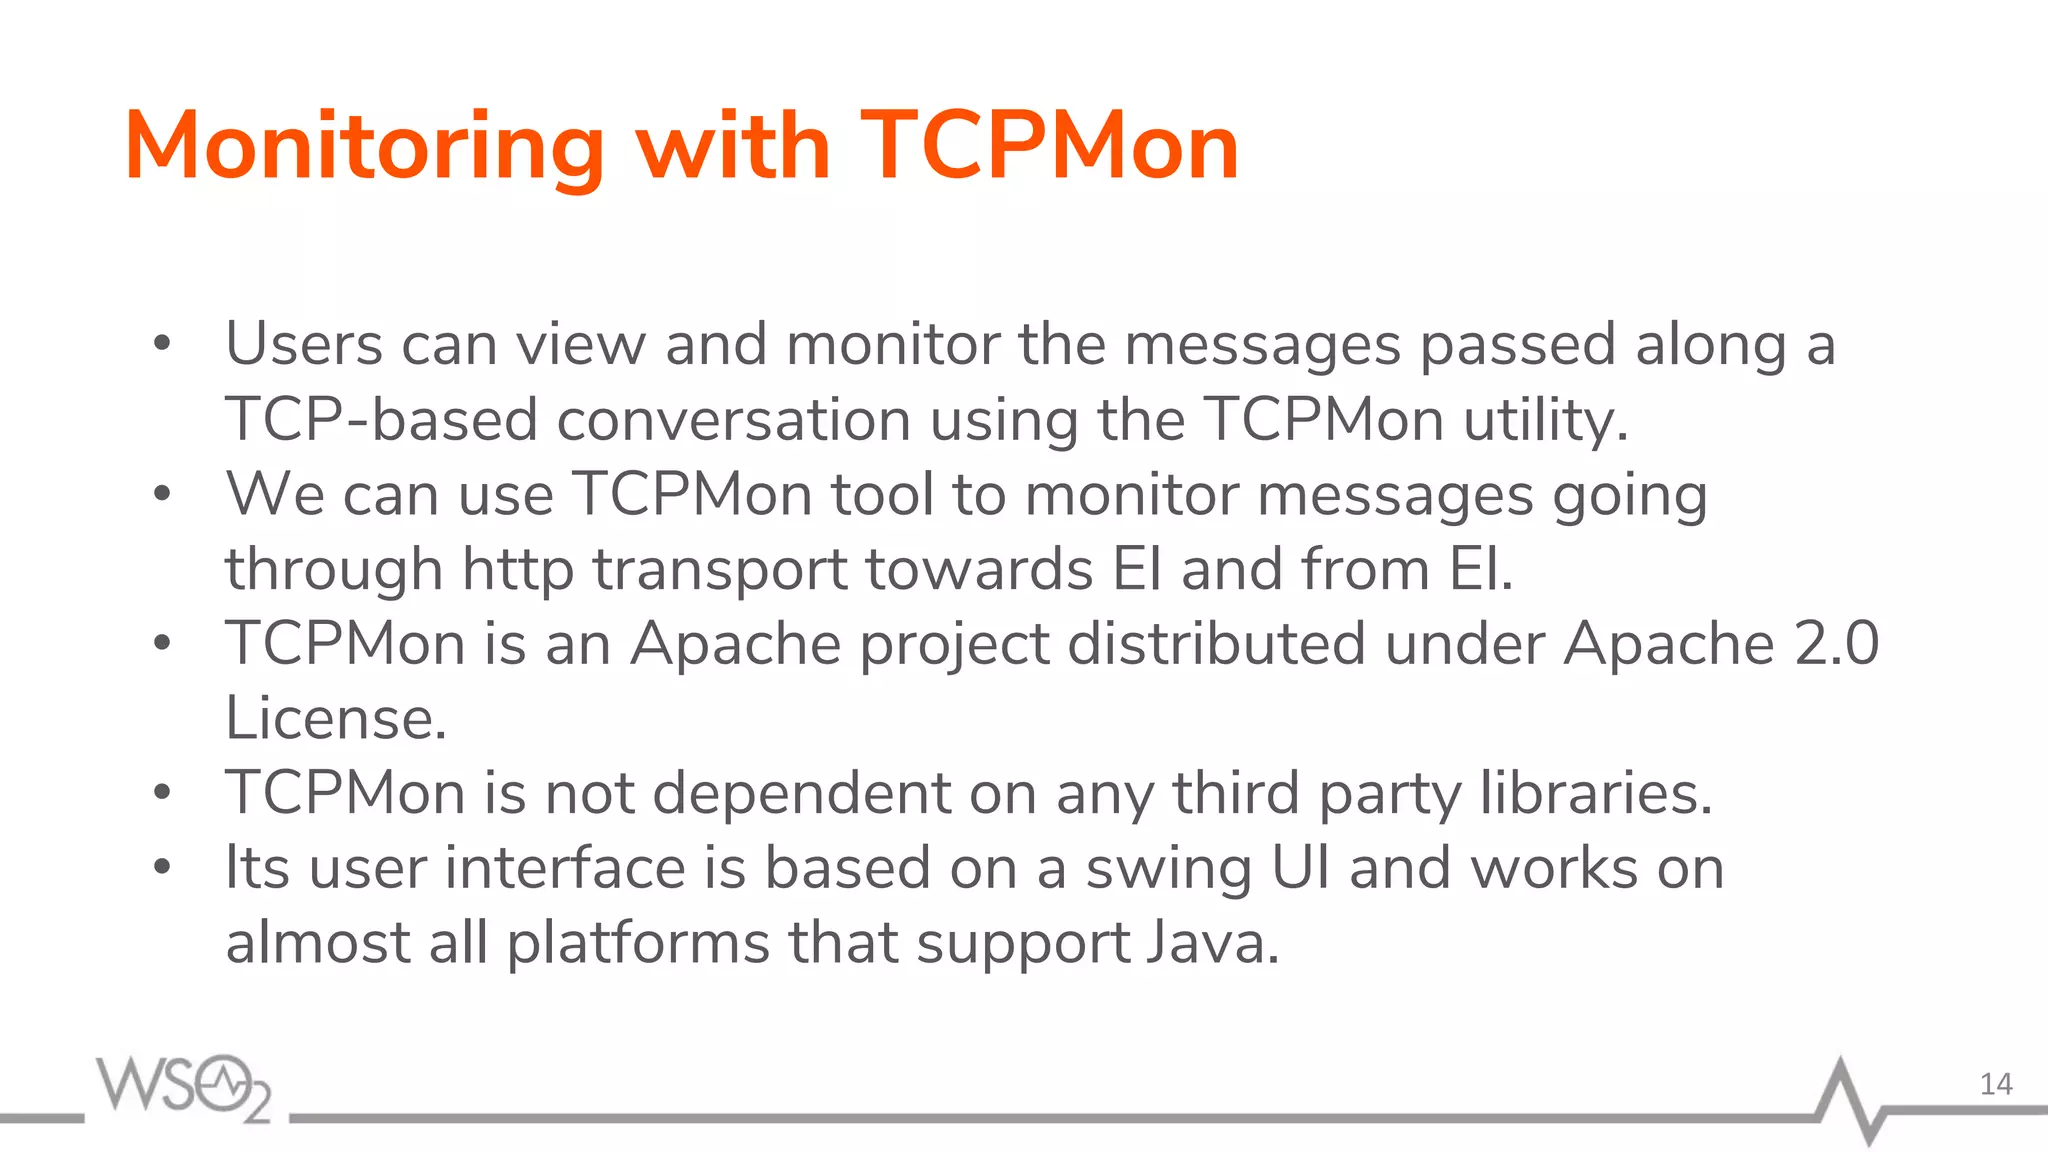
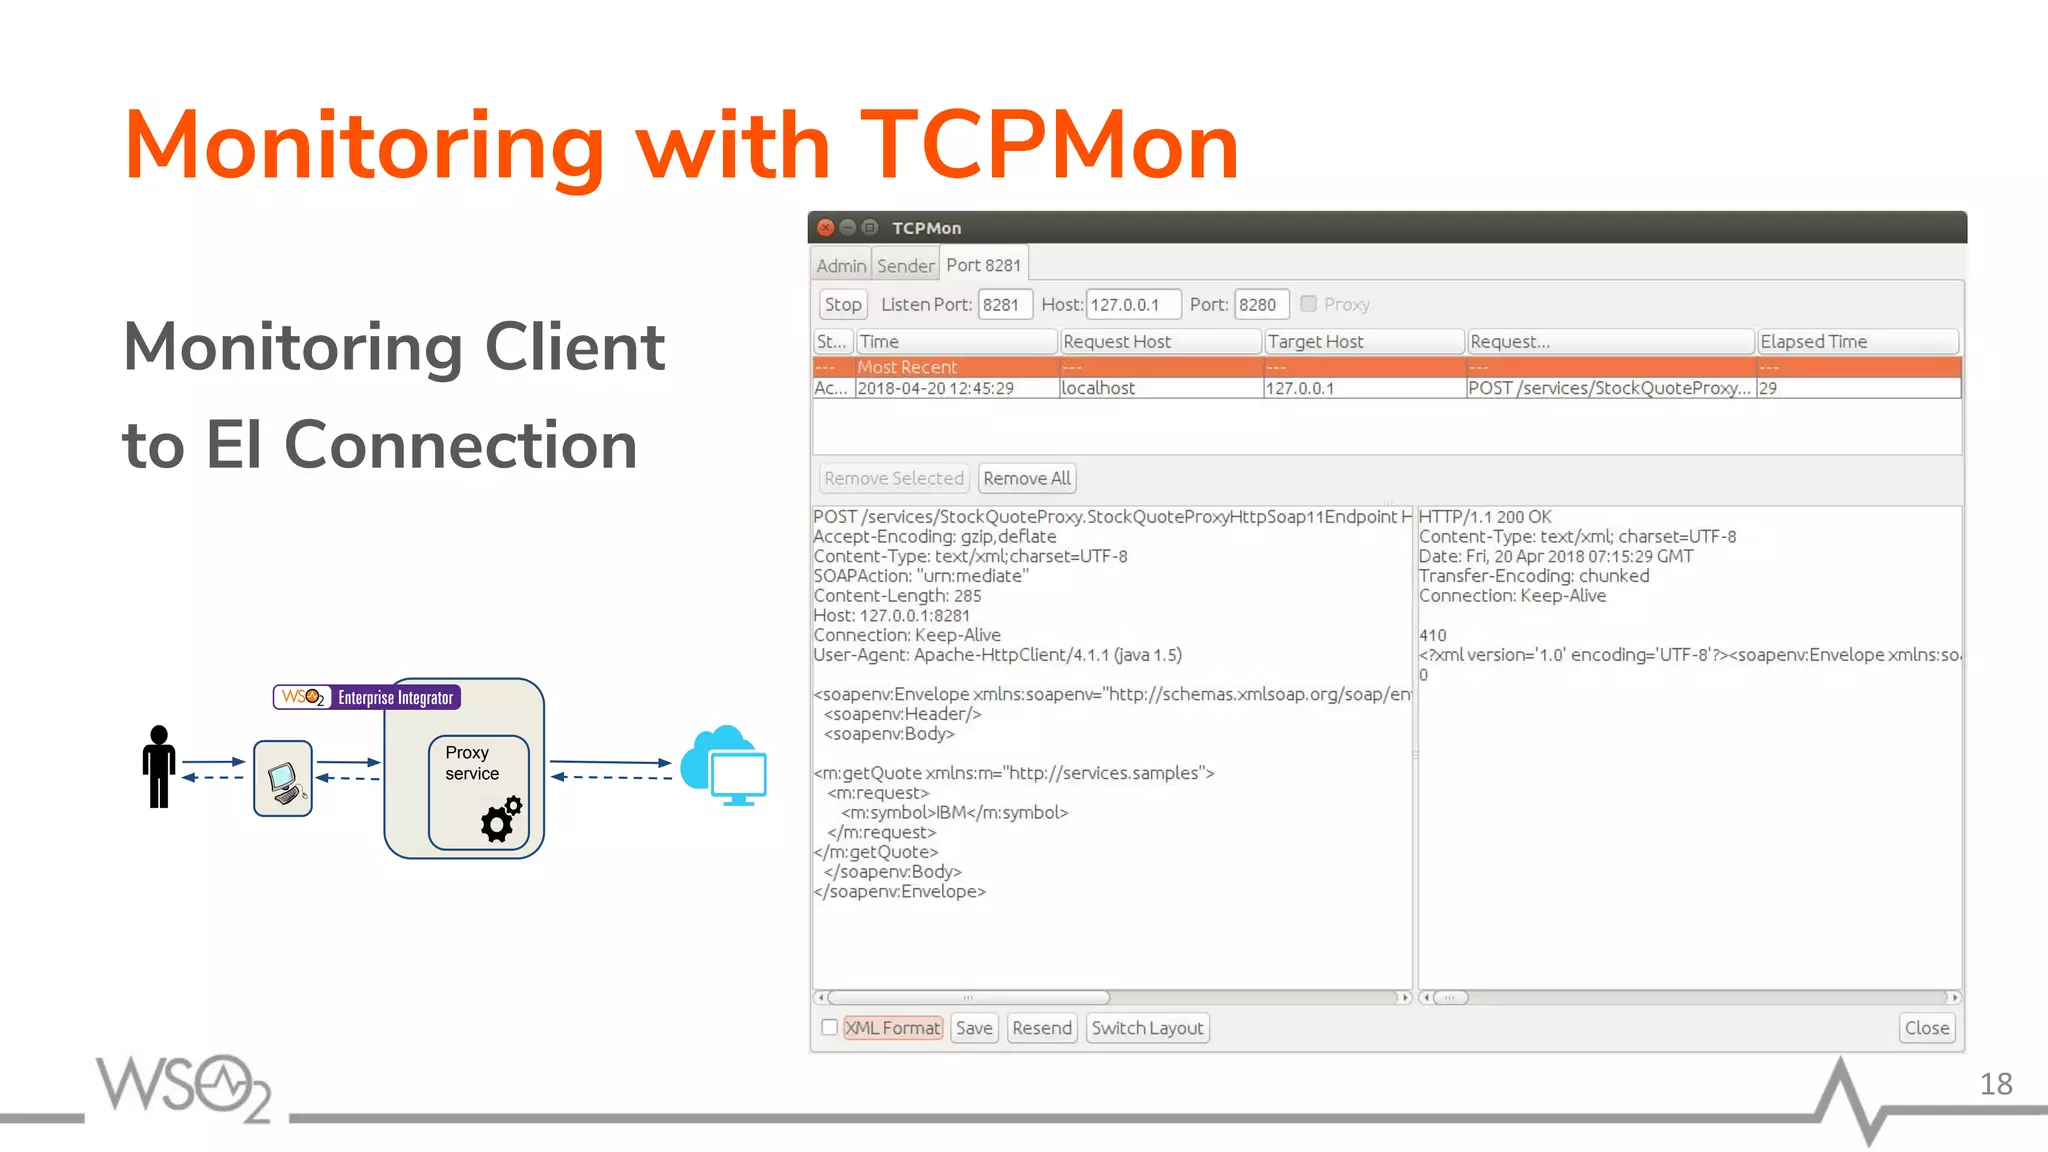
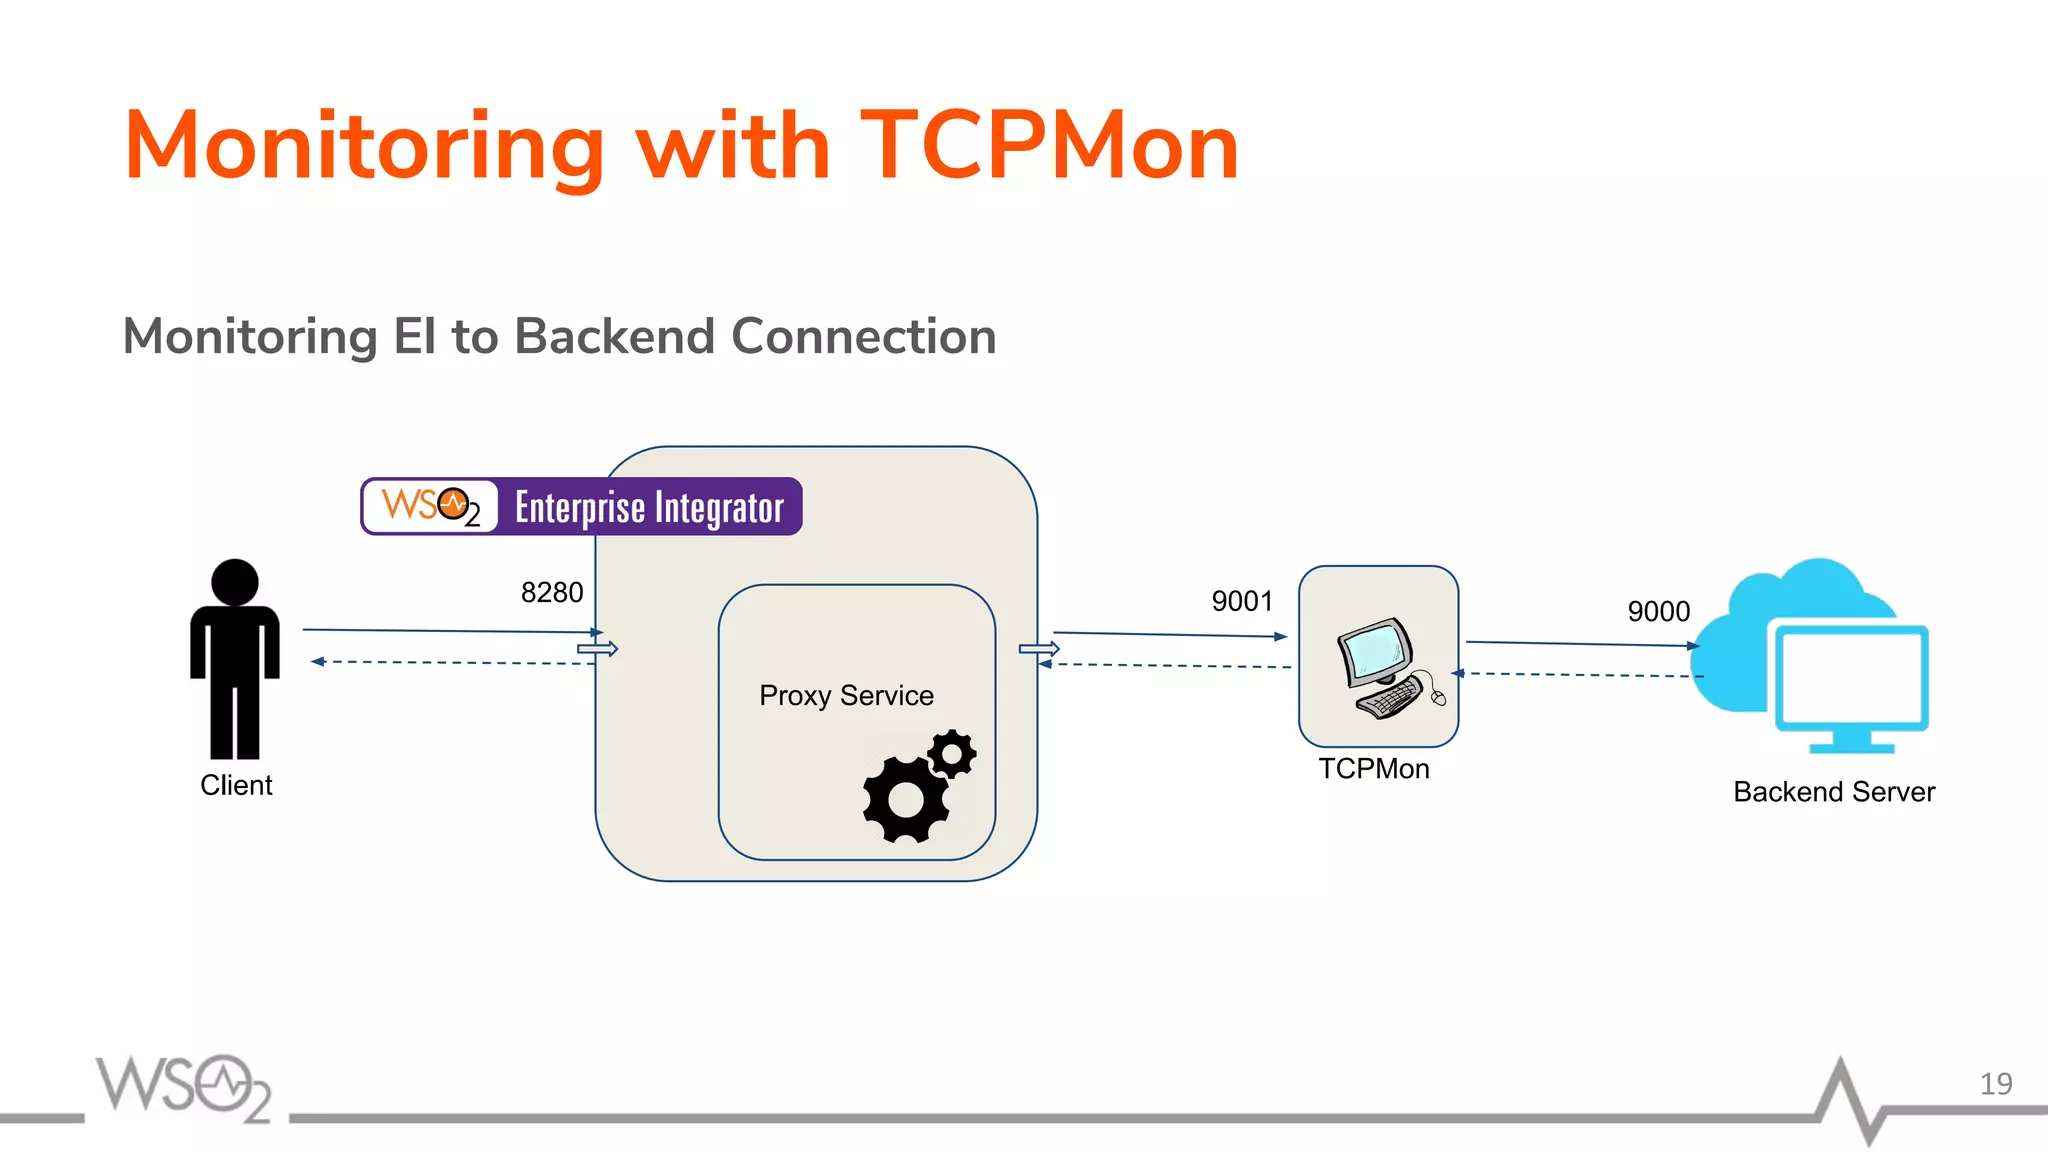
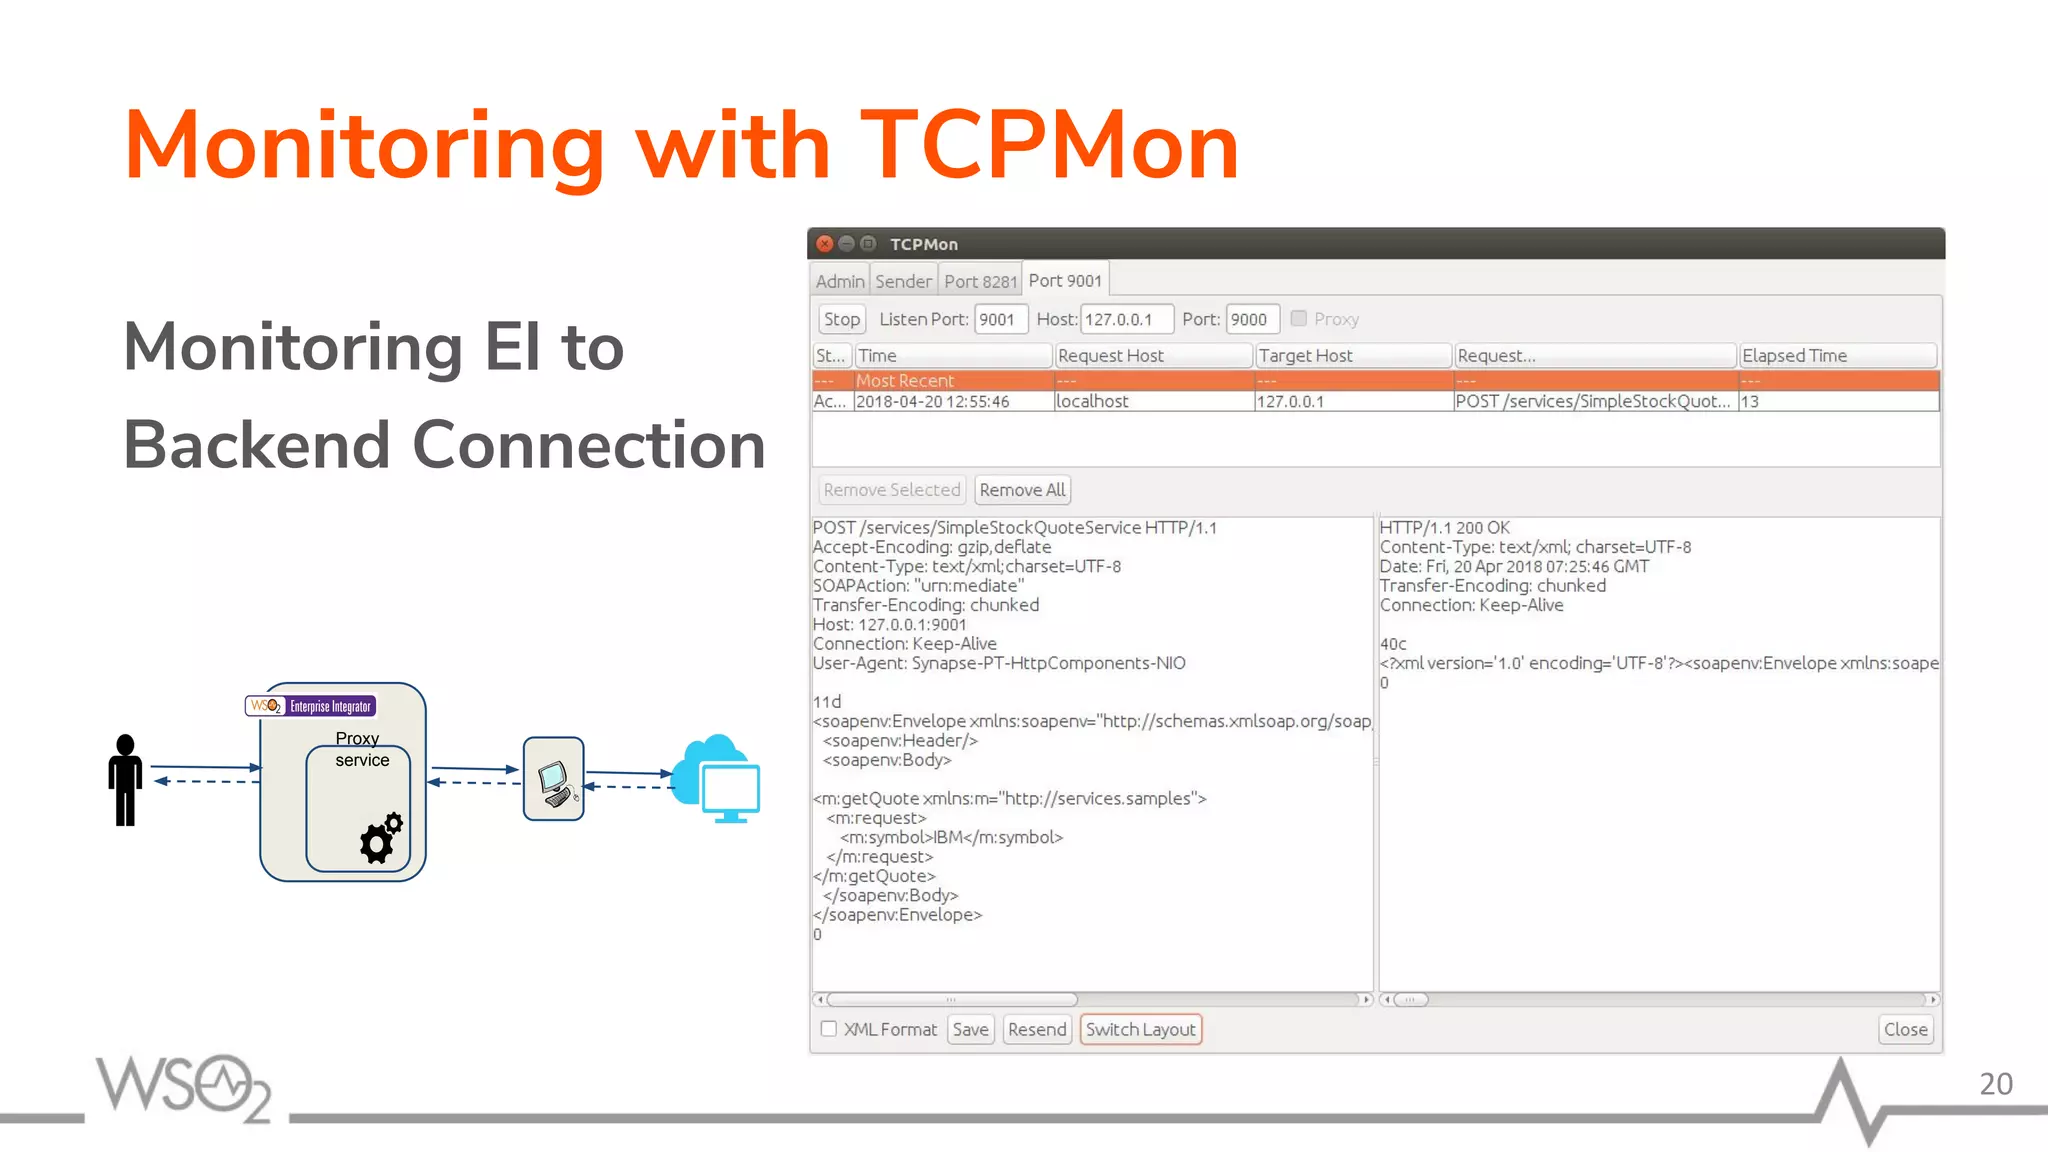
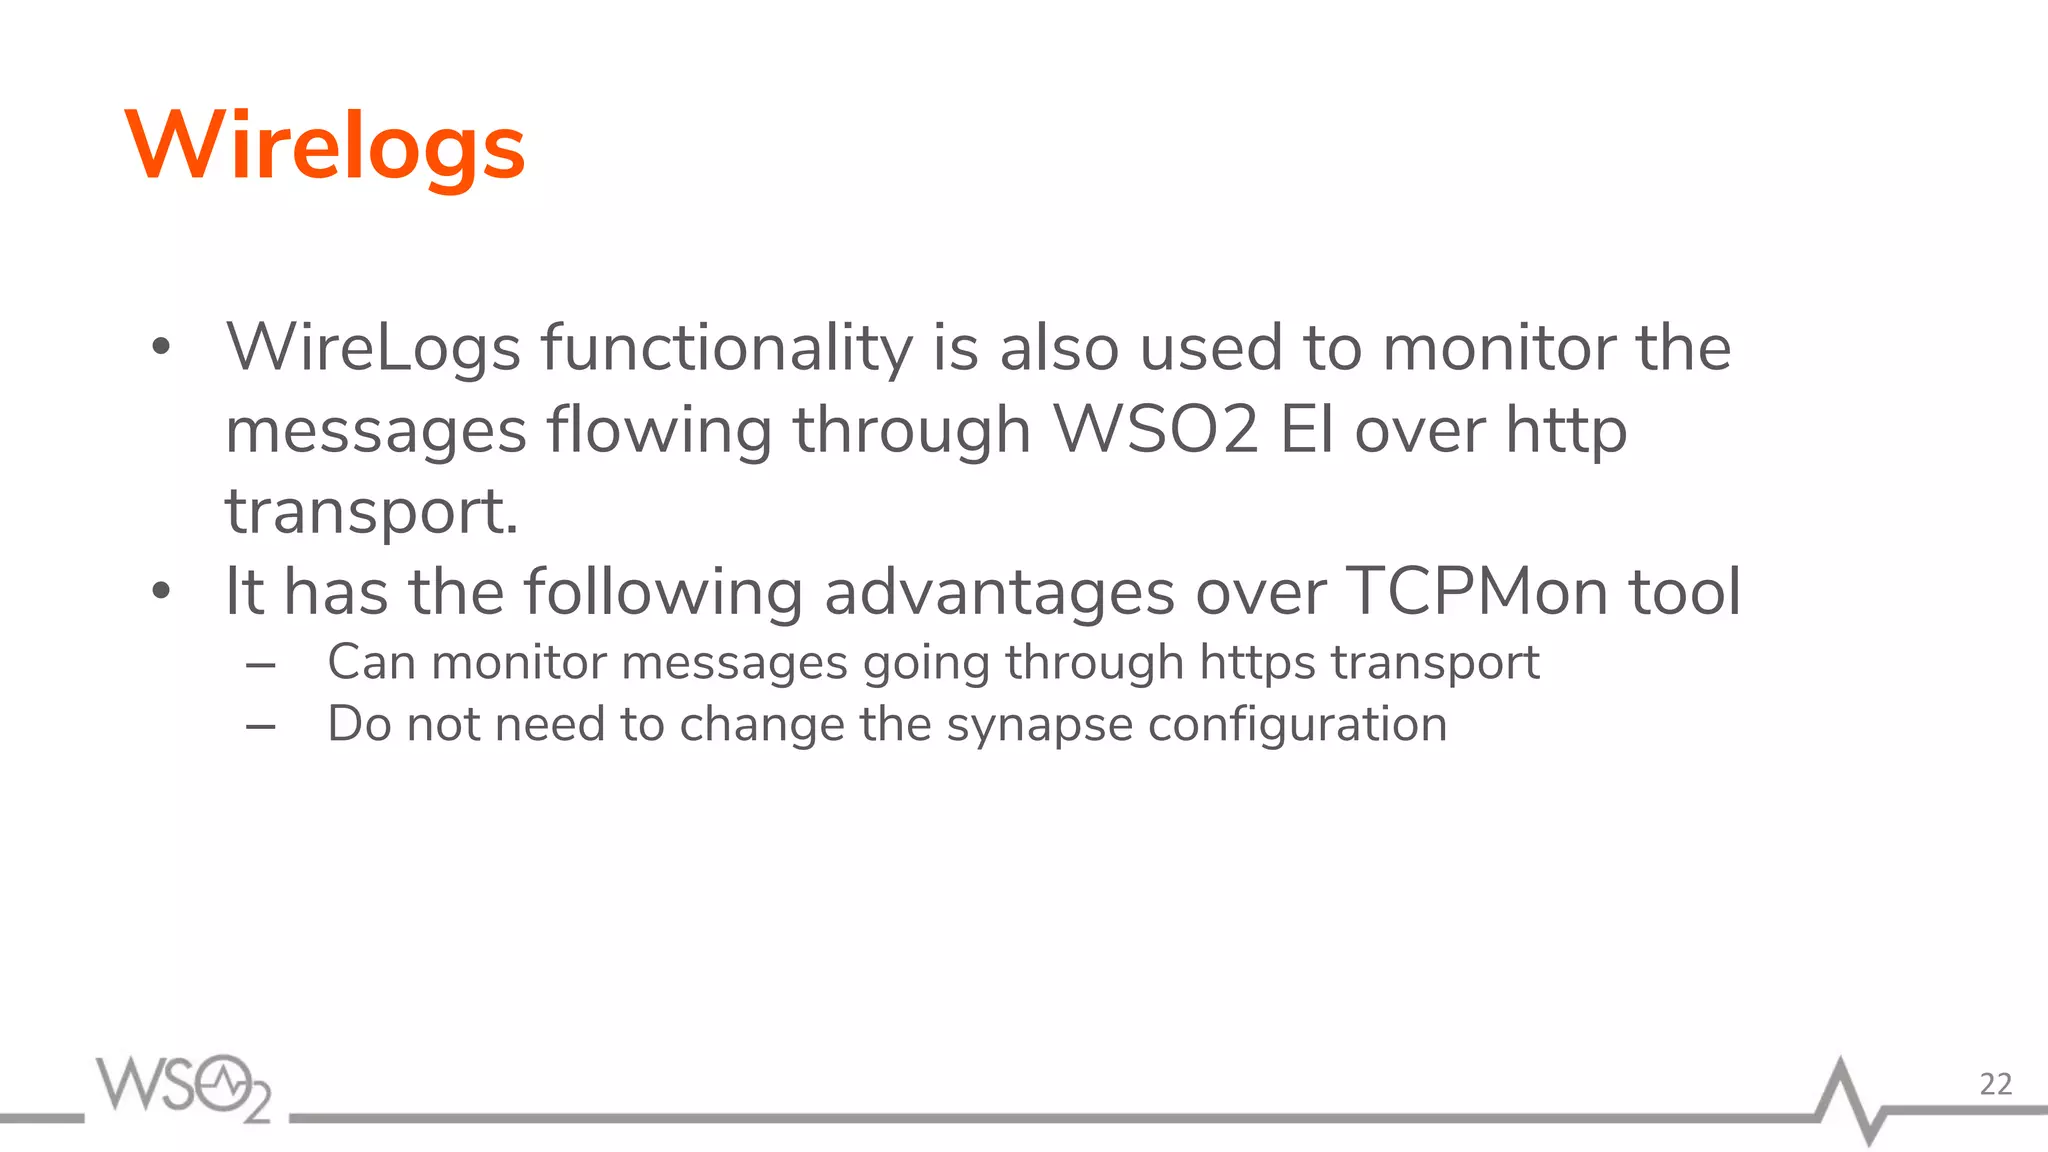
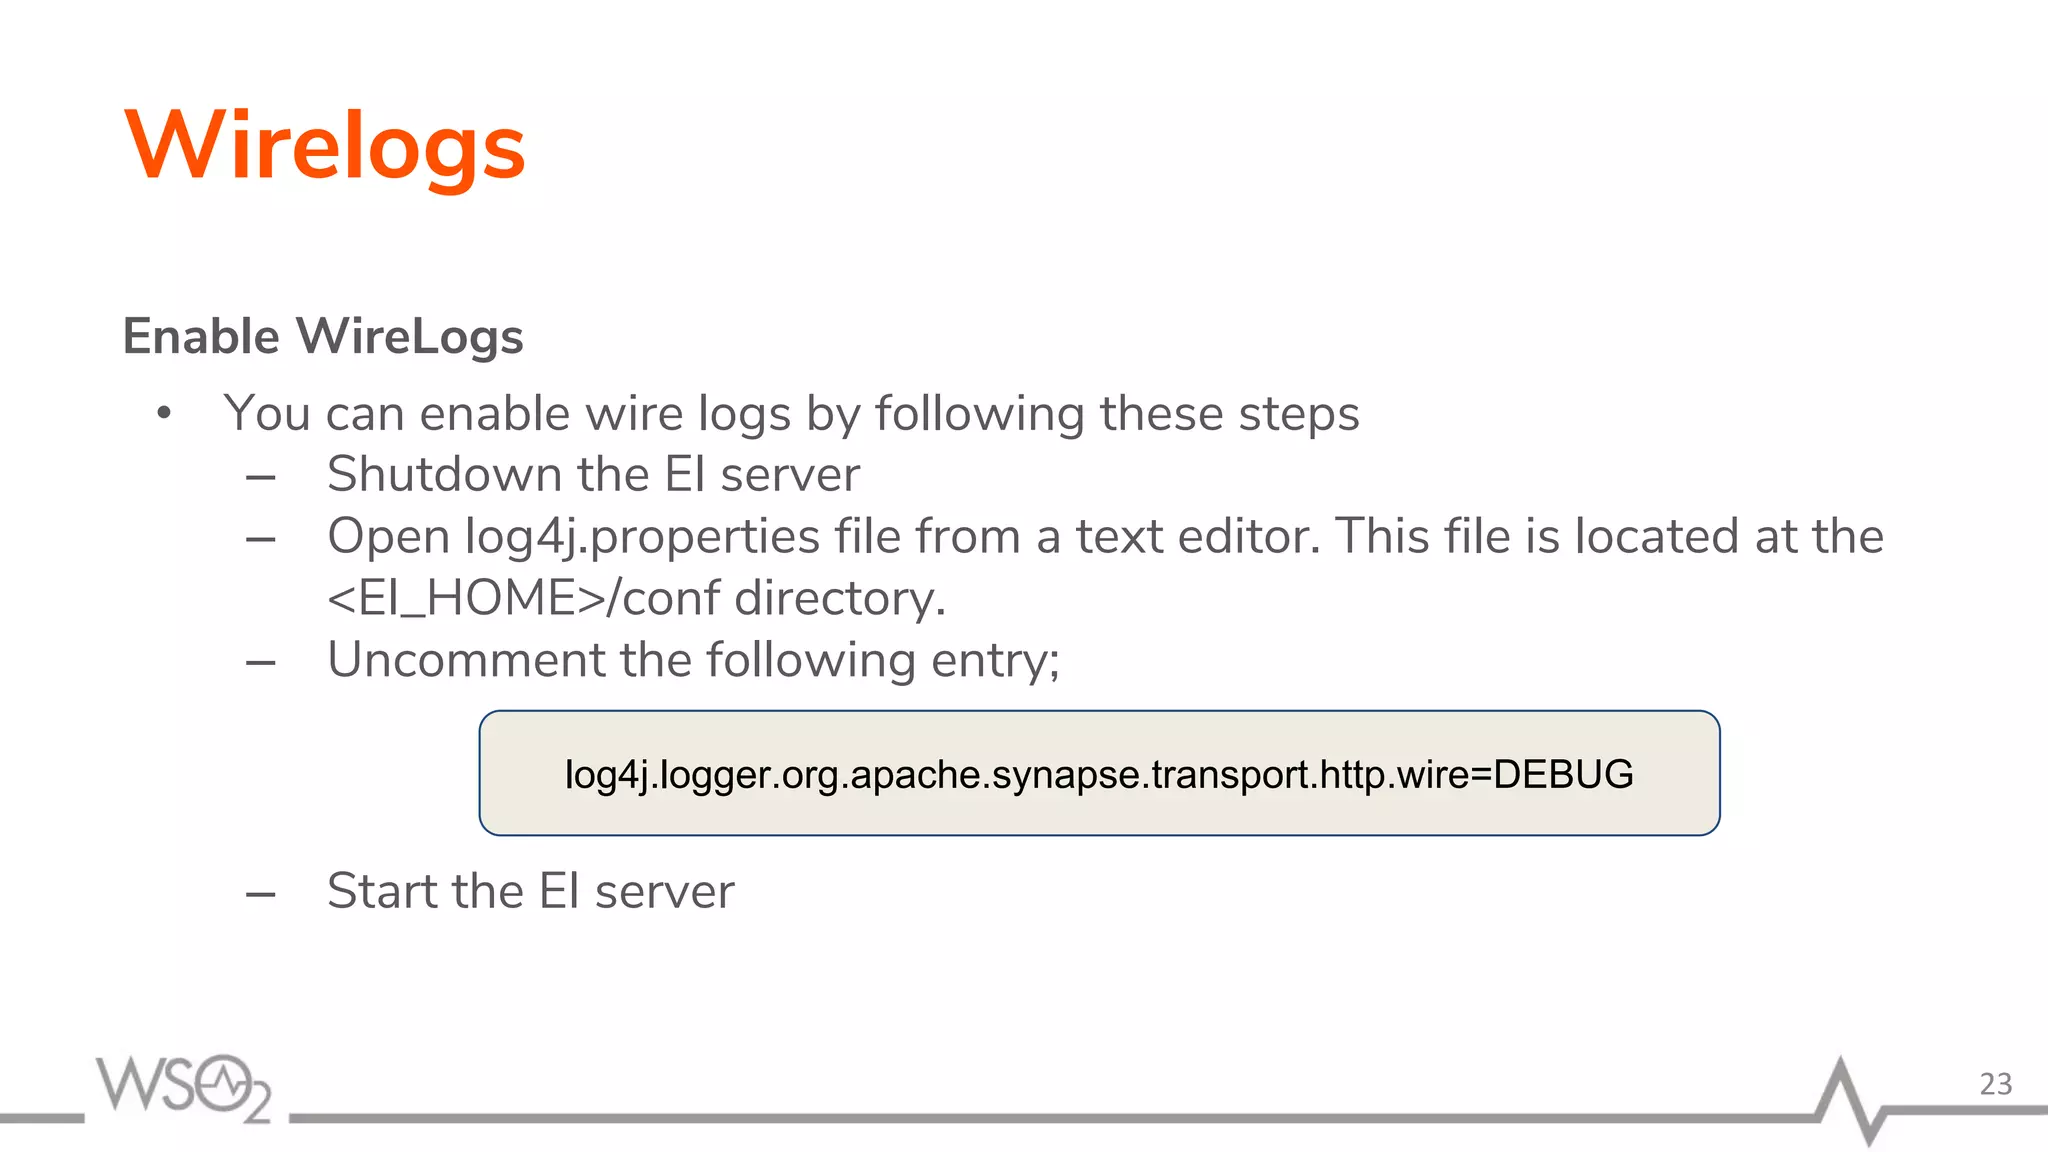
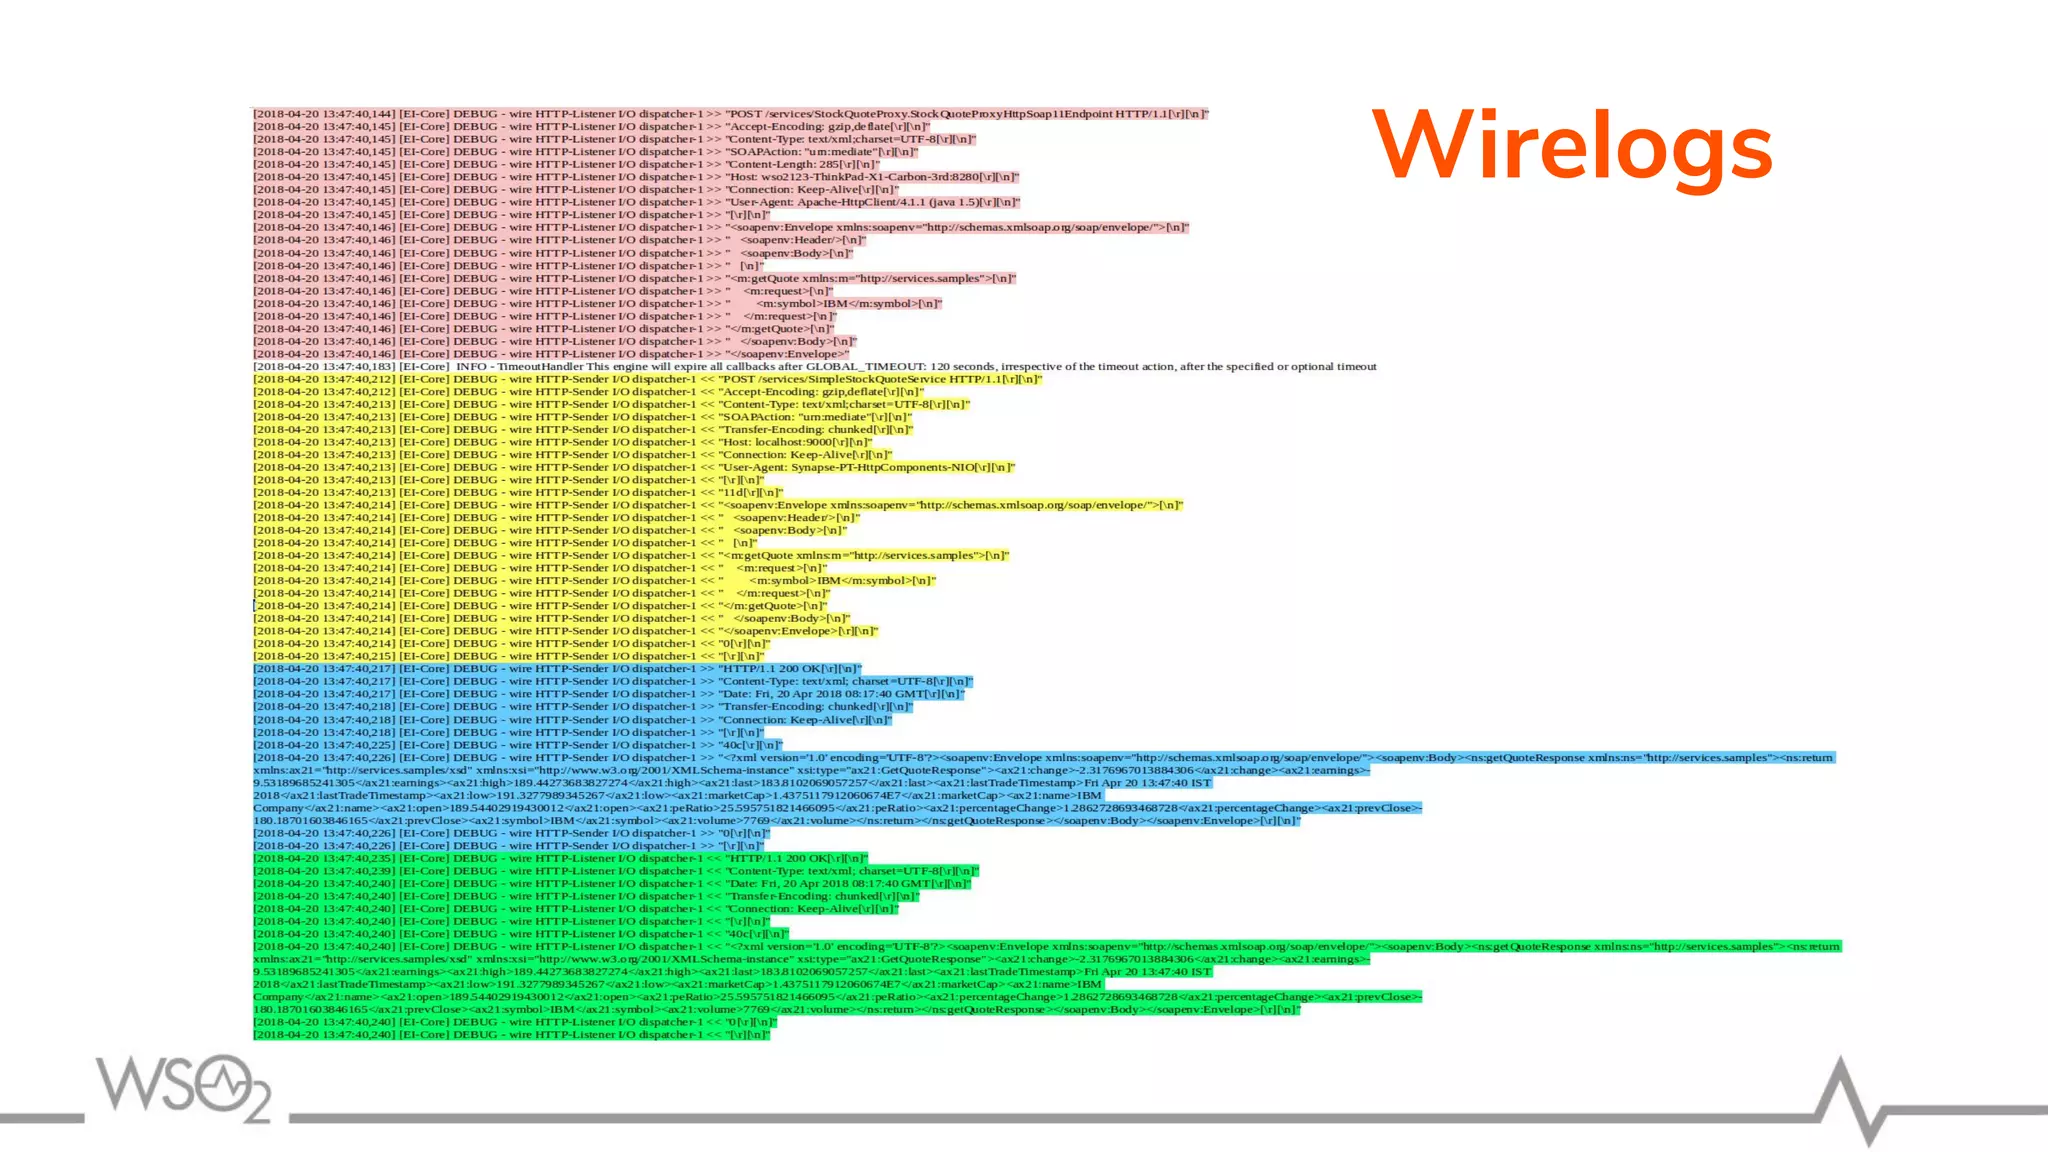
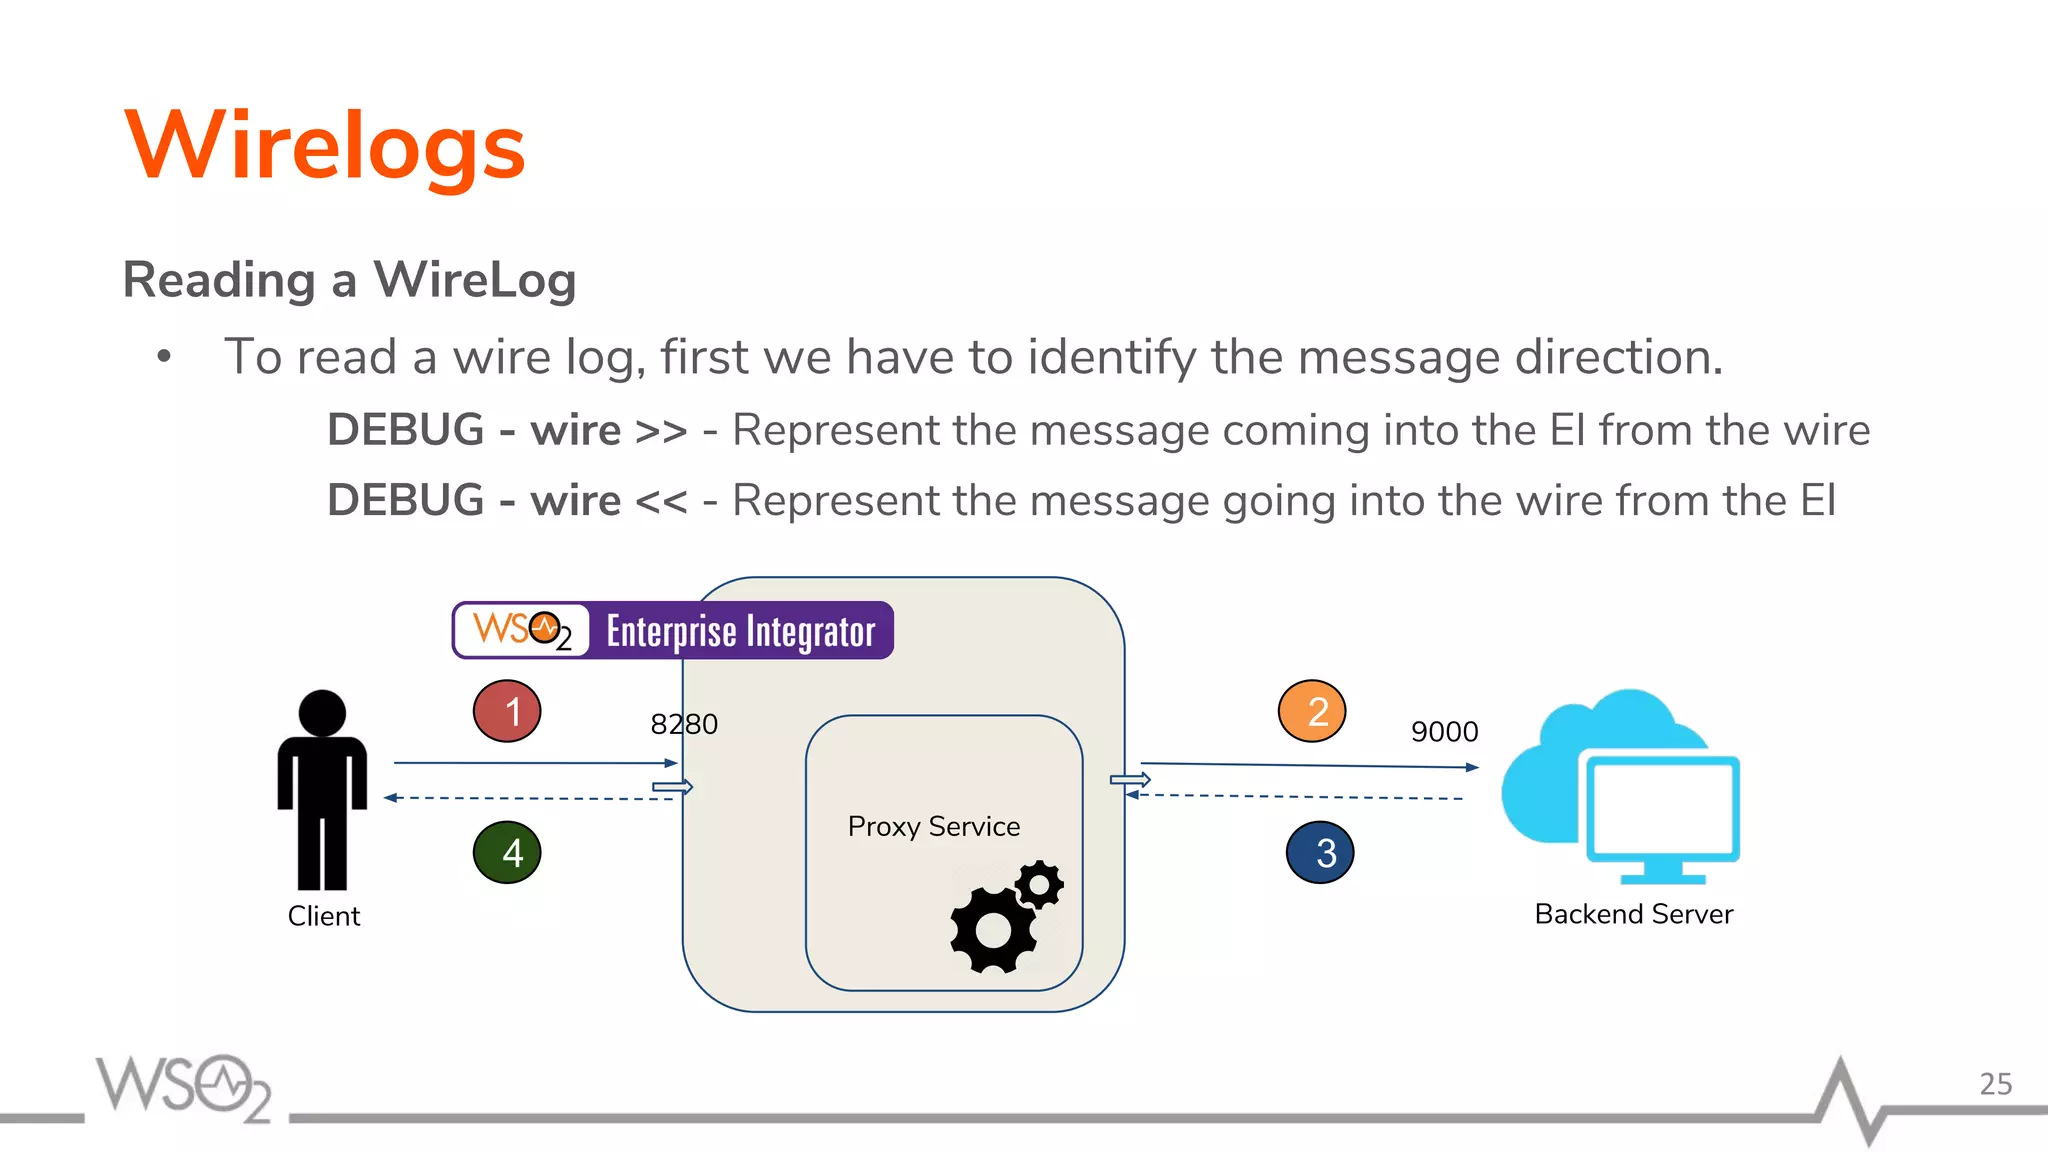
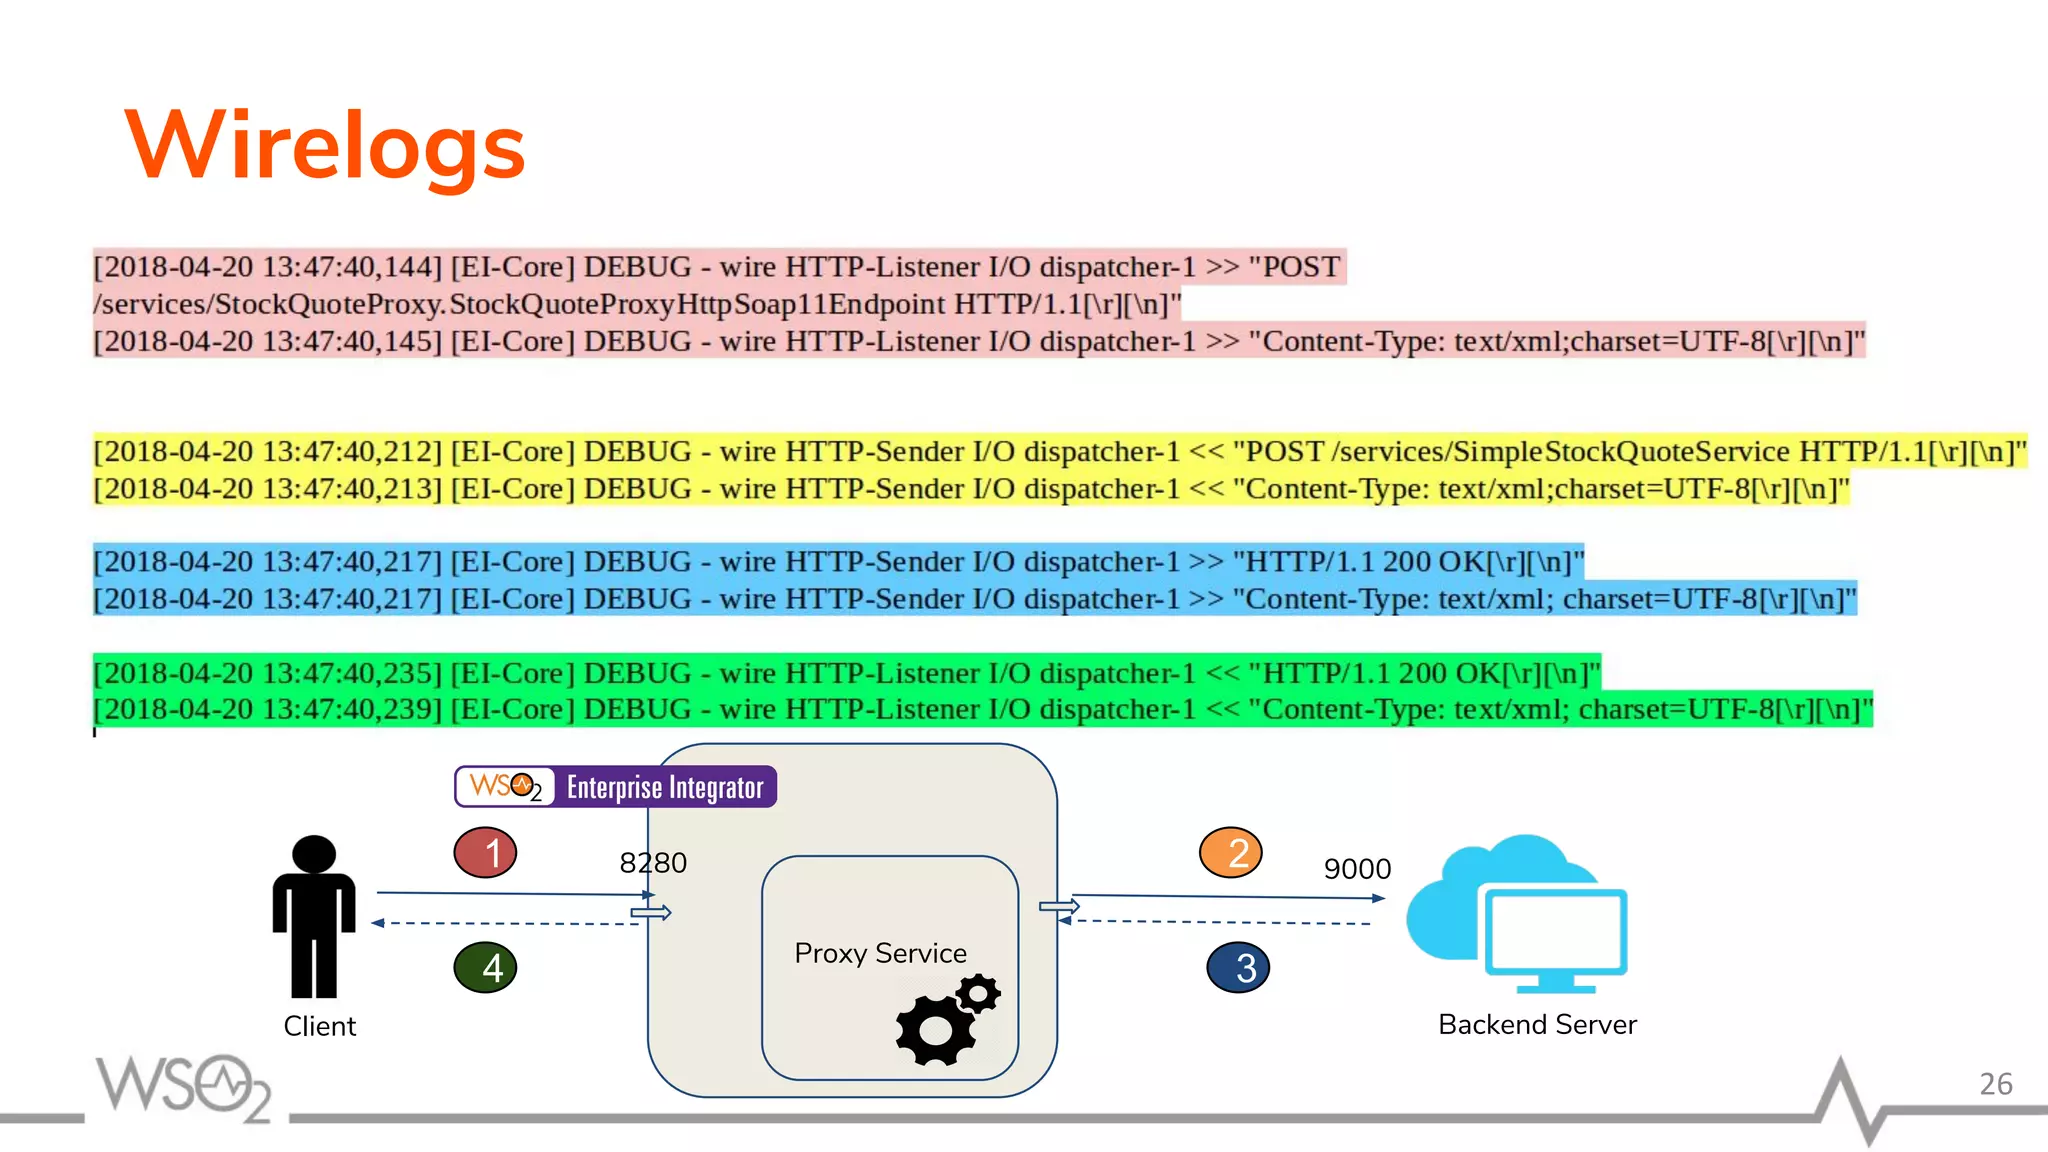
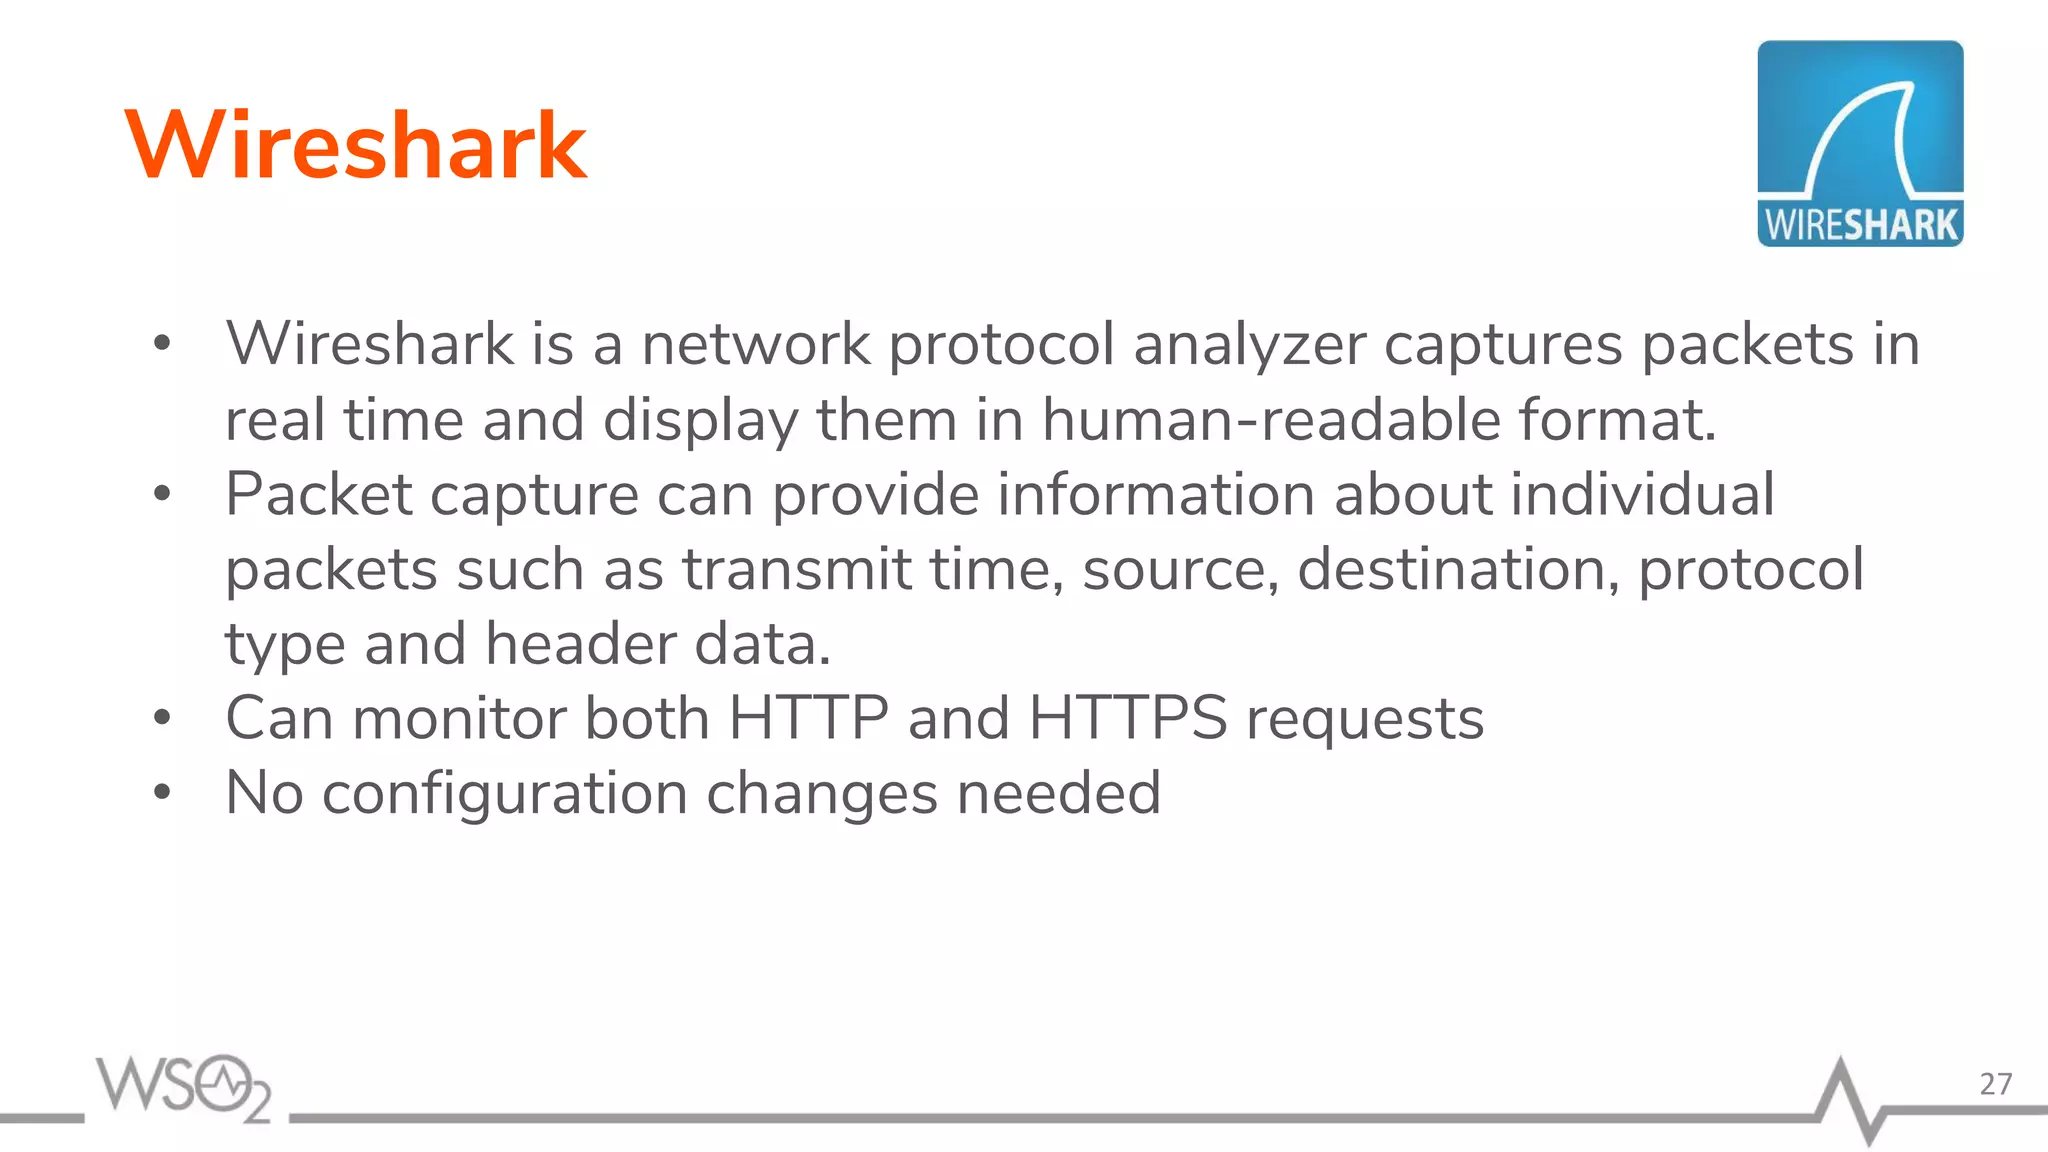
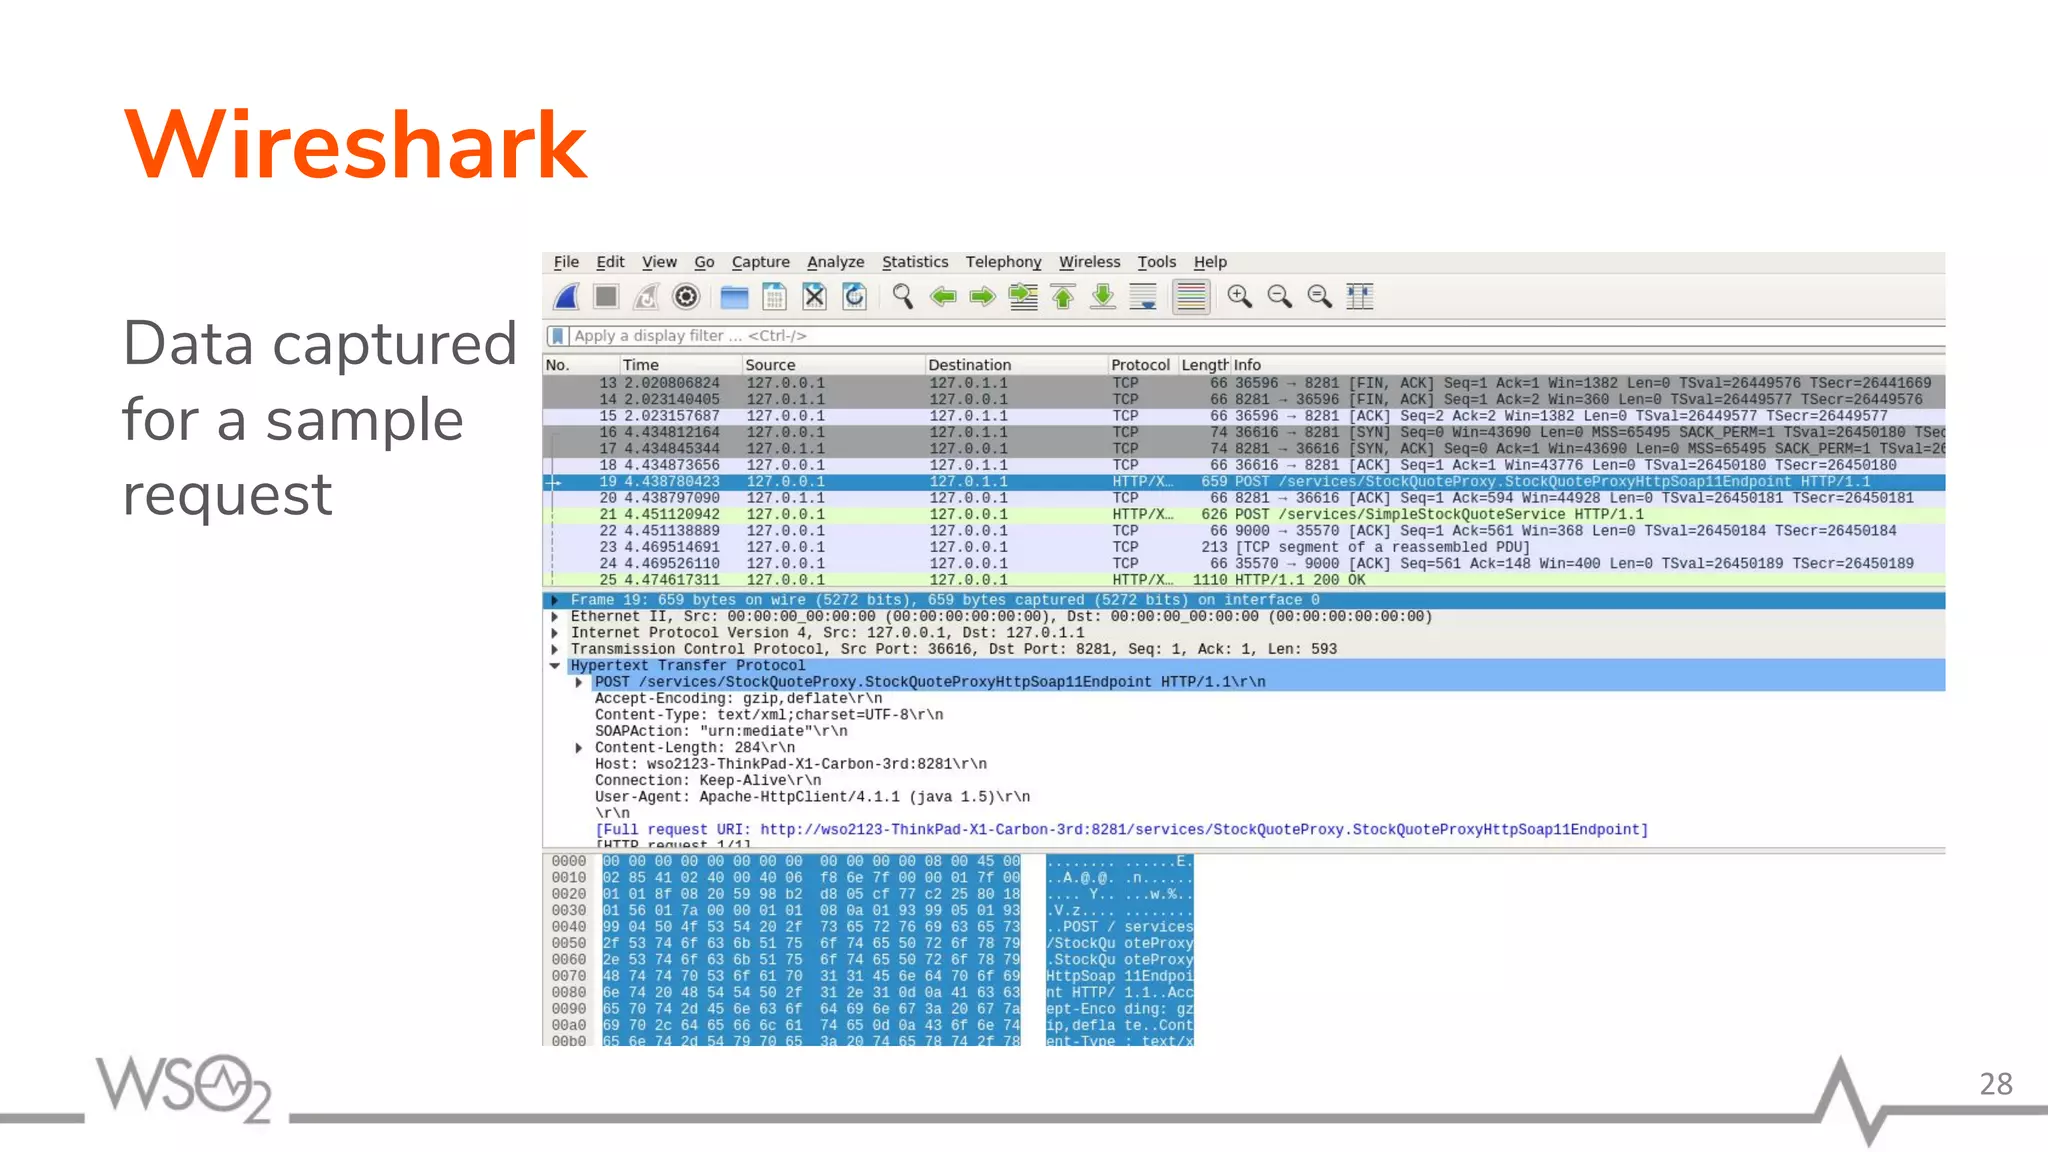
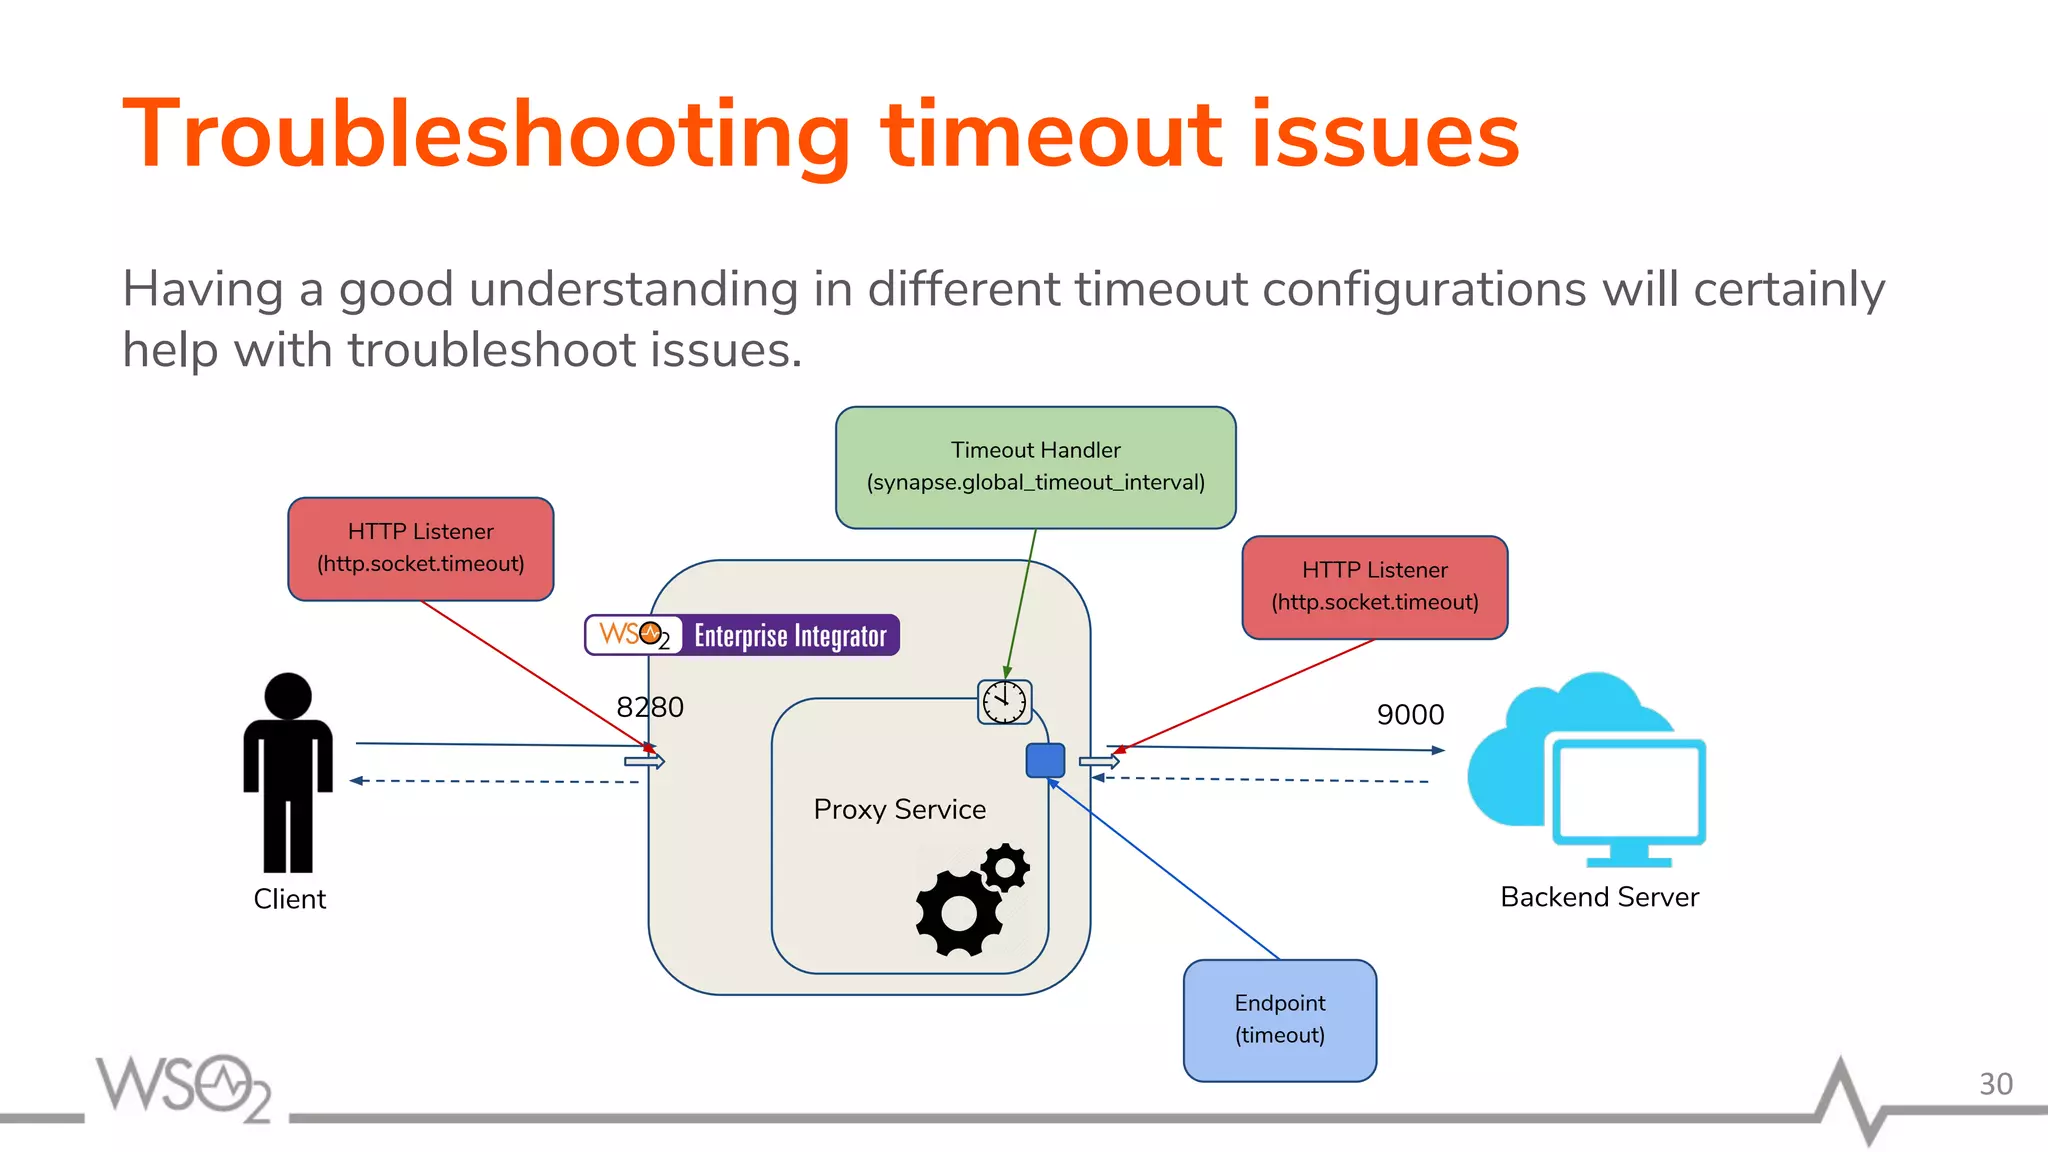
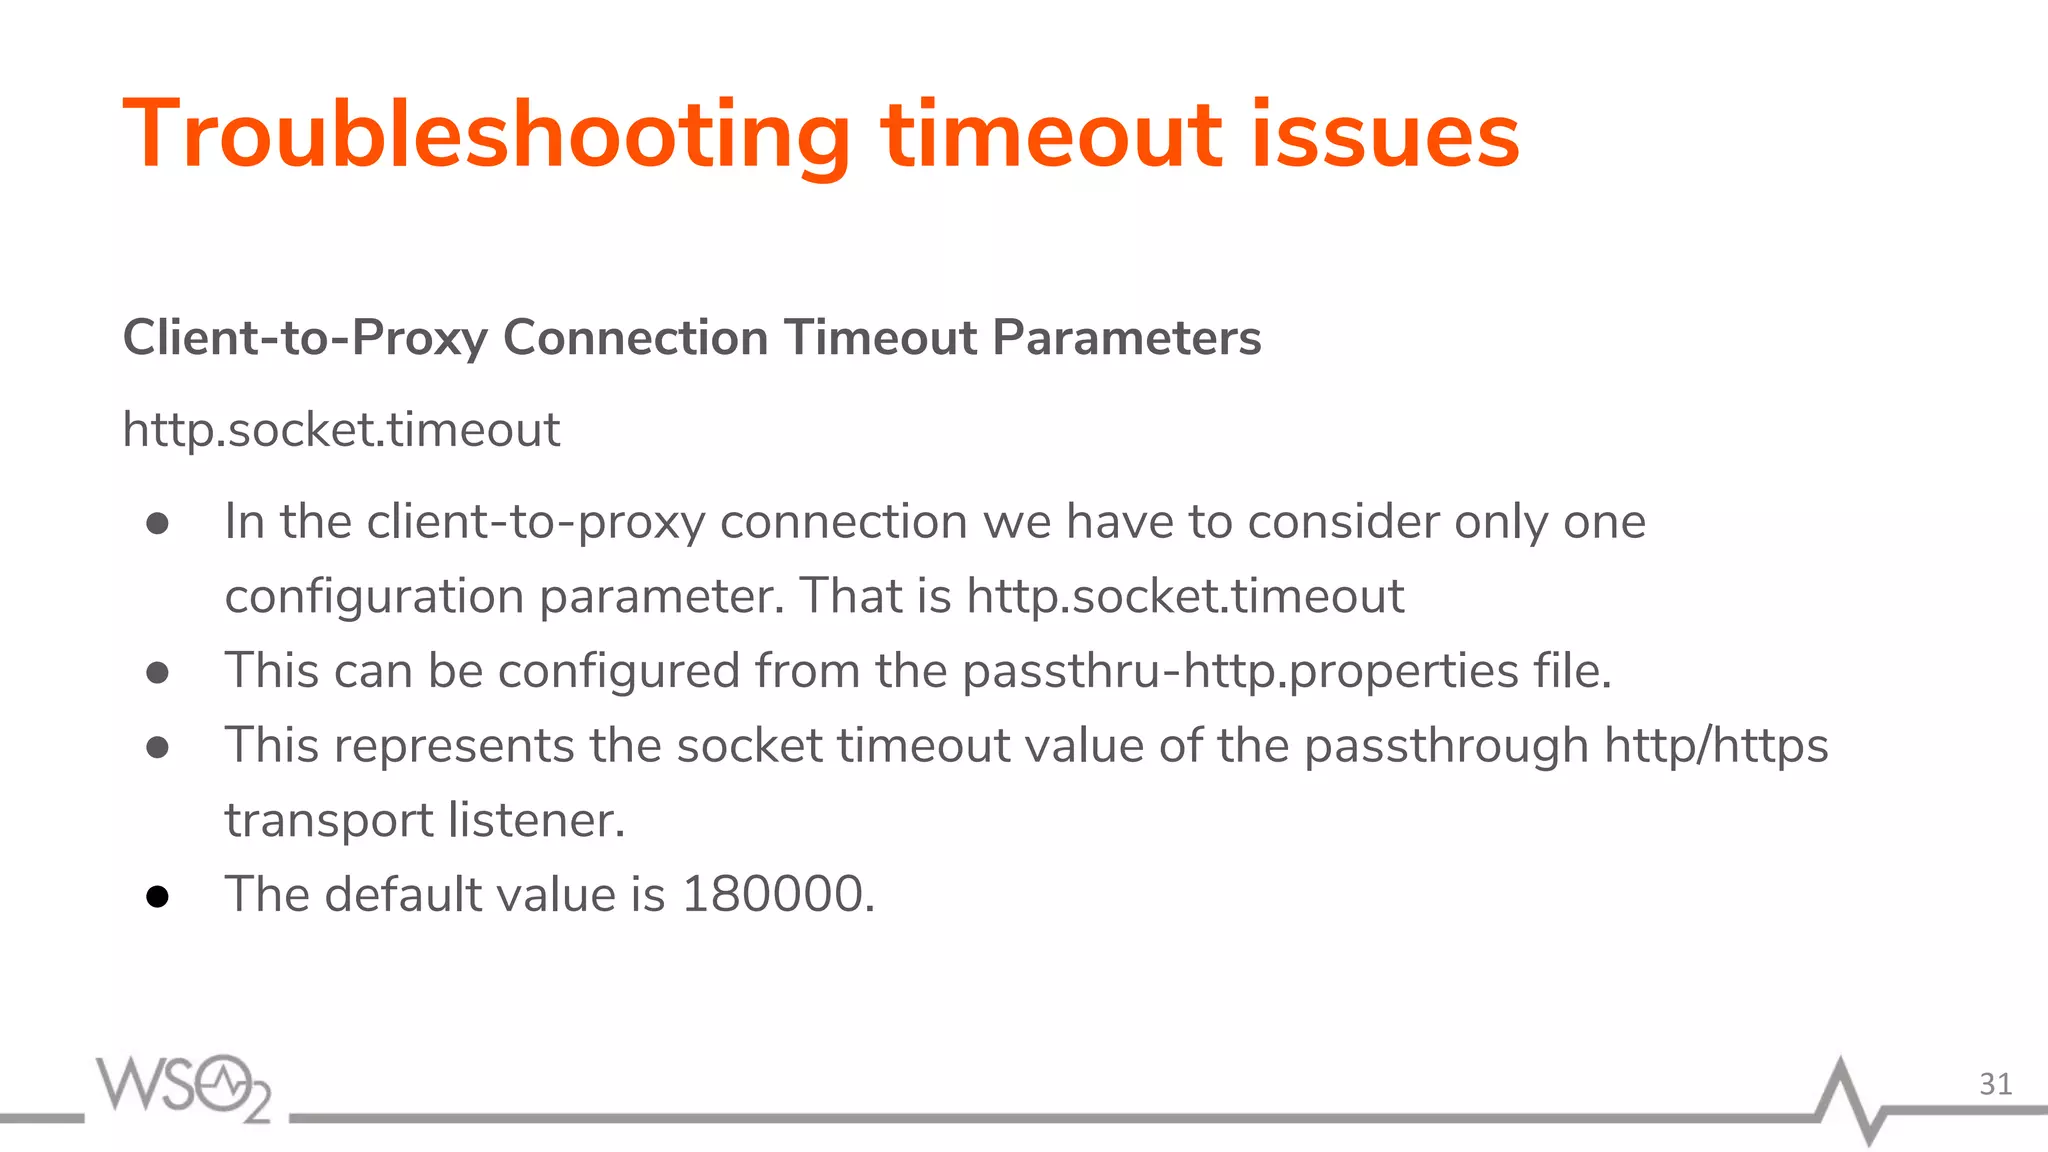
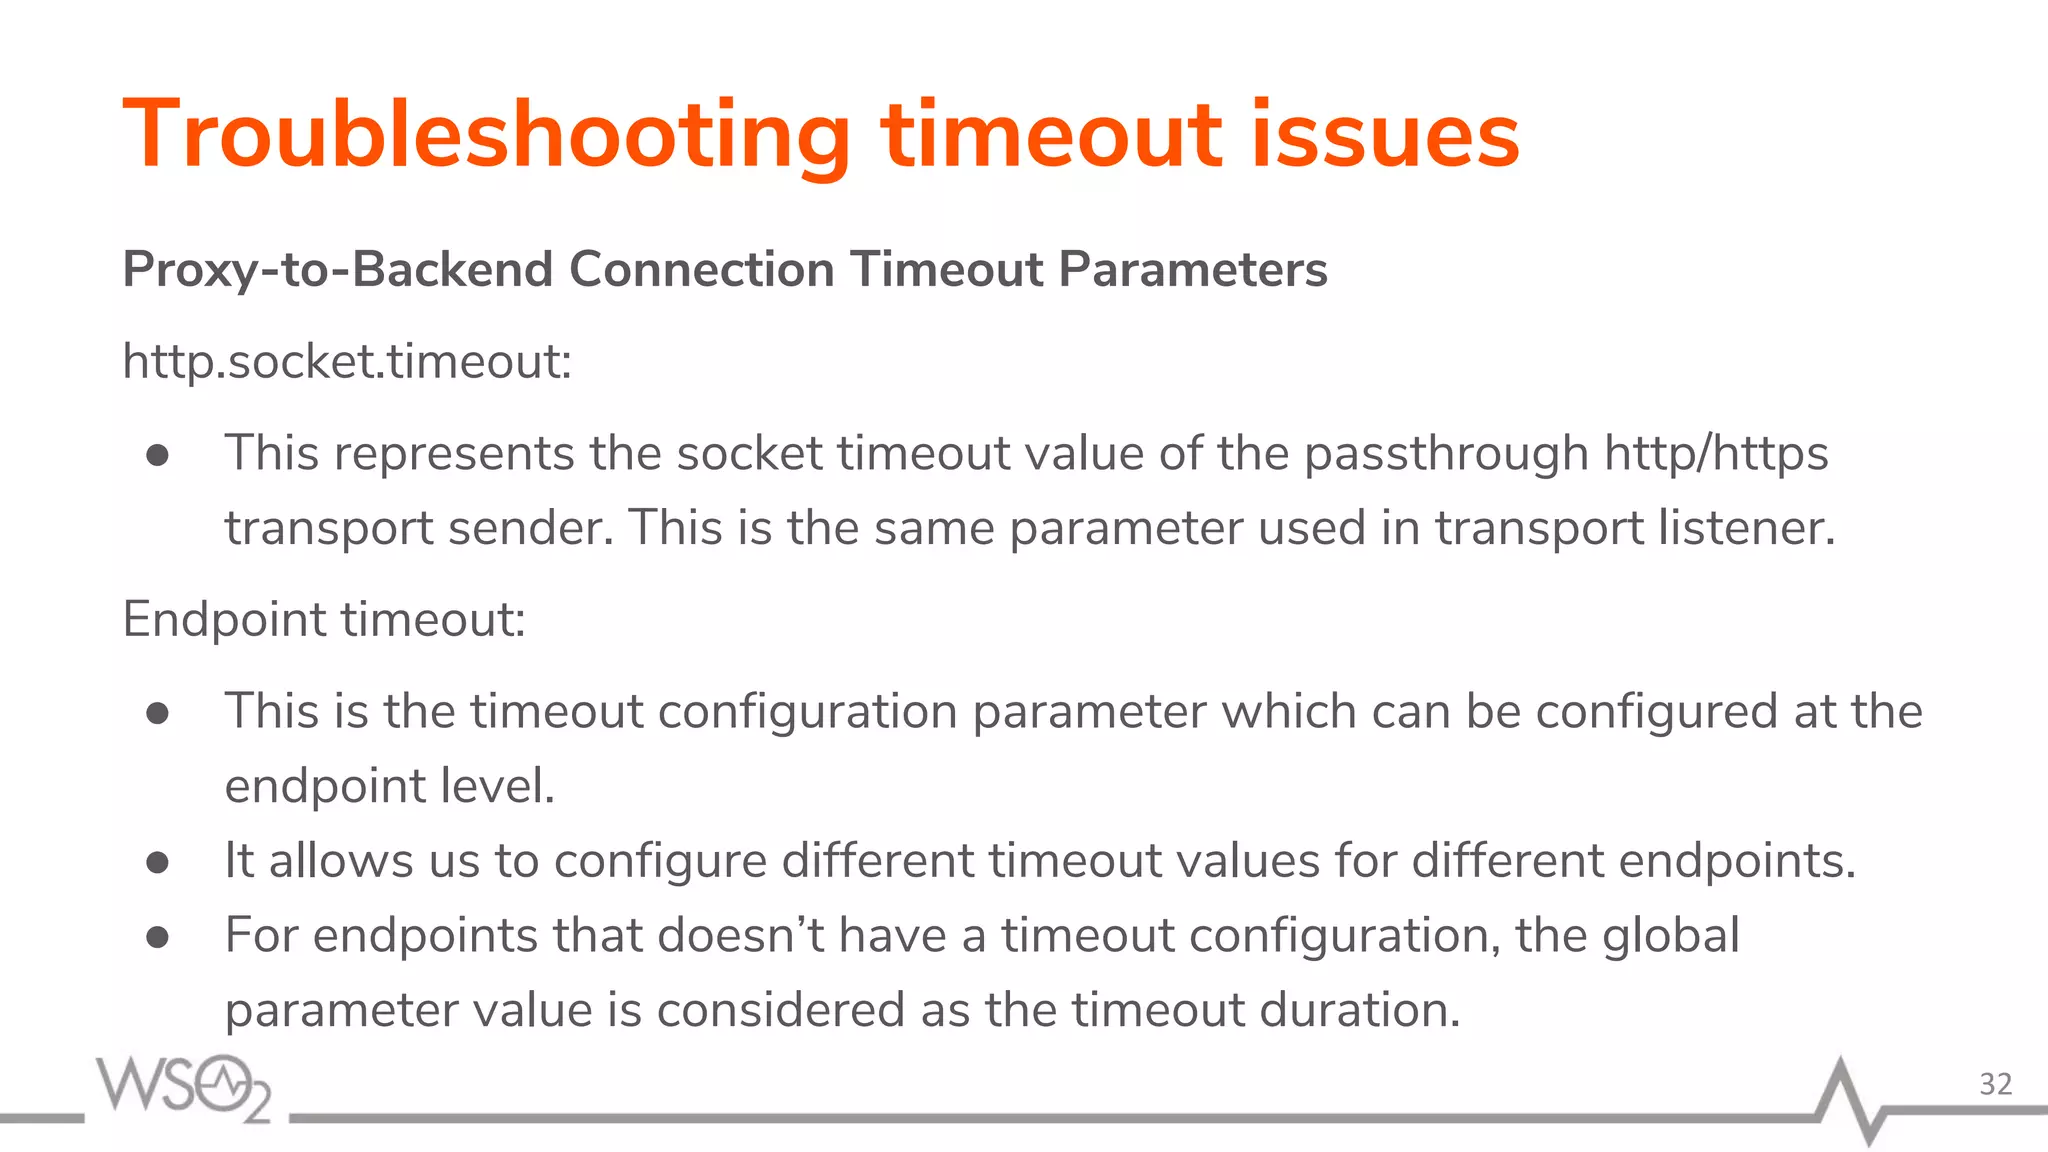
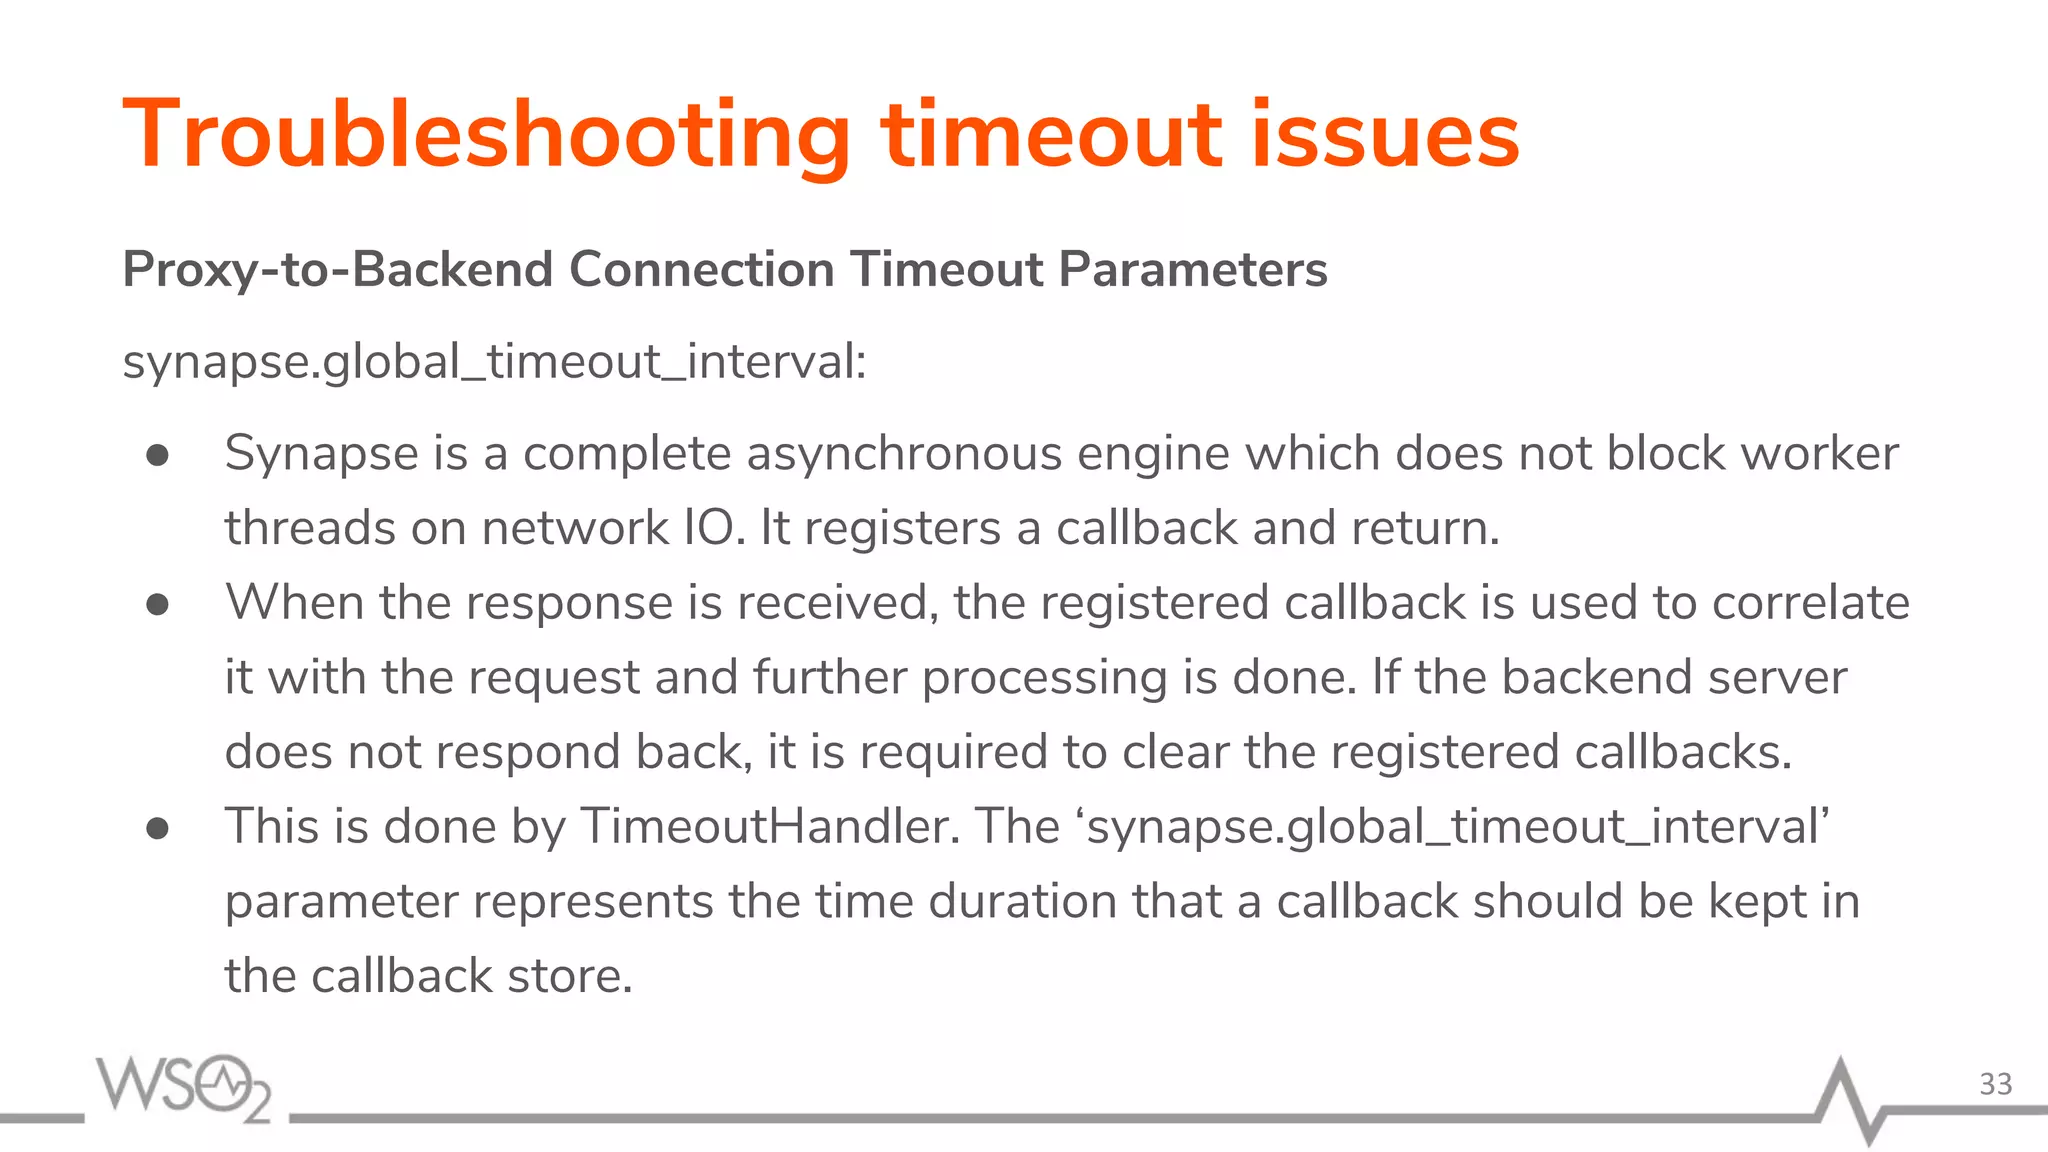
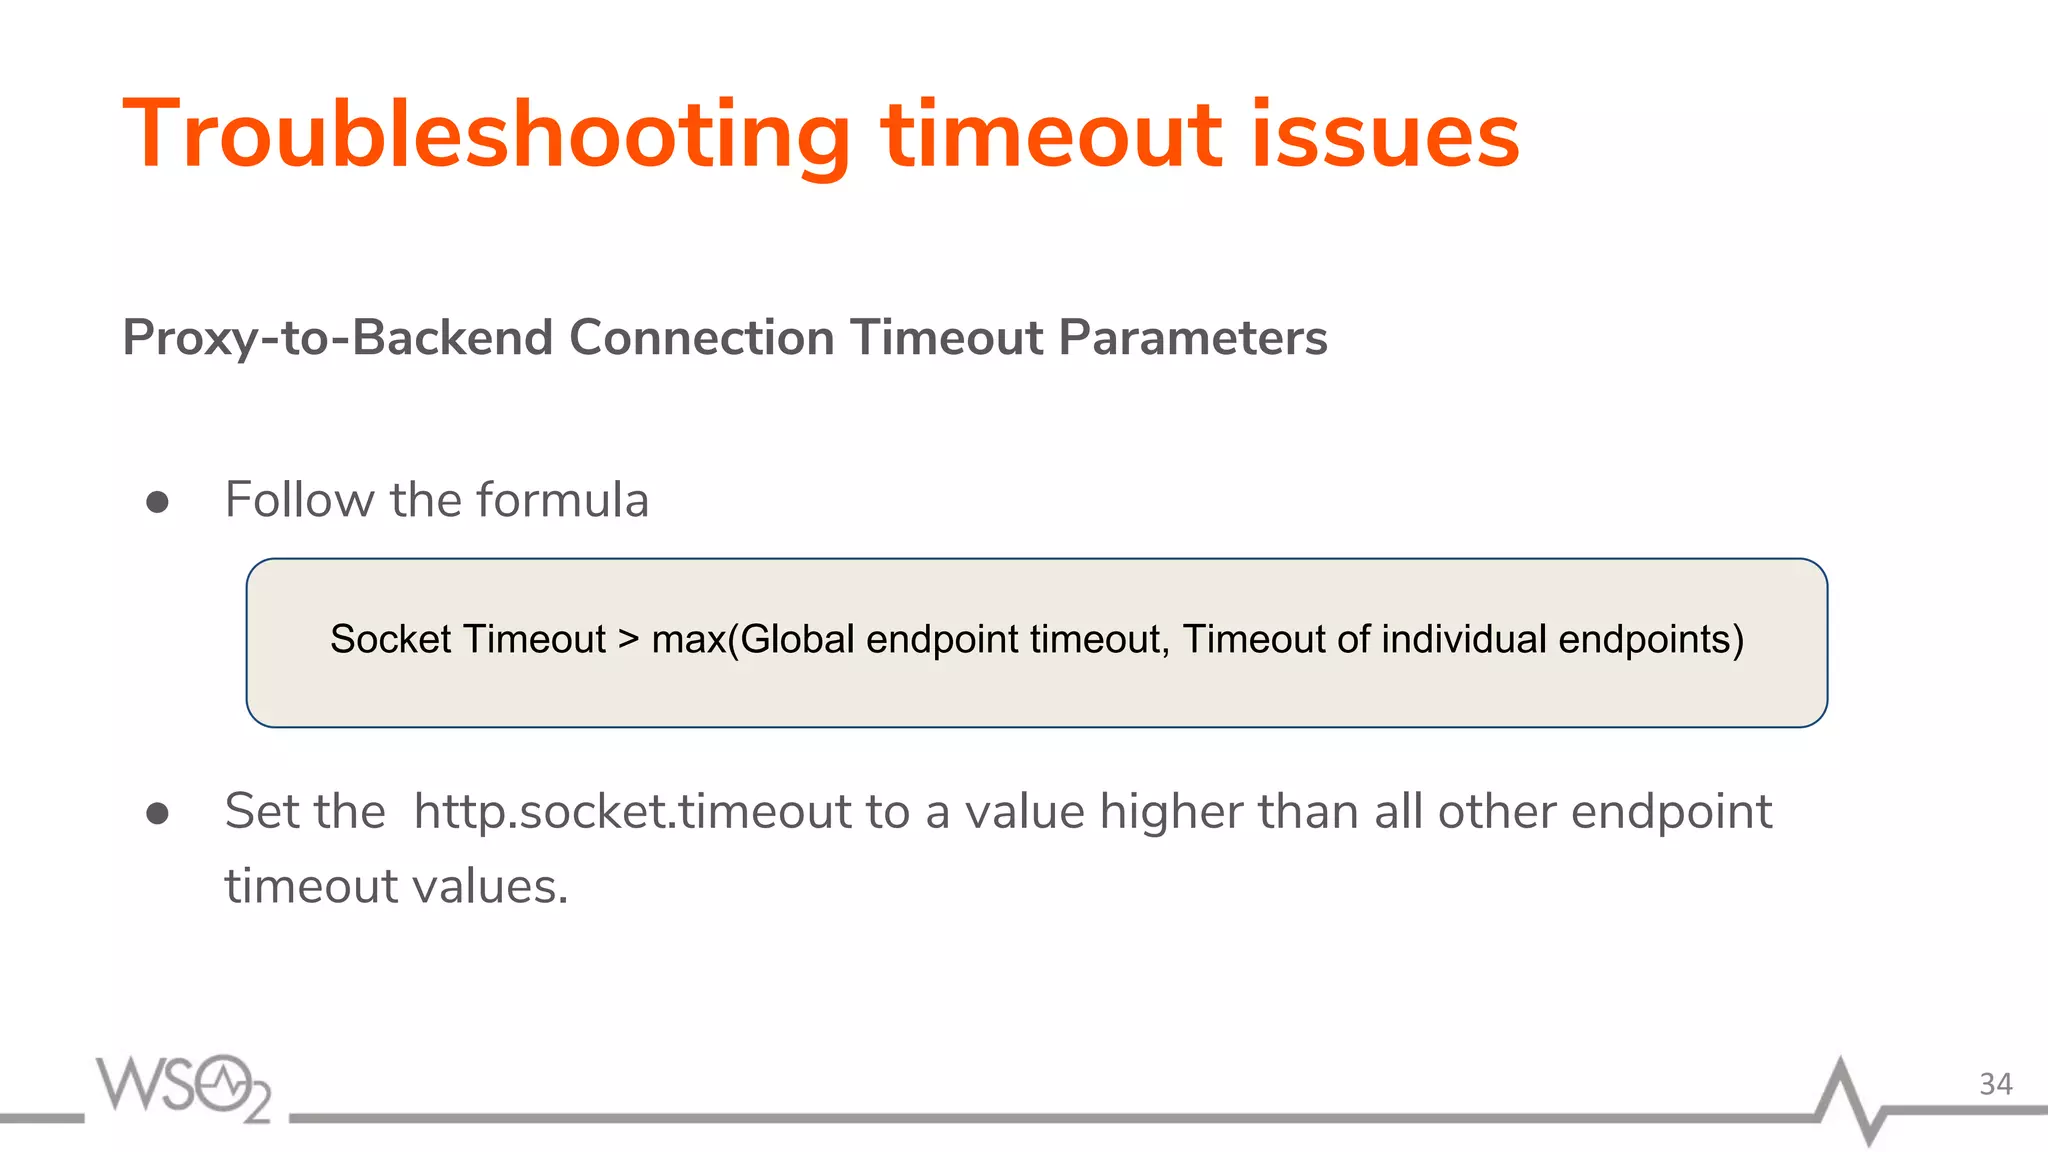
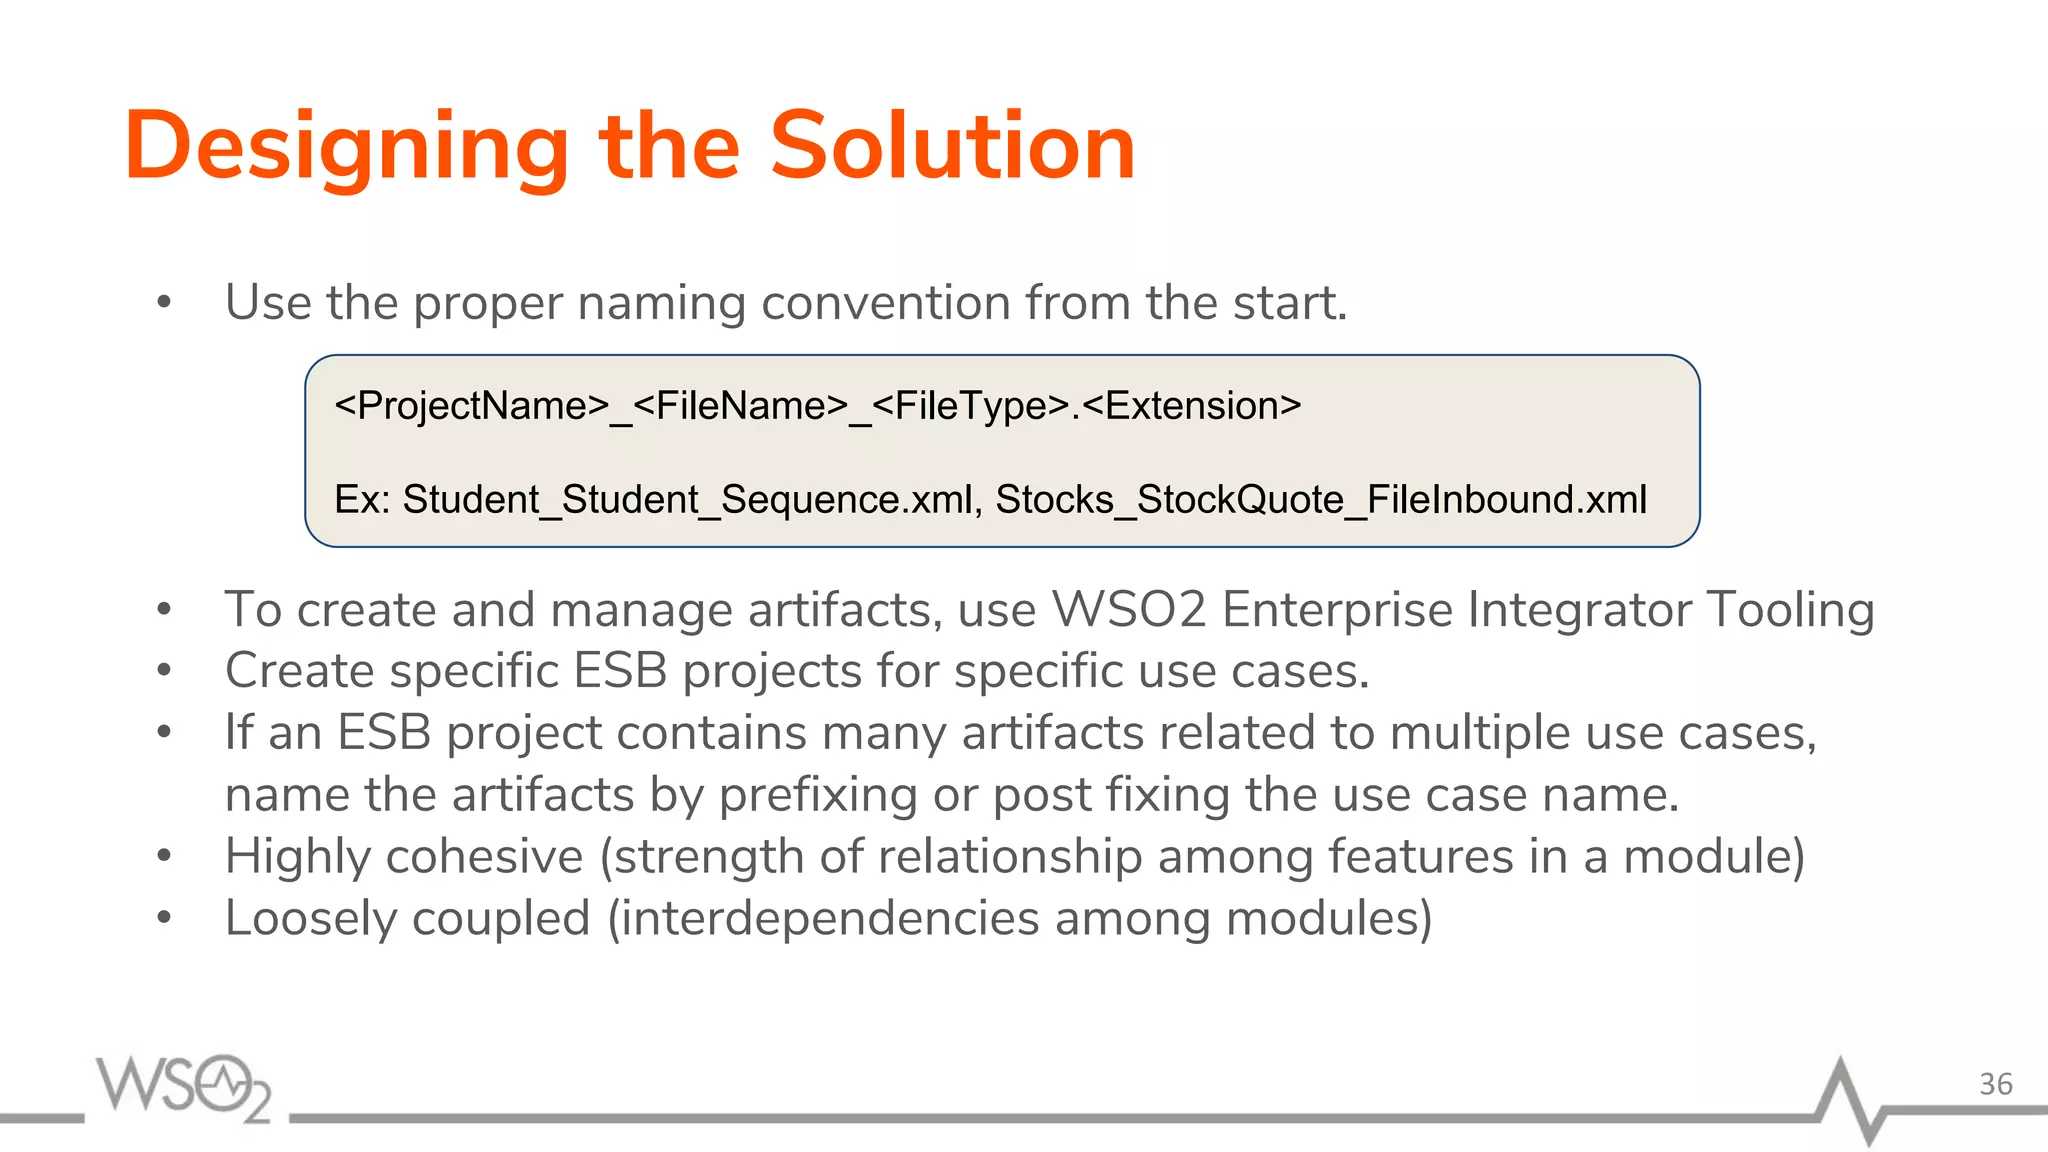
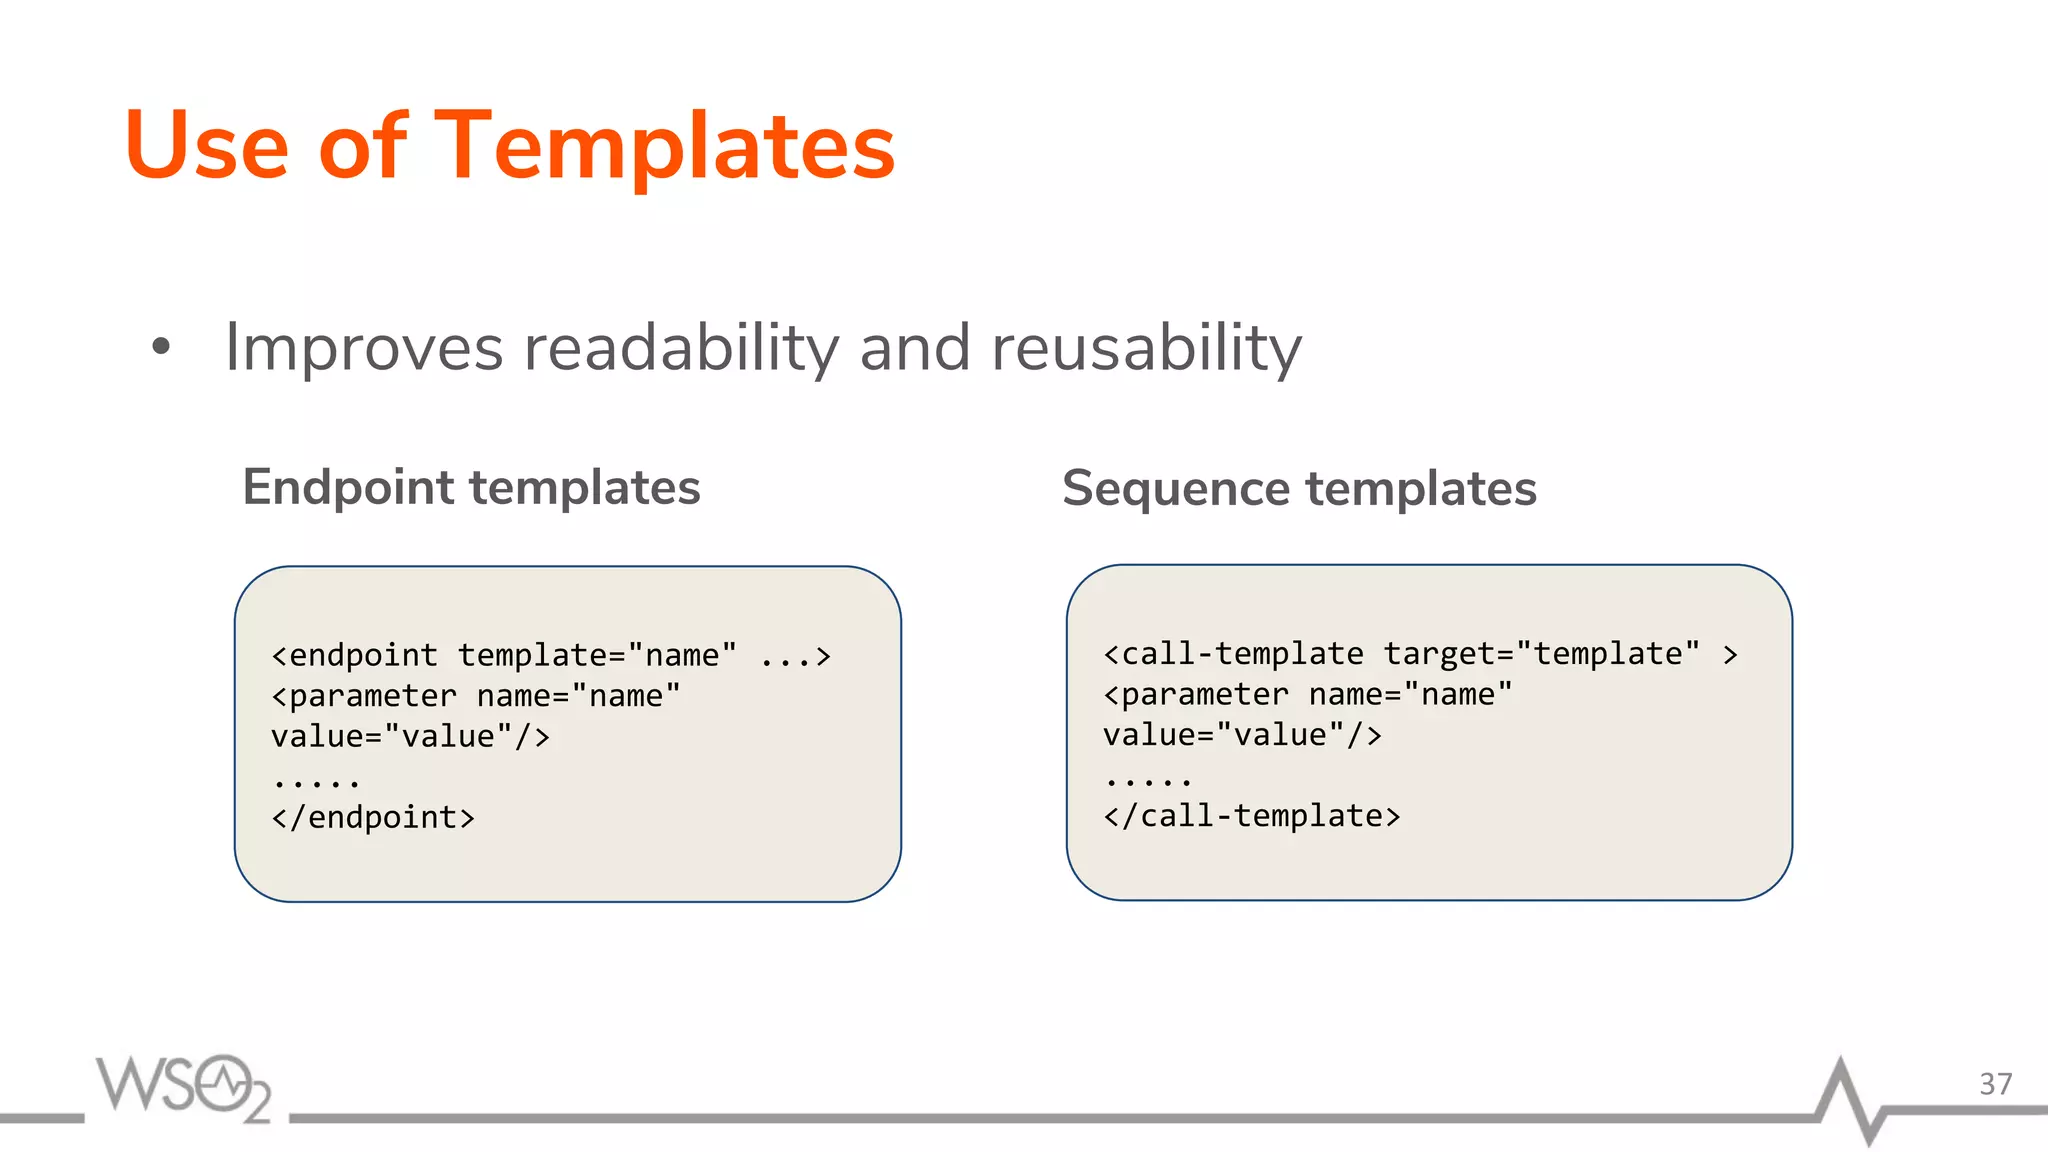
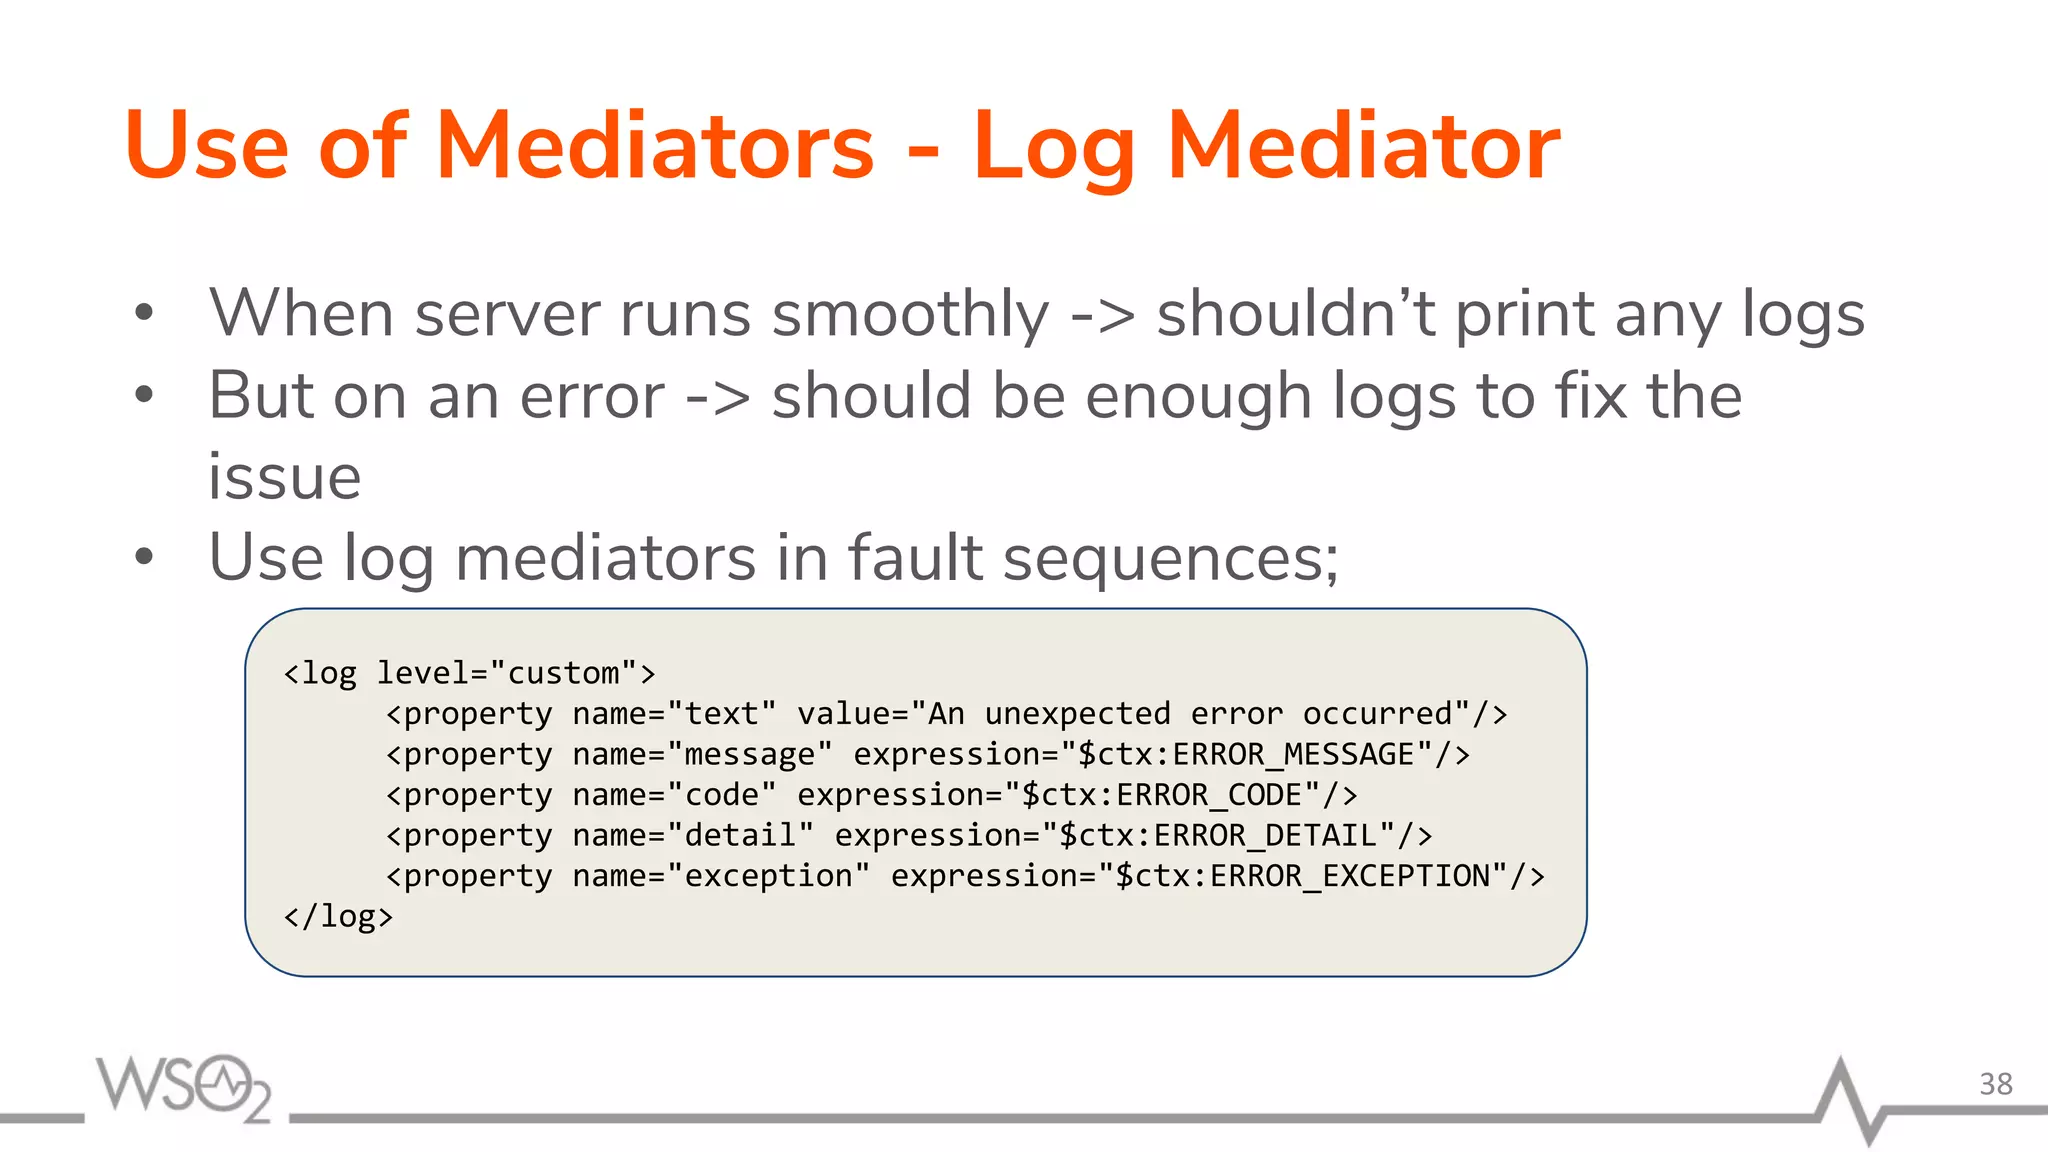
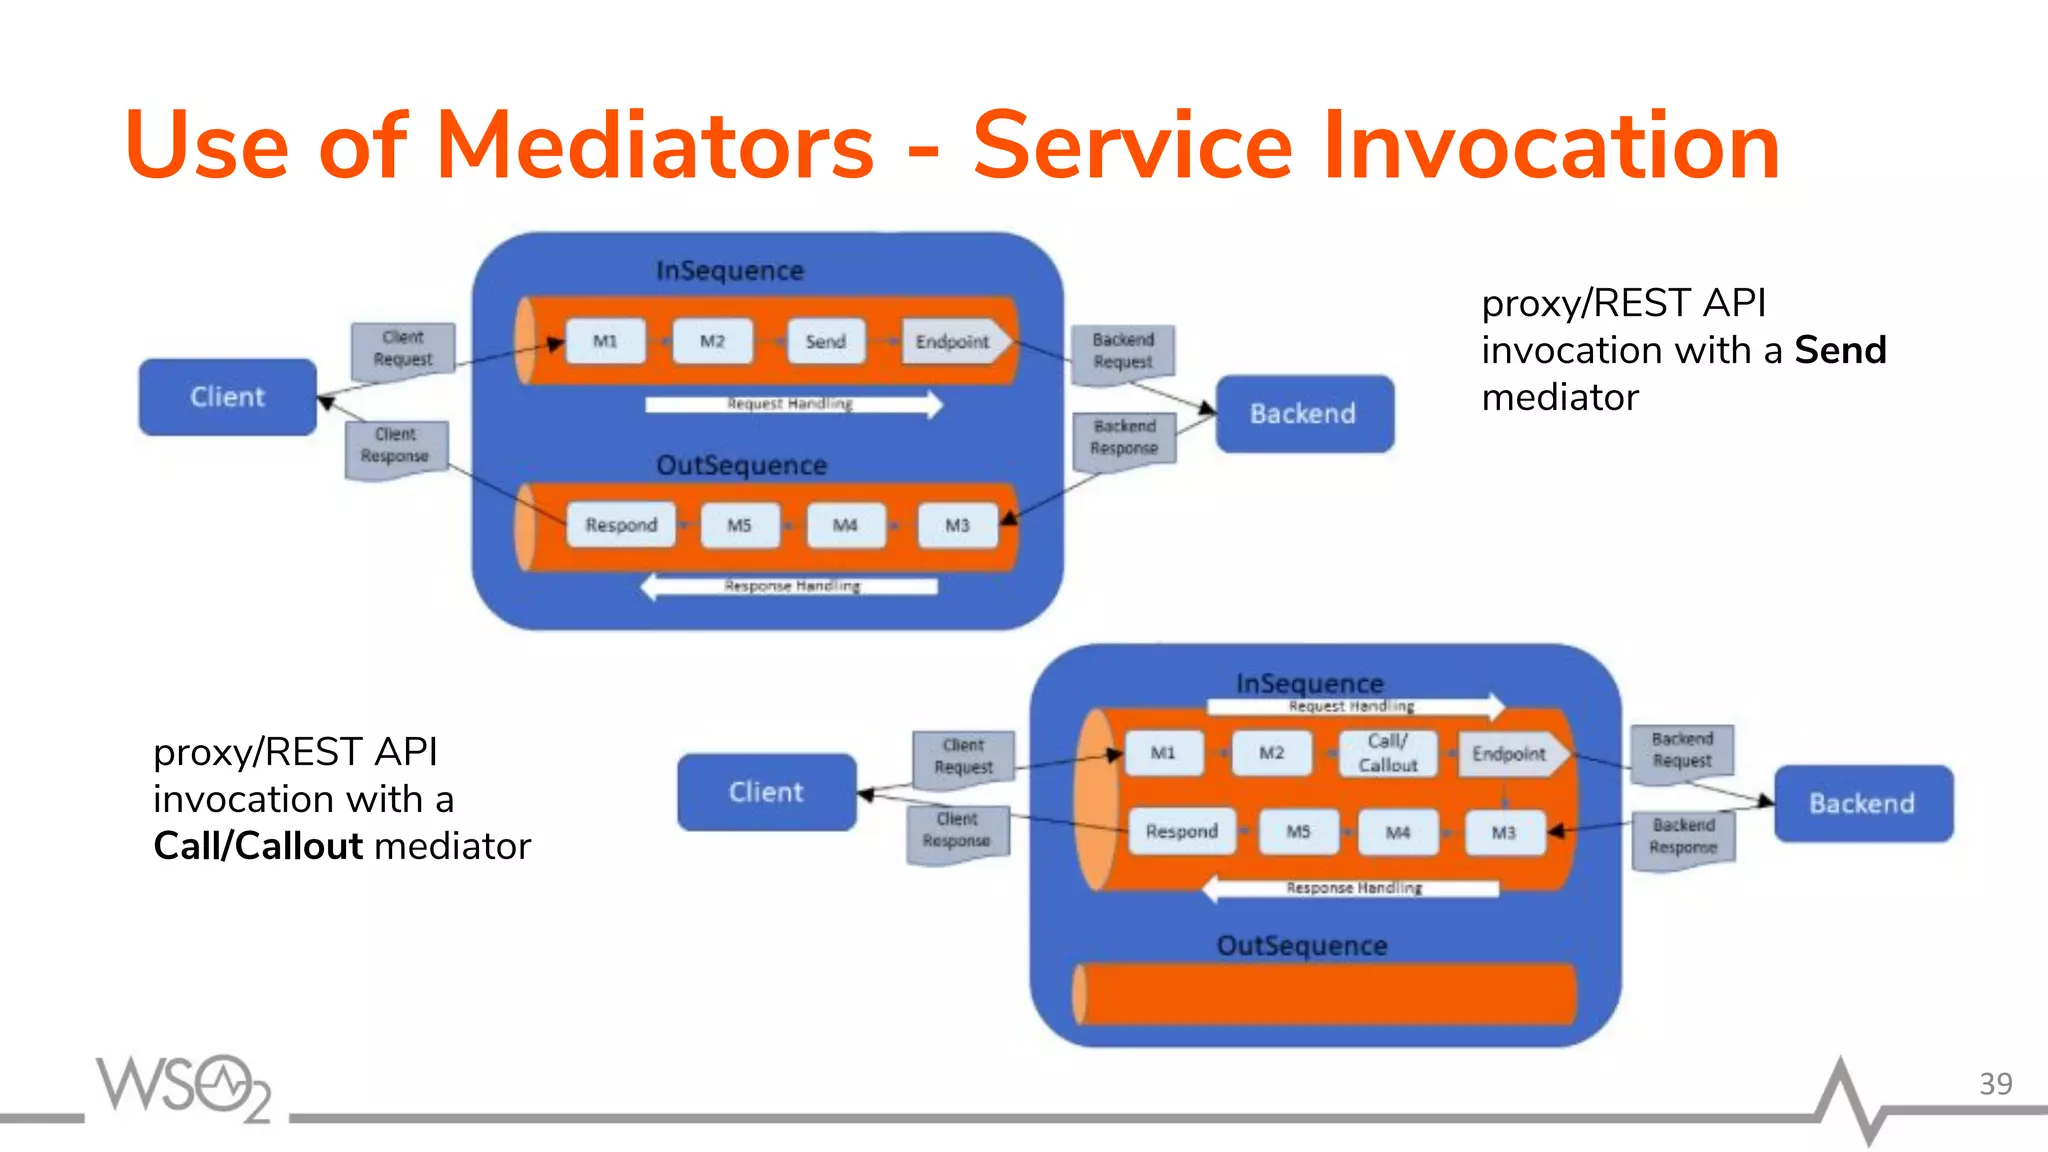
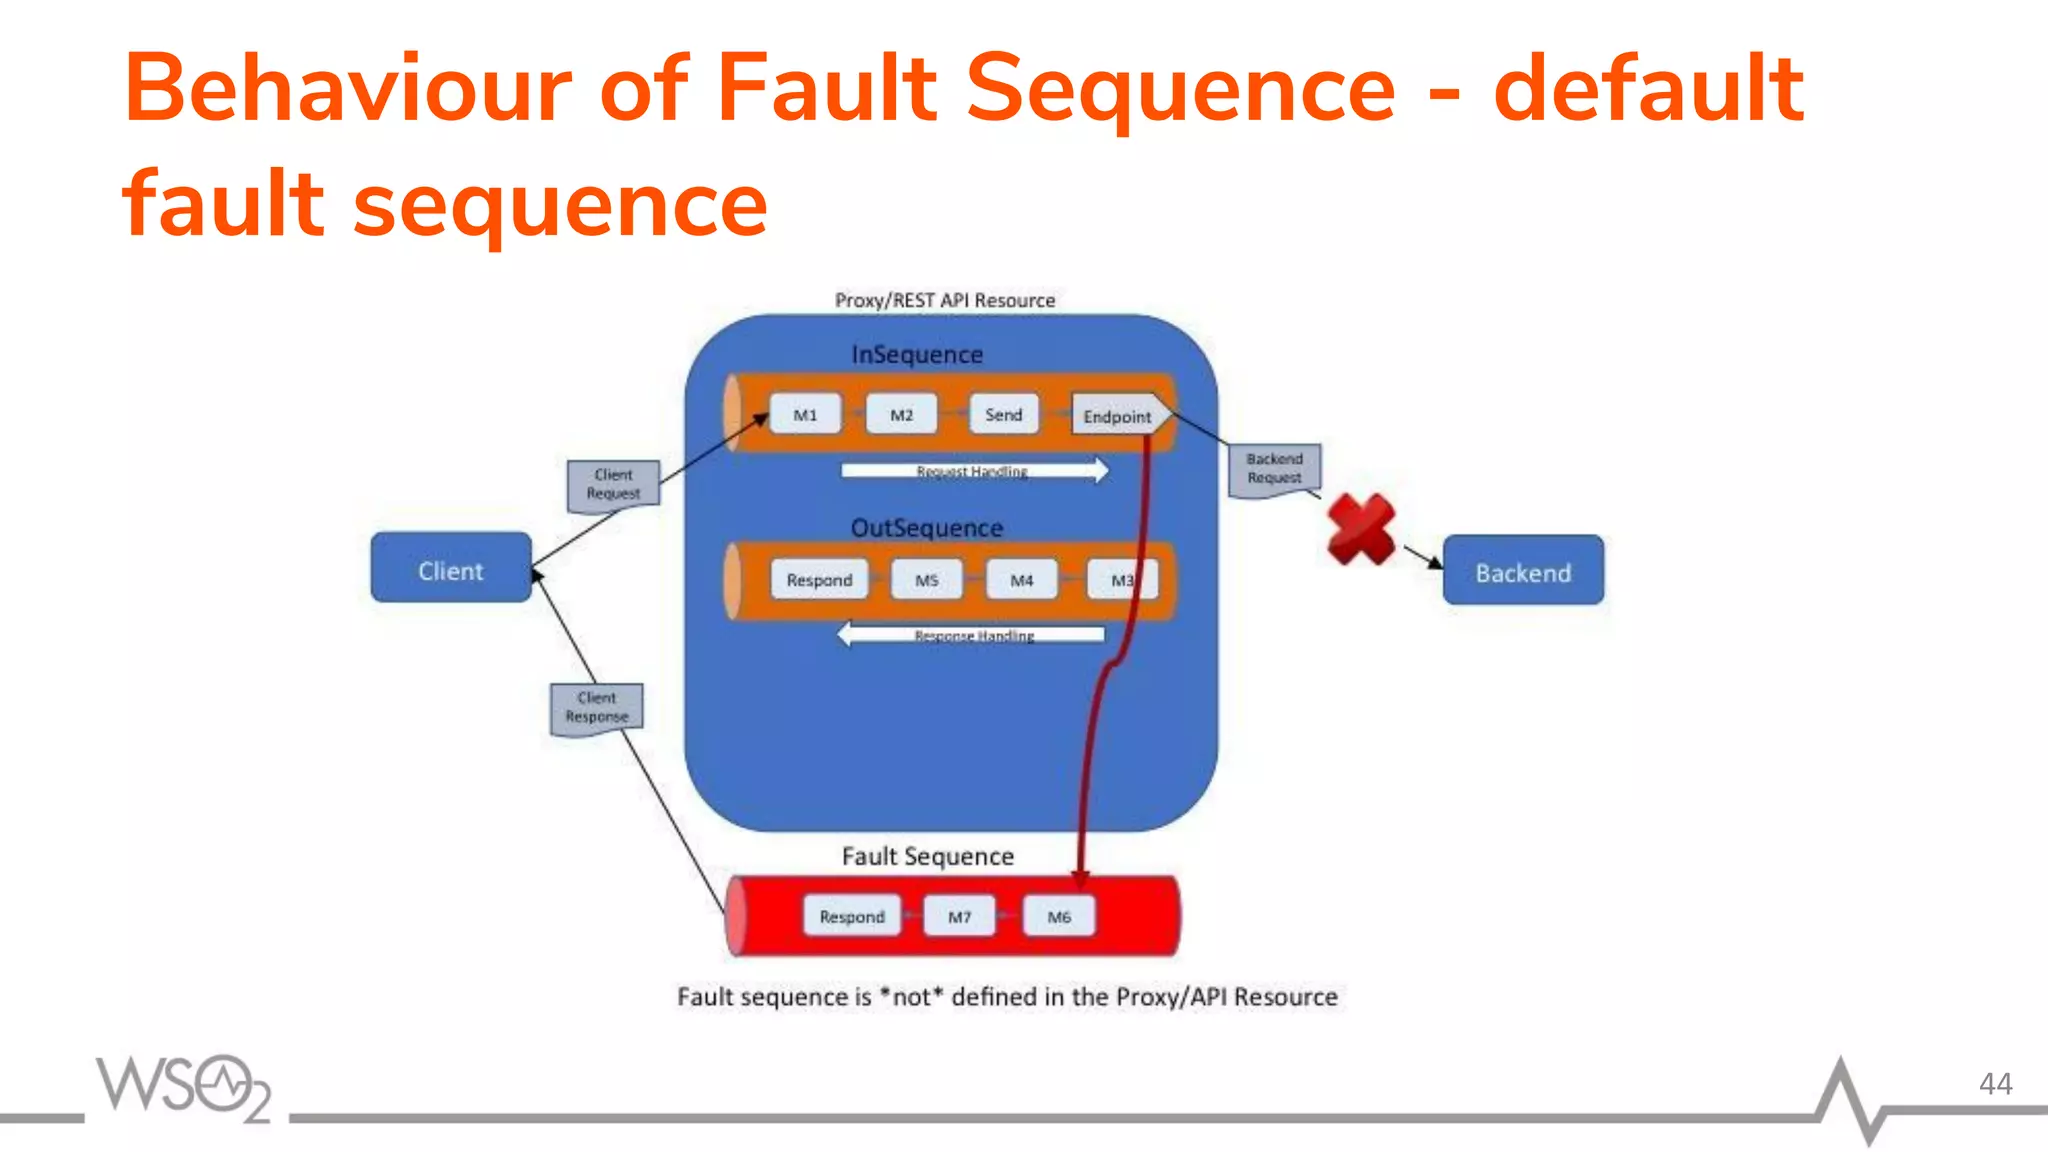
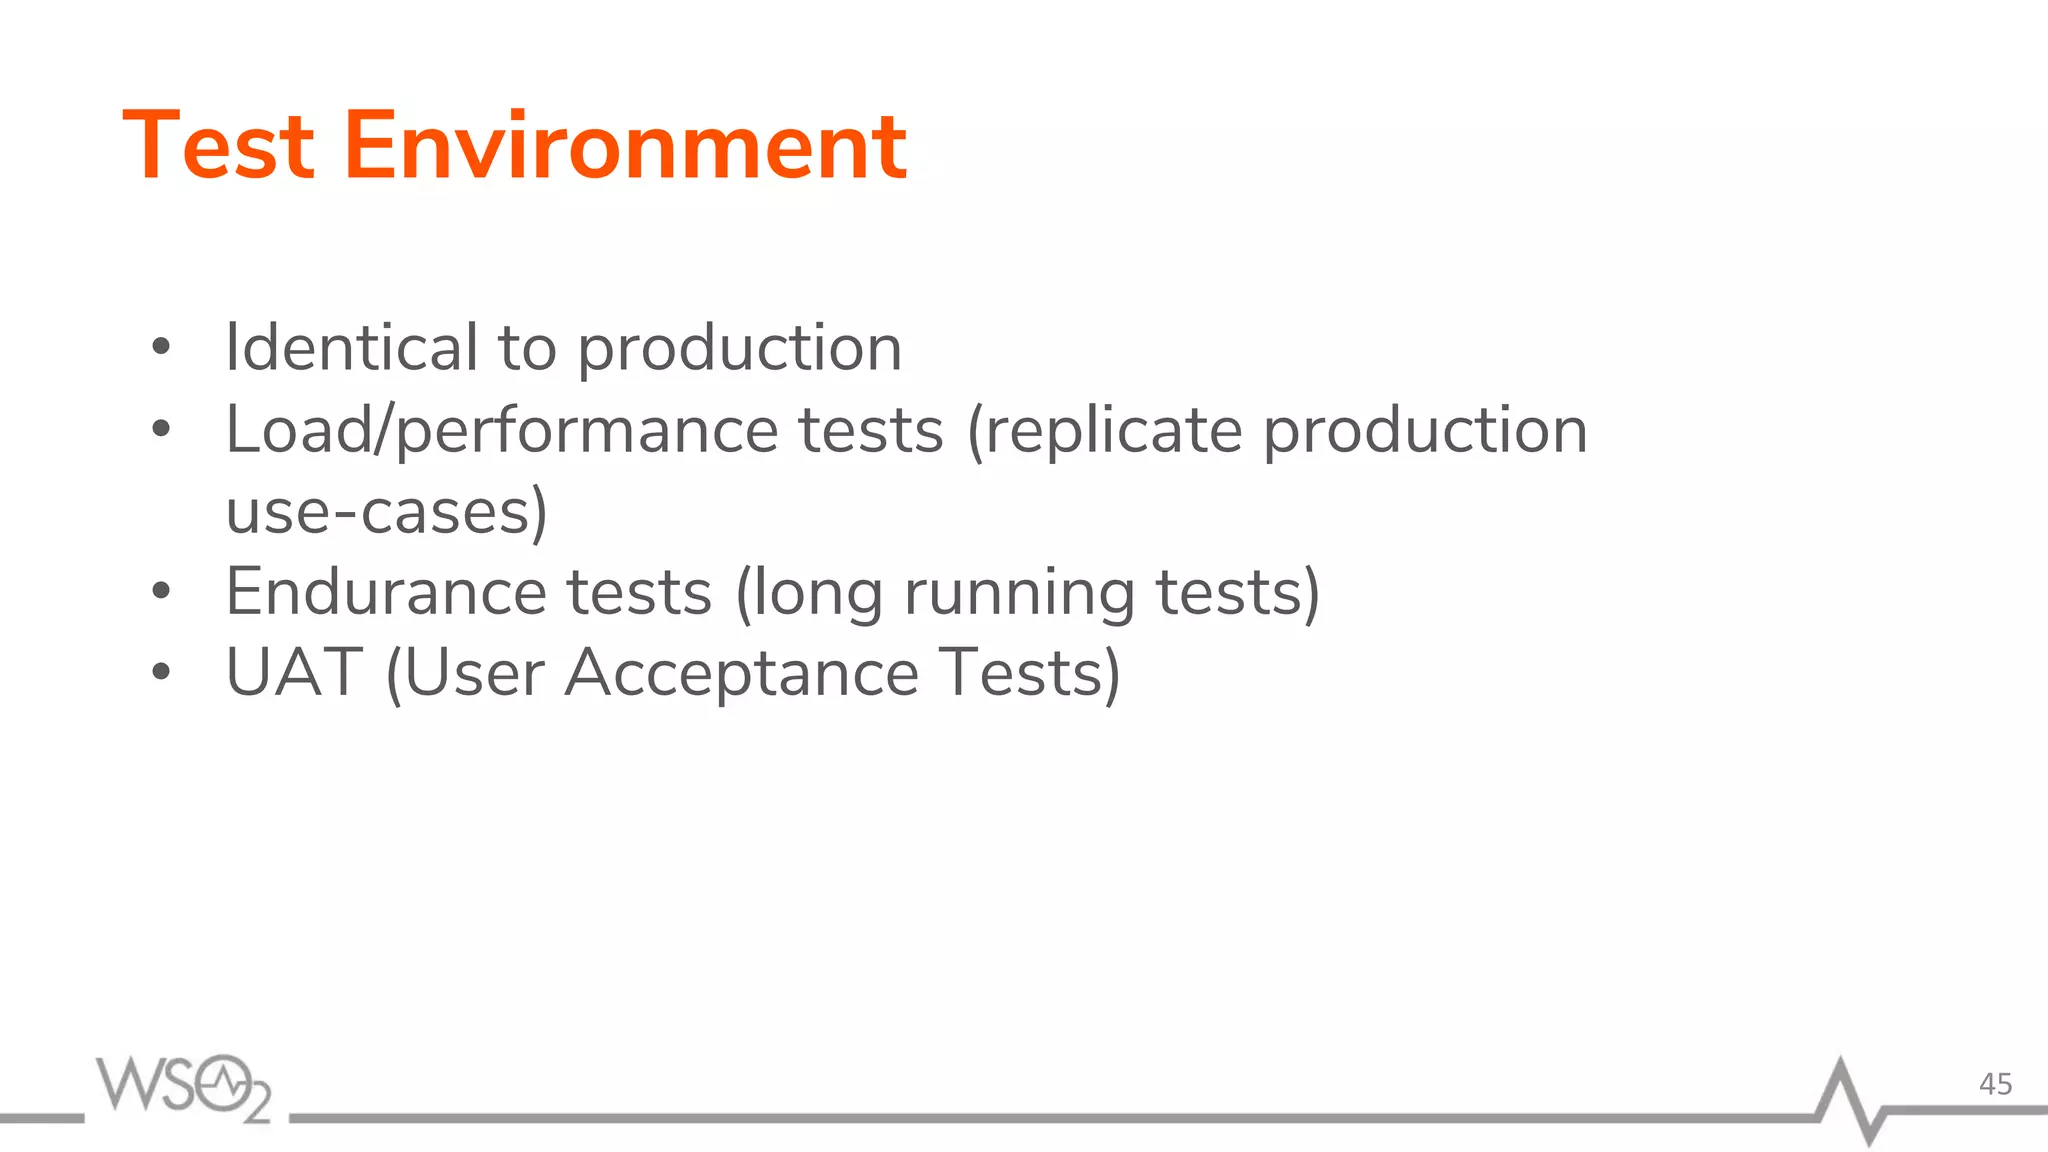
Troubleshooting and Best Practices
with WSO2 Enterprise Integrator
Chanika Geeganage
Senior Software Engineer
1
Agenda
• Overview
• Monitoring Logs
• Monitoring Messages
• Timeout Configurations
• Best Practices
2
Overview
What is Enterprise Integrator?
•
4
Integration Flow
Short-running Integration Flows
5
Monitoring Logs
Debug Logs
Enable Debug Logs
• Only few simple steps
- Shutdown the EI server
- open log4j.properties file from a text editor. The log4j.properties file is
located at <EI_HOME>/conf directory.
- Set log level to debug for log4j.category.org.apache.synapse as follows
log4j.category.org.apache.synapse=DEBUG
- Start EI server
• This will print useful information related to the mediation flow inside EI.
We can use this log for troubleshooting
7
Debug Logs
Sample Debug Logs
8
Trace Logs
• Trace logs trace the entire path when a message travels along a mediation
sequence.
• Tracing can be enabled for a proxy or for a sequence. This can be done by
adding the following attribute for the proxy/sequence configuration;
trace="enable"
• When tracing is enabled, trace logs can be seen from the
wso2-ei-trace.log file.
• This will provide more fine grained information than the debug logs
9
Trace Logs
Sample Trace Logs
•
10
Monitoring Messages
Monitoring Messages
Why message monitoring ?
• While developing integration scenarios with the EI, sometimes we might
get into situations where the expected results are not received for the
service invocations.
– Message payload sent by the EI is not in the format that is expected
by the backend service
– The content type of the sent message is not supported by the
backend service
– Some of the required headers like ‘Authorization Header’ is missing in
the request sent from the EI.
12
Monitoring Messages
How to monitor Messages ?
• To inspect messages passed in the connections, we can
use three mechanisms.
– TCPMon
– WireLogs
– Wireshark
13
Monitoring with TCPMon
• Users can view and monitor the messages passed along a
TCP-based conversation using the TCPMon utility.
• We can use TCPMon tool to monitor messages going
through http transport towards EI and from EI.
• TCPMon is an Apache project distributed under Apache 2.0
License.
• TCPMon is not dependent on any third party libraries.
• Its user interface is based on a swing UI and works on
almost all platforms that support Java.
14
Monitoring with TCPMon
Starting TCPMon
• To run the TCPMon available with your WSO2 Carbon product pack:
1. Go to <PRODUCT_HOME>/bin directory of your product pack.
2. Execute the following command to run the tool.
For Windows
tcpmon.bat
For Linux
./tcpmon.sh
15
Monitoring with TCPMon
A sample..
• There are two connections
– Client-to-Proxy Service connection
– Proxy-to-Backend Server connection
16
Proxy Service
8280 9000
Backend ServerClient
Monitoring with TCPMon
Monitoring Client to EI Connection
17
Proxy Service
8280 9000
Backend ServerClient
TCPMon
8281
Monitoring with TCPMon
Monitoring Client
to EI Connection
18
Proxy
service
Monitoring with TCPMon
Monitoring EI to Backend Connection
19
Proxy Service
8280
9000
Backend ServerClient
TCPMon
9001
Monitoring with TCPMon
Monitoring EI to
Backend Connection
20
Proxy
service
Monitoring with TCPMon
Limitations
• Can monitor only HTTP (no HTTPS)
• Hard to use in a production system
21
Wirelogs
• WireLogs functionality is also used to monitor the
messages flowing through WSO2 EI over http
transport.
• It has the following advantages over TCPMon tool
– Can monitor messages going through https transport
– Do not need to change the synapse configuration
22
Wirelogs
Enable WireLogs
• You can enable wire logs by following these steps
– Shutdown the EI server
– Open log4j.properties file from a text editor. This file is located at the
<EI_HOME>/conf directory.
– Uncomment the following entry;
– Start the EI server
23
log4j.logger.org.apache.synapse.transport.http.wire=DEBUG
Wirelogs
Wirelogs
Reading a WireLog
• To read a wire log, first we have to identify the message direction.
DEBUG - wire >> - Represent the message coming into the EI from the wire
DEBUG - wire << - Represent the message going into the wire from the EI
25
Proxy Service
8280 9000
Backend ServerClient
1 2
34
Wirelogs
26
Proxy Service
8280 9000
Backend ServerClient
1 2
34
Wireshark
• Wireshark is a network protocol analyzer captures packets in
real time and display them in human-readable format.
• Packet capture can provide information about individual
packets such as transmit time, source, destination, protocol
type and header data.
• Can monitor both HTTP and HTTPS requests
• No configuration changes needed
27
Wireshark
Data captured
for a sample
request
28
Timeout
Configurations
Troubleshooting timeout issues
Having a good understanding in different timeout configurations will certainly
help with troubleshoot issues.
30
Proxy Service
8280 9000
Backend ServerClient
HTTP Listener
(http.socket.timeout)
Timeout Handler
(synapse.global_timeout_interval)
Endpoint
(timeout)
HTTP Listener
(http.socket.timeout)
Troubleshooting timeout issues
Client-to-Proxy Connection Timeout Parameters
http.socket.timeout
● In the client-to-proxy connection we have to consider only one
configuration parameter. That is http.socket.timeout
● This can be configured from the passthru-http.properties file.
● This represents the socket timeout value of the passthrough http/https
transport listener.
● The default value is 180000.
31
Troubleshooting timeout issues
Proxy-to-Backend Connection Timeout Parameters
http.socket.timeout:
● This represents the socket timeout value of the passthrough http/https
transport sender. This is the same parameter used in transport listener.
Endpoint timeout:
● This is the timeout configuration parameter which can be configured at the
endpoint level.
● It allows us to configure different timeout values for different endpoints.
● For endpoints that doesn’t have a timeout configuration, the global
parameter value is considered as the timeout duration.
32
Troubleshooting timeout issues
Proxy-to-Backend Connection Timeout Parameters
synapse.global_timeout_interval:
● Synapse is a complete asynchronous engine which does not block worker
threads on network IO. It registers a callback and return.
● When the response is received, the registered callback is used to correlate
it with the request and further processing is done. If the backend server
does not respond back, it is required to clear the registered callbacks.
● This is done by TimeoutHandler. The ‘synapse.global_timeout_interval’
parameter represents the time duration that a callback should be kept in
the callback store.
33
Troubleshooting timeout issues
Proxy-to-Backend Connection Timeout Parameters
● Follow the formula
● Set the http.socket.timeout to a value higher than all other endpoint
timeout values.
34
Socket Timeout > max(Global endpoint timeout, Timeout of individual endpoints)
Best Practices
Designing the Solution
• Use the proper naming convention from the start.
• To create and manage artifacts, use WSO2 Enterprise Integrator Tooling
• Create specific ESB projects for specific use cases.
• If an ESB project contains many artifacts related to multiple use cases,
name the artifacts by prefixing or post fixing the use case name.
• Highly cohesive (strength of relationship among features in a module)
• Loosely coupled (interdependencies among modules)
36
<ProjectName>_<FileName>_<FileType>.<Extension>
Ex: Student_Student_Sequence.xml, Stocks_StockQuote_FileInbound.xml
Use of Templates
• Improves readability and reusability
37
Sequence templatesEndpoint templates
<endpoint template="name" ...>
<parameter name="name"
value="value"/>
.....
</endpoint>
<call-template target="template" >
<parameter name="name"
value="value"/>
.....
</call-template>
Use of Mediators - Log Mediator
• When server runs smoothly -> shouldn’t print any logs
• But on an error -> should be enough logs to fix the
issue
• Use log mediators in fault sequences;
38
<log level="custom">
<property name="text" value="An unexpected error occurred"/>
<property name="message" expression="$ctx:ERROR_MESSAGE"/>
<property name="code" expression="$ctx:ERROR_CODE"/>
<property name="detail" expression="$ctx:ERROR_DETAIL"/>
<property name="exception" expression="$ctx:ERROR_EXCEPTION"/>
</log>
Use of Mediators - Service Invocation
39
proxy/REST API
invocation with a Send
mediator
proxy/REST API
invocation with a
Call/Callout mediator
Use of Mediators - No Mediators after
Send/Respond
40
Use of Mediators - Loopback Mediator
41
Use of Mediators - Sequence Mediator
42
Behaviour of Fault Sequence - onError
sequence
43
Behaviour of Fault Sequence - default
fault sequence
44
Test Environment
• Identical to production
• Load/performance tests (replicate production
use-cases)
• Endurance tests (long running tests)
• UAT (User Acceptance Tests)
45
THANK YOU
wso2.com
THANK YOU
wso2.com

Troubleshooting and Best Practices with WSO2 Enterprise Integrator

  • 1.
    Troubleshooting and BestPractices with WSO2 Enterprise Integrator Chanika Geeganage Senior Software Engineer 1
  • 2.
    Agenda • Overview • MonitoringLogs • Monitoring Messages • Timeout Configurations • Best Practices 2
  • 3.
  • 4.
    What is EnterpriseIntegrator? • 4
  • 5.
  • 6.
  • 7.
    Debug Logs Enable DebugLogs • Only few simple steps - Shutdown the EI server - open log4j.properties file from a text editor. The log4j.properties file is located at <EI_HOME>/conf directory. - Set log level to debug for log4j.category.org.apache.synapse as follows log4j.category.org.apache.synapse=DEBUG - Start EI server • This will print useful information related to the mediation flow inside EI. We can use this log for troubleshooting 7
  • 8.
  • 9.
    Trace Logs • Tracelogs trace the entire path when a message travels along a mediation sequence. • Tracing can be enabled for a proxy or for a sequence. This can be done by adding the following attribute for the proxy/sequence configuration; trace="enable" • When tracing is enabled, trace logs can be seen from the wso2-ei-trace.log file. • This will provide more fine grained information than the debug logs 9
  • 10.
  • 11.
  • 12.
    Monitoring Messages Why messagemonitoring ? • While developing integration scenarios with the EI, sometimes we might get into situations where the expected results are not received for the service invocations. – Message payload sent by the EI is not in the format that is expected by the backend service – The content type of the sent message is not supported by the backend service – Some of the required headers like ‘Authorization Header’ is missing in the request sent from the EI. 12
  • 13.
    Monitoring Messages How tomonitor Messages ? • To inspect messages passed in the connections, we can use three mechanisms. – TCPMon – WireLogs – Wireshark 13
  • 14.
    Monitoring with TCPMon •Users can view and monitor the messages passed along a TCP-based conversation using the TCPMon utility. • We can use TCPMon tool to monitor messages going through http transport towards EI and from EI. • TCPMon is an Apache project distributed under Apache 2.0 License. • TCPMon is not dependent on any third party libraries. • Its user interface is based on a swing UI and works on almost all platforms that support Java. 14
  • 15.
    Monitoring with TCPMon StartingTCPMon • To run the TCPMon available with your WSO2 Carbon product pack: 1. Go to <PRODUCT_HOME>/bin directory of your product pack. 2. Execute the following command to run the tool. For Windows tcpmon.bat For Linux ./tcpmon.sh 15
  • 16.
    Monitoring with TCPMon Asample.. • There are two connections – Client-to-Proxy Service connection – Proxy-to-Backend Server connection 16 Proxy Service 8280 9000 Backend ServerClient
  • 17.
    Monitoring with TCPMon MonitoringClient to EI Connection 17 Proxy Service 8280 9000 Backend ServerClient TCPMon 8281
  • 18.
    Monitoring with TCPMon MonitoringClient to EI Connection 18 Proxy service
  • 19.
    Monitoring with TCPMon MonitoringEI to Backend Connection 19 Proxy Service 8280 9000 Backend ServerClient TCPMon 9001
  • 20.
    Monitoring with TCPMon MonitoringEI to Backend Connection 20 Proxy service
  • 21.
    Monitoring with TCPMon Limitations •Can monitor only HTTP (no HTTPS) • Hard to use in a production system 21
  • 22.
    Wirelogs • WireLogs functionalityis also used to monitor the messages flowing through WSO2 EI over http transport. • It has the following advantages over TCPMon tool – Can monitor messages going through https transport – Do not need to change the synapse configuration 22
  • 23.
    Wirelogs Enable WireLogs • Youcan enable wire logs by following these steps – Shutdown the EI server – Open log4j.properties file from a text editor. This file is located at the <EI_HOME>/conf directory. – Uncomment the following entry; – Start the EI server 23 log4j.logger.org.apache.synapse.transport.http.wire=DEBUG
  • 24.
  • 25.
    Wirelogs Reading a WireLog •To read a wire log, first we have to identify the message direction. DEBUG - wire >> - Represent the message coming into the EI from the wire DEBUG - wire << - Represent the message going into the wire from the EI 25 Proxy Service 8280 9000 Backend ServerClient 1 2 34
  • 26.
  • 27.
    Wireshark • Wireshark isa network protocol analyzer captures packets in real time and display them in human-readable format. • Packet capture can provide information about individual packets such as transmit time, source, destination, protocol type and header data. • Can monitor both HTTP and HTTPS requests • No configuration changes needed 27
  • 28.
  • 29.
  • 30.
    Troubleshooting timeout issues Havinga good understanding in different timeout configurations will certainly help with troubleshoot issues. 30 Proxy Service 8280 9000 Backend ServerClient HTTP Listener (http.socket.timeout) Timeout Handler (synapse.global_timeout_interval) Endpoint (timeout) HTTP Listener (http.socket.timeout)
  • 31.
    Troubleshooting timeout issues Client-to-ProxyConnection Timeout Parameters http.socket.timeout ● In the client-to-proxy connection we have to consider only one configuration parameter. That is http.socket.timeout ● This can be configured from the passthru-http.properties file. ● This represents the socket timeout value of the passthrough http/https transport listener. ● The default value is 180000. 31
  • 32.
    Troubleshooting timeout issues Proxy-to-BackendConnection Timeout Parameters http.socket.timeout: ● This represents the socket timeout value of the passthrough http/https transport sender. This is the same parameter used in transport listener. Endpoint timeout: ● This is the timeout configuration parameter which can be configured at the endpoint level. ● It allows us to configure different timeout values for different endpoints. ● For endpoints that doesn’t have a timeout configuration, the global parameter value is considered as the timeout duration. 32
  • 33.
    Troubleshooting timeout issues Proxy-to-BackendConnection Timeout Parameters synapse.global_timeout_interval: ● Synapse is a complete asynchronous engine which does not block worker threads on network IO. It registers a callback and return. ● When the response is received, the registered callback is used to correlate it with the request and further processing is done. If the backend server does not respond back, it is required to clear the registered callbacks. ● This is done by TimeoutHandler. The ‘synapse.global_timeout_interval’ parameter represents the time duration that a callback should be kept in the callback store. 33
  • 34.
    Troubleshooting timeout issues Proxy-to-BackendConnection Timeout Parameters ● Follow the formula ● Set the http.socket.timeout to a value higher than all other endpoint timeout values. 34 Socket Timeout > max(Global endpoint timeout, Timeout of individual endpoints)
  • 35.
  • 36.
    Designing the Solution •Use the proper naming convention from the start. • To create and manage artifacts, use WSO2 Enterprise Integrator Tooling • Create specific ESB projects for specific use cases. • If an ESB project contains many artifacts related to multiple use cases, name the artifacts by prefixing or post fixing the use case name. • Highly cohesive (strength of relationship among features in a module) • Loosely coupled (interdependencies among modules) 36 <ProjectName>_<FileName>_<FileType>.<Extension> Ex: Student_Student_Sequence.xml, Stocks_StockQuote_FileInbound.xml
  • 37.
    Use of Templates •Improves readability and reusability 37 Sequence templatesEndpoint templates <endpoint template="name" ...> <parameter name="name" value="value"/> ..... </endpoint> <call-template target="template" > <parameter name="name" value="value"/> ..... </call-template>
  • 38.
    Use of Mediators- Log Mediator • When server runs smoothly -> shouldn’t print any logs • But on an error -> should be enough logs to fix the issue • Use log mediators in fault sequences; 38 <log level="custom"> <property name="text" value="An unexpected error occurred"/> <property name="message" expression="$ctx:ERROR_MESSAGE"/> <property name="code" expression="$ctx:ERROR_CODE"/> <property name="detail" expression="$ctx:ERROR_DETAIL"/> <property name="exception" expression="$ctx:ERROR_EXCEPTION"/> </log>
  • 39.
    Use of Mediators- Service Invocation 39 proxy/REST API invocation with a Send mediator proxy/REST API invocation with a Call/Callout mediator
  • 40.
    Use of Mediators- No Mediators after Send/Respond 40
  • 41.
    Use of Mediators- Loopback Mediator 41
  • 42.
    Use of Mediators- Sequence Mediator 42
  • 43.
    Behaviour of FaultSequence - onError sequence 43
  • 44.
    Behaviour of FaultSequence - default fault sequence 44
  • 45.
    Test Environment • Identicalto production • Load/performance tests (replicate production use-cases) • Endurance tests (long running tests) • UAT (User Acceptance Tests) 45
  • 46.