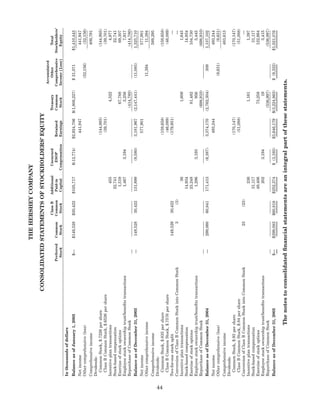
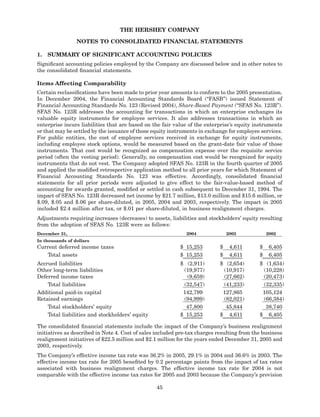
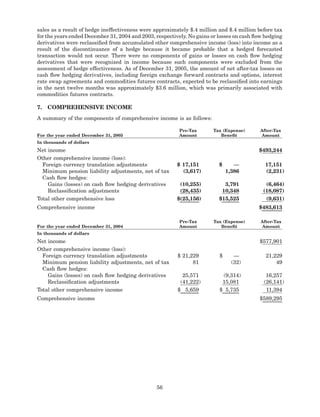
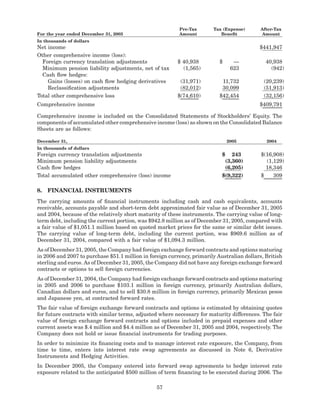
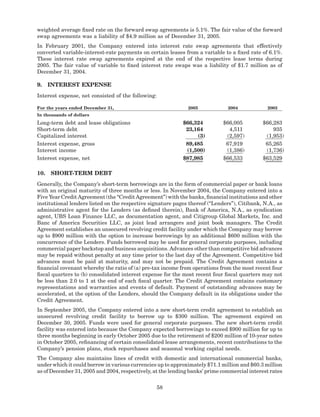
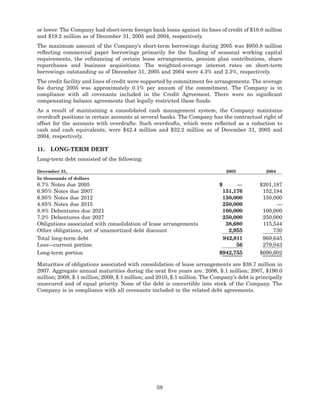
The document is The Hershey Company's annual report filed with the SEC for the fiscal year ended December 31, 2005. It provides information on Hershey's business operations including that it manufactures, distributes and sells confectionery, snack, refreshment and grocery products. It operates in the United States, Canada and Mexico and markets over 50 brands. The report lists the company's principal product groups and brands of confectionery, snack and refreshment products sold in the US. It also discusses the acquisitions of Joseph Schmidt Confections and Scharffen Berger Chocolate Maker in 2005.
This document is a Form 10-K annual report filed by Hershey Foods Corporation with the SEC for the fiscal year ending December 31, 2004. It provides information on Hershey's business operations, products, sales, distribution, raw materials, and pricing. Key details include: Hershey manufactures and sells confectionery, snack, refreshment and grocery products worldwide; its major brands include Hershey's, Reese's, and Kit Kat; cocoa beans are its primary raw material; and it announced price increases on half its domestic confectionery line in late 2004 and early 2005.
The document discusses Beringer Blasé Wine Estates, an Indian wine producer. It summarizes the characteristics and taste profiles of the company's Chardonnay and Syrah wines. It then provides an overview of the Indian wine market, including current consumption levels and growth projections. The document also analyzes the marketing mix strategies Beringer Blasé could employ to target the Indian market, including product positioning, pricing, promotion, and distribution approaches.
The 2002 annual report summarizes Adolph Coors Company's transformation through the acquisition of one of the largest UK beer businesses, a new US advertising approach, and strides in productivity improvement and cost reduction. Sales and profits increased substantially. The company strengthened its focus on young adult males and improved efficiency across operations from breweries to distribution. The acquisition added leading UK brands and was described as "talent accretive". Overall, the report describes a year of dramatic progress in transforming and strengthening the company.
This document is a Form 10-K annual report filed by Hershey Foods Corporation with the SEC for the fiscal year ending December 31, 2004. It provides information on Hershey's business operations, products, sales, marketing strategies, distribution networks, raw material costs, and price increases. Key details include that Hershey manufactures and sells over 50 brands of confectionery, snack, refreshment and grocery products in North America and other countries. It sources cocoa beans, its primary raw material, from various global regions.
Frito-Lay is a major manufacturer and marketer of salty snack foods that had nearly $3 billion in net sales in 1985. The company sells various potato chips, corn chips, and dips. In the 1980s, Frito-Lay introduced several new cheese-based dips and recognized the growth of the vegetable dip market, seeing an opportunity to expand their product line. The company has a strong national distribution system and brand recognition that could help new product lines succeed if launched and positioned correctly.
This document is The Hershey Company's annual report on Form 10-K filed with the SEC for the fiscal year ended December 31, 2008. It provides an overview of The Hershey Company as the largest producer of quality chocolate in North America and a global leader in chocolate and sugar confectionery. It describes the company's principal product groups and brands, customers, marketing strategy, product distribution, and history of price changes. The report indicates that Hershey operates as a single reportable segment across five geographic operating segments and had net sales of approximately 26% to McLane Company, Inc. in 2008.
This document is The Hershey Company's annual report on Form 10-K filed with the United States Securities and Exchange Commission for the fiscal year ended December 31, 2008. It provides an overview of The Hershey Company as the largest producer of quality chocolate in North America and a global leader in chocolate and sugar confectionery. It operates as a single reportable segment manufacturing, marketing, selling and distributing various package types of chocolate, confectionery, food and beverage enhancers, and gum and mint products under more than 80 brand names in approximately 50 countries worldwide. Key products sold in the United States under brands like HERSHEY'S include chocolate bars, cookies and creme bars, miniatures, and
This document provides work experience summaries for Michelle Bishop Turkington at various companies, including:
- Bandai America, a toy company known for Power Rangers and Pac Man, where the strategic initiative was to enter the novelty candy business in the US.
- ChupaChups USA, where she launched various candy brands like Smint breath mints and revived Pop Rocks, focusing marketing campaigns in key cities.
- President Baking, acquired by Keebler, where she consolidated 3000 SKUs into 750 under a new brand to standardize product lines.
- Con Agra Frozen Foods, where she worked on brands like Banquet and Healthy Choice and a "meat case project" to expand into
This document is a Form 10-K annual report filed by The Hershey Company with the United States Securities and Exchange
Commission for the fiscal year ended December 31, 2006. The report provides an overview of The Hershey Company, including that
it is the largest manufacturer of chocolate and confectionery products in North America. It operates as a single reportable segment and
markets over 50 brands. Key products include Hershey's, Reese's, and Kisses brands. It has a global sales and marketing organization
and distribution network. Cocoa is a significant raw material and prices of products are occasionally adjusted.
This document is The Hershey Company's annual report on Form 10-K filed with the SEC for the fiscal year ended December 31, 2006. It provides an overview of The Hershey Company, including that it is the largest manufacturer of chocolate and confectionery products in North America. It details the company's reportable segment, selling and marketing organization, principal product lines in various geographic regions, customers, marketing strategy, product distribution, pricing changes, and raw materials used.
This document provides a brand audit for Ben & Jerry's ice cream. It includes sections on the brand's history, products/flavors, identity elements like name, logo and characters, distribution channels including scoop shops and catering, communication strategies like social media and corporate social responsibility efforts, and competitors. The document also summarizes qualitative and quantitative research conducted, including focus groups and surveys, to understand customer perceptions and consumption habits regarding Ben & Jerry's and premium ice cream brands.
Hershey's has over a century of history producing chocolate. It was founded in 1894 by Milton Hershey in Pennsylvania. By the early 1900s, it had established a large factory in Derry Township, PA and was mass producing popular products like Hershey Kisses. Today, Hershey's remains one of the top chocolate producers in North America, though it faces competition from global brands like Mars, Nestle, and Cadbury. To maintain its standing, experts recommend Hershey's focus on growth through acquisitions and licensing, streamlining operations, and capitalizing on its status as a classic American brand.
Taco Bell and Forever 21 recently announced a partnership to offer a line of co-branded apparel. Through trademark licensing, Taco Bell gains access to Forever 21's expertise in apparel production and retail sales, allowing Taco Bell to expand its brand into new product categories. Both brands have strong identities and loyal fan bases that overlap among millennials. Their synergistic partnership combines Taco Bell's culture of innovation with Forever 21's leadership in fast fashion. The companies hope this collaboration will introduce their brands to new audiences and create new opportunities for existing fans to engage with the brands.
Project on the Coca Cola Company. Created by Pramod KshirsagarPramod Kshirsagar
The Coca-Cola Company is an American multinational beverage corporation and manufacturer, retailer, and marketer of nonalcoholic beverage concentrates and syrups. Founded in 1886 in Atlanta, Georgia, Coca-Cola owns or licenses more than 500 brands and serves over 1.7 billion servings each day in over 200 countries. The company operates the world's largest beverage distribution system and has a market capitalization of over $150 billion.
This document provides a summary of news from the American Wholesale Marketers Association (AWMA) in their November 20, 2014 weekly newsletter. It includes the following:
1) The AWMA president explains the benefits of attending the upcoming AWMA Marketplace conference, including discounted registration and hotel rates.
2) AWMA representatives met with executives from The Hershey Company to discuss issues affecting the convenience distribution industry.
3) Recent sales data from InfoRhythm C-Metrics shows year-over-year increases in various product categories including candy, snacks, tobacco, and foodservice.
4) The document provides various additional member, regulatory, product, and industry news briefs.
This document describes a promotional campaign for 7 Up and its brand portfolio during the 2003 holiday season. It involves a partnership with eBay to create an online loyalty program and sweepstakes centered around the Grammy Awards. Consumers can earn points by purchasing 7 Up products, then use the points to bid on Grammy memorabilia auctions on eBay. They can also enter online to win a "Rock N Roll Ride" grand prize vehicle. The promotion aims to leverage the popularity of the Grammys during the holiday period to drive increased sales of 7 Up brands.
This document appears to be a biography of Lauren DeCandido. It describes that she grew up in Bryn Mawr, Pennsylvania and attended Syracuse University. After graduating, she moved to New York City to begin her career. She later married and had a daughter. The family is now settled in Stamford, Connecticut. The document then goes on to showcase some of Lauren's creative work and ideas.
This document provides an overview of the history and operations of Cadbury, a British confectionary company. Some key points:
- Cadbury was founded in Birmingham, UK in 1824 by John Cadbury as a grocer initially selling cocoa and drinking chocolate.
- It has grown to be the second largest confectionary brand in the world, producing many popular chocolate bars like Dairy Milk and Milk Tray.
- Cadbury uses market research and focuses on mass markets worldwide. Its target audience includes people of all ages.
- The company has been successful due to its quality products, marketing strategies, and expansion to over 200 countries.
Coca-Cola was created in 1886 in Atlanta, Georgia by Dr. John Pemberton and became one of the world's most popular and recognizable brands. It grew from modest beginnings selling 9 drinks per day to becoming a global corporation selling over 1.5 billion drinks daily in over 200 countries. Coca-Cola uses marketing strategies like dominating fountain sales in fast food restaurants and testing new packaging like curved cans to promote brand recognition and sales growth worldwide.
This document provides a brand audit of Cadbury Dairy Milk chocolate. It discusses the brand's background, objectives of the audit, customer profiles, brand elements, marketing programs, price points, and competitive brands. The audit finds that Dairy Milk has built strong brand awareness and a favorable brand image through emotional advertising campaigns like "Kuch Meetha Ho Jaye." It enjoys high customer recognition and recall due to its ubiquitous availability and distinctive purple packaging. The brand's equity comes from its brand awareness, image, and unique associations in consumers' minds.
western unionCorporate Governance Guidelinesfinance47
The Board of Directors is responsible for overseeing Western Union and selecting the CEO and other executive management. The Board's primary functions are oversight, ethics and integrity, evaluating performance, reviewing strategic plans, advising management, and ensuring compliance. The Board establishes committees, evaluates itself, and plans for CEO succession to fulfill its responsibilities.
western unionRelated Person Transactions Policy finance47
The policy establishes guidelines for approving related person transactions between the company and its directors, executive officers, or significant shareholders. It requires that all related person transactions be approved or ratified by the Corporate Governance Committee or disinterested members of the Board. The committee must consider factors like the transaction's size, the related person's interest, potential conflicts, and whether comparable terms could be obtained from an unaffiliated third party. Ongoing related person transactions are also subject to annual review. All approved transactions must be disclosed as required by securities laws.
The document summarizes Western Union's 2006 annual report. It highlights that Western Union has a 150-year history of connecting people around the world through money transfers, with its brand synonymous with speed, trust, reliability and convenience. It processes nearly 150 million consumer-to-consumer transactions annually, accounting for over 80% of its revenue. It is also expanding its consumer-to-business services to allow bill payments, having recently acquired a company in Argentina, as it looks to increase diversification and growth opportunities.
Western Union had a very successful 2007 financially, with revenue, operating profit, and cash flow from operating activities all reaching record highs and growing at double-digit annual rates. The company strengthened its global network by increasing its number of agent locations worldwide to over 335,000 across more than 200 countries and territories. International consumer-to-consumer money transfers now make up 65% of Western Union's total revenue, demonstrating the company's increasing global reach and focus on serving migrant populations worldwide. Western Union aims to continue growing this business segment and meeting the evolving financial needs of global consumers.
Western Union's 2008 annual report summarizes the company's strong financial performance in 2008. The company delivered record revenue of $5.3 billion and cash flow from operations of $1.25 billion. Western Union's share of the global cross-border remittance market increased to 17% in 2008. Looking ahead, the company plans to focus on accelerating profitable growth, expanding payments services, innovating new products, and improving profitability through cost reductions.
Hershey Foods Corporation saw decreased sales and net income in 1999 compared to 1998. Sales declined due to the divestiture of the pasta business in early 1999 and difficulties fulfilling orders after implementing a new IT system. Net income increased due to a gain on the pasta sale, but excluding this was down 13% due to the sales decline and higher costs. The financial position remained strong with reduced debt from the pasta sale proceeds. Capital expenditures of $150-170 million annually are planned for manufacturing expansion and modernization.
This document provides an analysis of Hershey Foods Corporation's financial condition and results of operations. It discusses increases in net sales and gross margin from 1999 to 2000 primarily due to lower raw material costs. Selling and administrative expenses also increased from 1999 to 2000 due to higher marketing and staffing costs. In 2000, Hershey acquired Nabisco's mint and gum businesses for $135 million. The acquisition increased assets but did not materially impact 2000 results. Cash flow from operations and prior asset sales exceeded capital expenditures, share repurchases and dividends. Liquidity remains strong with continued capital investments planned.
1) Net sales for Hershey Foods Corporation increased 6% from 1999 to 2000 due to higher core confectionery and grocery product sales in North America, new product introductions, and lower returns and discounts. Net sales decreased 10% from 1998 to 1999 primarily due to the sale of the pasta business.
2) Gross margin increased from 40.7% in 1999 to 41.5% in 2000 due to lower raw material costs and returns/discounts, but was partially offset by higher distribution costs. Gross margin decreased from 40.8% in 1998 to 40.7% in 1999 due to product mix and higher distribution costs.
3) Net income decreased 27% from 1999 to 2000 due to the 1999
- Hershey Foods Corporation produces and distributes a broad line of chocolate and non-chocolate confectionery and grocery products.
- Net sales rose in 2001 primarily due to acquisitions of mint and gum businesses and new product introductions. Net sales also rose in 2000 due to increased sales of base confectionery products.
- Gross margin was unchanged at 41.5% in 2000 and 2001. Excluding one-time charges, gross margin rose to 42.6% in 2001 due to lower costs and supply chain efficiencies.
Hershey Foods Corporation manufactures and distributes confectionery and grocery products. In 2002, the company's net sales decreased from 2001 primarily due to increased promotion costs, divestitures of some brands, and the timing of sales from an acquired gum and mint business. Cost of sales also decreased in 2002 from 2001 mainly because of lower costs for raw materials. However, gross margin increased due to decreased raw material costs and supply chain efficiencies. Selling, marketing, and administrative expenses decreased slightly in 2002 driven by savings from business realignment initiatives and the elimination of goodwill amortization, partially offset by expenses to explore a possible sale of the company.
Hershey Foods Corporation manufactures and distributes confectionery and grocery products. Net sales decreased in 2002 due to increased promotion costs, divestitures, and sluggish retail conditions. Cost of sales decreased due to lower raw material costs and supply chain efficiencies. In late 2001, the company approved a business realignment plan to improve efficiency, including outsourcing manufacturing, rationalizing product lines, improving supply chain, and workforce reductions, generating $75-80 million in annual savings. Charges of $312 million were recorded for these initiatives.
- Hershey Foods Corporation manufactures and sells confectionery and grocery products. In 2003, the company saw increased net sales and net income compared to 2002 through strategies focusing on key brands, gross margin expansion, and earnings growth per share.
- The company's strategies over a three-year period resulted in increased sales, gross margins, and returns through price increases, improved sales mix, lower costs, and share repurchases. However, challenges remain in driving profitable core confectionery growth and portfolio evolution.
- Hershey Foods Corporation manufactures and sells confectionery and grocery products. In 2003, the company saw increased net sales and income compared to 2002 through strategies focused on key brands, gross margin expansion, and earnings growth per share.
- Primary challenges for 2004 and beyond include profitable sales growth in core confectionery and broader snacks, evolving the product portfolio to meet consumer trends, and balancing growth and profit in seasonal and packaged candy businesses. The company expects continued revenue growth, margin expansion, and earnings growth per share through focus on these strategies.
This document is Hershey Foods Corporation's 2003 annual report and proxy statement to shareholders. It discusses Hershey's financial performance in 2003, including 13% earnings per share growth and continued gross margin expansion. It outlines the company's strategy of investing in core brands and expanding into snack market adjacencies. Key initiatives included restructuring the US sales force, creating a US Snack Group, and launching new better-for-you snack products. The report also discusses governance improvements and leadership changes on the board and in management.
This document is Hershey Foods Corporation's 2003 annual report and proxy statement to shareholders. It discusses Hershey's financial performance in 2003, including 13% earnings per share growth and continued margin expansion. It outlines the company's strategy of investing in core brands and expanding into snack market adjacencies. Key initiatives included restructuring the US sales force, creating a US Snack Group, and launching new better-for-you snack products. The report also discusses governance improvements and leadership changes on the board and in management.
This document is The Hershey Company's annual report (Form 10-K) filed with the SEC for the fiscal year ending December 31, 2005. It provides an overview of The Hershey Company's business including its principal product groups, brands, manufacturing and distribution operations, marketing strategies, raw material sourcing, and recent acquisitions. It also discloses that over 20% of its total net sales in 2005 were to McLane Company, one of the largest wholesale distributors in the US, and that cocoa is a significant raw material used in chocolate production which is imported from various regions including West Africa.
This document is Lexmark International's annual report on Form 10-K for the fiscal year ending December 31, 2003 filed with the Securities and Exchange Commission. It provides an overview of Lexmark's business including that it is a leading developer and supplier of printing solutions for offices and homes. Approximately half of Lexmark's revenue comes from international sales. The document discusses Lexmark's strategies, the printing hardware and supplies market, and risks related to currency exchange rates.
South Dakota State University degree offer diploma Transcriptynfqplhm
办理美国SDSU毕业证书制作南达科他州立大学假文凭定制Q微168899991做SDSU留信网教留服认证海牙认证改SDSU成绩单GPA做SDSU假学位证假文凭高仿毕业证GRE代考如何申请南达科他州立大学South Dakota State University degree offer diploma Transcript
Discover the Future of Dogecoin with Our Comprehensive Guidance36 Crypto
Learn in-depth about Dogecoin's trajectory and stay informed with 36crypto's essential and up-to-date information about the crypto space.
Our presentation delves into Dogecoin's potential future, exploring whether it's destined to skyrocket to the moon or face a downward spiral. In addition, it highlights invaluable insights. Don't miss out on this opportunity to enhance your crypto understanding!
https://36crypto.com/the-future-of-dogecoin-how-high-can-this-cryptocurrency-reach/
Solution Manual For Financial Accounting, 8th Canadian Edition 2024, by Libby...Donc Test
Solution Manual For Financial Accounting, 8th Canadian Edition 2024, by Libby, Hodge, Verified Chapters 1 - 13, Complete Newest Version Solution Manual For Financial Accounting, 8th Canadian Edition by Libby, Hodge, Verified Chapters 1 - 13, Complete Newest Version Solution Manual For Financial Accounting 8th Canadian Edition Pdf Chapters Download Stuvia Solution Manual For Financial Accounting 8th Canadian Edition Ebook Download Stuvia Solution Manual For Financial Accounting 8th Canadian Edition Pdf Solution Manual For Financial Accounting 8th Canadian Edition Pdf Download Stuvia Financial Accounting 8th Canadian Edition Pdf Chapters Download Stuvia Financial Accounting 8th Canadian Edition Ebook Download Stuvia Financial Accounting 8th Canadian Edition Pdf Financial Accounting 8th Canadian Edition Pdf Download Stuvia
Fabular Frames and the Four Ratio ProblemMajid Iqbal
Digital, interactive art showing the struggle of a society in providing for its present population while also saving planetary resources for future generations. Spread across several frames, the art is actually the rendering of real and speculative data. The stereographic projections change shape in response to prompts and provocations. Visitors interact with the model through speculative statements about how to increase savings across communities, regions, ecosystems and environments. Their fabulations combined with random noise, i.e. factors beyond control, have a dramatic effect on the societal transition. Things get better. Things get worse. The aim is to give visitors a new grasp and feel of the ongoing struggles in democracies around the world.
Stunning art in the small multiples format brings out the spatiotemporal nature of societal transitions, against backdrop issues such as energy, housing, waste, farmland and forest. In each frame we see hopeful and frightful interplays between spending and saving. Problems emerge when one of the two parts of the existential anaglyph rapidly shrinks like Arctic ice, as factors cross thresholds. Ecological wealth and intergenerational equity areFour at stake. Not enough spending could mean economic stress, social unrest and political conflict. Not enough saving and there will be climate breakdown and ‘bankruptcy’. So where does speculative design start and the gambling and betting end? Behind each fabular frame is a four ratio problem. Each ratio reflects the level of sacrifice and self-restraint a society is willing to accept, against promises of prosperity and freedom. Some values seem to stabilise a frame while others cause collapse. Get the ratios right and we can have it all. Get them wrong and things get more desperate.
New Visa Rules for Tourists and Students in Thailand | Amit Kakkar Easy VisaAmit Kakkar
Discover essential details about Thailand's recent visa policy changes, tailored for tourists and students. Amit Kakkar Easy Visa provides a comprehensive overview of new requirements, application processes, and tips to ensure a smooth transition for all travelers.
Enhancing Asset Quality: Strategies for Financial Institutionsshruti1menon2
Ensuring robust asset quality is not just a mere aspect but a critical cornerstone for the stability and success of financial institutions worldwide. It serves as the bedrock upon which profitability is built and investor confidence is sustained. Therefore, in this presentation, we delve into a comprehensive exploration of strategies that can aid financial institutions in achieving and maintaining superior asset quality.
Vicinity Jobs’ data includes more than three million 2023 OJPs and thousands of skills. Most skills appear in less than 0.02% of job postings, so most postings rely on a small subset of commonly used terms, like teamwork.
Laura Adkins-Hackett, Economist, LMIC, and Sukriti Trehan, Data Scientist, LMIC, presented their research exploring trends in the skills listed in OJPs to develop a deeper understanding of in-demand skills. This research project uses pointwise mutual information and other methods to extract more information about common skills from the relationships between skills, occupations and regions.
^%$Zone1:+971)581248768’][* Legit & Safe #Abortion #Pills #For #Sale In #Duba...mayaclinic18
Whatsapp (+971581248768) Buy Abortion Pills In Dubai/ Qatar/Kuwait/Doha/Abu Dhabi/Alain/RAK City/Satwa/Al Ain/Abortion Pills For Sale In Qatar, Doha. Abu az Zuluf. Abu Thaylah. Ad Dawhah al Jadidah. Al Arish, Al Bida ash Sharqiyah, Al Ghanim, Al Ghuwariyah, Qatari, Abu Dhabi, Dubai.. WHATSAPP +971)581248768 Abortion Pills / Cytotec Tablets Available in Dubai, Sharjah, Abudhabi, Ajman, Alain, Fujeira, Ras Al Khaima, Umm Al Quwain., UAE, buy cytotec in Dubai– Where I can buy abortion pills in Dubai,+971582071918where I can buy abortion pills in Abudhabi +971)581248768 , where I can buy abortion pills in Sharjah,+97158207191 8where I can buy abortion pills in Ajman, +971)581248768 where I can buy abortion pills in Umm al Quwain +971)581248768 , where I can buy abortion pills in Fujairah +971)581248768 , where I can buy abortion pills in Ras al Khaimah +971)581248768 , where I can buy abortion pills in Alain+971)581248768 , where I can buy abortion pills in UAE +971)581248768 we are providing cytotec 200mg abortion pill in dubai, uae.Medication abortion offers an alternative to Surgical Abortion for women in the early weeks of pregnancy. Zone1:+971)581248768’][* Legit & Safe #Abortion #Pills #For #Sale In #Dubai Abu Dhabi Sharjah Deira Ajman Fujairah Ras Al Khaimah%^^%$Zone1:+971)581248768’][* Legit & Safe #Abortion #Pills #For #Sale In #Dubai Abu Dhabi Sharjah Deira Ajman Fujairah Ras Al Khaimah%^^%$Zone1:+971)581248768’][* Legit & Safe #Abortion #Pills #For #Sale In #Dubai Abu Dhabi Sharjah Deira Ajman Fujairah Ras Al Khaimah%^^%$Zone1:+971)581248768’][* Legit & Safe #Abortion #Pills #For #Sale In #Dubai Abu Dhabi Sharjah Deira Ajman Fujairah Ras Al Khaimah%^^%$Zone1:+971)581248768’][* Legit & Safe #Abortion #Pills #For #Sale In #Dubai Abu Dhabi Sharjah Deira Ajman Fujairah Ras Al Khaimah%^^%$Zone1:+971)581248768’][* Legit & Safe #Abortion #Pills #For #Sale In #Dubai Abu Dhabi Sharjah Deira Ajman Fujairah Ras Al Khaimah%^^%$Zone1:+971)581248768’][* Legit & Safe #Abortion #Pills #For #Sale In #Dubai Abu Dhabi Sharjah Deira Ajman Fujairah Ras Al Khaimah%^^%$Zone1:+971)581248768’][* Legit & Safe #Abortion #Pills #For #Sale In #Dubai Abu Dhabi Sharjah Deira Ajman Fujairah Ras Al Khaimah%^^%$Zone1:+971)581248768’][* Legit & Safe #Abortion #Pills #For #Sale In #Dubai Abu Dhabi Sharjah Deira Ajman Fujairah Ras Al Khaimah%^^%$Zone1:+971)581248768’][* Legit & Safe #Abortion #Pills #For #Sale In #Dubai Abu Dhabi Sharjah Deira Ajman Fujairah Ras Al Khaimah%^^%$Zone1:+971)581248768’][* Legit & Safe #Abortion #Pills #For #Sale In #Dubai Abu Dhabi Sharjah Deira Ajman Fujairah Ras Al Khaimah%^^%$Zone1:+971)581248768’][* Legit & Safe #Abortion #Pills #For #Sale In #Dubai Abu Dhabi Sharjah Deira Ajman Fujairah Ras Al Khaimah%^^%$Zone1:+971)581248768’][* Legit & Safe #Abortion #Pills #For #Sale In #Dubai Abu Dhabi Sharjah Deira Ajman Fujairah Ras Al Khaimah%^^%$Zone1:+971)581248768’][* Legit & Safe #Abortion #Pills #For #Sale In #Dubai Abu Dhabi Sharjah Deira Ajman
Optimizing Net Interest Margin (NIM) in the Financial Sector (With Examples).pdfshruti1menon2
NIM is calculated as the difference between interest income earned and interest expenses paid, divided by interest-earning assets.
Importance: NIM serves as a critical measure of a financial institution's profitability and operational efficiency. It reflects how effectively the institution is utilizing its interest-earning assets to generate income while managing interest costs.
Falcon stands out as a top-tier P2P Invoice Discounting platform in India, bridging esteemed blue-chip companies and eager investors. Our goal is to transform the investment landscape in India by establishing a comprehensive destination for borrowers and investors with diverse profiles and needs, all while minimizing risk. What sets Falcon apart is the elimination of intermediaries such as commercial banks and depository institutions, allowing investors to enjoy higher yields.
1. UNITED STATES
SECURITIES AND EXCHANGE COMMISSION
WASHINGTON, D.C. 20549
FORM 10-K
H Annual Report Pursuant to Section 13 or 15(d) of the Securities Exchange Act of 1934
For the fiscal year ended December 31, 2005
OR
h Transition Report Pursuant to Section 13 or 15(d) of the Securities Exchange Act of 1934
For the transition period from ______________ to ______________
Commission File Number 1-183
Registrant, State of Incorporation, Address and Telephone Number
THE HERSHEY COMPANY
(a Delaware corporation)
100 Crystal A Drive
Hershey, Pennsylvania 17033
(717) 534-6799
I.R.S. Employer Identification Number 23-0691590
Securities registered pursuant to Section 12(b) of the Act:
Title of each class: Name of each exchange on which registered:
Common Stock, one dollar par value New York Stock Exchange
Securities registered pursuant to Section 12(g) of the Act: Class B Common Stock, one dollar par value
(Title of class)
Indicate by check mark if the registrant is a well-known seasoned issuer, as defined in Rule 405 of the Securities
Act. Yes H No h
Indicate by check mark if the registrant is not required to file reports pursuant to Section 13 or Section 15(d) of
the Act. Yes h No H
Indicate by check mark whether the registrant (1) has filed all reports required to be filed by Section 13 or 15(d) of
the Securities Exchange Act of 1934 during the preceding 12 months (or for such shorter period that the registrant was
required to file such reports), and (2) has been subject to such filing requirements for the past 90 days. Yes H No h
Indicate by check mark if disclosure of delinquent filers pursuant to Item 405 of Regulation S-K is not contained
herein, and will not be contained, to the best of registrant’s knowledge, in definitive proxy or information statements
incorporated by reference in Part III of this Form 10-K or any amendment to this Form 10-K. h
Indicate by check mark whether the registrant is an accelerated filer (as defined in Rule 12b-2 of the Securities
Exchange Act of 1934). Yes H No h
Indicate by check mark whether the registrant is a shell company (as defined in Rule 12b-2 of the Exchange Act).
Yes h No H
State the aggregate market value of the voting and non-voting common equity held by non-affiliates computed
by reference to the price at which the common equity was last sold, or the average bid and asked price of such common
equity, as of the last business day of the registrant’s most recently completed second fiscal quarter.
Common Stock, one dollar par value—$10,561,391,582 as of July 3, 2005.
Class B Common Stock, one dollar par value—$12,848,379 as of July 3, 2005. While the Class B Common Stock
is not listed for public trading on any exchange or market system, shares of that class are convertible into shares
of Common Stock at any time on a share-for-share basis. The market value indicated is calculated based on the
closing price of the Common Stock on the New York Stock Exchange on July 3, 2005.
Indicate the number of shares outstanding of each of the registrant’s classes of common stock as of the latest
practicable date.
Common Stock, one dollar par value—178,131,189 shares, as of February 17, 2006.
Class B Common Stock, one dollar par value—60,818,478 shares, as of February 17, 2006.
DOCUMENTS INCORPORATED BY REFERENCE
Portions of the Company’s Proxy Statement for the Company’s 2006 Annual Meeting of Stockholders are
incorporated by reference into Part III of this report.
2. PART I
Item 1. BUSINESS
The Hershey Company, its wholly-owned subsidiaries and entities in which it has a controlling
financial interest (the “Company”) are engaged in the manufacture, distribution and sale of
confectionery, snack, refreshment and grocery products. The Company was organized under the
laws of the State of Delaware on October 24, 1927, as a successor to a business founded in 1894 by
Milton S. Hershey.
The Company’s principal product groups include: confectionery and snack products sold in the form
of bar goods, bagged items and boxed items; refreshment products sold in the form of gum and mints;
and grocery products in the form of baking ingredients, chocolate drink mixes, peanut butter, dessert
toppings and beverages. The Company is the leader in the U.S. confectionery market and is a leader
in many of the other product groups in the United States. The Company is also a leader in many of
these product groups in Canada and Mexico. Operating profit margins vary among individual
products and product groups.
The Company manufactures confectionery and snack products in a variety of packaged forms
and markets them under more than 50 brands. The different packaged forms include various
arrangements of the same bar products, such as boxes, trays and bags, as well as a variety of different
sizes and weights of the same bar products, such as snack size, standard, king size, large and
giant bars.
The principal confectionery products sold in the United States include:
ALMOND JOY candy bar HERSHEY’S MINIATURES
ALMOND JOY, HEATH, HERSHEY’S, chocolate bars
KIT KAT, MR. GOODBAR, REESE’S, HERSHEY’S NUGGETS chocolates
ROLO, and YORK BITES candies JOLLY RANCHER candy
HERSHEY’S KISSABLES brand chocolate candies KIT KAT wafer bar
HERSHEY’S KISSES brand milk chocolates MOUNDS candy bar
filled with caramel PAYDAY peanut caramel bar
HERSHEY’S KISSES brand milk chocolates REESE’S peanut butter cups
HERSHEY’S milk chocolate bar REESE’S PIECES candy
HERSHEY’S milk chocolate bar with almonds TAKE5 candy bar
HERSHEY’S KISSES brand milk chocolates TWIZZLERS candy
filled with peanut butter YORK peppermint pattie
The principal snack products sold in the United States include:
HERSHEY’S, HERSHEY’S S’MORES and MAUNA LOA dry roasted macadamias
REESE’S SNACK BARZ rice and MAUNA LOA honey roasted macadamias
marshmallow bars MAUNA LOA macadamia mixed nuts
HERSHEY’S SMART ZONE nutrition bars MAUNA LOA macadamias and almonds
HERSHEY’S, ALMOND JOY, REESE’S MAUNA LOA milk chocolate macadamias
and YORK cookies
The principal refreshment products sold in the United States include:
BREATH SAVERS mints ICE BREAKERS mints and chewing gum
BUBBLE YUM bubble gum KOOLERZ chewing gum
ICE BREAKERS LIQUID ICE mints
1
3. Other confectionery products include:
5TH AVENUE candy bar KIT KAT BIG KAT wafer bar
ALMOND JOY, HERSHEY’S, REESE’S, KRACKEL chocolate bar
and YORK SWOOPS candies MILK DUDS candy
CADBURY chocolates MR. GOODBAR chocolate bar
CARAMELLO candy bar REESE’S NUTRAGEOUS candy bar
FAST BREAK candy bar REESE’S SUGAR FREE peanut butter
GOOD & PLENTY candy cups
HEATH toffee bar REESE’S BIG CUP peanut butter cups
HERSHEY’S COOKIES ‘N’ CREME candy REESESTICKS wafer bars
bar ROLO caramels in milk chocolate
HERSHEY’S HUGS chocolates SKOR toffee bar
HERSHEY’S POT OF GOLD boxed SPECIAL DARK chocolate bar
chocolates SYMPHONY milk chocolate bar
HERSHEY’S S’MORES candy bar WHATCHAMACALLIT candy bar
HERSHEY’S SUGAR FREE chocolate WHOPPERS malted milk balls
candy YORK SUGAR FREE peppermint pattie
HERSHEY’S Extra Dark candy ZAGNUT candy bar
JOLLY RANCHER SUGAR FREE hard ZERO candy bar
candy
In August 2005, the Company announced that it had acquired the assets of Joseph Schmidt
Confections, Inc., a premium chocolate maker located in San Francisco, California. Joseph Schmidt
is known for its artistic and innovative truffles, colorful chocolate mosaics, specialty cookies, and
handcrafted chocolates.
Also, in August 2005, the Company completed the previously announced acquisition of Scharffen
Berger Chocolate Maker, Inc. Based in San Francisco, California, Scharffen Berger is known for its
high-cacao content, signature dark chocolate bars and baking products.
The Company also manufactures and/or markets grocery products in the baking, beverage, peanut
butter and toppings categories. Principal products in the United States include:
HERSHEY’S BAKE SHOPPE baking chips HERSHEY’S syrup
and pieces HERSHEY’S toppings
HERSHEY’S chocolate milk mix REESE’S baking chips
HERSHEY’S cocoa REESE’S peanut butter
HERSHEY’S hot cocoa mix
HERSHEY’S chocolate and strawberry flavored milks are produced and sold under license by various
dairies throughout the United States. Baking and various other products are produced and sold under
the HERSHEY’S and REESE’S brand names by third parties that have been granted licenses by the
Company to use these trademarks.
Principal products in Canada include OH HENRY! candy bars, REESE PEANUT BUTTER CUPS
candy, MAX5 candy bars, TWIZZLER candy, GLOSETTE chocolate-covered raisins, peanuts and
almonds, POT OF GOLD boxed chocolates and CHIPITS chocolate chips. The Company also
manufactures, imports, markets, sells and distributes chocolate, confectionery and shelf-stable drink
products in Mexico under the HERSHEY’S and PELON PELO RICO brand names.
u
The Company has license agreements with several companies to manufacture and/or sell products
worldwide. Among the more significant are agreements with affiliated companies of Cadbury
Schweppes p.l.c. to manufacture and/or market and distribute YORK, PETER PAUL ALMOND JOY
and PETER PAUL MOUNDS confectionery products worldwide as well as CADBURY and
CARAMELLO confectionery products in the United States. The Company’s rights under these
agreements are extendible on a long-term basis at the Company’s option. The license for CADBURY
and CARAMELLO products is subject to a minimum sales requirement that the Company exceeded
2
4. in 2005. The Company also has an agreement with Societe des Produits Nestle SA, which licenses
the Company to manufacture and distribute KIT KAT and ROLO confectionery products in the
United States. The Company’s rights under this agreement are extendible on a long-term basis at
the Company’s option, subject to certain conditions, including minimum unit volume sales. In 2005,
the minimum unit volume requirements were exceeded. The Company has an agreement with an
affiliate of Huhtamaki Oy (“Huhtamaki”) pursuant to which it licenses the use of certain trademarks,
¨
including GOOD & PLENTY, HEATH, JOLLY RANCHER, MILK DUDS, PAYDAY and WHOPPERS
for confectionery products worldwide. The Company’s rights under this agreement are extendible on
a long-term basis at the Company’s option.
The Company’s products are sold primarily to wholesale distributors, chain grocery stores, mass
merchandisers, chain drug stores, vending companies, wholesale clubs, convenience stores, dollar
stores and concessionaires by full-time sales representatives, food brokers and part-time retail sales
merchandisers throughout the United States, Canada and Mexico. The Company believes its products
are sold in over 2 million retail outlets in North America. In 2005, sales to McLane Company, Inc., one
of the largest wholesale distributors in the United States to convenience stores, drug stores, wholesale
clubs and mass merchandisers, amounted to more than 20 percent of the Company’s total net sales.
The Company manufactures, imports, markets, sells and distributes chocolate products in Brazil under
the HERSHEY’S brand name, including IO-IO hazelnut creme items. In Japan, Korea, the Philippines
`
and China, the Company imports and/or markets selected confectionery and grocery products. The
Company also markets confectionery and grocery products in over 60 countries worldwide.
The Company’s marketing strategy is based upon its strong brand equities, product innovation, the
consistently superior quality of its products, manufacturing expertise and mass distribution
capabilities. In addition, the Company devotes considerable resources to the identification,
development, testing, manufacturing and marketing of new products. The Company utilizes a variety
of promotional programs for customers as well as advertising and promotional programs for
consumers. The Company employs promotional programs at various times during the year to
stimulate sales of certain products. The Company’s sales have typically been highest during the third
and fourth quarters of the year, representing seasonal and holiday-related sales patterns.
The Company recognizes that the distribution of its products is an important element in maintaining
sales growth and providing service to its customers. The Company attempts to meet the changing
demands of its customers by planning optimum stock levels and reasonable delivery times consistent
with achievement of efficiencies in distribution. To achieve these objectives, the Company has
developed a distribution network from its manufacturing plants, including distribution centers and
field warehouses strategically located throughout the United States, Canada and Mexico. The
Company primarily uses contract carriers to deliver its products from the distribution points to its
customers. In conjunction with sales and marketing efforts, the distribution system has been
instrumental in the growth of sales.
From time to time, the Company has changed the prices and weights of its products to accommodate
changes in manufacturing costs, the competitive environment and profit objectives, while at the same
time maintaining consumer value. In November 2005, the Company announced a combination of
price increases and weight changes on certain Jolly Rancher and Twizzler candy and chocolate
packaged candy items effective in December 2005 and early 2006. These changes represent a
weighted average price increase of approximately 1% over the entire domestic product line when fully
effective in the second quarter of 2006. In December 2004, the Company announced an increase in
the wholesale prices of approximately half of its domestic confectionery line. A weighted average
increase of approximately 6 percent on the Company’s standard bar, king-size bar, 6-pack and
vending lines was effective in January 2005 and a weighted average price increase of approximately
4 percent on packaged candy was effective in February 2005. The price increases announced in
December 2004 represented an average increase of 3 percent over the entire domestic product line.
The price increases and weight changes will help to offset increases in the Company’s input costs,
including raw and packaging materials, fuel, utilities, transportation and employee benefits.
3
5. The most significant raw material used in the production of the Company’s chocolate products is
cocoa. The Company buys a mix of cocoa beans and cocoa products, such as cocoa butter, cocoa liquor
and cocoa powder, to meet its manufacturing requirements. This commodity is imported principally
from Far Eastern, West African and South American equatorial regions. West Africa accounts for
approximately 70 percent of the world’s crop of cocoa beans. Cocoa beans are not uniform, and the
various grades and varieties reflect the diverse agricultural practices and natural conditions found
in the many growing areas. While civil unrest in the Ivory Coast, the world’s largest cocoa-producing
country, has resulted in volatile prices, the Company believes a significant disruption of cocoa
supplies from the Ivory Coast is unlikely. In the event such disruption does occur, the Company
believes cocoa from other producing countries and from current physical cocoa stocks in consuming
countries would provide a significant supply buffer. Historically there have been instances of weather
catastrophes, crop disease, civil disruptions, embargoes and other problems in cocoa producing
countries that have caused price fluctuations, but have never resulted in total loss of a particular
producing country’s cocoa crop and/or exports.
The table below sets forth annual average cocoa prices as well as the highest and lowest monthly
averages for each of the calendar years indicated. The prices are the monthly average of the
quotations at noon of the three active futures trading contracts closest to maturity on the New York
Board of Trade. Because of the Company’s forward purchasing practices discussed below, and
premium prices paid for certain varieties of cocoa beans, these average futures contract prices are
not necessarily indicative of the Company’s average cost of cocoa beans or cocoa products.
Cocoa Futures Contract Prices
(cents per pound)
2005 2004 2003 2002 2001
Annual Average 68.3 68.7 77.8 76.9 47.1
High 78.7 76.8 99.8 96.7 57.9
Low 63.5 62.1 65.6 60.3 41.5
Source: International Cocoa Organization Quarterly Bulletin of Cocoa Statistics
During 2005, cocoa prices traded in a relatively wide range between 64¢ and 79¢ per pound, based
on the New York Board of Trade futures contract. The Company’s costs will not necessarily reflect
market price fluctuations because of its forward purchasing practices, premiums and discounts
reflective of varying delivery times, and supply and demand for specific varieties and grades of
cocoa beans.
The Farm Security and Rural Investment Act of 2002, which is a six-year farm bill, impacts the prices
of sugar, corn, peanuts and milk because it sets price support levels for these commodities.
The price of sugar, one of the Company’s most important commodities for its products, is subject to price
supports under the above-referenced farm legislation. Due to import quotas and duties imposed to
support the price of sugar established by that legislation, sugar prices paid by United States users are
currently substantially higher than prices on the world sugar market. In 2005, hurricanes damaged
sugar cane crops and two cane refineries in Louisiana, causing the wholesale list price of refined sugar
to increase from 30¢ to 42¢ per pound. The Company’s costs for sugar will not necessarily reflect market
price fluctuations primarily because of its forward purchasing and hedging practices. United States
peanut prices began the year around 40¢ per pound but gradually declined during the year to 36¢ per
pound. Almond prices began the year at $3.00 per pound and rose to $4.00 per pound during the second
half of 2005. During the first three quarters of 2005, milk prices moderated only slightly from the high
price levels of 2004. Milk production in 2005 increased more than 3% compared with 2004 and prices
began to moderate in the fourth quarter of 2005. The Company believes that the supply of raw materials
is adequate to meet its manufacturing requirements.
The Company attempts to minimize the effect of future price fluctuations related to the purchase of
its major raw materials and certain energy requirements primarily through forward purchasing to
cover future requirements, generally for periods from 3 to 24 months. With regard to cocoa, sugar,
4
6. corn sweeteners, natural gas, fuel oil and certain dairy products, price risks are also managed by
entering into futures contracts. At the present time, active futures contracts are not available for use
in pricing the Company’s other major raw material requirements. Futures contracts are used in
combination with forward purchasing of cocoa, sugar, corn sweetener, natural gas and certain dairy
product requirements principally to take advantage of market fluctuations that provide more
favorable pricing opportunities and flexibility in sourcing these raw materials and energy
requirements. Fuel oil futures contracts are used to minimize price fluctuations associated with the
Company’s transportation costs. The Company’s commodity procurement practices are intended to
reduce the risk of future price increases and to provide visibility to future costs, but may also
potentially limit the ability to benefit from possible price decreases.
The primary effect on liquidity from using futures contracts is associated with margin requirements
for futures contracts related to cocoa, sugar, corn sweeteners, natural gas, fuel oil and certain dairy
products. Cash outflows and inflows result from original margins that are “good faith deposits”
established by futures exchanges to ensure that market participants will meet their contractual
financial obligations. Additionally, variation margin payments and receipts are required when the
value of open positions is adjusted to reflect daily price movements. The magnitude of such cash
inflows and outflows is dependent upon price coverage levels and the volatility of the markets. Cash
flows related to margin requirements historically have not been material to the Company’s total
working capital requirements.
The Company manages the purchase of forward and futures contracts by developing and monitoring
procurement strategies for each of its major commodities. These procurement strategies are directly
linked to the overall planning and management of the Company’s business, since the cost of raw
materials, energy and transportation accounts for a significant portion of cost of sales. Procurement
strategies with regard to cocoa, sugar and other major raw material requirements, energy
requirements and transportation costs are developed by the analysis of fundamentals, including
weather and crop analysis, imbalances between supply and demand, currency exchange rates,
political unrest in producing countries, speculative influences and by discussions with market
analysts, brokers and dealers. Procurement strategies are determined, implemented and monitored
on a regular basis by senior management. Procurement activities for all major commodities are also
reported to the Company’s Board of Directors (the “Board”) on a regular basis.
Competition
Many of the Company’s brands enjoy wide consumer acceptance and are among the leading brands
sold in the marketplace. However, these brands are sold in highly competitive markets and compete
with many other multinational, national, regional and local firms, some of which have resources in
excess of those available to the Company.
Trademarks
The Company owns various registered and unregistered trademarks and service marks and has rights
under licenses to use various trademarks that are of material importance to the Company’s business.
Backlog of Orders
The Company manufactures primarily for stock and fills customer orders from finished goods
inventories. While at any given time there may be some backlog of orders, such backlog is not material
in respect to total annual sales, nor are the changes from time to time significant.
Research and Development
The Company engages in a variety of research activities. These principally involve development of
new products, improvement in the quality of existing products, improvement and modernization of
production processes and the development and implementation of new technologies to enhance the
quality and value of both current and proposed product lines. Information concerning the Company’s
5
7. research and development expense is contained in Note 1 of the Notes to the Consolidated Financial
Statements (Item 8. Financial Statements and Supplementary Data).
Regulation
The Company’s domestic plants are subject to inspection by the Food and Drug Administration and
various other governmental agencies, and its products must comply with regulations under the
Federal Food, Drug and Cosmetic Act and with various comparable state statutes regulating the
manufacturing and marketing of food products.
Environmental Considerations
In the past the Company has made investments based on compliance with environmental laws and
regulations. Such expenditures have not been material with respect to the Company’s capital
expenditures, earnings or competitive position.
Employees
As of December 31, 2005, the Company had approximately 11,610 full-time and 2,140 part-time
employees, of whom approximately 3,965 were covered by collective bargaining agreements. The
Company considers its employee relations to be good.
Financial Information by Geographic Area
The Company’s principal operations and markets are located in the United States. The Company also
manufactures, markets, sells and distributes confectionery and grocery products in Canada, Mexico
and Brazil, imports and/or markets selected confectionery products in the Philippines, Japan and
South Korea and markets confectionery products in over 60 countries worldwide. The percentage of
total consolidated net sales for businesses outside of the United States was 10.9%, 9.8% and 9.9%
for 2005, 2004 and 2003, respectively. The percentage of total consolidated assets outside of the
United States as of December 31, 2005 and 2004, was 12.4% and 12.1%, respectively.
Available Information
The Company’s Annual Report on Form 10-K, Quarterly Reports on Form 10-Q, Current Reports on
Form 8-K and amendments to all of the foregoing reports are available, free of charge, in the Investor
Relations section of the Company’s website, www.hersheys.com, as soon as reasonably practicable
after the reports are electronically filed with or furnished to the United States Securities and
Exchange Commission.
The Board has adopted a Code of Ethical Business Conduct (“CEBC”) applicable to the Company’s
directors, officers and employees, including without limitation the Company’s Chief Executive Officer
and “senior financial officers” (including the Chief Financial Officer, Chief Accounting Officer and
persons performing similar functions). The CEBC is posted on the Company’s website at
www.hersheys.com in the Investor Relations section. Any amendment of the CEBC or waiver thereof
applicable to any director or executive officer of the Company, including the Chief Executive Officer
or any senior financial officer, will be disclosed on the Company’s website within four business days
of the date of such amendment or waiver. In the case of a waiver, the nature of the waiver, the name
of the person to whom the waiver was granted and the date of the waiver will also be disclosed.
The Board has also adopted and posted in the Investor Relations section of the Company’s website
the Company’s Corporate Governance Guidelines and Charters for each of the Board’s standing
committees. The Company will provide without charge to each beneficial owner of its Common Stock
and Class B Common Stock (“Class B Stock”), upon such stockholder’s request, a copy of the CEBC,
the Company’s Corporate Governance Guidelines or the Charter of any standing committee of the
Board. The Company will also provide to any such stockholder, upon the stockholder’s request, a copy
of one or more of the Exhibits listed in Part IV of this report upon payment by the stockholder of a
6
8. nominal fee approximating the Company’s reasonable cost to provide such copy or copies. Requests
for copies should be addressed to The Hershey Company, Attn: Investor Relations Department,
100 Crystal A Drive, Hershey, Pennsylvania 17033-0810.
Item 1A. RISK FACTORS
The nature of our operations and the environment in which we operate subject us to changing
economic, competitive, regulatory and technological conditions, risks and uncertainties. In
connection with the “safe harbor” provisions of the Private Securities Litigation Reform Act of 1995,
we note the following factors that, among others, could cause future results to differ materially from
the forward-looking statements, expectations and assumptions expressed or implied herein. Many
of the forward-looking statements contained in this document may be identified by the use of forward-
looking words such as “intend,” “believe,” “expect,” “anticipate,” “should,” “planned,” “estimated” and
“potential,” among others. Among the factors that could cause our actual results to differ materially
from such forward-looking statements are the risk factors described below.
Our ability to implement and generate expected ongoing annual savings from
initiatives to advance our value enhancing strategy
In July 2005, we announced initiatives intended to advance our value-enhancing strategy. These
initiatives include a U.S. Voluntary Workforce Reduction Program (“VWRP”), facility rationalization
and the streamlining and restructuring of our international operations, including a Canadian VWRP.
We project that these initiatives will be fully implemented by December 31, 2006. These initiatives
are expected to generate ongoing annual savings of approximately $45 million to $50 million when
fully implemented. The savings will be reinvested in activities that will further the growth of our
business, improve cash flows and enhance shareholder returns. Should ongoing annual savings fall
short of expectations, we may not reap the anticipated benefits of our value-enhancing strategy.
Changes in raw material and other costs and selling price increases
We use many different commodities for our business, including cocoa, sugar, milk, peanuts, almonds,
corn sweeteners, natural gas and fuel oil. Commodities are subject to price volatility caused by
commodity market fluctuations, the quality and availability of supply, weather, currency
fluctuations, speculative influences, trade agreements among producing and consuming nations,
political unrest in producing countries, consumer demand and changes in governmental agricultural
programs. Although we use forward contracts and commodity futures contracts to hedge commodity
prices, commodity price increases ultimately result in corresponding increases in our raw material
and energy costs. We may be able to pass some or all of the raw material and energy cost increases
to customers in the form of higher product prices; however, higher product prices may also result in
a reduction in sales volume. If we are not able to increase price realization and productivity to offset
increased raw material costs, or if sales volume is significantly reduced, it could have a negative
impact on our results of operations and financial condition.
Our ability to implement improvements to and reduce costs associated with the
supply chain
Further optimization of our supply chain is also essential to offset the potential for raw material and
other cost increases discussed above. We have made significant improvements to the supply chain,
consolidating our distribution network, exiting underperforming businesses and rationalizing the
product line. Continued productivity initiatives such as these will be necessary to offset future cost
increases and to enable potential expansion into adjacencies to our current product portfolio.
Pension cost factors
Changes in interest rates and the market value of plan assets can affect the funded status of our
pension plans and cause volatility in the net periodic benefit cost and future funding requirements
of the plans. Additionally, employee decisions to withdraw lump sums could result in pension
7
9. settlement losses depending on the magnitude of such withdrawals. Although the fair value of our
pension plan assets exceeded pension benefits obligations as of December 31, 2005, a significant
increase in future funding requirements could have a negative impact on our results of operations,
financial condition and cash flows.
Stock price
We are exposed to market risks arising from changes in the price of our Common Stock. Expenses
for incentive compensation, stock options and certain employee benefits could increase due to an
increase in the price of our Common Stock.
Market demand for new and existing products
We operate in highly competitive markets and rely on continued demand for our products. To generate
revenues and profits, we must sell products that appeal to our customers and to consumers.
Continued success is dependent on product innovation, including maintaining a strong pipeline of
new products, effective sales incentives, appropriate advertising campaigns and marketing
programs, and the ability to secure adequate shelf space at retail. In addition, success depends on
our response to consumer trends, consumer health concerns, including obesity and the consumption
of certain ingredients, and changes in product category consumption and consumer demographics.
Our largest customer, McLane Company, Inc., one of the largest wholesale distributors in the United
States to convenience stores, drug stores, wholesale clubs and mass merchandisers, accounted for
more than 20% of total net sales in 2005 reflecting the continuing consolidation of our customer base.
In this environment, there continue to be competitive product and pricing pressures, as well as
challenges in maintaining profit margins. We must maintain mutually beneficial relationships with
our key customers, including retailers and distributors, to compete effectively.
Marketplace competition
The global confectionery packaged goods industry is intensely competitive, as is the broader snack
market. In order to protect our existing market share or capture increased market share in this highly
competitive retail environment, we may be required to increase expenditures for promotions and
advertising, and continue to introduce and establish new products. Due to inherent risks in the
marketplace associated with advertising and new product introductions, including uncertainties
about trade and consumer acceptance, increased expenditures may not prove successful in
maintaining or enhancing our market share and could result in lower sales and profits. In addition,
we may incur increased credit and other business risks as a result of competing for customers in a
highly competitive retail environment.
Governmental laws and regulations
Changes in laws and regulations and the manner in which they are interpreted or applied may alter
the environment in which we operate and, therefore, affect our results of operations or increase
liabilities. These include changes in food and drug laws, laws related to advertising and marketing
practices, accounting standards, taxation requirements, competition laws, employment laws and
environmental laws. It is possible that we could become subject to additional liabilities in the future
resulting from changes in laws and regulations that could result in an adverse effect on the results
of our operations and financial condition.
International operations
In 2005, we derived approximately 11% of our net sales from customers located outside the
United States. In addition, portions of our total assets are located outside of the United States. As
a result, we are subject to numerous risks and uncertainties relating to international sales and
operations, including:
• Unforeseen global economic and environmental changes resulting in business interruption,
supply constraints, inflation, deflation or decreased demand;
8
10. • Difficulties and costs associated with complying with, and enforcing remedies under, a wide
variety of complex laws, treaties and regulations;
• Different regulatory structures and unexpected changes in regulatory environments;
• Political and economic instability, including the possibility of civil unrest;
• Nationalization of our properties by foreign governments;
• Tax rates that may exceed those in the United States and earnings that may be subject to
withholding requirements and incremental taxes upon repatriation;
• Potentially negative consequences from changes in tax laws;
• The imposition of tariffs, quotas, trade barriers, other trade protection measures and import
or export licensing requirements;
• Increased costs, disruptions in shipping or reduced availability of freight transportation; and
• The impact of currency exchange rate fluctuations between the U.S. dollar and foreign currencies.
Item 2. PROPERTIES
The following is a list of the Company’s principal manufacturing properties. The Company owns each
of these properties.
UNITED STATES
Hershey, Pennsylvania—confectionery and grocery products (3 principal plants)
Lancaster, Pennsylvania—confectionery products
Oakdale, California—confectionery and grocery products
Robinson, Illinois—confectionery, snack and grocery products
Stuarts Draft, Virginia—confectionery, snack and grocery products
CANADA
Smiths Falls, Ontario—confectionery and grocery products
The following is a list of the locations of the Company’s principal distribution facilities.
UNITED STATES
Edwardsville, Illinois (owned by the Company)
Palmyra, Pennsylvania (owned by the Company)
Redlands, California (leased)
CANADA
Mississauga, Ontario (leased)
In addition to the locations indicated above, the Company owns or leases several other properties
used for manufacturing its products and for sales, distribution and administrative functions. The
Company’s facilities are efficient and well maintained. These facilities generally have adequate
capacity and can accommodate seasonal demands, changing product mixes and certain additional
growth. The largest facilities are located in Hershey, Pennsylvania. Many additions and
improvements have been made to these facilities over the years and they include equipment of the
latest type and technology.
Item 3. LEGAL PROCEEDINGS
The Company has no material pending legal proceedings, other than ordinary routine litigation
incidental to its business.
Item 4. SUBMISSION OF MATTERS TO A VOTE OF SECURITY HOLDERS
Not applicable.
9
11. PART II
Item 5. MARKET FOR THE REGISTRANT’S COMMON EQUITY
Cash dividends paid on the Company’s Common Stock and Class B Stock were $221.2 million in 2005
and $205.7 million in 2004. The annual dividend rate on the Common Stock in 2005 was $.98 per
share, an increase of 11.4% over the 2004 rate of $.88 per share. The 2005 dividend increase
represented the 31st consecutive year of Common Stock dividend increases.
On February 16, 2006, the Company’s Board of Directors declared a quarterly dividend of $.245 per
share of Common Stock payable on March 15, 2006, to stockholders of record as of February 24, 2006.
It is the Company’s 305th consecutive Common Stock dividend. A quarterly dividend of $.22 per share
of Class B Stock also was declared.
The Company’s Common Stock is listed and traded principally on the New York Stock Exchange
(“NYSE”) under the ticker symbol “HSY.” Approximately 218.0 million shares of the Company’s
Common Stock were traded during 2005. The Class B Stock is not publicly traded.
The closing price of the Common Stock on December 31, 2005, was $55.25. There were 40,523
stockholders of record of the Common Stock and the Class B Stock as of December 31, 2005.
The following table shows the dividends paid per share of Common Stock and Class B Stock and the
price range of the Common Stock for each quarter of the past two years:
Dividends Paid Common Stock
Per Share Price Range*
Common Class B
Stock Stock High Low
2005
1st Quarter $.2200 $.2000 $64.72 $53.15
2nd Quarter .2200 .2000 67.37 59.40
3rd Quarter .2450 .2200 64.80 54.85
4th Quarter .2450 .2200 60.23 52.49
Total $.9300 $.8400
Dividends Paid Common Stock
Per Share Price Range*
Common Class B
Stock Stock High Low
2004
1st Quarter $.1975 $.1788 $43.90 $37.28
2nd Quarter .1975 .1788 46.50 40.55
3rd Quarter .2200 .2000 49.94 45.03
4th Quarter .2200 .2000 56.75 45.98
Total $.8350 $.7576
* NYSE-Composite Quotations for Common Stock by calendar quarter.
10
12. Unregistered Sales of Equity Securities and Use of Proceeds
None.
Issuer Purchases of Equity Securities
Purchases of equity securities during the fourth quarter of the fiscal year ended December 31, 2005
were as follows:
(a) (b) (c) (d)
Total Number Approximate
of Shares Dollar Value of
Total Purchased as Shares that May
Number Average Part of Publicly Yet Be Purchased
of Shares Price Paid Announced Plans Under the Plans
or Programs (1)
Period Purchased per Share or Programs
(in thousands of dollars)
October 3 through
October 30, 2005 1,083,200 $57.23 1,012,100 $105,054
October 31 through
November 27, 2005 350,900 $55.28 279,100 $ 89,701
November 28 through
December 31, 2005 519,828 $56.14 477,028 $562,869
Total 1,953,928 $56.59 1,768,228 $562,869
(1) In April 2005, the Company’s Board of Directors approved a new share repurchase program authorizing the repurchase
of up to $250 million of the Company’s Common Stock in the open market, or through privately negotiated transactions.
In December 2005, the Company’s Board of Directors approved an additional $500 million share repurchase program.
11
13. Item 6. SELECTED FINANCIAL DATA
SIX-YEAR CONSOLIDATED FINANCIAL SUMMARY
All dollar and share amounts in thousands except market price
and per share statistics
5-Year
Compound
Growth Rate 2005 2004 2003 2002 2001 2000
Summary of Operations
Net Sales(a) 4.8% $ 4,835,974 4,429,248 4,172,551 4,120,317 4,137,217 3,820,416
Cost of Sales(b) 3.7% $ 2,965,540 2,680,437 2,544,726 2,561,052 2,668,530 2,471,151
Selling, Marketing and
Administrative(a) (b) 4.4% $ 912,986 867,104 841,105 853,048 859,967 737,674
Business Realignment and
Asset Impairments Charge $ 96,537 — 23,357 27,552 228,314 —
Gain on Sale of Business(c) $ — — 8,330 — 19,237 —
Interest Expense, Net 3.0% $ 87,985 66,533 63,529 60,722 69,093 76,011
Provision for Income Taxes(b) 6.1% $ 279,682 237,273 258,849 226,786 131,228 207,805
Income before Cumulative Effect
of Accounting Change(b) 8.5% $ 493,244 577,901 449,315 391,157 199,322 327,775
Cumulative Effect of Accounting
Change $ — — 7,368 — — —
Net Income(b) 8.5% $ 493,244 577,901 441,947 391,157 199,322 327,775
Earnings Per Share before
Cumulative Effect of
Accounting Change(b):
—Basic—Common Stock 11.2% $ 2.07 2.33 1.75 1.46 .75 1.22
—Basic—Class B Stock 11.2% $ 1.87 2.12 1.58 1.32 .67 1.10
—Diluted 11.0% $ 1.99 2.25 1.70 1.42 .72 1.18
Weighted-Average Shares
Outstanding:
—Basic—Common Stock 183,747 193,037 201,768 212,219 211,612 213,764
—Basic—Class B Stock 60,821 60,844 60,844 60,856 60,878 60,888
—Diluted 248,292 256,934 264,532 275,429 275,391 276,731
Dividends Paid on Common Stock 8.1% $ 170,147 159,658 144,985 133,285 122,790 115,209
Per Share 11.5% $ .93 .835 .7226 .63 .5825 .54
Dividends Paid on Class B Stock 11.5% $ 51,088 46,089 39,701 34,536 31,960 29,682
Per Share 11.5% $ .84 .7576 .6526 .5675 .525 .4875
Net Income as a Percent of
Net Sales, GAAP Basis(a) (b) 10.2% 13.0% 10.6% 9.5% 4.8% 8.6%
Adjusted Net Income as a Percent
of Net Sales(a) (b) (d) 11.7% 11.7% 11.0% 10.3% 9.3% 8.8%
Depreciation 7.4% $ 200,132 171,229 158,933 155,384 153,493 140,168
Advertising(a) (4.4)% $ 125,023 137,931 145,387 162,874 187,244 156,319
Payroll 3.1% $ 647,825 614,037 585,419 594,372 614,197 557,342
Year-end Position and Statistics
Capital Additions 5.5% $ 181,069 181,728 218,650 132,736 160,105 138,333
Capitalized Software Additions 23.1% $ 13,236 14,158 18,404 11,836 9,845 4,686
Total Assets(b) 4.5% $ 4,295,236 3,812,784 3,587,151 3,486,956 3,248,752 3,450,206
Short-term debt and current
portion of long-term debt 26.0% $ 819,115 622,320 12,509 28,124 7,926 258,123
Long-term Portion of Debt 1.4% $ 942,755 690,602 968,499 851,800 876,972 877,654
Stockholders’ Equity(b) (3.3)% $ 1,021,076 1,137,102 1,325,710 1,410,443 1,183,097 1,206,812
Operating Return on Average
Stockholders’ Equity, GAAP Basis(b) 45.7% 46.9% 32.3% 30.2% 16.7% 28.1%
Adjusted Operating Return on
Average Stockholders’ Equity(b) (d) 52.6% 42.0% 33.6% 32.7% 32.1% 28.8%
Operating Return on Average
Invested Capital, GAAP Basis(b) 23.7% 25.9% 18.4% 17.6% 10.2% 13.9%
Adjusted Operating Return on
Average Invested Capital(b) (d) 27.0% 23.3% 19.1% 18.9% 18.4% 16.0%
Full-time Employees 13,750 13,700 13,100 13,700 14,400 14,300
Stockholders’ Data
Outstanding Shares of Common
Stock and Class B Stock
at Year-end(d) 240,524 246,588 259,059 268,440 271,278 272,563
Market Price of Common Stock
at Year-end(d) 11.4% $ 55.25 55.54 38.50 33.72 33.85 32.19
Range During Year $67.37–52.49 56.75–37.28 39.33–30.35 39.75–28.23 35.08–27.57 33.22–18.88
12
14. (a) All years have been restated in accordance with final FASB Emerging Issues Task Force consensuses reached on various
issues regarding the reporting of certain sales incentives.
(b) All years have been adjusted to reflect the adoption of Statement of Financial Accounting Standards No. 123 (Revised
2004), Share-Based Payment, using the modified retrospective application method.
(c) Includes the gain on the sale of gum brands in 2003 and the gain on the sale of the Luden’s throat drops business in 2001.
(d) Adjusted Net Income as a Percent of Net Sales, Operating Return on Average Stockholders’ Equity and Operating Return
on Average Invested Capital have been calculated using Net Income, excluding the after-tax impacts of the elimination
of amortization of indefinite-lived intangibles for all years, the reduction of the provision for income taxes resulting from
the adjustment of the income tax contingency reserves in 2004, the after-tax effect of the 2005, 2003, 2002 and 2001
Business Realignment and Asset Impairments Charges, the after-tax effect of incremental expenses to explore the possible
sale of the Company in 2002, the 2003 and 2001 Gain on the Sale of Businesses and the 2000 gain on the sale of certain
corporate aircraft.
Item 7. MANAGEMENT’S DISCUSSION AND ANALYSIS OF FINANCIAL
CONDITION AND RESULTS OF OPERATIONS
OVERVIEW
The Company concluded a strong year in 2005. Operating results were consistent with management’s
strategies to profitably grow net sales and carefully control selling, marketing and administrative
costs, resulting in balanced, consistent growth in earnings, excluding certain items affecting
comparability discussed below. Gross margin was lower in 2005, primarily due to business
realignment charges (further discussed in Note 4) and the full-year impact of the acquired Grupo
Lorena and Mauna Loa businesses.
The Company gained market share in key classes of trade, introduced new product platforms that
provide future growth opportunities and offset continued increases in the cost of major raw materials,
energy, employee benefits and compensation. Excluding certain items affecting comparability, the
result was record sales, profits and earnings per share for the year.
The Company’s long-term goals include increasing net sales 3%–4% per year, increasing earnings
before interest and income taxes (“EBIT”) 7%–9% per year, and increasing earnings per share (“EPS”)
9%–11% per year. These goals are intended to achieve balanced, sustainable growth over time. After
excluding items affecting comparability, the Company exceeded all of these goals in 2005.
The Company’s strategy to profitably grow net sales is based upon the introduction of innovative new
products and limited edition items utilizing its key brands, such as Hershey’s, Reese’s and Hershey’s
Kisses, together with focused promotion and merchandising activities of new and existing products.
During 2005, sales gains included recent product introductions such as Hershey’s Kisses filled with
peanut butter, Hershey’s Kissables brand chocolate candies, Hershey’s cookies, Reese’s Big Cup peanut
butter cups, Ice Breakers sour mints and Hershey’s Take5 candy bar, along with continued growth
in all major trade channels.
The trends of key marketplace metrics, such as retail takeaway and market share, continue to show
positive results. During 2005, the Company achieved gains in retail takeaway and market share and
strengthened its position in the U.S. confectionery market. In channels of distribution including sales
in the food, drug and mass merchandiser classes of trade, excluding sales to Wal-Mart Stores, Inc.,
U.S. consumer takeaway in 2005 increased by 3.5% resulting in a market share gain of 0.9 points.
Net sales increased approximately 9.2% in 2005, compared with 2004 net sales, which were
approximately 6.2% above 2003. The increase in 2005, and over the three-year period, primarily
resulted from higher unit sales volume due to the introduction of new products and limited edition
items, along with the impact of price increases, business acquisitions, improved exchange rates on
international sales and improved trade promotion efficiency resulting in lower promotional spending
as a percentage of sales.
Gross margin decreased from 39.5% in 2004 to 38.7% in 2005. The margin decline resulted primarily
from a less favorable product mix, primarily associated with the lower-margin Mauna Loa and Grupo
Lorena businesses, and the impact of business realignment charges which together reduced gross
13
15. margin by a total of 1.1 percentage points. Improved price realization, primarily from selling price
increases and improved profitability for the Company’s international businesses, more than offset
the impact of higher raw material, labor and overhead costs and sales of certain new products which
currently have lower margins.
The Company’s strategy to expand EBIT margin is based upon obtaining price realization by
achieving a larger part of its sales growth in its most highly profitable products and channels,
improving the efficiency and effectiveness of its trade promotion programs, improving efficiencies in
its supply chain and tight control of selling, marketing and administrative costs. The Company has
also implemented selected price increases and product weight reductions to help offset increases in
raw material and other costs.
EBIT margin decreased from 19.9% in 2004 to 17.8% in 2005. The EBIT margin decline resulted
primarily from a lower gross margin resulting from the lower-margin Mauna Loa and Grupo Lorena
businesses and the impact of business realignment charges which reduced EBIT margin by a total
of 3.1 percentage points. This decrease was partially offset by an improvement in EBIT margin of
1.0 percentage points resulting from improved price realization, improved profitability for the
Company’s international businesses and lower selling, marketing and administrative expenses as
a percentage of sales, which more than offset the impact of higher raw material, labor and overhead
costs and sales of certain new products which currently have lower margins.
Net income was $493.2 million in 2005 compared with $577.9 million in 2004. Net income per share-
diluted of $1.99 for 2005, was down 11.6% from $2.25 per share for 2004. Net income and net income
per share-diluted for 2005 was unfavorably impacted by the business realignment initiatives
discussed below. Net income for 2004 was favorably impacted by a $61.1 million adjustment to
Federal and state income tax contingency reserves, as discussed below.
Net income was $577.9 million in 2004 compared with $441.9 million in 2003. Net income per share-
diluted of $2.25 for 2004, was up 34.7% from $1.67 per share for 2003. This gain resulted from
increased income from operations, the non-recurring adjustment to the 2004 provision for income
taxes, the impact of lower weighted-average shares outstanding resulting from share repurchases
during the year and the impact of the cumulative effect of accounting changes recorded in 2003
associated with a change in accounting for the Company’s leases of certain warehouse and
distribution facilities.
In December 2004, the Financial Accounting Standards Board (“FASB”) issued Statement of
Financial Accounting Standards No. 123 (Revised 2004), Share-Based Payment (“SFAS No. 123R”).
SFAS No. 123R addresses the accounting for transactions in which an enterprise exchanges its
valuable equity instruments for employee services. It also addresses transactions in which an
enterprise incurs liabilities that are based on the fair value of the enterprise’s equity instruments
or that may be settled by the issuance of those equity instruments in exchange for employee services.
For public entities, the cost of employee services received in exchange for equity instruments,
including employee stock options, would be measured based on the grant-date fair value of those
instruments. That cost would be recognized as compensation expense over the requisite service
period (often the vesting period). Generally, no compensation cost would be recognized for equity
instruments that do not vest. The Company adopted SFAS No. 123R in the fourth quarter of 2005
and applied the modified retrospective application method to all prior years for which Statement of
Financial Accounting Standards No. 123 was effective. Accordingly, the consolidated financial
statements for all prior periods were adjusted to give effect to the fair-value-based method of
accounting for awards granted, modified or settled in cash subsequent to December 31, 1994.
Additional stock-based compensation expense resulting from the adoption of SFAS No. 123R reduced
net income by $21.7 million, $13.0 million and $15.6 million, or $.09, $.05 and $.06 per share-diluted,
in 2005, 2004 and 2003, respectively. The additional expense for 2005 included $2.4 million after tax,
or $.01 per share-diluted, in business realignment charges.
The table below presents various items affecting the comparability of income over the three-year
period ended December 31, 2005. All income and income per share amounts reflect the impact of the
14
16. adoption of SFAS No. 123R. Items affecting comparability include the impact of business realignment
initiatives in 2005 and 2003, a reduction of the income tax provision in 2004 as a result of adjustments
to income tax contingency reserves, and a gain on the sale of business in 2003. The Company believes
the presentation of income excluding such items provides additional information to investors to
facilitate the comparison of past and present operations which are indicative of its ongoing
operations. The Company excludes such items in evaluating key measures of performance internally
and in assessing the impact of known trends and uncertainties on its business. The Company believes
that this presentation provides a more balanced view of the underlying dynamics of the business.
Financial results including the impact of the reduction to the provision for income taxes, business
realignment initiatives and the gain on the sale of business, over the three-year period may be
insufficient in facilitating a complete understanding of the business as a whole and ascertaining the
likelihood that past performance is indicative of future performance.
The business realignment initiatives are described below and in Note 4 to the Consolidated Financial
Statements and the reduction to the provision for income taxes as a result of adjustments to income
tax contingency reserves is described below and in Note 12.
For the years ended December 31, 2005 2004 2003
In thousands of dollars except Per share- Per share- Per share-
per share amounts diluted diluted diluted
Income before cumulative effect of
accounting change $493,244 $1.99 $577,901 $2.25 $449,315 $1.70
Items affecting comparability after tax:
Business realignment and asset
impairments included in cost of sales 13,397 .05 — — 1,287 —
Business realignment and asset
impairments, net 60,624 .24 — — 14,201 .05
Gain on sale of business — — — — (5,706) (.02)
Tax provision adjustment — — (61,081) (.24) — —
Income excluding items affecting
comparability $567,265 $2.28 $516,820 $2.01 $459,097 $1.73
Income per share-diluted excluding items affecting comparability increased 13.4% in 2005 and 16.2%
in 2004, reflecting the impact of the Company’s increased sales, control of selling, marketing and
administrative costs and share repurchases during the periods. This performance also drove
increases in operating return on average invested capital during the period, as discussed under the
heading Return Measures on page 36.
During 2006, the Company expects sales growth to be somewhat above its long-term 3%–4% goal.
The Company anticipates higher input costs in 2006, particularly for commodities, transportation
and employee benefits. The Company expects to offset these cost increases through improved price
realization, procurement strategies, continued improvements in supply chain efficiency and tight
control of selling, marketing and administrative costs. EBIT is expected to increase slightly above
the long-term goal of 7%–9% in 2006, excluding items affecting comparability, and EBIT margin is
expected to increase approximately 90 basis points.
The Company expects to achieve 2006 growth in earnings per share-diluted slightly greater than its
long-term goal of 9%–11%, excluding items affecting comparability. This growth will result from the
sales and EBIT margin increases discussed above, combined with the realized annual savings from
business realignment initiatives, continued control of selling, marketing, and administrative costs
and the impact of lower shares outstanding resulting from continued share repurchases.
The Company’s cash flow from operations is expected to increase in 2006 primarily as a result of
reduced contributions to the Company’s pension plans and lower working capital requirements.
15
17. Primary challenges in 2006 and beyond include profitable sales growth within the U.S. core
confectionery category, the broader U.S. snack market and in selected international markets. Focus
will continue to be placed on higher margin and faster growth channels, as well as on key global
customers in selected regions of the world. The achievement of the Company’s objectives for sales
growth and profitability will also be challenged by changes in the business and competitive
environment which will continue to be characterized by increased global competition and customer
consolidation, along with social issues such as obesity concerns. In 2006, the Company will continue
to be faced with achieving increased price realization and improved productivity in order to offset
higher input costs for ingredients, transportation and employee benefits. Successfully meeting these
challenges is critical to the Company’s achievement of its financial objectives.
RESULTS OF OPERATIONS
Net Sales
Net sales for 2005 increased $406.7 million, or 9.2%, from 2004. Business acquisitions contributed
approximately 2.9% of the increase from 2004. Approximately two-thirds of the additional sales
increase of 6.3% resulted from unit volume growth, primarily reflecting the introduction of new
products and limited edition items, and improved performance by the Company’s international
businesses, particularly the Canadian, Mexican and export businesses in Asia and Latin America.
The remainder of the sales increase resulted from selling price increases, a lower rate of promotional
spending and the impact of favorable foreign currency exchange rates for the Company’s
international businesses.
Net sales increased $256.7 million, or 6.2%, from 2003 to 2004. Net sales were favorably impacted
by increased sales volume, especially within the United States, primarily driven by the introduction
of innovative new products and limited edition items. Net sales of the Company’s Canadian, Mexican
and Brazilian businesses also improved as a result of higher sales volume. Favorable foreign currency
exchange rates also resulted in increased sales for the Company’s international businesses,
particularly in Canada. The positive impact of increased sales volume contributed more than 75%
of the consolidated net sales growth. Higher selling prices, a more efficient rate of promotional
spending and the acquisition of the Grupo Lorena business in Mexico also contributed to the net sales
increase. Sales were unfavorably affected by the divestiture of certain gum brands in September
2003, decreased sales of remaining gum brands, and higher returns, discounts and allowances,
relating primarily to the sales volume growth, along with lower export sales in Asia, particularly in
China and Taiwan.
Cost of Sales
Cost of sales increased $285.1 million, or 10.6%, from 2004 to 2005. Business realignment charges
increased cost of sales by $22.5 million. The remainder of the cost increase was primarily caused by
higher sales volume, business acquisitions, and higher raw material costs, in addition to higher labor,
overhead and distribution costs. Gross margin decreased from 39.5% in 2004 to 38.7% in 2005. The
margin decline resulted primarily from a less favorable product mix, primarily associated with the
lower-margin Mauna Loa and Grupo Lorena businesses, and the impact of business realignment
charges which together reduced gross margin by a total of 1.1 percentage points. Improved price
realization, primarily from selling price increases and improved profitability for the Company’s
international businesses, more than offset the impact of higher raw material, labor and overhead
costs and sales of certain new products which currently have lower margins.
Cost of sales increased $135.7 million, or 5.3%, from 2003 to 2004. The cost increase was primarily
caused by higher sales volume and higher raw material costs, principally associated with increased
prices for cocoa and dairy products. These cost of sales increases were partially offset by lower costs
primarily resulting from product weight reductions and reduced costs for packaging materials.
Gross margin increased from 39.0% in 2003 to 39.5% in 2004. The margin expansion reflected
improved price realization, primarily from reduced product weights and reduced promotional
16
18. spending as a percentage of sales, as well as efficiency improvements in manufacturing operations.
The margin improvements were partially offset by increases in raw material costs.
Selling, Marketing and Administrative
Selling, marketing and administrative expenses for 2005 increased $45.9 million, or 5.3%, from 2004,
primarily reflecting increased performance-based employee compensation costs (which include stock-
based compensation), incremental expenses related to business acquisitions and higher consumer
promotion expenses. These increases were offset somewhat by lower advertising expense. Selling,
marketing and administrative expenses as a percentage of sales declined from 19.6% in 2004 to 18.9%
in 2005.
Selling, marketing and administrative expenses for 2004 increased by $26.0 million, or 3.1%, from
2003. The increase was primarily attributable to higher employee compensation costs (which have
been adjusted to reflect stock-based compensation under SFAS No. 123R), increased consumer
promotion expenses, termination costs associated with the closing of certain warehouse facilities, and
litigation expenses associated with the introduction of Hershey’s SmartZone nutrition bars. These
increases were offset somewhat by lower advertising expenses and a reduction in allowances for
doubtful accounts, as described below. Selling, marketing and administrative expenses as a
percentage of sales, decreased from 20.2% in 2003 to 19.6% in 2004. During the fourth quarter of 2004,
the Company reached an agreement with Fleming Reclamation Creditor’s Trust, which resolved most
significant matters related to the bankruptcy of Fleming Companies, Inc., one of the Company’s
customers. Based on this agreement, the Company reduced its bad debt reserves by the $5.0 million
which had been added at the time of the bankruptcy announcement in April 2003.
Business Realignment Initiatives
In July 2005, the Company announced initiatives intended to advance its value-enhancing strategy.
The Company also announced that it would record a total pre-tax charge of approximately
$140 million to $150 million, or $.41 to $.44 per share-diluted in connection with these initiatives.
Of the total pre-tax charge, approximately $80 million will be incurred in connection with a U.S.
Voluntary Workforce Reduction Program (“VWRP”), approximately $41 million will be incurred
in connection with facility rationalization, and approximately $24 million will be incurred in
connection with streamlining and restructuring the Company’s international operations, including
a Canadian VWRP.
During the second half of 2005, the Company recorded charges totaling $119.0 million associated with
the initiatives. The charges of $119.0 million consisted of a $96.5 million business realignment charge
and $22.5 million recorded in cost of sales (together, the “2005 business realignment initiatives”). The
business realignment charge included $69.5 million related to the U.S. VWRP, $12.8 million for
facility rationalization relating to the closure of the Las Piedras, Puerto Rico plant, and $14.2 million
related to streamlining the Company’s international operations, primarily associated with costs for
the Canadian VWRP. The charge for facility rationalization included $8.3 million for involuntary
termination benefits primarily for Las Piedras plant employees. The $22.5 million recorded in cost
of sales resulted primarily from accelerated depreciation related to the closure of the Las Piedras
manufacturing facility. The Company believes that the 2005 business realignment initiatives will be
fully completed by December 31, 2006.
Based on current estimates, the cost to implement the business realignment program will result in
total pre-tax charges of approximately $140 million to $150 million, or $.35 to $.38 per share-diluted
on an after-tax basis. Total pre-tax charges of $119.0 million, or $.29 per share-diluted, were recorded
in the second half of 2005, with the remainder to be substantially recorded in the first half of 2006.
17
19. Changes in liabilities recorded for the business realignment initiatives were as follows:
New charges
Fourth during
Balance Quarter Fourth Balance
Accrued Liabilities 10/02/05 Utilization Quarter 12/31/05
In thousands of dollars
VWRP $33,726 $ (5,650) $3,807 $31,883
Facility rationalization 4,725 (6,615) 1,890 —
Streamline international
operations 5,390 (890) 1,388 5,888
Total $43,841 $(13,155) $7,085 $37,771
During 2003, the Company executed a number of initiatives continuing its value-enhancing strategy.
These initiatives included realigning the sales organization and streamlining the supply chain
by divesting or eliminating certain non-strategic brands and products, and by production line
rationalization. These actions resulted in a net charge of approximately $17.2 million, or $.04 per
share-diluted. The $17.2 million net charge consisted of the write-off of certain inventories of
$2.1 million included in cost of sales, a net business realignment and asset impairments charge of
$23.4 million and an $8.3 million net gain resulting from the divestiture of certain brands (together,
the “2003 business realignment initiatives”).
The net business realignment and asset impairments charge of $23.4 million consisted of early
retirement and involuntary termination costs of $10.0 million, sales office closing and relocation costs
of $7.3 million, fixed asset impairment charges of $5.7 million, equipment removal costs of $.7 million
and a net gain of $.3 million relating to the elimination of non-strategic brands and products. In
determining the fixed asset impairment losses, fair value was estimated based on the expected sales
proceeds. Cash payments during 2004 reduced the liability balance to $3.9 million as of December 31,
2004. Cash payments during 2005 reduced the liability balance to $1.3 million.
Arising out of the 2003 business realignment initiatives, eight former employees of the Company
filed a complaint in federal court in Colorado alleging the Company discriminated against them on
the basis of age. The trial of these claims is scheduled to begin in the Fall of 2006. The Company
intends to vigorously defend against these claims and, based on the developments of the case to date,
the Company does not consider the likelihood of a material unfavorable outcome to the Company to
be probable.
Gain on Sale of Business
As part of the Company’s business realignment initiatives, the sale of a group of gum brands to
Farley’s & Sathers Candy Company, Inc. (“Farley’s & Sathers”) was completed in September 2003.
The gum brands included Fruit Stripe chewing gum, Rain-Blo gum balls and Super Bubble bubble
gum. In the third quarter of 2003, the Company received cash proceeds from the sale of $20.0 million
and recorded a gain of $8.3 million before tax, or $5.7 million after tax, as a result of the transaction.
Interest Expense, Net
Net interest expense in 2005 was $21.5 million higher than 2004, primarily reflecting higher short-
term interest expense and decreased capitalized interest. The increase in short-term interest expense
was primarily associated with commercial paper borrowings to finance stock repurchases and
contributions to the Company’s pension plans, in addition to higher interest rates in 2005. Net
interest expense for 2004 was $3.0 million higher than in 2003 primarily reflecting higher short-term
interest expense, partially offset by increased capitalized interest. The increase in short-term interest
expense was associated with commercial paper borrowings during 2004 for repurchases of Common
Stock, business acquisitions and other funding requirements.
18
20. Income Taxes
The effective income tax rate for 2005 was 36.2%, compared with 29.1% in 2004 and 36.6% in 2003.
The effective income tax rate for 2005 benefited by 0.2 percentage points from the impact of tax rates
associated with the business realignment charges. The effective income tax rate for 2004 is not
comparable with the rates for 2005 and 2003 because the Company’s provision for income taxes was
reduced by the $61.1 million adjustment to income tax contingency reserves recorded in the second
quarter of 2004. This non-cash reduction of income tax expense resulted from the settlement of
Federal tax audits for the 1999 and 2000 tax years, as well as the resolution of a number of state
tax audit issues. Based upon the results of the audits, the income tax contingency reserves were
adjusted, resulting in a reduction of $61.1 million in income tax expense. The income tax contingency
reserve adjustments related primarily to the deductibility of certain expenses, interest on potential
assessments, and acquisition and divestiture matters. The reduction in the 2004 provision for income
taxes resulting from the adjustment to income tax contingency reserves reduced the effective income
tax rate by 7.3 percentage points.
Cumulative Effect of Accounting Change
An after-tax charge of $7.4 million, or $.03 per share-diluted, was recorded in 2003 to reflect the
cumulative effect of a change in accounting for the Company’s leases of certain warehouse and
distribution facilities as discussed further under the heading Off-Balance Sheet Arrangements,
Contractual Obligations and Contingent Liabilities and Commitments.
Net Income
Net income decreased $84.7 million, or 14.6%, and net income per share-diluted decreased $.26, from
2004 to 2005. Net income for 2005 was unfavorably impacted by total charges associated with
business realignment initiatives of $119.0 million before tax, $74.0 million after tax or $.29 per share-
diluted. Net income for 2004 was favorably impacted by $61.1 million, or $.24 per share-diluted, as
a result of the adjustment to the Federal and state income tax contingency reserves.
Net income was $577.9 million in 2004 compared with $441.9 million in 2003. Net income per share-
diluted of $2.25 for 2004, increased $.58 per share from $1.67 per share for 2003 as a result of the
reduction to the 2004 provision for income taxes resulting from the adjustment to income tax
contingency reserves, increased income from operations and the impact of lower weighted-average
shares outstanding resulting from share repurchases during the year, in addition to the impact of
the cumulative effect of accounting change recorded in 2003.
FINANCIAL CONDITION
The Company’s financial condition remained strong during 2005. The capitalization ratio (total short-
term and long-term debt as a percent of stockholders’ equity, short-term and long-term debt)
increased to 63% as of December 31, 2005, from 54% as of December 31, 2004. The higher
capitalization ratio in 2005 primarily reflected the impact of additional short-term and long-term
borrowings. The ratio of current assets to current liabilities was 0.9:1 as of December 31, 2005, and
December 31, 2004.
In August 2005, the Company acquired the assets of Joseph Schmidt Confections, Inc., a premium
chocolate maker located in San Francisco, California. Joseph Schmidt is known for its artistic and
innovative truffles, colorful chocolate mosaics, specialty cookies, and handcrafted chocolates. These
products are sold in select department stores and other specialty outlets nationwide as well as in
Joseph Schmidt stores located in San Jose and San Francisco, California.
Also, in August 2005, the Company completed the acquisition of Scharffen Berger Chocolate Maker,
Inc. Based in San Francisco, California, Scharffen Berger is known for its high-cacao content,
signature dark chocolate bars and baking products sold online and in a broad range of outlets,
including specialty retailers, natural food stores and gourmet centers across the country. Scharffen
Berger also owns and operates three specialty stores located in New York City, Berkeley, and San
19
21. Francisco. The combined purchase price for Scharffen Berger and Joseph Schmidt was $47.1 million,
with the final amount subject to upward adjustment not to exceed $61.1 million to be determined
based upon actual sales growth through 2007. Together, these companies have combined annual sales
of approximately $25 million.
In December 2004, the Company acquired Mauna Loa Macadamia Nut Corporation (“Mauna Loa”)
for $127.8 million. Mauna Loa is the leading processor and marketer of macadamia snacks, with
annual sales of approximately $80 million. In October 2004, the Company’s Mexican subsidiary,
Hershey Mexico, acquired Grupo Lorena, one of Mexico’s top sugar confectionery companies, for
$39.0 million. This business has annual sales of over $30 million. Included in the acquisition was
the Pelon Pelo Rico brand.
´
Results subsequent to the dates of acquisition were included in the consolidated financial statements.
Had the results of the acquisitions been included in the consolidated financial statements for each
of the periods presented, the effect would not have been material.
In July 2004, the Company purchased 11,281,589 shares of its Common Stock from the Milton Hershey
School Trust, in a privately negotiated transaction. The Company paid $44.32 per share, or
approximately $500.0 million for the shares and fees of $1.4 million associated with the transaction.
In October 2005, the Company completed the sale of its Mr. Freeze freeze pops business in Canada
for $2.7 million.
In September 2003, the Company completed the sale of certain gum brands to Farley’s & Sathers
for $20.0 million in cash as part of its business realignment initiatives. The gum brands included
Fruit Stripe chewing gum, Rain-Blo gum balls and Super Bubble bubble gum.
Assets
Total assets increased $482.5 million, or 12.7% as of December 31, 2005, primarily as a result of
higher accounts receivable, inventories and other assets.
Current assets increased by $211.2 million, principally reflecting increased accounts receivable
resulting from increased sales of new products and seasonal items in December 2005, which qualified
for extended payment terms, and higher inventories associated with the timing of receipts of raw
materials, along with increased goods in process inventories to support higher manufacturing
requirements in early 2006.
Property, plant and equipment was lower than the prior year primarily due to depreciation
expense of $200.1 million, including $21.8 million of accelerated depreciation expense related to the
2005 business realignment initiatives as discussed above, partially offset by capital additions of
$181.1 million. Goodwill increased as a result of the 2005 business acquisitions. The increase in other
intangibles primarily reflected the estimated value of trademarks and customer-related intangibles
from the business acquisitions. The increase in other assets was primarily related to contributions
to the Company’s pension plans of $277.5 million, reduced somewhat as a result of pension expense
recorded in 2005.
Liabilities
Total liabilities increased by $598.5 million as of December 31, 2005, primarily reflecting an increase
in short-term and long-term borrowings and higher deferred income taxes. Higher accrued liabilities
were primarily associated with the business realignment initiatives, offset somewhat by reduced
liabilities for promotional allowances. The increase in short-term debt of $475.8 million reflected
commercial paper borrowings primarily associated with the repurchase of the Company’s Common
Stock, pension contributions, and the acquisition of the Scharffen Berger and Joseph Schmidt
businesses, along with other funding requirements. The decrease in the current portion of long-term
debt was associated with the retirement of $201.2 million of 6.7% Notes in October 2005 and the
refinancing of $76.8 million related to certain lease agreements. The increase in other long-term
liabilities was primarily associated with post-retirement and pension benefits in addition to deferred
20
22. incentive compensation. The increase in deferred taxes was primarily associated with the impact of
pension contributions made during 2005.
Capital Structure
The Company has two classes of stock outstanding, Common Stock and Class B Stock. Holders of
the Common Stock and the Class B Stock generally vote together without regard to class on matters
submitted to stockholders, including the election of directors, with the Common Stock having one vote
per share and the Class B Stock having ten votes per share. However, the Common Stock, voting
separately as a class, is entitled to elect one-sixth of the Board of Directors. With respect to dividend
rights, the Common Stock is entitled to cash dividends 10% higher than those declared and paid on
the Class B Stock.
The Milton Hershey School Trust maintains voting control over the Company. However, the Milton
Hershey School Trust has not taken an active role in setting policy for the Company, nor has it
exercised influence with regard to the ongoing business decisions of the Company’s Board of Directors
or management. The Milton Hershey School Trust decided to explore a sale of the Company in June
2002, but subsequently decided to terminate the sale process in September 2002. After terminating
the sale process, the Trustee of the Milton Hershey School Trust advised the Pennsylvania Office of
Attorney General in September 2002 that it would not agree to any sale of its controlling interest
in the Company without approval of the court having jurisdiction over the Milton Hershey School
Trust following advance notice to the Office of Attorney General. Subsequently, Pennsylvania enacted
legislation that requires that the Office of Attorney General be provided advance notice of any
transaction that would result in the Milton Hershey School Trust no longer having voting control of
the Company. The law provides specific statutory authority for the Attorney General to intercede,
and petition the Court having jurisdiction over the Milton Hershey School Trust to stop such a
transaction if the Attorney General can prove that the transaction is unnecessary for the future
economic viability of the Company and is inconsistent with investment and management
considerations under fiduciary obligations. This legislation could have the effect of making it more
difficult for a third party to acquire a majority of the Company’s outstanding voting stock and thereby
delay or prevent a change in control of the Company.
In December 2000, the Company’s Board of Directors unanimously adopted a Stockholder Protection
Rights Agreement (“Rights Agreement”). The Company’s largest stockholder, the Milton Hershey
School Trust, supported the Rights Agreement. This action was not in response to any specific effort
to acquire control of the Company. Under the Rights Agreement, the Company’s Board of Directors
declared a dividend of one right (“Right”) for each outstanding share of Common Stock and Class B
Stock payable to stockholders of record at the close of business on December 26, 2000. The Rights
will at no time have voting power or receive dividends. The issuance of the Rights has no dilutive
effect, will not affect reported earnings per share, is not taxable and will not change the manner in
which the Company’s Common Stock is traded. The Rights Agreement is discussed further in Note 15
to the Consolidated Financial Statements.
LIQUIDITY AND CAPITAL RESOURCES
Historically, the Company’s major source of financing has been cash generated from operations.
The Company’s income and, consequently, cash provided from operations during the year are
affected by seasonal sales patterns, the timing of new product introductions, business acquisitions
and divestitures, and price changes. Sales have typically been highest during the third and fourth
quarters of the year, representing seasonal and holiday-related sales patterns. Generally,
seasonal working capital needs peak during the summer months and have been met by issuing
commercial paper.
Over the past three years, cash provided from operating activities totaled $1.8 billion, which includes
contributions to the Company’s pension plans of $405.8 million. Cash provided from operating
activities was more than sufficient to fund investing activities, which included capital additions,
capitalized software additions and business acquisitions. Cash used by investing activities totaled
21
23. $818.4 million. Over the three year period, cash used by financing activities totaled $1.2 billion.
Financing activities included cash used for the repurchase of common stock of $1.7 billion and cash
dividends of $611.7 million. These cash outflows were partially offset by cash provided from net
short-term and long-term borrowings of $761.5 million and cash provided from the exercise of stock
options of $216.4 million. Cash equivalents decreased by $230.6 million over the three-year period.
The Company anticipates that capital expenditures and capitalized software additions will be in the
range of $190 million to $200 million per year during the next several years primarily for continued
efficiency improvements in existing facilities and capacity expansion to support sales growth and new
products, along with continued improvement and enhancements of computer software. As of
December 31, 2005, the Company’s principal capital commitments included manufacturing capacity
expansion to support sales growth and new products, modernization and efficiency improvements
and selected enhancements of computer software.
As of December 31, 2005, the fair value of the Company’s pension plan assets exceeded benefits
obligations by $157.0 million. Contributions totaling $277.5 million, $8.0 million and $120.3 million
were made to the pension plans during 2005, 2004 and 2003, respectively, primarily to improve the
funded status.
Under share repurchase programs which began in 1993, a total of 55,836,092 shares of Common
Stock have been repurchased for approximately $1.5 billion, including purchases from the Milton
Hershey School Trust of 8,000,000 shares for $103.1 million in 1993 and 3,159,558 shares for
$100.0 million in 1999. Of the shares repurchased, 1,056,000 shares were retired and 24,309,875
shares were reissued to satisfy stock option obligations, Supplemental Retirement Contributions
and employee stock ownership trust (“ESOP”) obligations. Of the shares reissued, 21,624,812 shares
were repurchased in the open market to replace the reissued shares. Additionally, the Company
has purchased a total of 67,282,661 shares of its Common Stock to be held as Treasury Stock from
the Milton Hershey School Trust for $1.5 billion in privately negotiated transactions, including
11,281,589 shares for approximately $500 million in 2004. As of December 31, 2005, a total of
119,377,690 shares were held as Treasury Stock.
In April 2005, the Company’s Board of Directors approved a $250 million share repurchase program.
As of December 31, 2005, $62.9 million remained available for repurchases of Common Stock under
this program. In December 2005, the Company announced that its Board of Directors approved an
additional $500 million stock repurchase authorization. The Company expects to complete both
authorizations by the end of 2006. In this regard, the Company and Hershey Trust Company, as
trustee for the benefit of Milton Hershey School (the “Milton Hershey School Trust”), have entered
into an agreement under which the Milton Hershey School Trust intends to participate on a
proportional basis in the Company’s stock repurchase program. The price at which the Milton
Hershey School Trust will sell stock to the Company is based on a formula under which the Milton
Hershey School Trust will not be required to sell shares to the Company for an amount less than
$55 per share. The agreement will expire on July 31, 2006.
The Company exercised its option to purchase two warehouse and distribution facilities subject
to consolidated lease arrangements and refinanced the related obligations of $59.3 million and
$17.5 million in July and October 2005, respectively.
In August 2005, the Company issued $250 million of 4.85% Notes due in 2015 under the Form S-3
Registration Statement which was declared effective in August 1997. The Company filed another
Form S-3 Registration Statement that was declared effective in January 2006 (the “January 2006
Registration Statement”) under which it could offer, on a delayed or continuous basis, up to $750
million of additional debt securities. Proceeds from the debt issuance and any offering of the debt
securities available under the January 2006 Registration Statement may be used for general
corporate purposes which include reducing existing commercial paper borrowings, financing capital
22
24. additions, and funding contributions to the Company’s pension plans, future business acquisitions
and working capital requirements. The Company expects to execute $500 million of term financing
during 2006 under the January 2006 Registration Statement.
In November 2004, the Company entered into a Five Year Credit Agreement (the “Credit Agreement”)
with the banks, financial institutions and other institutional lenders listed on the respective
signature pages thereof (“Lenders”), Citibank, N.A., as administrative agent for the Lenders (as
defined therein), Bank of America, N.A., as syndication agent, UBS Loan Finance LLC, as
documentation agent, and Citigroup Global Markets, Inc. and Banc of America Securities LLC, as
joint lead arrangers and joint book managers. The Credit Agreement establishes an unsecured
revolving credit facility under which the Company may borrow up to $900 million with the option
to increase borrowings by an additional $600 million with the concurrence of the Lenders. Funds
borrowed may be used for general corporate purposes, including commercial paper backstop and
business acquisitions. Advances other than competitive bid advances may be repaid without
penalty at any time prior to the last day of the Credit Agreement. Competitive bid advances must
be paid at maturity, and may not be prepaid. The Credit Agreement contains a financial covenant
whereby the ratio of (a) pre-tax income from operations from the most recent four fiscal quarters to
(b) consolidated interest expense for the most recent four fiscal quarters may not be less than 2.0 to
1 at the end of each fiscal quarter. The Credit Agreement contains customary representations and
warranties and events of default. Payment of outstanding advances may be accelerated, at the option
of the Lenders, should the Company default in its obligations under the Credit Agreement.
In September 2005, the Company entered into a new short-term credit agreement to establish an
unsecured revolving credit facility to borrow up to $300 million. The agreement expired on
December 30, 2005. Funds were used for general corporate purposes. The new short-term credit
facility was entered into because the Company expected borrowings to exceed $900 million for up to
three months beginning in early October 2005 due to the retirement of $200 million of 10-year notes
in October 2005, refinancing of certain consolidated lease arrangements, recent contributions to the
Company’s pension plans, stock repurchases and seasonal working capital needs.
The Company also maintains lines of credit with domestic and international commercial banks,
under which it could borrow in various currencies up to approximately $71.1 million and $60.3 million
as of December 31, 2005 and 2004, respectively. The higher lines of credit as of December 31, 2005,
were primarily associated with the Company’s businesses in Mexico and Brazil.
Cash Flow Activities
Over the past three years, cash from operating activities provided approximately $1.8 billion. Over
this period, cash used by or provided from accounts receivable and inventories has tended to fluctuate
as a result of sales during December and inventory management practices. The change in cash
provided from other assets and liabilities between the years was primarily related to hedging
transactions and the timing of payments for accrued liabilities, including income taxes. In 2004, the
adjustment of deferred income taxes primarily reflected the deferred tax benefit resulting from the
$61.1 million adjustment to income tax contingency reserves recorded in the second quarter of 2004
and an increase resulting from the Mauna Loa acquisition.
Investing activities included capital additions, capitalized software additions, and several business
acquisitions and divestitures. Capital additions during the past three years included the purchase
of manufacturing equipment, and expansion and modernization of existing facilities. Capitalized
software additions over the past three years were associated primarily with the ongoing
enhancement of information systems.
In August 2005, the Company acquired the assets of Joseph Schmidt Confections, Inc. and completed
the acquisition of Scharffen Berger Chocolate Maker, Inc. The combined purchase price for Scharffen
Berger and Joseph Schmidt was $47.1 million, with the final amount subject to upward adjustment
not to exceed $61.1 million to be determined based upon actual sales growth through 2007.
23