Downloaded 73 times
![© 2011 Cengage Learning. All Rights Reserved. May not be scanned, copied
or duplicated, or posted to a publicly accessible website, in whole or in part.
25
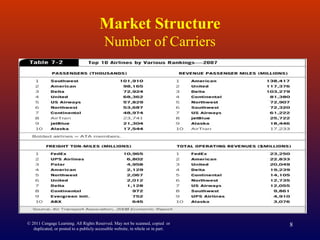
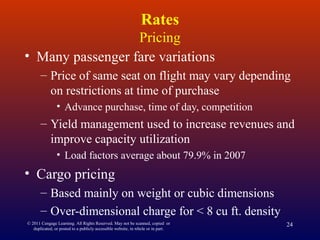
Rates
Operating Efficiency
• Operating ratio = [Op. Exp./Op. Inc.] * 100
– Industry average: 1994-2000: 94.7-96.9
2007: 94.7
• Load Factor = [#Passengers/#Seats] * 100
– Industry average climbs above 70%
– Relationship between load factor, plane size,
and operating costPlane Seats Pass. Load Fac. Op. Cost/Hr. Op. Cost/Pass.-hr.
B747-400 367 239 65.1% $8,443 $35.32
B747-400 367 80 21.8% $8,443 $105.54
DC-10 101 80 79.2% $2,071 $25.89](https://image.slidesharecdn.com/chapter7aise-130706025843-phpapp01/85/Transport-Management-Theory-Practices-7-25-320.jpg)

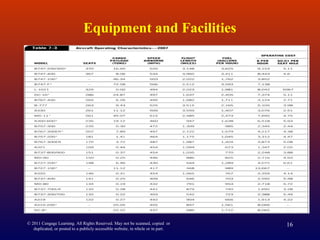
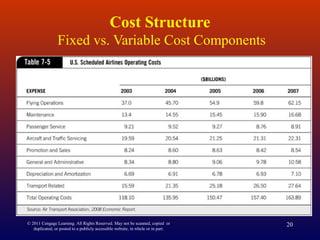
This document provides an overview of the airline industry. It discusses how rail transportation was dominant until the early 20th century, and how the development of airplanes in 1903 began the rise of air transportation. The airline industry was launched in the 1920s through government subsidies of air mail routes. Major topics covered include types of carriers (private vs for-hire), market structure/competition, operating characteristics, equipment/facilities, costs, and taxes/fees involved in air transportation.


