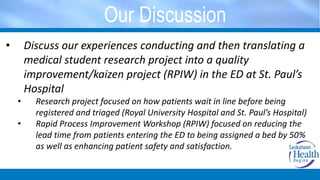
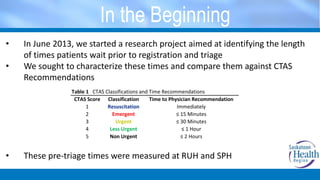
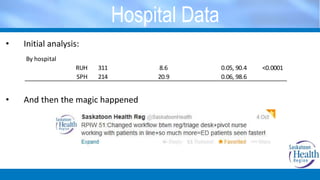
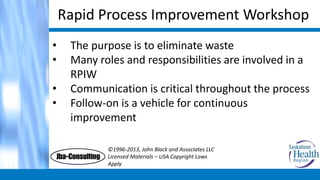
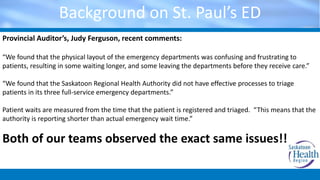
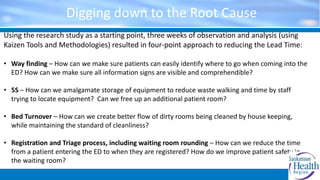
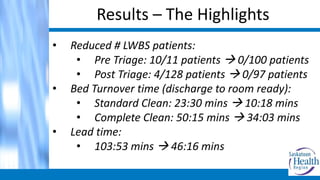
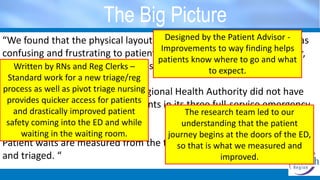
Translating an Emergency Department Wait Time Study to a Quality
Improvement Project: The Story of RPIW #51
Sachin Trivedi and Tim West
Medical Student, University of Saskatchewan
Kaizen Operations Specialist, Saskatoon Health Region
www.qualitysummit.ca
#QS14
Introductions
• Sachin Trivedi
• Medical Student
• University of Saskatchewan
• Tim West
• Kaizen Operations Specialist
• Saskatoon Health Region
Our Discussion
• Discuss our experiences conducting and then translating a
medical student research project into a quality
improvement/kaizen project (RPIW) in the ED at St. Paul’s
Hospital
• Research project focused on how patients wait in line before being
registered and triaged (Royal University Hospital and St. Paul’s Hospital)
• Rapid Process Improvement Workshop (RPIW) focused on reducing the
lead time from patients entering the ED to being assigned a bed by 50%
as well as enhancing patient safety and satisfaction.
In the Beginning
• In June 2013, we started a research project aimed at identifying the length
of times patients wait prior to registration and triage
• We sought to characterize these times and compare them against CTAS
Recommendations
• These pre-triage times were measured at RUH and SPH
Table 1 CTAS Classifications and Time Recommendations
CTAS Score Classification Time to Physician Recommendation
1 Resuscitation Immediately
2 Emergent ≤ 15 Minutes
3 Urgent ≤ 30 Minutes
4 Less Urgent ≤ 1 Hour
5 Non Urgent ≤ 2 Hours
One piece of the puzzle
The Study
• A single observer was used to measure the pre-triage times
• We defined this time as the period between when a patient first entered the
ED to when they were formally registered and triaged
• CTAS scores were obtained from the electronic record
• Patients arriving via EMS were excluded
• A total of 536 patients were timed
 Of these, 11 had left the line without being triaged
Results
Table 2 Median wait times by subject characteristics
Characteristic N Median time (IQR) - minutes Range p-value*
All subjects 525 13.0 (2.9, 27.6) 0.05, 98.6 NA
Non-triaged subjects 11 31.4 (21.0, 47.0) 10.0, 68.5 NA
By age group
Infant (2012-2013) 34 5.7 (0.38, 16.0) 0.05, 72.2 0.009
Child (2007-2011) 39 8.2 (1.6, 16.2) 0.05, 43.8
Preteen (2001-2006) 25 10.8 (6.5, 19.8) 0.05, 73.3
Teen (1995-2000) 26 12.5 (3.6, 24.2) 0.12, 63.3
Adult (1948-1994) 307 15.8 (3.0, 29.9) 0.05, 98.6
Elderly (1914-1947) 94 15.1 (5.3, 30.5) 0.05, 76.3
By time of day
Morning (07:30-11:59) 147 14.6 (4.2, 23.8) 0.05, 79.8 <0.0001
Afternoon (12:00-17:59) 273 17.6 (6.1, 36.4) 0.05, 98.6
Evening (18:00-23:59) 91 4.5 (0.37, 14.0) 0.05, 50.2
Night (00:00-04:00) 14 2.8 (0.22, 17.4) 0.08, 35.6
By CTAS
1 or 2 53 3.1 (0.43, 11.1) 0.05, 44.2 <0.0001
3 187 11.4 (1.6, 24.9) 0.05, 91.1
4 139 16.6 (6.0, 29.7) 0.06, 98.6
5 146 17.5 (6.8, 37.3) 0.05, 90.4
By day of week
Monday 81 44.8 (30.4, 55.3) 0.07, 98.6 <0.0001
Tuesday 98 14.7 (6.5, 25.1) 0.07, 68.3
Wednesday 123 13.4 (2.2, 23.9) 0.05, 90.4
Thursday 139 9.1 (1.1 , 22.6) 0.05, 56.3
Friday 49 4.0 (0.42, 10.7) 0.05, 40.3
Saturday NA NA
Sunday 35 10.1 (3.9, 13.7) 0.62, 32.7
By hospital
RUH 311 8.6 (1.1, 22.1) 0.05, 90.4 <0.0001
SPH 214 20.9 (8.5, 41.3) 0.06, 98.6
*Median values compared within all characteristic groups by Kruskal-Wallis testing with the
exception of hospital (Wilcoxon Rank-Sum Test)
Table 3 Multivariable ordinal logistic regression analysis
Predictor Odds ratio 95% Confidence Interval
CTAS status
CTAS 3 vs CTAS 1 or 2 2.49 1.36, 4.56
CTAS 4 vs CTAS 1 or 2 3.97 2.12, 7.45
CTAS 5 vs CTAS 1 or 2 4.84 2.58, 9.11
CTAS 3 vs CTAS 4 1.60 1.07, 2.39
CTAS 3 vs CTAS 5 1.95 1.31, 2.91
CTAS 4 vs CTAS 5 1.22 0.80, 1.86
Time of day
Afternoon vs Morning 1.36 0.94, 1.96
Evening or night vs Morning 0.41 0.26, 0.67
Evening or night vs Afternoon 0.31 0.20, 0.48
Hospital
SPH vs RUH 2.06* 1.48, 2.89
*Association may be biased by day of week as observations at SPH were
restricted to Sundays, Mondays, and Tuesdays whereas RUH observations were
made on Wednesdays, Thursdays and Fridays.
CTAS Group
Legend: Boxes represent the IQR of the given statistic, the solid line in the box represents the
median time, diamonds represent the mean time, T- bars represent extreme values, circles
represent outlier values
- The median pre-triage times all fell
below the CTAS recommendations
- Within the individual groups, the times
took on a wide range
- What does this mean? The time could
be clinically significant
And then things got interesting
• Around the time of this initial data analysis, we were in contact with the SHR
Kaizen Operations Office
• We traded data and found that the median time for the triage process itself
was 8.4 minutes
• This new time period, in conjunction with the measured pre-triage times cut
into the recommended CTAS times
Hospital Data
• Initial analysis:
• And then the magic happened
By hospital
RUH 311 8.6 0.05, 90.4 <0.0001
SPH 214 20.9 0.06, 98.6
Acknowledgements
• Dr. James Stempien and Dr. Martin Betz
• Dr. Rhonda Bryce and Masud Rana
• Alan Wilde
• Kelsey Kevinsen
• Saskatoon Health Region
• University of Saskatchewan College of Medicine
• Carla Flogan, Dr. Floyd Besserer and Tim West
• Saskatchewan Health Quality Council
Team Super Mega Awesome!
Rapid Process Improvement Workshop
• The purpose is to eliminate waste
• Many roles and responsibilities are involved in a
RPIW
• Communication is critical throughout the process
• Follow-on is a vehicle for continuous
improvement
©1996-2013, John Black and Associates LLC
Licensed Materials – USA Copyright Laws
Apply
Background on St. Paul’s ED
Provincial Auditor’s, Judy Ferguson, recent comments:
“We found that the physical layout of the emergency departments was confusing and frustrating to
patients, resulting in some waiting longer, and some leaving the departments before they receive care.”
“We found that the Saskatoon Regional Health Authority did not have effective processes to triage
patients in its three full-service emergency departments.”
Patient waits are measured from the time that the patient is registered and triaged. “This means that the
authority is reporting shorter than actual emergency wait time.”
Both of our teams observed the exact same issues!!
Digging down to the Root Cause
Using the research study as a starting point, three weeks of observation and analysis (using
Kaizen Tools and Methodologies) resulted in four-point approach to reducing the Lead Time:
• Way finding – How can we make sure patients can easily identify where to go when coming into the
ED? How can we make sure all information signs are visible and comprehendible?
• 5S – How can we amalgamate storage of equipment to reduce waste walking and time by staff
trying to locate equipment? Can we free up an additional patient room?
• Bed Turnover – How can we create better flow of dirty rooms being cleaned by house keeping,
while maintaining the standard of cleanliness?
• Registration and Triage process, including waiting room rounding – How can we reduce the time
from a patient entering the ED to when they are registered? How do we improve patient safety in
the waiting room?
Empowering those with the experience and
knowledge
• 2 ED RNs
• 1Registration Clerk
• 1 Emergency Medicine Resident
• 1 Patient Advisor
• Consults with Housekeeping, Security,
Registration, and Volunteer Services
Generate ideas together, then divide into four groups
to try, test, and implement improvement ideas!
The Team’s Ideas
• Way finding:
• Improve signage at entrance
• Keep language simple and consistent
• Better arrange waiting room seating
• 5S:
• Use an old patient room to store all ED
equipment
• Clean up ‘Rainbow’ room to be usable
by patients
• Bed Turnover
• Use SCM system to notify Housekeeping
staff to when rooms require a turnover
• Build in priority list for rooms in
standard work for Housekeepers
• Better location for Ladder
• Reg and Triage:
• Decouple IT, change process flow to
work in parallel
• Implement triage nursing, to improve
flow and patient safety
Results – The Highlights
• Reduced # LWBS patients:
• Pre Triage: 10/11 patients  0/100 patients
• Post Triage: 4/128 patients  0/97 patients
• Bed Turnover time (discharge to room ready):
• Standard Clean: 23:30 mins  10:18 mins
• Complete Clean: 50:15 mins  34:03 mins
• Lead time:
• 103:53 mins  46:16 mins
The Big Picture
“We found that the physical layout of the emergency departments was
confusing and frustrating to patients, resulting in some waiting longer,
and some leaving the departments before they receive care”
“We found that the Saskatoon Regional Health Authority did not have
effective processes to triage patients in its three full-service emergency
departments.”
Patient waits are measured from the time that the patient is registered
and triaged. “
Designed by the Patient Advisor -
Improvements to way finding helps
patients know where to go and what
to expect.Written by RNs and Reg Clerks –
Standard work for a new triage/reg
process as well as pivot triage nursing
provides quicker access for patients
and drastically improved patient
safety coming into the ED and while
waiting in the waiting room.
The research team led to our
understanding that the patient
journey begins at the doors of the ED,
so that is what we measured and
improved.
In Summary
• Displayed the potential of using student-based research to
inform and shape an improvement project.
• The scope of the improvement project and the RPIW model
worked extremely well too address the root causes of the
Auditor’s concern before her report was released.
• Patient’s and staff play the most important role in coming up
with, and implementing, ideas for positive change.
Questions?
Contact Me:
Tim West
Kaizen Operations Specialist - SHR
Tim.West@saskatoonhealthregion.ca
www.qualitysummit.ca
#QS14

Translating an Emergency Department Wait Time Study to a Quality Improvement Project: The Story of RPIW #51

  • 1.
    Translating an EmergencyDepartment Wait Time Study to a Quality Improvement Project: The Story of RPIW #51 Sachin Trivedi and Tim West Medical Student, University of Saskatchewan Kaizen Operations Specialist, Saskatoon Health Region www.qualitysummit.ca #QS14
  • 2.
    Introductions • Sachin Trivedi •Medical Student • University of Saskatchewan • Tim West • Kaizen Operations Specialist • Saskatoon Health Region
  • 3.
    Our Discussion • Discussour experiences conducting and then translating a medical student research project into a quality improvement/kaizen project (RPIW) in the ED at St. Paul’s Hospital • Research project focused on how patients wait in line before being registered and triaged (Royal University Hospital and St. Paul’s Hospital) • Rapid Process Improvement Workshop (RPIW) focused on reducing the lead time from patients entering the ED to being assigned a bed by 50% as well as enhancing patient safety and satisfaction.
  • 4.
    In the Beginning •In June 2013, we started a research project aimed at identifying the length of times patients wait prior to registration and triage • We sought to characterize these times and compare them against CTAS Recommendations • These pre-triage times were measured at RUH and SPH Table 1 CTAS Classifications and Time Recommendations CTAS Score Classification Time to Physician Recommendation 1 Resuscitation Immediately 2 Emergent ≤ 15 Minutes 3 Urgent ≤ 30 Minutes 4 Less Urgent ≤ 1 Hour 5 Non Urgent ≤ 2 Hours
  • 5.
    One piece ofthe puzzle
  • 6.
    The Study • Asingle observer was used to measure the pre-triage times • We defined this time as the period between when a patient first entered the ED to when they were formally registered and triaged • CTAS scores were obtained from the electronic record • Patients arriving via EMS were excluded • A total of 536 patients were timed  Of these, 11 had left the line without being triaged
  • 7.
    Results Table 2 Medianwait times by subject characteristics Characteristic N Median time (IQR) - minutes Range p-value* All subjects 525 13.0 (2.9, 27.6) 0.05, 98.6 NA Non-triaged subjects 11 31.4 (21.0, 47.0) 10.0, 68.5 NA By age group Infant (2012-2013) 34 5.7 (0.38, 16.0) 0.05, 72.2 0.009 Child (2007-2011) 39 8.2 (1.6, 16.2) 0.05, 43.8 Preteen (2001-2006) 25 10.8 (6.5, 19.8) 0.05, 73.3 Teen (1995-2000) 26 12.5 (3.6, 24.2) 0.12, 63.3 Adult (1948-1994) 307 15.8 (3.0, 29.9) 0.05, 98.6 Elderly (1914-1947) 94 15.1 (5.3, 30.5) 0.05, 76.3 By time of day Morning (07:30-11:59) 147 14.6 (4.2, 23.8) 0.05, 79.8 <0.0001 Afternoon (12:00-17:59) 273 17.6 (6.1, 36.4) 0.05, 98.6 Evening (18:00-23:59) 91 4.5 (0.37, 14.0) 0.05, 50.2 Night (00:00-04:00) 14 2.8 (0.22, 17.4) 0.08, 35.6 By CTAS 1 or 2 53 3.1 (0.43, 11.1) 0.05, 44.2 <0.0001 3 187 11.4 (1.6, 24.9) 0.05, 91.1 4 139 16.6 (6.0, 29.7) 0.06, 98.6 5 146 17.5 (6.8, 37.3) 0.05, 90.4 By day of week Monday 81 44.8 (30.4, 55.3) 0.07, 98.6 <0.0001 Tuesday 98 14.7 (6.5, 25.1) 0.07, 68.3 Wednesday 123 13.4 (2.2, 23.9) 0.05, 90.4 Thursday 139 9.1 (1.1 , 22.6) 0.05, 56.3 Friday 49 4.0 (0.42, 10.7) 0.05, 40.3 Saturday NA NA Sunday 35 10.1 (3.9, 13.7) 0.62, 32.7 By hospital RUH 311 8.6 (1.1, 22.1) 0.05, 90.4 <0.0001 SPH 214 20.9 (8.5, 41.3) 0.06, 98.6 *Median values compared within all characteristic groups by Kruskal-Wallis testing with the exception of hospital (Wilcoxon Rank-Sum Test) Table 3 Multivariable ordinal logistic regression analysis Predictor Odds ratio 95% Confidence Interval CTAS status CTAS 3 vs CTAS 1 or 2 2.49 1.36, 4.56 CTAS 4 vs CTAS 1 or 2 3.97 2.12, 7.45 CTAS 5 vs CTAS 1 or 2 4.84 2.58, 9.11 CTAS 3 vs CTAS 4 1.60 1.07, 2.39 CTAS 3 vs CTAS 5 1.95 1.31, 2.91 CTAS 4 vs CTAS 5 1.22 0.80, 1.86 Time of day Afternoon vs Morning 1.36 0.94, 1.96 Evening or night vs Morning 0.41 0.26, 0.67 Evening or night vs Afternoon 0.31 0.20, 0.48 Hospital SPH vs RUH 2.06* 1.48, 2.89 *Association may be biased by day of week as observations at SPH were restricted to Sundays, Mondays, and Tuesdays whereas RUH observations were made on Wednesdays, Thursdays and Fridays.
  • 8.
    CTAS Group Legend: Boxesrepresent the IQR of the given statistic, the solid line in the box represents the median time, diamonds represent the mean time, T- bars represent extreme values, circles represent outlier values - The median pre-triage times all fell below the CTAS recommendations - Within the individual groups, the times took on a wide range - What does this mean? The time could be clinically significant
  • 9.
    And then thingsgot interesting • Around the time of this initial data analysis, we were in contact with the SHR Kaizen Operations Office • We traded data and found that the median time for the triage process itself was 8.4 minutes • This new time period, in conjunction with the measured pre-triage times cut into the recommended CTAS times
  • 10.
    Hospital Data • Initialanalysis: • And then the magic happened By hospital RUH 311 8.6 0.05, 90.4 <0.0001 SPH 214 20.9 0.06, 98.6
  • 11.
    Acknowledgements • Dr. JamesStempien and Dr. Martin Betz • Dr. Rhonda Bryce and Masud Rana • Alan Wilde • Kelsey Kevinsen • Saskatoon Health Region • University of Saskatchewan College of Medicine • Carla Flogan, Dr. Floyd Besserer and Tim West • Saskatchewan Health Quality Council
  • 12.
  • 13.
    Rapid Process ImprovementWorkshop • The purpose is to eliminate waste • Many roles and responsibilities are involved in a RPIW • Communication is critical throughout the process • Follow-on is a vehicle for continuous improvement ©1996-2013, John Black and Associates LLC Licensed Materials – USA Copyright Laws Apply
  • 14.
    Background on St.Paul’s ED Provincial Auditor’s, Judy Ferguson, recent comments: “We found that the physical layout of the emergency departments was confusing and frustrating to patients, resulting in some waiting longer, and some leaving the departments before they receive care.” “We found that the Saskatoon Regional Health Authority did not have effective processes to triage patients in its three full-service emergency departments.” Patient waits are measured from the time that the patient is registered and triaged. “This means that the authority is reporting shorter than actual emergency wait time.” Both of our teams observed the exact same issues!!
  • 15.
    Digging down tothe Root Cause Using the research study as a starting point, three weeks of observation and analysis (using Kaizen Tools and Methodologies) resulted in four-point approach to reducing the Lead Time: • Way finding – How can we make sure patients can easily identify where to go when coming into the ED? How can we make sure all information signs are visible and comprehendible? • 5S – How can we amalgamate storage of equipment to reduce waste walking and time by staff trying to locate equipment? Can we free up an additional patient room? • Bed Turnover – How can we create better flow of dirty rooms being cleaned by house keeping, while maintaining the standard of cleanliness? • Registration and Triage process, including waiting room rounding – How can we reduce the time from a patient entering the ED to when they are registered? How do we improve patient safety in the waiting room?
  • 16.
    Empowering those withthe experience and knowledge • 2 ED RNs • 1Registration Clerk • 1 Emergency Medicine Resident • 1 Patient Advisor • Consults with Housekeeping, Security, Registration, and Volunteer Services Generate ideas together, then divide into four groups to try, test, and implement improvement ideas!
  • 17.
    The Team’s Ideas •Way finding: • Improve signage at entrance • Keep language simple and consistent • Better arrange waiting room seating • 5S: • Use an old patient room to store all ED equipment • Clean up ‘Rainbow’ room to be usable by patients • Bed Turnover • Use SCM system to notify Housekeeping staff to when rooms require a turnover • Build in priority list for rooms in standard work for Housekeepers • Better location for Ladder • Reg and Triage: • Decouple IT, change process flow to work in parallel • Implement triage nursing, to improve flow and patient safety
  • 18.
    Results – TheHighlights • Reduced # LWBS patients: • Pre Triage: 10/11 patients  0/100 patients • Post Triage: 4/128 patients  0/97 patients • Bed Turnover time (discharge to room ready): • Standard Clean: 23:30 mins  10:18 mins • Complete Clean: 50:15 mins  34:03 mins • Lead time: • 103:53 mins  46:16 mins
  • 19.
    The Big Picture “Wefound that the physical layout of the emergency departments was confusing and frustrating to patients, resulting in some waiting longer, and some leaving the departments before they receive care” “We found that the Saskatoon Regional Health Authority did not have effective processes to triage patients in its three full-service emergency departments.” Patient waits are measured from the time that the patient is registered and triaged. “ Designed by the Patient Advisor - Improvements to way finding helps patients know where to go and what to expect.Written by RNs and Reg Clerks – Standard work for a new triage/reg process as well as pivot triage nursing provides quicker access for patients and drastically improved patient safety coming into the ED and while waiting in the waiting room. The research team led to our understanding that the patient journey begins at the doors of the ED, so that is what we measured and improved.
  • 20.
    In Summary • Displayedthe potential of using student-based research to inform and shape an improvement project. • The scope of the improvement project and the RPIW model worked extremely well too address the root causes of the Auditor’s concern before her report was released. • Patient’s and staff play the most important role in coming up with, and implementing, ideas for positive change.
  • 21.
    Questions? Contact Me: Tim West KaizenOperations Specialist - SHR Tim.West@saskatoonhealthregion.ca www.qualitysummit.ca #QS14

Editor's Notes

  • #6 http://www.youtube.com/watch?v=BTEGwU_8czM&feature=youtu.be There are many factors involved in emergency department wait times. This is only one piece of the puzzle
  • #7 Patients were consecutively timed Limitations: we couldn’t control things like triage desks being opened, EMS usage of the ED and overall patient complaint profile but we realized that these are things which can also impact the pre-triage times
  • #8 We looked at the data in terms of a number of different sub groups. In terms of this RPIW the most important divisions were the CTAS and Hospital groups
  • #9 Talk about the most worrisome groups – CTAS 1/2
  • #11 There was a clear difference in the two hospitals
  • #12 Before I let Tim give his side of the story there’s a few people I want to thank.