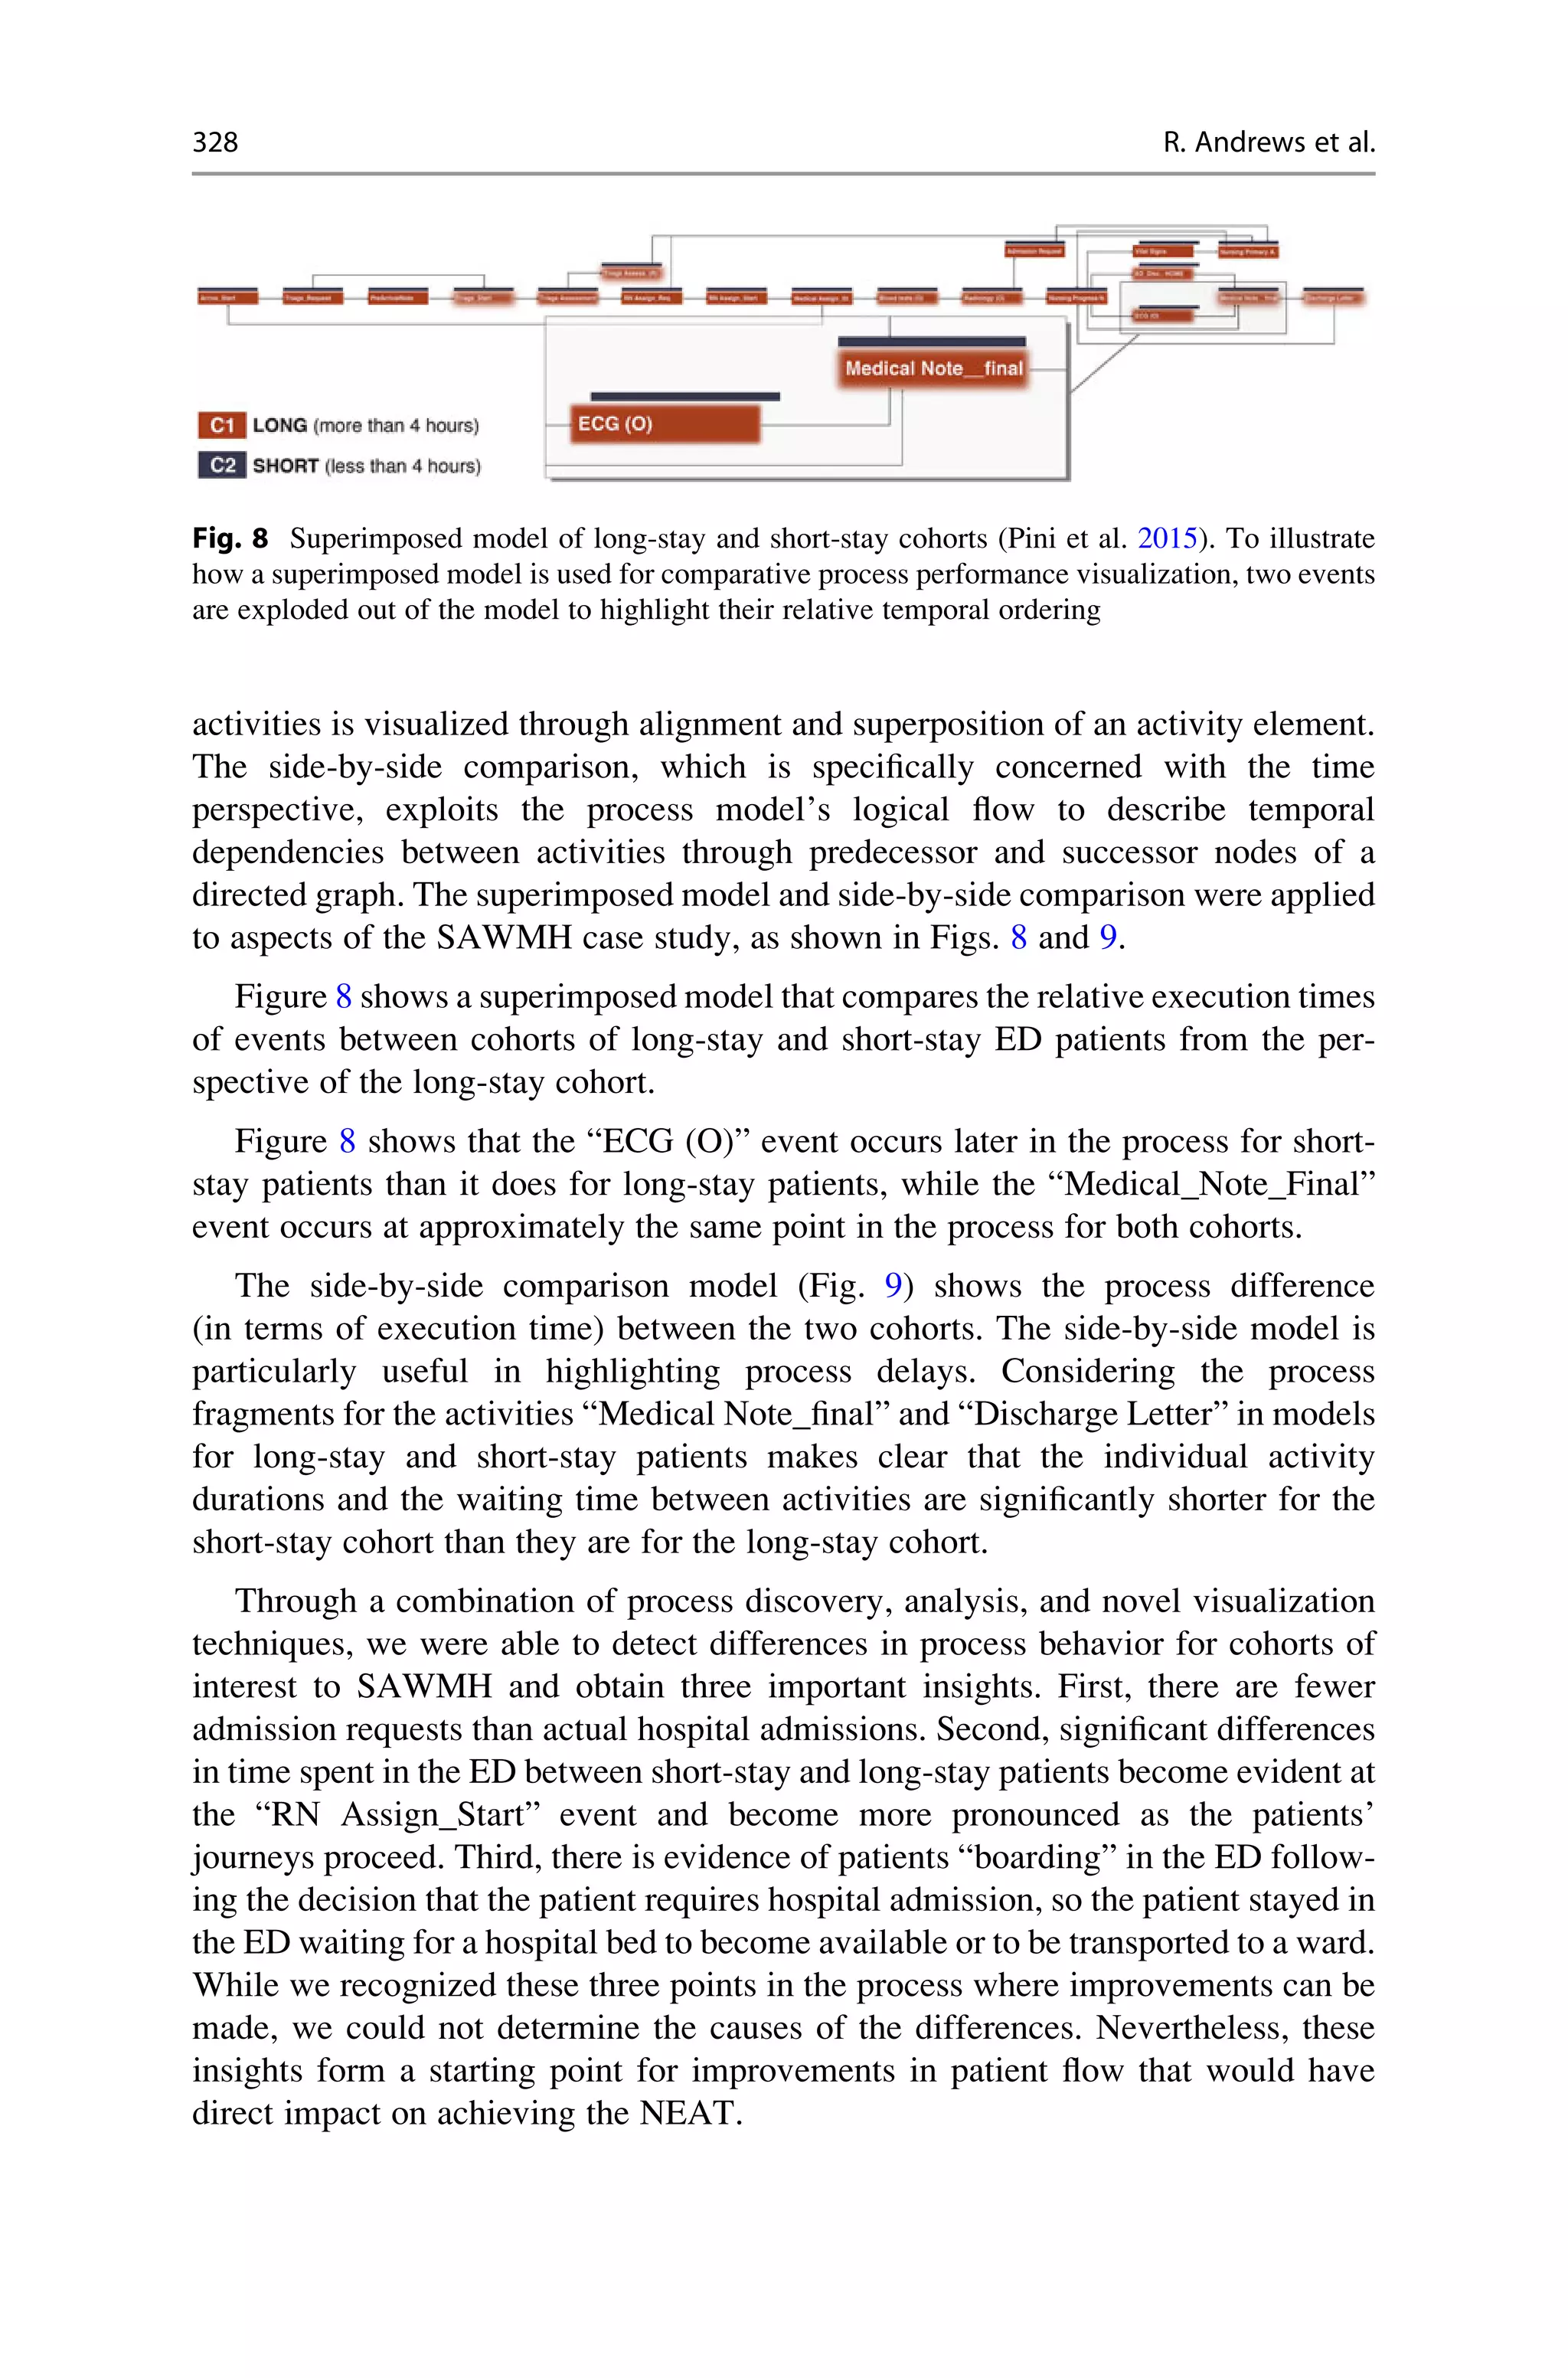
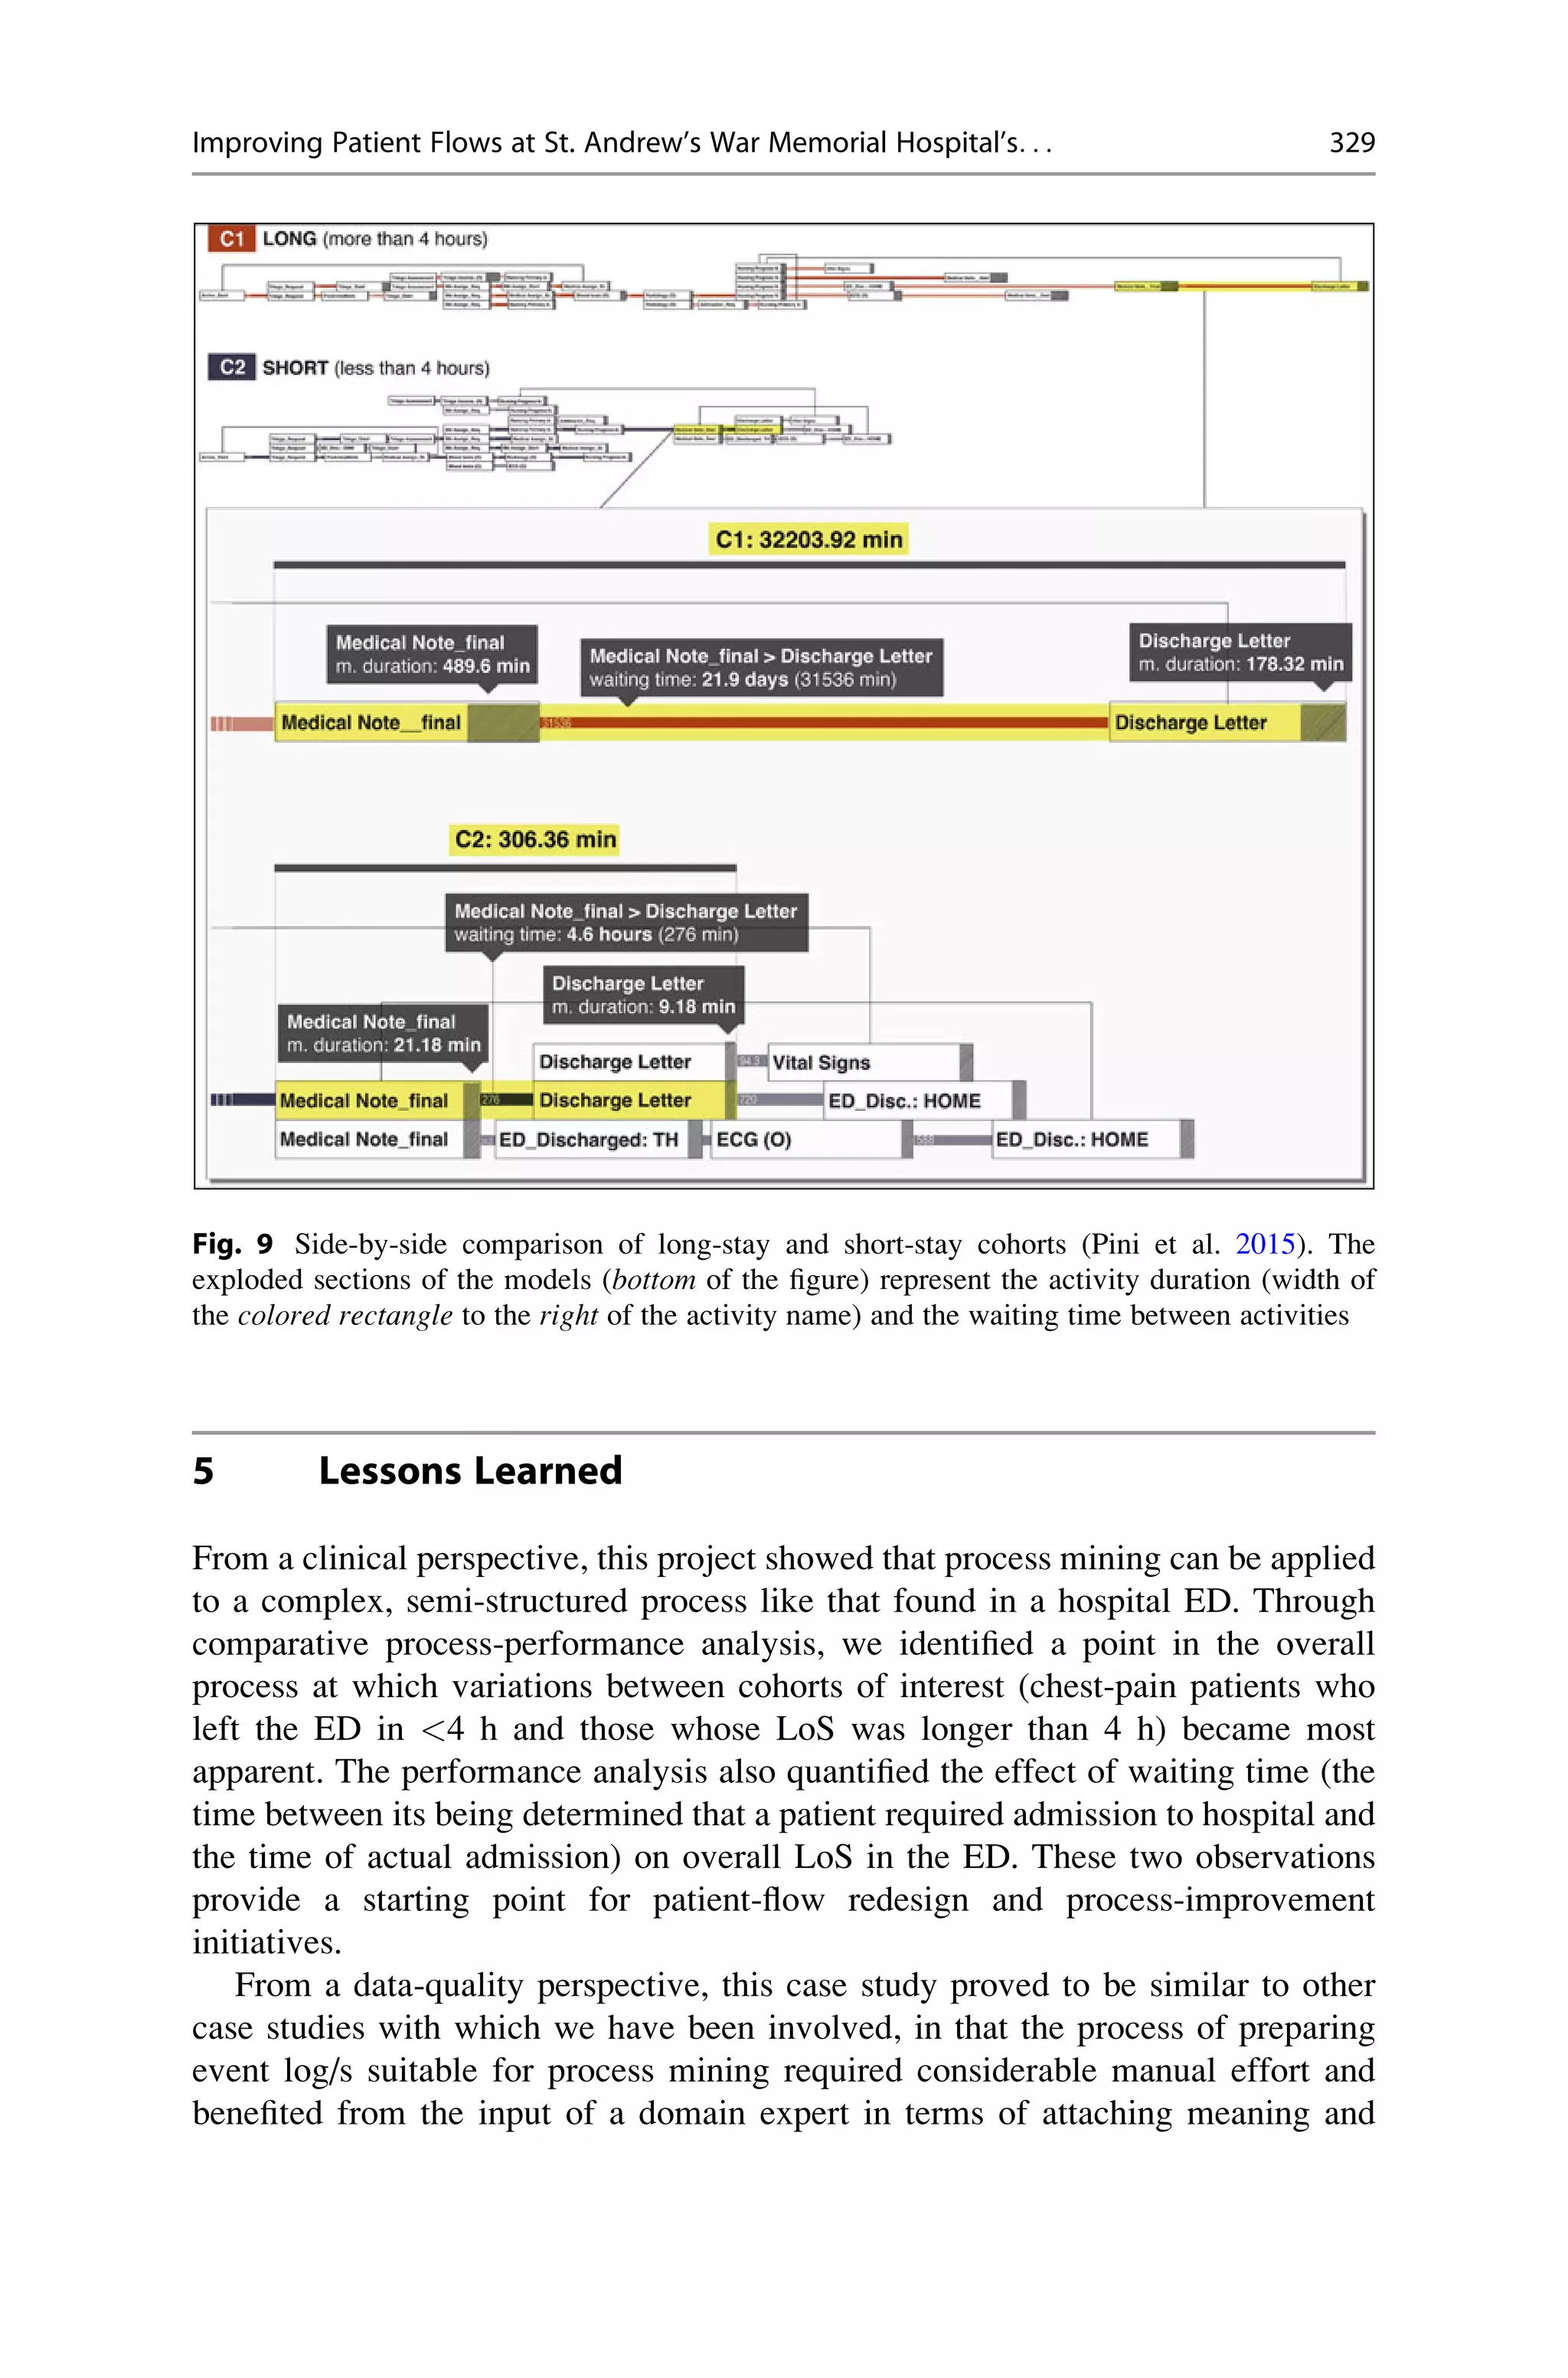
Improving Patient Flows at St. Andrew’s
War Memorial Hospital’s Emergency
Department Through Process Mining
Robert Andrews, Suriadi Suriadi, Moe Wynn,
Arthur H.M. ter Hofstede, and Sean Rothwell
Abstract
(a) Situation faced: Improving Emergency Department (ED) patient flows in
terms of processing time, resource use, costs, and patient outcomes is a
priority for health service professionals and is vital to the delivery of safe,
timely, and effective patient care. Poor patient flows manifest as
overcrowding in the ED, prolonged length of stay (LoS), patients
“boarding” in EDs and “access block” for admission to inpatient wards.
Consequences include poor patient outcomes, reduced access for new
patients who present at the ED, and negative effects on staff, including
dissatisfaction and stress. Further motivation for improving patient flows
in EDs arises because Commonwealth- and state-sponsored financial
incentives for hospitals are tied to achieving targets for improved patient
access to emergency services. One measure of such improved access is
meeting nationally agreed targets for the percentage of patients who are
physically discharged from the ED within 4 h of arrival.
(b) Action taken: A key challenge in deriving evidence-based improvements
for patient flows is that of gaining insight into the process factors and
context factors that affect patient flows. The case study reported here
adopted the BPM Lifecycle reference framework to improve patient
flows. In particular we focused on the process identification, discovery,
and analysis phases of the BPM Lifecycle. Process-oriented data-mining
R. Andrews (*) • S. Suriadi • M. Wynn • A.H.M. ter Hofstede
Queensland University of Technology, Brisbane, QLD, Australia
e-mail: r.andrews@qut.edu.au; s.suriadi@qut.edu.au; m.wynn@qut.edu.au; a.terhofstede@qut.
edu.au
S. Rothwell
UnitingCare Health, Brisbane, QLD, Australia
e-mail: sean.rothwell@uchealth.com.au
# Springer International Publishing AG 2018
J. vom Brocke, J. Mendling (eds.), Business Process Management Cases,
Management for Professionals, DOI 10.1007/978-3-319-58307-5_17
311
techniques were applied to real practices to discover models of current
patient flows in the ED of St. Andrew’s War Memorial Hospital
(SAWMH) in Queensland, Australia. The discovered models were used
to evaluate the effect on patient flows of certain context factors of interest
to stakeholders. Case histories of 1473 chest pain presentations at
SAWMH between September 2011 and March 2013 were analyzed to
determine process differences between ED patients with short stays
(<4 h) and those with long stays (>4 h).
(c) Results achieved: Process models were discovered for the hospital’s ED
patient flow. From a control-flow perspective, only minor differences were
observed between short- and long-stay patients at SAWMH, although there
were timing differences in reaching specific milestone events. Waiting
time in the ED following a request for hospital admission added signifi-
cantly to overall ED LoS.
(d) Lessons learned: This project demonstrated that process mining is appli-
cable to complex, semi-structured processes like those found in the
healthcare domain. Comparative process performance analysis yielded
some insights into ED patient flows, including recognition of recurring
data-quality issues in datasets extracted from hospital information systems.
The templated recognition and resolution of such issues offers a research
opportunity to develop a (semi-)automated data-cleaning approach that
would alleviate the tedious manual effort required to produce high-quality
logs. The project highlighted the importance of hospital information
systems collecting both start and end times of activities for proper perfor-
mance analysis (duration, wait time, bottlenecks). Additions to our
process-mining toolset include novel comparative process-performance
visualization techniques that highlight the similarities and differences
among process cohorts.
1 Introduction
Improving Emergency Department (ED) patient flows in terms of processing time,
resource use, costs, and patient outcomes is a priority for health service
professionals and is vital to the delivery of safe, timely, and effective patient
care. If patients are not moving through the system efficiently, other patients may
experience delays in accessing care, with possible deleterious consequences.
Inefficiencies in patient flow may also raise the cost of providing healthcare
services through the failure to make the best use of available resources, such as
the time of skilled staff (Liew and Kennedy 2003).
Recent years have seen an increasing demand for ED services in Australia’s
public hospitals (Australian Institute of Health and Welfare 2015) without a
corresponding rise in inpatient beds. Table 1 highlights the steadily increasing
312 R. Andrews et al.
Table
1
ED
presentations—Public
Hospitals
2010–2011
to
2014–2015
(from
the
Australian
Institute
of
Health
and
Welfare
2015,
which
cites
the
National
Non-Admitted
Patient
Emergency
Department
Care
Database
as
its
data
source)
2010–2011
2011–2012
2012–2013
2013–2014
2014–2015
Avg.
change
since
2010–2011
(%)
#
Hospitals
Reporting
ED
Data
Major
140
143
144
144
146
1.1
Other
46
60
60
145
144
42.9
Total
186
203
204
289
290
12.9
Presentations
6,183,288
6,547,342
6,712,357
7,195,903
7,366,442
4.5
Improving Patient Flows at St. Andrew’s War Memorial Hospital’s. . . 313
number of patient presentations at public hospitals’ EDs. (The increase in the
overall number of reporting hospitals is due to a large number of smaller hospitals’
reporting patient presentations in their EDs, so interpretation of changes over time
should take these changes of coverage into account.)
In July 2011, the National Health Reform Agreement—National Partnership
Agreement on Improving Public Hospital Service was signed by all of Australia’s
states and territories. Under this agreement, financial incentives were established
for public hospitals to meet targets. In particular, the National Emergency Access
Target (NEAT) was created to improve patient access to public hospitals’ EDs.
Performance against the NEAT is measured as the percentage of patients who
physically leave the ED within 4 h of their arrival. (The term “physically leave”
includes patients who leave without treatment, are discharged from the ED, are
admitted to another hospital unit (including the short-stay unit attached to the ED),
or are transferred to another hospital). Incremental NEAT targets for Queensland
were 70% in 2012, 77% in 2013, 83% in 204, and 90% in 2015.
Although no state or territory, including Queensland, has consistently achieved
its NEAT, the initiative has seen a reduction in average Length of Stay (LoS) in
Queensland’s public hospitals’ EDs from 280 min in July 2011 to 198 min in June
2014 (Queensland Audit Office 2015) and has motivated changes in EDs’ and wider
hospitals’ procedures (Queensland Clinical Senate 2014). Two significant
innovations have been the introduction of short-stay units attached to EDs, specifi-
cally for patients who require monitoring for up to 24 h, which allows patients to be
discharged from EDs to short-stay unit, and the introduction of the Emergency
Department Information System (EDIS), which is used by most major public
hospitals to record real-time admission/discharge information. EDIS features a
sort of traffic-light system that gives operators a visual indication of the current
patient waiting time (Queensland Audit Office 2015).
Patient flows have been adopted as a management strategy to systematize the
processing of patients from arrival at the ED to either discharge from the ED or
admission to hospital. In March 2010 the Queensland Government launched its
patient-flow strategy with the aim of reshaping Queensland Health’s processes so
the healthcare system could cope with increasing demands, deliver improved
performance, reduce delays, increase access, and ensure best practice across the
state (Queensland Health 2011). While patient flows alone cannot resolve all of the
issues that affect equitable delivery of care to ED patients, improving patient flows
has been shown to have a positive impact in terms of time, costs, and patient
outcomes (Showell et al. 2012) and is one of the key priorities in the healthcare
domain.
Evidence-based process improvement is an approach to process improvement in
which the improvement initiatives are driven by the results of an empirical analysis
of process-related data derived from the as is process. The analysis is designed to
reveal process inefficiencies like bottlenecks, protracted activity durations, and
rework loops. A key challenge in deriving evidence-based improvement to patient
flows is that of gaining insight into the process factors and context factors that affect
patient flows. This project involved a detailed analysis of patient flows in
314 R. Andrews et al.
St. Andrew’s War Memorial Hospital’s (SAWMH) ED using a process-mining
methodology with the aim of providing insights into the as is processes in the ED,
particularly as these processes apply to patients who present with chest pain. The
project also sought opportunities for improvement in existing process-mining
methodologies and tools (particularly in the areas of process comparison and
visualization). St Andrew’s Emergency Centre is a private ED that is not subject
to the public EDs’ NEAT-based financial incentives, but it does report the NEAT
data publicly, and it is benchmarked against public EDs’ NEAT performance. The
project identified differences in patient flows between short LoS (<4 h) and long
LoS (longer than 4 h). Process analysis quantified the effect of waiting time (the
time between when it was determined that a patient required admission to hospital
and the time of admission) had on overall ED LoS. While it was not possible to
determine the root cause of these effects, they form the basis for potential process
improvements that would have direct impact on achieving the NEAT. The project
also drove the development of several novel visualization tools for comparing
processes.
2 Situation Faced
Processes in healthcare settings, especially in hospital EDs, are often semi-
structured. Semi-structured processes are characterized by their lack of a formal
process model (although they usually have an informal process description), many
points at which different continuation paths are possible, and being driven largely
by context factors and human decision-making (Lakshmanan et al. 2011). In the
ED, while specific treatment plans for each patient can be designed after a triage
assessment, the delivery of the treatment requires flexibility and ad-hoc decision-
making because of regular disruptions in patient flows (Catchpole et al. 2013).
Disruptions to patient flows arise from such issues as those related to resources
(e.g., lack of medical personnel and “access block”), teamwork (e.g., lack of
communication that ensures smooth transition from one activity to another), and
external interruptions (e.g., slow turnaround time for pathology tests) (Wiegmann
et al. 2007) and manifest as long wait times, delays in administering/reporting on
ordered tests, “boarding” of patients in the ED, ambulance ramping (ambulance
arrives at ED and there is a delay in handing over the patient to ED staff requiring
ambulance officers to continue administering care to the patient), and overcrowding
in the ED. Overcrowding and prolonged LoS in the ED (for admitted patients) is
associated with poor outcomes, including increased mortality rates (Richardson
2006; Sprivulis et al. 2006; Forero et al. 2010). The constant need to adjust patients’
treatment plans likely contributes to a high level of variations in patient flows in
hospital settings. This phenomenon is consistent with insights reported in Suriadi
et al. (2014) and Partington et al. (2015).
To illustrate the complexity of healthcare processes and ED processes in
particular, consider the BPMN process model/abstraction of Queensland Health’s
Possible Cardiac Chest Pain Clinical Pathway (Queensland Health 2015), shown in
Fig. 1.
Improving Patient Flows at St. Andrew’s War Memorial Hospital’s. . . 315
Clinical pathways are standardized, evidence-based, multidisciplinary manage-
ment plans that identify an appropriate sequence of clinical interventions,
timeframes, milestones, and expected outcomes for a homogenous patient group
(Queensland Health Clinical Pathways Board definition 2002). Clinical Pathways
are guidelines made available to all hospitals, while patient flows are generally
hospital-specific and devised by each individual hospital. Each Clinical Pathway is
published with the advice to clinicians that “clinical pathways never replace clinical
judgement” and that “ care outlined in [the] pathway must be altered if not clinically
appropriate for the individual patient.” Each step in the process model is itself a
multi-step sub-process, with many of these steps being the performance of clinical
tests. Decision points in the pathway are generally expressed in terms of “if any of
the tests. . .” or “if none of the tests. . ..” In the ED that was analyzed for this case
study, the usual sequence of events is for a patient’s arrival at the ED to be recorded
and then the patient to be triaged and then later by a member of the medical staff
(a doctor, a registered nurse, or both). To highlight the non-structured and patient-
centric nature of patient flows, in accordance with the recommendation that clinical
judgement take precedence, in 45% of the cases in our study of patients presenting
with chest pain, the patient was seen by a doctor before being triaged, a flow that is
not in accordance with the typical pathway shown in Fig. 1.
SAWMH was particularly interested in identifying the differences between
patient flows for the cohort of chest-pain patients who spent <4 h in the ED from
time of arrival to discharge from the ED and the cohort of chest-pain patients who
spent longer than 4 h in the ED. Of further interest to SAWMH was the impact of its
practice of routinely requesting blood tests and radiological imaging of patients
who present with chest pain.
Devising an effective improvement plan for patient flow requires a baseline
understanding of where variations in patient flow occur in the end-to-end treatment
of patient cohorts and, most important, how the variations manifest. The study was
expected to deliver an objective evaluation of SAWMH’s treatment practices for
chest-pain patients, including a performance analysis with particular emphasis on
factors that influence LoS in the ED. The ultimate aim was to identify potential
improvements to patient flows that could contribute to improvements in SAWMH’s
performance against the NEAT.
Fig. 1 Abstraction of Queensland Health’s Cardiac Chest Pain Clinical Pathway
316 R. Andrews et al.
3 Action Taken
The focus of this project was the application of process-mining techniques to derive
evidence-based insights about the behavior and performance of patient flows at
SAWMH, from which comparisons of patient flows across patient cohorts could be
made. We adopted the BPM Lifecycle reference framework, focusing on the
process identification, discovery, and analysis phases. Table 2 shows the steps
taken and the key challenges phased in each phase of the BPM Lifecycle.
In the next section, we discuss the key challenges faced in working through each
of the project’s phases.
3.1 Process Identification
Identify research questions that are relevant to SAWMH
The research questions identified were:
• What are the differences in the patient flows between patients who stayed in the
ED for <4 h and those who stayed for more than 4 h?
• How much delay was introduced to the patient flows as a result of conducting
routine clinical activities, including blood tests and X-ray imaging?
• What are the factors that influenced the patients’ LoS?
Table 2 BPM lifecycle phases and key challenges
Steps in lifecycle phase Key challenges
Process identification phase
• Identify research questions that are relevant
to SAWMH
With respect to the research questions of
interest, define the aspects of ED and hospital
patient flows to be investigated
• Extract process-related datasets from IT
system(s), including data pre-processing
Identify relevant data from hospital
information systems
Identify and (if possible) resolve any data-
quality issues evident in the extracted data so
event logs that are aligned with the study’s
aims can be constructed
Process discovery phase
• Discover as is process models that show
dominant care paths
Deal with the highly variable, patient-centric
flow to discover readable models that capture
the dominant (most frequent) care paths
Process analysis phase
• Extract performance-related information for
each patient cohort and conduct comparative
process-performance analysis
Extract comparative process-performance
metrics
Visualize comparative process-performance
Improving Patient Flows at St. Andrew’s War Memorial Hospital’s. . . 317
Key challenge—With respect to the research questions of interest, define
the relevant aspects of ED and hospital patient flows to be investigated
A key challenge was to limit the study’s scope to patient-flow events in the ED and
the hospital that affected the research questions. After consultation with ED
clinicians from SAWMH, events related to ED arrival and discharge, clinical
activities conducted as part of the patient’s stay in the ED, blood and imaging
tests ordered for the patient, and hospital admittance events were selected as being
within the study’s scope.
Key challenge—Identify relevant data from hospital information systems The
case histories of all patients who presented with chest pain at the ED between
September 2011 and March 2013 were identified as being relevant to the study.
Four tables from four hospital information systems were identified as holding the
relevant data:
• Encounter table: The Encounter table recorded the arrival and departure of
patients from the ED using a unique “encounterID” value. As patients may
present at the ED multiple times over time, a unique patient identifier (Medical
Record Number) was associated with each patient and recorded in the Encounter
table. Encounters were classified as either “emergency,” indicating an ED
presentation, or “hospital,” indicating a hospital admission. The encounterID
value was used as the common identifier in the remaining tables so records could
be linked.
• Emergency table: The Emergency table recorded the key intra-ED patient flow
milestone events, such as when a doctor was assigned to a patient, when the
doctor first saw a patient, and when triage was started.
• Clinical table: The Clinical table recorded results of clinical observations of
patients, including the initial assessment, ongoing nursing observations, periodic
nursing, and medical notes.
• Orders table: The Orders table recorded orders for pathology tests, imaging
tests, and other medical procedures requested for patients.
Key challenge—Identify and (if possible) resolve any data-quality issues
evident in the extracted data so event logs aligned with the study’s aims can
be constructed
The most significant data-quality issues that affected the extracted data were issues
related to correlation, diverse activities with the same timestamp, inadequate
granularity of event names, duplicate events, references to the same event in
multiple tables, irrelevant events, events that represented case attributes, and
missing events.
• Correlation: The same patient (the same Medical Record Number) with multiple
Encounter table records on the same day, where one was an “emergency” and one
was a “hospital” encounter type. This represented a single case, so records from
the four tables with either encounterID value were merged into a single case.
318 R. Andrews et al.
• Multiple activities with the same timestamp: Many events in the Clinical table
were recorded with the same timestamp. This concurrency came about through
the affected events being extracted from different fields in the same on-line form
with the timestamp associated with each event being the time the form was
“saved”. Such events were assumed to be related to the same clinical activity, so
clinical events were grouped by timestamp and a set of cleaning heuristics based
on the occurrence of patterns of events in the groups were applied to reduce the
group of events with the same timestamp to a single event (or sometimes a pair
of events) that represented the actual clinical activity performed.
• Inconsistent granularity of event names: The Orders table recorded orders at a
finer level of granularity than was required for the analysis. For instance, Orders
table records that related to pathology tests listed the individual blood
components to be tested for, and Orders table records that related to imaging
used shorthand references like “xr” and “rad exam”. We addressed these issues
by aggregating multiple requests for individual blood tests into a single event
named “Blood test” and replaced occurrences of “xr” and “rad exam” with
“Radiology”.
• Duplicate events: Some cases contained sequences of Clinical table and/or Order
table events with only a few seconds’ time difference. Where groups of events
occurred with no more than 15 s’ time difference between neighboring events,
duplicated events in the group were removed. The duplication was deemed to be
an artefact of system logging rather than an indication that the event actually
occurred more than once.
• References to the same event in multiple tables: We found that certain process
steps were recorded with different activity names in two tables. For example, the
“Register_in_Emergency” event from the Encounter table coincided with the
“Arrive_Start,” “Arrive_Request,” and “Arrive_Complete” events in the Emer-
gency table. These events were replaced with a single “Arrive” event. Other
instances were observed in the Orders table and Clinical table. Again, a single
event was retained and the related events removed.
• Irrelevant events: After consultation with the domain expert, a set of events that
were not relevant to the analysis, such as when all events happened after a patient
had been admitted to a hospital ward, was identified and removed.
• Events that represented case attributes: For some events, it was more important
to know that the event had occurred in the case than it was to know when it had
occurred. For instance, the value associated with the “Glascow Coma Score”
event is of more interest than was the time the score was determined. For such
instances, the events were removed, a case attribute (named after the event) was
added, and the value was recorded against the case attribute. In a similar vein,
each of nine events associated with ED discharge indicated the discharge
destination. A case attribute that represented the discharge destination was
added, and the nine events were reduced to a single “ED Discharge” event.
The final log contained 40 case attributes.
• Missing process-related events: A research question SAWMH proposed dealt
with determining the impact of conducting routine tests (blood and imaging) on
Improving Patient Flows at St. Andrew’s War Memorial Hospital’s. . . 319
chest-pain patients. While references to orders for such tests were present in the
Orders table, no reference to either the performance of the test or the return of
results was evident in the source data. Investigations into the recording of blood
and medical imaging test results undertaken with SAWMH’s data manager
revealed that no medical imaging results and few blood test results were
recorded electronically in such a way that they could be matched to the original
order. For this reason, events associated with blood tests and medical imaging
results were not included in the final event log.
3.2 Process Discovery
Key challenge—Deal with the highly variable, patient-centric flow data
to discover readable models that capture the dominant (most frequent) care
paths
After data cleaning, the event log contained 1473 cases, representing 1472 different
execution paths—that is, only two cases followed exactly the same path—reflecting
the semi-structured, patient-centric nature of ED patient flows. The initial discov-
ered model reflected the “spaghetti”-like process. There were 30 separate activities
in this version of the log. To discover readable models, the log was partitioned into
four parts representing major milestone events of a patient’s journey through the
ED, the major clinical activities, cases in which ED LoS was <4 h, and cases in
which ED LoS was longer than 4 h. Disco,1
a commercial process-mining tool, was
used to filter the log to abstract the relevant partitions from the log, from which
readable but still meaningful process models were constructed.
3.3 Process Analysis
Key challenge—Extract comparative process performance
Extracting differences between cohorts’ processes required manual inspection of
models and manual compilation of observations. While doing so is possible, it is not
an efficient way to discover and highlight variations in performance.
Key challenge—Visualize comparative process performance
Visualization, the depiction of non-visual data in visual form, provides an effective
way to communicate, particularly where the raw data is large or complex. The
visualization aspect of process comparison is still in an exploratory stage (Pini et al.
2015), so the challenge was to devise novel forms of visualization to highlight
differences in process performance across multiple perspectives for the cohorts
being compared.
1
http://fluxicon.com
320 R. Andrews et al.
4 Results Achieved
In this section we detail the outcomes of the process discovery and analysis phases
of the case study.
4.1 Process Discovery
The discovered process model shown in Fig. 2 represents the dominant (most
frequent) pathways for the major milestone events in the patient flow for chest-
pain patients. For example, there are 1473 cases with an “Arrive_Start” event, and
the major milestones are arrival and departure from the ED (to either home or
hospital), triage, and when the patient is first seen by medical personnel (a doctor, a
registered nurse, or both).
The initially discovered process model for clinical activities was complex and
unreadable. Events in the Clinical table are the main contributors to process
variability (1263 different execution paths in 1471 cases). To discover a simpler
process model for clinical activities (Fig. 3), the set of activities was reduced
(in consultation with the process stakeholder) to include only key activities from
the Clinical table: “Pre-Arrival Note,” “Nursing Assessment,” “Nursing—Primary
Assessment,” “Nursing Progress Notes,” “Medical Note (final),” and “Discharge
Letter.” Figure 3 depicts the process model with the most frequent paths (those in
the top 9% of process variants), although only 21% of the cases follow this process
model.
To address SAWMH’s research question about process differences between the
cohort of patients with a LoS of <4 h (short LoS) and the cohort with a LoS of more
than 4 h (long LoS), separate process models were discovered for each cohort.
Figure 4 is the discovered model for short ED LoS, and Fig. 5 is the discovered
model for long ED LoS.
An area of interest to SAWMH was the relationship between routinely
requesting blood tests and imaging for patients presenting with chest pain and the
patient’s overall LoS. Do such practices introduce delays into the patient flows?
Blood testing for SAWMH is carried out by a third party pathology laboratory, but
the two organizations’ information systems are not integrated to the point at which
orders for tests can be sent directly from SAWMH to the laboratory. SAWMH
records orders the tests in its own clinical IT system, however the pathology lab
only becomes aware of the order when blood samples and printed test request
physically arrives at the lab. On completion of the tests, the laboratory faxes test
results to the ED, as this is the currently fastest method of returning test results to
the treating physicians. Further, as the two organizations do not use a common
patient identifier, it was almost impossible to match cases across the two systems.
Because electronic records of imaging tests are not stored in the data sources that
were available to the study, only a small sample of matching orders and results were
obtained, which was too small for proper process discovery or analysis.
Improving Patient Flows at St. Andrew’s War Memorial Hospital’s. . . 321
4.2 Process Analysis
This section lists the main findings of process analysis as they relate to the
discovered process models.
Four primary observations with respect to the general ED patient flow could be
derived from the milestone events model (Fig. 2):
• There is a logical flow of activities to which most cases adhere.
• The Medical_Assign event can occur before the Triage event and even before
the Arrive event.
• Fewer admission request events are recorded than the number of hospital
admissions (i.e., 458 admission requests vs. 662 admission events).
Fig. 2 Process model describing the main patient flow (major milestone events). In this model,
each rectangle represents an activity, and the color density of the rectangle represents the
frequency of the activity. Arrows represent transitions between activities, and the width of the
arrow represents the frequency of the transition. The numbers on the arrows and in the boxes
indicate the case frequency
322 R. Andrews et al.
• Patients in all but 48 of 1473 episodes were ultimately discharged home, while
the remaining patients were discharged otherwise (e.g., they were discharged to
a different hospital, they did not wait, or they died), so these 48 episodes are not
captured by the model.
Three primary observations with respect to clinical activities could be derived
from this model (Fig. 3):
• Nursing activities form the backbone of the clinical events—that is, the majority
of activities/interactions with patients in the ED are carried out by nursing staff.
• Even though it represents only 9% of the variants, it is still a complex process
model, so it shows that the treatment processes are highly patient-specific in
terms of the fine-grained clinical activities and their registration.
• Simple process visualizations cannot provide significant insights.
The (control-flow) process models in Figs. 4 and 5 show “direct follow”
activities and reveal some differences in patient flows between short-stay and
long-stay patients:
Fig. 3 Most frequent process paths for clinical activities. Arrows are annotated with case
frequencies
Improving Patient Flows at St. Andrew’s War Memorial Hospital’s. . . 323
• Approximately 7% of short-stay patients proceed immediately from Triage to
ED Discharge, but no long-stay patients do.
• The “Admission Request” event occurs in 48% of long-stay cases, compared to
only 22% of short-stay cases.
• 58% of long-stay cases are ultimately “Admitted to Hospital,” compared to only
39% of short-stay cases.
Extract performance-related information for each patient cohort and conduct
comparative process-performance analysis (including visualizations)
LoS in the ED was calculated as the time between the “Arrive_Start” event and one
of the two events—“ED_Discharged” and “Admitted_to_Hospital”—chosen as
marker events representing the patient’s physically leaving the ED. Under these
conditions, 63% (972 of 1472) of cases completed the transit through the ED in
<4 h (average transit time 2.9 h), and 37% (500 of 1472) of cases took more than
4 h to transit through the ED (average transit time 7.3 h).
The short- and long-LoS cohorts were also filtered to show the ED discharge
destination. Table 3 shows the average time taken to reach certain key events.
Fig. 4 Discovered process model for ED LoS up to 4 h
324 R. Andrews et al.
It is clear that the event timing for the two cohorts is similar until blood tests are
ordered. Differences in event timing are observable from the “RN Assign_Start”
event. We could not determine the causes of this difference.
An even more stark contrast between the short- and long-stay cohorts is evident
in the timing of the “Admission_Request” event, as shown in Fig. 6. The
“Admission_Request” event occurs significantly earlier in the patient transit for
short-stay patients than it does for long-stay patients. A similar discrepancy in the
time from “Arrival_Start” to “ECG (Ordered)” is also observed. Again, we could
not determine the cause of this observed difference.
500
222
257
208
55
52
276
48
35
170
64
63
44
59
31
37
140
18
25
82 273
181
142
Arrive_Start
500
Triage_Start
499
RN Assign_Start
313
Blood tests (Ordered)
415
Admitted_to_Hospital
293
ECG (Ordered)
377
ED_Discharged
207
Admission_Request
239
Medical Assign_Start
499
Fig. 5 Discovered process model for ED LoS longer than 4 h
Improving Patient Flows at St. Andrew’s War Memorial Hospital’s. . . 325
Table
3
Times
of
milestone
events
(minutes
after
Arrive_Start
event)
Triage
start
Medical
assign
start
Blood
test
(ordered)
RN
assign
start
Admission
request
ECG
(ordered)
Admitted
to
hospital
ED
discharged
LoS
>
4
h
Admitted
16.3
20.6
29.5
96.3
173.3
239.5
364.0
N/A
Home
14.7
17.7
29.2
98.6
173.5
321.5
N/A
341.1
LoS

4
h
Admitted
15.3
16.7
23.9
46.9
83.3
147.7
154.1
N/A
Home
12.4
17.5
26.0
41.9
91.4
106.5
N/A
141.9
326 R. Andrews et al.
Figure 7 shows the additional time spent in the ED between the time it was
decided that hospital admission was necessary and the time the patient was actually
admitted to hospital. It is clear that the waiting time in the ED following admission
requests contributes significantly to overall LoS.
Visualize comparative process performance
This project highlighted the deficiencies in current approaches to comparative
process-performance visualization. A parallel development of novel visualization
approaches in Pini et al. (2015) resulted in three styles of visualizations, to which
the authors referred as the general model, the superimposed model, and the side-by-
side comparison. The general model shows the differences in performance (dura-
tion and frequency). The superimposed model compares the process flows of
cohorts from the perspective of one of the cohorts such that correspondence of
Fig. 6 Time from Arrive_Start to Admission_Request (ED LoS comparison)
Fig. 7 Time from Admission_Request to Admitted_to_Hospital
Improving Patient Flows at St. Andrew’s War Memorial Hospital’s. . . 327
activities is visualized through alignment and superposition of an activity element.
The side-by-side comparison, which is specifically concerned with the time
perspective, exploits the process model’s logical flow to describe temporal
dependencies between activities through predecessor and successor nodes of a
directed graph. The superimposed model and side-by-side comparison were applied
to aspects of the SAWMH case study, as shown in Figs. 8 and 9.
Figure 8 shows a superimposed model that compares the relative execution times
of events between cohorts of long-stay and short-stay ED patients from the per-
spective of the long-stay cohort.
Figure 8 shows that the “ECG (O)” event occurs later in the process for short-
stay patients than it does for long-stay patients, while the “Medical_Note_Final”
event occurs at approximately the same point in the process for both cohorts.
The side-by-side comparison model (Fig. 9) shows the process difference
(in terms of execution time) between the two cohorts. The side-by-side model is
particularly useful in highlighting process delays. Considering the process
fragments for the activities “Medical Note_final” and “Discharge Letter” in models
for long-stay and short-stay patients makes clear that the individual activity
durations and the waiting time between activities are significantly shorter for the
short-stay cohort than they are for the long-stay cohort.
Through a combination of process discovery, analysis, and novel visualization
techniques, we were able to detect differences in process behavior for cohorts of
interest to SAWMH and obtain three important insights. First, there are fewer
admission requests than actual hospital admissions. Second, significant differences
in time spent in the ED between short-stay and long-stay patients become evident at
the “RN Assign_Start” event and become more pronounced as the patients’
journeys proceed. Third, there is evidence of patients “boarding” in the ED follow-
ing the decision that the patient requires hospital admission, so the patient stayed in
the ED waiting for a hospital bed to become available or to be transported to a ward.
While we recognized these three points in the process where improvements can be
made, we could not determine the causes of the differences. Nevertheless, these
insights form a starting point for improvements in patient flow that would have
direct impact on achieving the NEAT.
Fig. 8 Superimposed model of long-stay and short-stay cohorts (Pini et al. 2015). To illustrate
how a superimposed model is used for comparative process performance visualization, two events
are exploded out of the model to highlight their relative temporal ordering
328 R. Andrews et al.
5 Lessons Learned
From a clinical perspective, this project showed that process mining can be applied
to a complex, semi-structured process like that found in a hospital ED. Through
comparative process-performance analysis, we identified a point in the overall
process at which variations between cohorts of interest (chest-pain patients who
left the ED in 4 h and those whose LoS was longer than 4 h) became most
apparent. The performance analysis also quantified the effect of waiting time (the
time between its being determined that a patient required admission to hospital and
the time of actual admission) on overall LoS in the ED. These two observations
provide a starting point for patient-flow redesign and process-improvement
initiatives.
From a data-quality perspective, this case study proved to be similar to other
case studies with which we have been involved, in that the process of preparing
event log/s suitable for process mining required considerable manual effort and
benefited from the input of a domain expert in terms of attaching meaning and
Fig. 9 Side-by-side comparison of long-stay and short-stay cohorts (Pini et al. 2015). The
exploded sections of the models (bottom of the figure) represent the activity duration (width of
the colored rectangle to the right of the activity name) and the waiting time between activities
Improving Patient Flows at St. Andrew’s War Memorial Hospital’s. . . 329
context to source data. A positive outcome was the identification of several recur-
ring quality issues. For example, we found multiple instances of sets of events with
exactly the same timestamp as a result of a forms-based information system’s being
used to record aspects of the patient’s case. Users (e.g., doctors and nurses) click a
“Save” button to record data captured on the form, with the effect of associating all
data on the form with the same timestamp (the time the user clicked “Save”).
Ignoring such an issue would have led to unnecessarily complex models, as all
events with the same timestamp would have been modelled in parallel. The solution
was to aggregate events with the same timestamp into a single event that
represented the process step associated with the use of the particular form. Identifi-
cation and resolution of the first instance of each such problem provided a
templated recognition-and-resolution strategy that was applied repeatedly and
that significantly sped up the data-preparation phase.
Another data-quality issue resulted in the project’s inability to address one of the
key questions from the project’s stakeholders, that is, the impact of conducting
routine clinical activities on patient transit times. Our inability to do so was because
the data required to address the question was not stored in accessible format in the
hospital information systems. This issue highlights the importance of aligning data
with research questions (and research questions with data) if the prosecution of a
process-mining analysis (or any form of analysis) is to be successful. We offer two
recommendations to address this issue: improving hospital information recording
practices through real-time, electronic recording of data, and introducing methods
that allow hospital data to be correlated with related data held by external health
services providers (e.g., pathology labs).
Finally, we found that there was no existing automated, intuitive way to perform
process-performance comparison, particularly where multiple process models were
involved. This issue led to the design initiative described in Pini et al. (2015) and to
the development of static and animated multi-model and multi-cohort comparison
techniques described in Conforti et al. (2015). These techniques are general enough
to be applicable in a wider context, including to other hospital processes and to
other domains.
Acknowledgements The research for this article was supported by an Australian Centre for
Health Services Innovation (AusHSI) Stimulus Grant. We gratefully acknowledge the
contributions to this project of Dr. Kelly Foster, Annette Bailey, Cath Voysey, Dr. Raffaele
Conforti, Dr. Anastasiia Pika, and Huang Huy Nguyen.
References
Australian Institute of Health and Welfare. (2015). Emergency Department Care 2013–14:
Australian Hospital statistics. Health Services Series (No. 65, Cat. No. HSE 168), Canberra,
Australia. http://www.aihw.gov.au/WorkArea/DownloadAsset.aspx?id¼60129553618
Catchpole, K. R., Gangi, A., Blocker, R. C., Ley, E. J., Blaha, J., Gewertz, B. L.,  Wiegmann,
D. A. (2013). Flow disruptions in trauma care handoffs. Journal of Surgical Research, 184(1),
586–591. http://www.sciencedirect.com/science/article/pii/S0022480413001157.
330 R. Andrews et al.
Conforti, R., Dumas, M., La Rosa, M., Maaradji, A., Nguyen, H. H., Ostovar, A.,  Raboczi,
S. (2015). Analysis of business process variants in apromore. http://eprints.qut.edu.au/86669/
Forero, R., Hillman, K., McCarthy, S., Fatovich, D., Joseph, A.,  Richardson, D. W. (2010).
Access block and emergency department overcrowding. Emergency Medicine Australasia, 22,
119–135.
Lakshmanan, G. T., Keyser, P. T., Duan, S. (2011). Detecting changes in a semi-structured
business process through spectral graph analysis. In IEEE 27th International Conference on
Data Engineering Workshops (ICDEW) (pp. 255–260).
Liew, D.,  Kennedy, M. P. (2003). Emergency department length of stay independently predicts
excess inpatient length of stay. Medical Journal of Australia, 179(10), 524–526.
Partington, A., Wynn, M., Suriadi, S., Ouyang, C.,  Karnon, J. (2015). Process mining for clinical
processes: A comparative analysis of four Australian Hospitals. ACM Transactions on Man-
agement Information Systems (TMIS), 5(4), 19.
Pini, A., Brown, R.,  Wynn, M. T. (2015). Process visualization techniques for multi-perspective
process comparisons. In Asia Pacific Business Process Management: Third Asia Pacific
Conference, AP-BPM 2015, Proceedings (LNBIP, Vol. 219, pp. 183–197). Springer.
Queensland Audit Office. Emergency Department Performance Reporting. (2015). Report
3:2014–15. https://www.qao.qld.gov.au/files/file/Reports%20and%20publications/Reports%
20to%20Parliament%202014-15/RtP3Emergencydepartmentperformancereporting.pdf
Queensland Clinical Senate. (2014). 27–28 March 2014 meeting – Report and recommendations.
Brisbane, Queensland. https://www.health.qld.gov.au/qldclinicalsenate/docs/fin-rep-mar2014.
pdf
Queensland Health. (2011). The State of Queensland (Queensland Health) annual report 2010–2011.
https://publications.qld.gov.au/storage/f/2014-06-10T04%3A57%3A03.689Z/annual-report-2010-
11.pdf
Queensland Health. (2015). Cardiac chest pain clinical pathway. https://www.health.qld.gov.au/
caru/pathways/docs/sw574-chest-pain-pathway.pdf
Richardson, D. B. (2006). Increase in patient mortality at 10 days associated with emergency
department overcrowding. Medical Journal of Australia, 184, 213–216.
Showell, C., Ellis, L., Keen, E., Cummings, E., Georgiou, A.,  Turner, P. (2012). An evidence-
based review and training resource on smooth patient flow. eHealth Services Research Group,
University of Tasmania, Australia (on behalf of the Ministry of Health, New South Wales
Government).
Sprivulis, P. C., Da Silva, J. A., Jacobs, I. G., Frazer, A. R.,  Jelinek, G. A. (2006). The
association between hospital overcrowding and mortality among patients admitted via Western
Australian emergency departments. Medical Journal of Australia, 184, 208–212.
Suriadi, S., Mans, R., Wynn, M., Partington, A.,  Karnon, J. (2014). Measuring patient flow
variations: A cross-organisational process mining approach. In Asia Pacific business process
management (pp. 43–58). Cham: Springer.
Wiegmann, D., El Bardissi, A., Dearani, J., Daly, R.,  Sundt III, T. (2007). Disruptions in
surgical flow and their relationship to surgical errors: An exploratory investigation. Surgery,
142(5), 658–665.
Improving Patient Flows at St. Andrew’s War Memorial Hospital’s. . . 331
Robert Andrews is a Research Fellow within the
Business Process Management discipline of the School
of Information Systems at Queensland University of Tech-
nology. He obtained his PhD in 2003 from the Queensland
University of Technology (QUT). Since 2015, after more
than a decade in commercial practice, he has been involved
in a number of research projects in the area of Business
Process Management. His main research interests are in the
area of process mining, machine learning and business
intelligence.
Suriadi Suriadi is a Senior Research Fellow at Queensland
University of Technology. Before this, from 2014 to 2016,
he was a Lecturer within the College of Sciences of Massey
University, New Zealand. He obtained his PhD degree in the
discipline of Information Security in late 2010 from the
Queensland University of Technology (QUT). Since 2007, he
has been involved in a number of research projects in the area of
information security. From 2011 to late 2014, he was a
Research Fellow within the Business Process Management
discipline at Queensland University of Technology, Brisbane,
Australia. He enjoys working in collaborative, cross-domain
research projects that allow the application of research
outcomes to address real-world problems. His main research
interests are in the area of process mining and information
security.
Moe T. Wynn is a Senior Lecturer in the field of Business
Process Management (BPM) within the School of Informa-
tion Systems at Queensland University of Technology. Her
research interests include process automation, process
mining, data quality and comparative process analytics.
She has published over 60 refereed research papers. Her
work appeared in well-known journals in the field
including Information Systems, Decision Support Systems,
Information Sciences, Data and Knowledge Engineering,
Information and Software technology, Formal Aspects of
Computing, Journal of Computer and System Sciences, and
Transactions on Petri Nets and Other Models of
Concurrency.
332 R. Andrews et al.
Arthur ter Hofstede is a full Professor in the School of
Information Systems of Queensland University of Technol-
ogy in Brisbane, Australia. He has co-authored more than
80 journal articles, among others in Decision Support
Systems, ACM Transactions on Software Engineering and
Methodology, Information Systems, IEEE Transactions on
Knowledge and Data Engineering, and Information
Sciences. His main research interests are in business process
automation and process mining.
Sean Rothwell is a Fellow of the Australasian College for
Emergency Medicine, an Associate Fellow of the Royal
Australasian College of Medical Administrators and has a
Masters in Health Management from the University of New
South Wales. He is Director of Medical Services at
Greenslopes Private Hospital and senior staff specialist at
the Royal Brisbane and Women’s Hospital. He has
previously held positions of Director of Emergency
Services for St Andrew’s War Memorial Hospital and The
Wesley Hospital and is Vice-Chair of the Australasian Col-
lege for Emergency Medicine Private Practice Committee.
Improving Patient Flows at St. Andrew’s War Memorial Hospital’s. . . 333

DPM Project Work.pdf

  • 1.
    Improving Patient Flowsat St. Andrew’s War Memorial Hospital’s Emergency Department Through Process Mining Robert Andrews, Suriadi Suriadi, Moe Wynn, Arthur H.M. ter Hofstede, and Sean Rothwell Abstract (a) Situation faced: Improving Emergency Department (ED) patient flows in terms of processing time, resource use, costs, and patient outcomes is a priority for health service professionals and is vital to the delivery of safe, timely, and effective patient care. Poor patient flows manifest as overcrowding in the ED, prolonged length of stay (LoS), patients “boarding” in EDs and “access block” for admission to inpatient wards. Consequences include poor patient outcomes, reduced access for new patients who present at the ED, and negative effects on staff, including dissatisfaction and stress. Further motivation for improving patient flows in EDs arises because Commonwealth- and state-sponsored financial incentives for hospitals are tied to achieving targets for improved patient access to emergency services. One measure of such improved access is meeting nationally agreed targets for the percentage of patients who are physically discharged from the ED within 4 h of arrival. (b) Action taken: A key challenge in deriving evidence-based improvements for patient flows is that of gaining insight into the process factors and context factors that affect patient flows. The case study reported here adopted the BPM Lifecycle reference framework to improve patient flows. In particular we focused on the process identification, discovery, and analysis phases of the BPM Lifecycle. Process-oriented data-mining R. Andrews (*) • S. Suriadi • M. Wynn • A.H.M. ter Hofstede Queensland University of Technology, Brisbane, QLD, Australia e-mail: r.andrews@qut.edu.au; s.suriadi@qut.edu.au; m.wynn@qut.edu.au; a.terhofstede@qut. edu.au S. Rothwell UnitingCare Health, Brisbane, QLD, Australia e-mail: sean.rothwell@uchealth.com.au # Springer International Publishing AG 2018 J. vom Brocke, J. Mendling (eds.), Business Process Management Cases, Management for Professionals, DOI 10.1007/978-3-319-58307-5_17 311
  • 2.
    techniques were appliedto real practices to discover models of current patient flows in the ED of St. Andrew’s War Memorial Hospital (SAWMH) in Queensland, Australia. The discovered models were used to evaluate the effect on patient flows of certain context factors of interest to stakeholders. Case histories of 1473 chest pain presentations at SAWMH between September 2011 and March 2013 were analyzed to determine process differences between ED patients with short stays (<4 h) and those with long stays (>4 h). (c) Results achieved: Process models were discovered for the hospital’s ED patient flow. From a control-flow perspective, only minor differences were observed between short- and long-stay patients at SAWMH, although there were timing differences in reaching specific milestone events. Waiting time in the ED following a request for hospital admission added signifi- cantly to overall ED LoS. (d) Lessons learned: This project demonstrated that process mining is appli- cable to complex, semi-structured processes like those found in the healthcare domain. Comparative process performance analysis yielded some insights into ED patient flows, including recognition of recurring data-quality issues in datasets extracted from hospital information systems. The templated recognition and resolution of such issues offers a research opportunity to develop a (semi-)automated data-cleaning approach that would alleviate the tedious manual effort required to produce high-quality logs. The project highlighted the importance of hospital information systems collecting both start and end times of activities for proper perfor- mance analysis (duration, wait time, bottlenecks). Additions to our process-mining toolset include novel comparative process-performance visualization techniques that highlight the similarities and differences among process cohorts. 1 Introduction Improving Emergency Department (ED) patient flows in terms of processing time, resource use, costs, and patient outcomes is a priority for health service professionals and is vital to the delivery of safe, timely, and effective patient care. If patients are not moving through the system efficiently, other patients may experience delays in accessing care, with possible deleterious consequences. Inefficiencies in patient flow may also raise the cost of providing healthcare services through the failure to make the best use of available resources, such as the time of skilled staff (Liew and Kennedy 2003). Recent years have seen an increasing demand for ED services in Australia’s public hospitals (Australian Institute of Health and Welfare 2015) without a corresponding rise in inpatient beds. Table 1 highlights the steadily increasing 312 R. Andrews et al.
  • 3.
  • 4.
    number of patientpresentations at public hospitals’ EDs. (The increase in the overall number of reporting hospitals is due to a large number of smaller hospitals’ reporting patient presentations in their EDs, so interpretation of changes over time should take these changes of coverage into account.) In July 2011, the National Health Reform Agreement—National Partnership Agreement on Improving Public Hospital Service was signed by all of Australia’s states and territories. Under this agreement, financial incentives were established for public hospitals to meet targets. In particular, the National Emergency Access Target (NEAT) was created to improve patient access to public hospitals’ EDs. Performance against the NEAT is measured as the percentage of patients who physically leave the ED within 4 h of their arrival. (The term “physically leave” includes patients who leave without treatment, are discharged from the ED, are admitted to another hospital unit (including the short-stay unit attached to the ED), or are transferred to another hospital). Incremental NEAT targets for Queensland were 70% in 2012, 77% in 2013, 83% in 204, and 90% in 2015. Although no state or territory, including Queensland, has consistently achieved its NEAT, the initiative has seen a reduction in average Length of Stay (LoS) in Queensland’s public hospitals’ EDs from 280 min in July 2011 to 198 min in June 2014 (Queensland Audit Office 2015) and has motivated changes in EDs’ and wider hospitals’ procedures (Queensland Clinical Senate 2014). Two significant innovations have been the introduction of short-stay units attached to EDs, specifi- cally for patients who require monitoring for up to 24 h, which allows patients to be discharged from EDs to short-stay unit, and the introduction of the Emergency Department Information System (EDIS), which is used by most major public hospitals to record real-time admission/discharge information. EDIS features a sort of traffic-light system that gives operators a visual indication of the current patient waiting time (Queensland Audit Office 2015). Patient flows have been adopted as a management strategy to systematize the processing of patients from arrival at the ED to either discharge from the ED or admission to hospital. In March 2010 the Queensland Government launched its patient-flow strategy with the aim of reshaping Queensland Health’s processes so the healthcare system could cope with increasing demands, deliver improved performance, reduce delays, increase access, and ensure best practice across the state (Queensland Health 2011). While patient flows alone cannot resolve all of the issues that affect equitable delivery of care to ED patients, improving patient flows has been shown to have a positive impact in terms of time, costs, and patient outcomes (Showell et al. 2012) and is one of the key priorities in the healthcare domain. Evidence-based process improvement is an approach to process improvement in which the improvement initiatives are driven by the results of an empirical analysis of process-related data derived from the as is process. The analysis is designed to reveal process inefficiencies like bottlenecks, protracted activity durations, and rework loops. A key challenge in deriving evidence-based improvement to patient flows is that of gaining insight into the process factors and context factors that affect patient flows. This project involved a detailed analysis of patient flows in 314 R. Andrews et al.
  • 5.
    St. Andrew’s WarMemorial Hospital’s (SAWMH) ED using a process-mining methodology with the aim of providing insights into the as is processes in the ED, particularly as these processes apply to patients who present with chest pain. The project also sought opportunities for improvement in existing process-mining methodologies and tools (particularly in the areas of process comparison and visualization). St Andrew’s Emergency Centre is a private ED that is not subject to the public EDs’ NEAT-based financial incentives, but it does report the NEAT data publicly, and it is benchmarked against public EDs’ NEAT performance. The project identified differences in patient flows between short LoS (<4 h) and long LoS (longer than 4 h). Process analysis quantified the effect of waiting time (the time between when it was determined that a patient required admission to hospital and the time of admission) had on overall ED LoS. While it was not possible to determine the root cause of these effects, they form the basis for potential process improvements that would have direct impact on achieving the NEAT. The project also drove the development of several novel visualization tools for comparing processes. 2 Situation Faced Processes in healthcare settings, especially in hospital EDs, are often semi- structured. Semi-structured processes are characterized by their lack of a formal process model (although they usually have an informal process description), many points at which different continuation paths are possible, and being driven largely by context factors and human decision-making (Lakshmanan et al. 2011). In the ED, while specific treatment plans for each patient can be designed after a triage assessment, the delivery of the treatment requires flexibility and ad-hoc decision- making because of regular disruptions in patient flows (Catchpole et al. 2013). Disruptions to patient flows arise from such issues as those related to resources (e.g., lack of medical personnel and “access block”), teamwork (e.g., lack of communication that ensures smooth transition from one activity to another), and external interruptions (e.g., slow turnaround time for pathology tests) (Wiegmann et al. 2007) and manifest as long wait times, delays in administering/reporting on ordered tests, “boarding” of patients in the ED, ambulance ramping (ambulance arrives at ED and there is a delay in handing over the patient to ED staff requiring ambulance officers to continue administering care to the patient), and overcrowding in the ED. Overcrowding and prolonged LoS in the ED (for admitted patients) is associated with poor outcomes, including increased mortality rates (Richardson 2006; Sprivulis et al. 2006; Forero et al. 2010). The constant need to adjust patients’ treatment plans likely contributes to a high level of variations in patient flows in hospital settings. This phenomenon is consistent with insights reported in Suriadi et al. (2014) and Partington et al. (2015). To illustrate the complexity of healthcare processes and ED processes in particular, consider the BPMN process model/abstraction of Queensland Health’s Possible Cardiac Chest Pain Clinical Pathway (Queensland Health 2015), shown in Fig. 1. Improving Patient Flows at St. Andrew’s War Memorial Hospital’s. . . 315
  • 6.
    Clinical pathways arestandardized, evidence-based, multidisciplinary manage- ment plans that identify an appropriate sequence of clinical interventions, timeframes, milestones, and expected outcomes for a homogenous patient group (Queensland Health Clinical Pathways Board definition 2002). Clinical Pathways are guidelines made available to all hospitals, while patient flows are generally hospital-specific and devised by each individual hospital. Each Clinical Pathway is published with the advice to clinicians that “clinical pathways never replace clinical judgement” and that “ care outlined in [the] pathway must be altered if not clinically appropriate for the individual patient.” Each step in the process model is itself a multi-step sub-process, with many of these steps being the performance of clinical tests. Decision points in the pathway are generally expressed in terms of “if any of the tests. . .” or “if none of the tests. . ..” In the ED that was analyzed for this case study, the usual sequence of events is for a patient’s arrival at the ED to be recorded and then the patient to be triaged and then later by a member of the medical staff (a doctor, a registered nurse, or both). To highlight the non-structured and patient- centric nature of patient flows, in accordance with the recommendation that clinical judgement take precedence, in 45% of the cases in our study of patients presenting with chest pain, the patient was seen by a doctor before being triaged, a flow that is not in accordance with the typical pathway shown in Fig. 1. SAWMH was particularly interested in identifying the differences between patient flows for the cohort of chest-pain patients who spent <4 h in the ED from time of arrival to discharge from the ED and the cohort of chest-pain patients who spent longer than 4 h in the ED. Of further interest to SAWMH was the impact of its practice of routinely requesting blood tests and radiological imaging of patients who present with chest pain. Devising an effective improvement plan for patient flow requires a baseline understanding of where variations in patient flow occur in the end-to-end treatment of patient cohorts and, most important, how the variations manifest. The study was expected to deliver an objective evaluation of SAWMH’s treatment practices for chest-pain patients, including a performance analysis with particular emphasis on factors that influence LoS in the ED. The ultimate aim was to identify potential improvements to patient flows that could contribute to improvements in SAWMH’s performance against the NEAT. Fig. 1 Abstraction of Queensland Health’s Cardiac Chest Pain Clinical Pathway 316 R. Andrews et al.
  • 7.
    3 Action Taken Thefocus of this project was the application of process-mining techniques to derive evidence-based insights about the behavior and performance of patient flows at SAWMH, from which comparisons of patient flows across patient cohorts could be made. We adopted the BPM Lifecycle reference framework, focusing on the process identification, discovery, and analysis phases. Table 2 shows the steps taken and the key challenges phased in each phase of the BPM Lifecycle. In the next section, we discuss the key challenges faced in working through each of the project’s phases. 3.1 Process Identification Identify research questions that are relevant to SAWMH The research questions identified were: • What are the differences in the patient flows between patients who stayed in the ED for <4 h and those who stayed for more than 4 h? • How much delay was introduced to the patient flows as a result of conducting routine clinical activities, including blood tests and X-ray imaging? • What are the factors that influenced the patients’ LoS? Table 2 BPM lifecycle phases and key challenges Steps in lifecycle phase Key challenges Process identification phase • Identify research questions that are relevant to SAWMH With respect to the research questions of interest, define the aspects of ED and hospital patient flows to be investigated • Extract process-related datasets from IT system(s), including data pre-processing Identify relevant data from hospital information systems Identify and (if possible) resolve any data- quality issues evident in the extracted data so event logs that are aligned with the study’s aims can be constructed Process discovery phase • Discover as is process models that show dominant care paths Deal with the highly variable, patient-centric flow to discover readable models that capture the dominant (most frequent) care paths Process analysis phase • Extract performance-related information for each patient cohort and conduct comparative process-performance analysis Extract comparative process-performance metrics Visualize comparative process-performance Improving Patient Flows at St. Andrew’s War Memorial Hospital’s. . . 317
  • 8.
    Key challenge—With respectto the research questions of interest, define the relevant aspects of ED and hospital patient flows to be investigated A key challenge was to limit the study’s scope to patient-flow events in the ED and the hospital that affected the research questions. After consultation with ED clinicians from SAWMH, events related to ED arrival and discharge, clinical activities conducted as part of the patient’s stay in the ED, blood and imaging tests ordered for the patient, and hospital admittance events were selected as being within the study’s scope. Key challenge—Identify relevant data from hospital information systems The case histories of all patients who presented with chest pain at the ED between September 2011 and March 2013 were identified as being relevant to the study. Four tables from four hospital information systems were identified as holding the relevant data: • Encounter table: The Encounter table recorded the arrival and departure of patients from the ED using a unique “encounterID” value. As patients may present at the ED multiple times over time, a unique patient identifier (Medical Record Number) was associated with each patient and recorded in the Encounter table. Encounters were classified as either “emergency,” indicating an ED presentation, or “hospital,” indicating a hospital admission. The encounterID value was used as the common identifier in the remaining tables so records could be linked. • Emergency table: The Emergency table recorded the key intra-ED patient flow milestone events, such as when a doctor was assigned to a patient, when the doctor first saw a patient, and when triage was started. • Clinical table: The Clinical table recorded results of clinical observations of patients, including the initial assessment, ongoing nursing observations, periodic nursing, and medical notes. • Orders table: The Orders table recorded orders for pathology tests, imaging tests, and other medical procedures requested for patients. Key challenge—Identify and (if possible) resolve any data-quality issues evident in the extracted data so event logs aligned with the study’s aims can be constructed The most significant data-quality issues that affected the extracted data were issues related to correlation, diverse activities with the same timestamp, inadequate granularity of event names, duplicate events, references to the same event in multiple tables, irrelevant events, events that represented case attributes, and missing events. • Correlation: The same patient (the same Medical Record Number) with multiple Encounter table records on the same day, where one was an “emergency” and one was a “hospital” encounter type. This represented a single case, so records from the four tables with either encounterID value were merged into a single case. 318 R. Andrews et al.
  • 9.
    • Multiple activitieswith the same timestamp: Many events in the Clinical table were recorded with the same timestamp. This concurrency came about through the affected events being extracted from different fields in the same on-line form with the timestamp associated with each event being the time the form was “saved”. Such events were assumed to be related to the same clinical activity, so clinical events were grouped by timestamp and a set of cleaning heuristics based on the occurrence of patterns of events in the groups were applied to reduce the group of events with the same timestamp to a single event (or sometimes a pair of events) that represented the actual clinical activity performed. • Inconsistent granularity of event names: The Orders table recorded orders at a finer level of granularity than was required for the analysis. For instance, Orders table records that related to pathology tests listed the individual blood components to be tested for, and Orders table records that related to imaging used shorthand references like “xr” and “rad exam”. We addressed these issues by aggregating multiple requests for individual blood tests into a single event named “Blood test” and replaced occurrences of “xr” and “rad exam” with “Radiology”. • Duplicate events: Some cases contained sequences of Clinical table and/or Order table events with only a few seconds’ time difference. Where groups of events occurred with no more than 15 s’ time difference between neighboring events, duplicated events in the group were removed. The duplication was deemed to be an artefact of system logging rather than an indication that the event actually occurred more than once. • References to the same event in multiple tables: We found that certain process steps were recorded with different activity names in two tables. For example, the “Register_in_Emergency” event from the Encounter table coincided with the “Arrive_Start,” “Arrive_Request,” and “Arrive_Complete” events in the Emer- gency table. These events were replaced with a single “Arrive” event. Other instances were observed in the Orders table and Clinical table. Again, a single event was retained and the related events removed. • Irrelevant events: After consultation with the domain expert, a set of events that were not relevant to the analysis, such as when all events happened after a patient had been admitted to a hospital ward, was identified and removed. • Events that represented case attributes: For some events, it was more important to know that the event had occurred in the case than it was to know when it had occurred. For instance, the value associated with the “Glascow Coma Score” event is of more interest than was the time the score was determined. For such instances, the events were removed, a case attribute (named after the event) was added, and the value was recorded against the case attribute. In a similar vein, each of nine events associated with ED discharge indicated the discharge destination. A case attribute that represented the discharge destination was added, and the nine events were reduced to a single “ED Discharge” event. The final log contained 40 case attributes. • Missing process-related events: A research question SAWMH proposed dealt with determining the impact of conducting routine tests (blood and imaging) on Improving Patient Flows at St. Andrew’s War Memorial Hospital’s. . . 319
  • 10.
    chest-pain patients. Whilereferences to orders for such tests were present in the Orders table, no reference to either the performance of the test or the return of results was evident in the source data. Investigations into the recording of blood and medical imaging test results undertaken with SAWMH’s data manager revealed that no medical imaging results and few blood test results were recorded electronically in such a way that they could be matched to the original order. For this reason, events associated with blood tests and medical imaging results were not included in the final event log. 3.2 Process Discovery Key challenge—Deal with the highly variable, patient-centric flow data to discover readable models that capture the dominant (most frequent) care paths After data cleaning, the event log contained 1473 cases, representing 1472 different execution paths—that is, only two cases followed exactly the same path—reflecting the semi-structured, patient-centric nature of ED patient flows. The initial discov- ered model reflected the “spaghetti”-like process. There were 30 separate activities in this version of the log. To discover readable models, the log was partitioned into four parts representing major milestone events of a patient’s journey through the ED, the major clinical activities, cases in which ED LoS was <4 h, and cases in which ED LoS was longer than 4 h. Disco,1 a commercial process-mining tool, was used to filter the log to abstract the relevant partitions from the log, from which readable but still meaningful process models were constructed. 3.3 Process Analysis Key challenge—Extract comparative process performance Extracting differences between cohorts’ processes required manual inspection of models and manual compilation of observations. While doing so is possible, it is not an efficient way to discover and highlight variations in performance. Key challenge—Visualize comparative process performance Visualization, the depiction of non-visual data in visual form, provides an effective way to communicate, particularly where the raw data is large or complex. The visualization aspect of process comparison is still in an exploratory stage (Pini et al. 2015), so the challenge was to devise novel forms of visualization to highlight differences in process performance across multiple perspectives for the cohorts being compared. 1 http://fluxicon.com 320 R. Andrews et al.
  • 11.
    4 Results Achieved Inthis section we detail the outcomes of the process discovery and analysis phases of the case study. 4.1 Process Discovery The discovered process model shown in Fig. 2 represents the dominant (most frequent) pathways for the major milestone events in the patient flow for chest- pain patients. For example, there are 1473 cases with an “Arrive_Start” event, and the major milestones are arrival and departure from the ED (to either home or hospital), triage, and when the patient is first seen by medical personnel (a doctor, a registered nurse, or both). The initially discovered process model for clinical activities was complex and unreadable. Events in the Clinical table are the main contributors to process variability (1263 different execution paths in 1471 cases). To discover a simpler process model for clinical activities (Fig. 3), the set of activities was reduced (in consultation with the process stakeholder) to include only key activities from the Clinical table: “Pre-Arrival Note,” “Nursing Assessment,” “Nursing—Primary Assessment,” “Nursing Progress Notes,” “Medical Note (final),” and “Discharge Letter.” Figure 3 depicts the process model with the most frequent paths (those in the top 9% of process variants), although only 21% of the cases follow this process model. To address SAWMH’s research question about process differences between the cohort of patients with a LoS of <4 h (short LoS) and the cohort with a LoS of more than 4 h (long LoS), separate process models were discovered for each cohort. Figure 4 is the discovered model for short ED LoS, and Fig. 5 is the discovered model for long ED LoS. An area of interest to SAWMH was the relationship between routinely requesting blood tests and imaging for patients presenting with chest pain and the patient’s overall LoS. Do such practices introduce delays into the patient flows? Blood testing for SAWMH is carried out by a third party pathology laboratory, but the two organizations’ information systems are not integrated to the point at which orders for tests can be sent directly from SAWMH to the laboratory. SAWMH records orders the tests in its own clinical IT system, however the pathology lab only becomes aware of the order when blood samples and printed test request physically arrives at the lab. On completion of the tests, the laboratory faxes test results to the ED, as this is the currently fastest method of returning test results to the treating physicians. Further, as the two organizations do not use a common patient identifier, it was almost impossible to match cases across the two systems. Because electronic records of imaging tests are not stored in the data sources that were available to the study, only a small sample of matching orders and results were obtained, which was too small for proper process discovery or analysis. Improving Patient Flows at St. Andrew’s War Memorial Hospital’s. . . 321
  • 12.
    4.2 Process Analysis Thissection lists the main findings of process analysis as they relate to the discovered process models. Four primary observations with respect to the general ED patient flow could be derived from the milestone events model (Fig. 2): • There is a logical flow of activities to which most cases adhere. • The Medical_Assign event can occur before the Triage event and even before the Arrive event. • Fewer admission request events are recorded than the number of hospital admissions (i.e., 458 admission requests vs. 662 admission events). Fig. 2 Process model describing the main patient flow (major milestone events). In this model, each rectangle represents an activity, and the color density of the rectangle represents the frequency of the activity. Arrows represent transitions between activities, and the width of the arrow represents the frequency of the transition. The numbers on the arrows and in the boxes indicate the case frequency 322 R. Andrews et al.
  • 13.
    • Patients inall but 48 of 1473 episodes were ultimately discharged home, while the remaining patients were discharged otherwise (e.g., they were discharged to a different hospital, they did not wait, or they died), so these 48 episodes are not captured by the model. Three primary observations with respect to clinical activities could be derived from this model (Fig. 3): • Nursing activities form the backbone of the clinical events—that is, the majority of activities/interactions with patients in the ED are carried out by nursing staff. • Even though it represents only 9% of the variants, it is still a complex process model, so it shows that the treatment processes are highly patient-specific in terms of the fine-grained clinical activities and their registration. • Simple process visualizations cannot provide significant insights. The (control-flow) process models in Figs. 4 and 5 show “direct follow” activities and reveal some differences in patient flows between short-stay and long-stay patients: Fig. 3 Most frequent process paths for clinical activities. Arrows are annotated with case frequencies Improving Patient Flows at St. Andrew’s War Memorial Hospital’s. . . 323
  • 14.
    • Approximately 7%of short-stay patients proceed immediately from Triage to ED Discharge, but no long-stay patients do. • The “Admission Request” event occurs in 48% of long-stay cases, compared to only 22% of short-stay cases. • 58% of long-stay cases are ultimately “Admitted to Hospital,” compared to only 39% of short-stay cases. Extract performance-related information for each patient cohort and conduct comparative process-performance analysis (including visualizations) LoS in the ED was calculated as the time between the “Arrive_Start” event and one of the two events—“ED_Discharged” and “Admitted_to_Hospital”—chosen as marker events representing the patient’s physically leaving the ED. Under these conditions, 63% (972 of 1472) of cases completed the transit through the ED in <4 h (average transit time 2.9 h), and 37% (500 of 1472) of cases took more than 4 h to transit through the ED (average transit time 7.3 h). The short- and long-LoS cohorts were also filtered to show the ED discharge destination. Table 3 shows the average time taken to reach certain key events. Fig. 4 Discovered process model for ED LoS up to 4 h 324 R. Andrews et al.
  • 15.
    It is clearthat the event timing for the two cohorts is similar until blood tests are ordered. Differences in event timing are observable from the “RN Assign_Start” event. We could not determine the causes of this difference. An even more stark contrast between the short- and long-stay cohorts is evident in the timing of the “Admission_Request” event, as shown in Fig. 6. The “Admission_Request” event occurs significantly earlier in the patient transit for short-stay patients than it does for long-stay patients. A similar discrepancy in the time from “Arrival_Start” to “ECG (Ordered)” is also observed. Again, we could not determine the cause of this observed difference. 500 222 257 208 55 52 276 48 35 170 64 63 44 59 31 37 140 18 25 82 273 181 142 Arrive_Start 500 Triage_Start 499 RN Assign_Start 313 Blood tests (Ordered) 415 Admitted_to_Hospital 293 ECG (Ordered) 377 ED_Discharged 207 Admission_Request 239 Medical Assign_Start 499 Fig. 5 Discovered process model for ED LoS longer than 4 h Improving Patient Flows at St. Andrew’s War Memorial Hospital’s. . . 325
  • 16.
  • 17.
    Figure 7 showsthe additional time spent in the ED between the time it was decided that hospital admission was necessary and the time the patient was actually admitted to hospital. It is clear that the waiting time in the ED following admission requests contributes significantly to overall LoS. Visualize comparative process performance This project highlighted the deficiencies in current approaches to comparative process-performance visualization. A parallel development of novel visualization approaches in Pini et al. (2015) resulted in three styles of visualizations, to which the authors referred as the general model, the superimposed model, and the side-by- side comparison. The general model shows the differences in performance (dura- tion and frequency). The superimposed model compares the process flows of cohorts from the perspective of one of the cohorts such that correspondence of Fig. 6 Time from Arrive_Start to Admission_Request (ED LoS comparison) Fig. 7 Time from Admission_Request to Admitted_to_Hospital Improving Patient Flows at St. Andrew’s War Memorial Hospital’s. . . 327
  • 18.
    activities is visualizedthrough alignment and superposition of an activity element. The side-by-side comparison, which is specifically concerned with the time perspective, exploits the process model’s logical flow to describe temporal dependencies between activities through predecessor and successor nodes of a directed graph. The superimposed model and side-by-side comparison were applied to aspects of the SAWMH case study, as shown in Figs. 8 and 9. Figure 8 shows a superimposed model that compares the relative execution times of events between cohorts of long-stay and short-stay ED patients from the per- spective of the long-stay cohort. Figure 8 shows that the “ECG (O)” event occurs later in the process for short- stay patients than it does for long-stay patients, while the “Medical_Note_Final” event occurs at approximately the same point in the process for both cohorts. The side-by-side comparison model (Fig. 9) shows the process difference (in terms of execution time) between the two cohorts. The side-by-side model is particularly useful in highlighting process delays. Considering the process fragments for the activities “Medical Note_final” and “Discharge Letter” in models for long-stay and short-stay patients makes clear that the individual activity durations and the waiting time between activities are significantly shorter for the short-stay cohort than they are for the long-stay cohort. Through a combination of process discovery, analysis, and novel visualization techniques, we were able to detect differences in process behavior for cohorts of interest to SAWMH and obtain three important insights. First, there are fewer admission requests than actual hospital admissions. Second, significant differences in time spent in the ED between short-stay and long-stay patients become evident at the “RN Assign_Start” event and become more pronounced as the patients’ journeys proceed. Third, there is evidence of patients “boarding” in the ED follow- ing the decision that the patient requires hospital admission, so the patient stayed in the ED waiting for a hospital bed to become available or to be transported to a ward. While we recognized these three points in the process where improvements can be made, we could not determine the causes of the differences. Nevertheless, these insights form a starting point for improvements in patient flow that would have direct impact on achieving the NEAT. Fig. 8 Superimposed model of long-stay and short-stay cohorts (Pini et al. 2015). To illustrate how a superimposed model is used for comparative process performance visualization, two events are exploded out of the model to highlight their relative temporal ordering 328 R. Andrews et al.
  • 19.
    5 Lessons Learned Froma clinical perspective, this project showed that process mining can be applied to a complex, semi-structured process like that found in a hospital ED. Through comparative process-performance analysis, we identified a point in the overall process at which variations between cohorts of interest (chest-pain patients who left the ED in 4 h and those whose LoS was longer than 4 h) became most apparent. The performance analysis also quantified the effect of waiting time (the time between its being determined that a patient required admission to hospital and the time of actual admission) on overall LoS in the ED. These two observations provide a starting point for patient-flow redesign and process-improvement initiatives. From a data-quality perspective, this case study proved to be similar to other case studies with which we have been involved, in that the process of preparing event log/s suitable for process mining required considerable manual effort and benefited from the input of a domain expert in terms of attaching meaning and Fig. 9 Side-by-side comparison of long-stay and short-stay cohorts (Pini et al. 2015). The exploded sections of the models (bottom of the figure) represent the activity duration (width of the colored rectangle to the right of the activity name) and the waiting time between activities Improving Patient Flows at St. Andrew’s War Memorial Hospital’s. . . 329
  • 20.
    context to sourcedata. A positive outcome was the identification of several recur- ring quality issues. For example, we found multiple instances of sets of events with exactly the same timestamp as a result of a forms-based information system’s being used to record aspects of the patient’s case. Users (e.g., doctors and nurses) click a “Save” button to record data captured on the form, with the effect of associating all data on the form with the same timestamp (the time the user clicked “Save”). Ignoring such an issue would have led to unnecessarily complex models, as all events with the same timestamp would have been modelled in parallel. The solution was to aggregate events with the same timestamp into a single event that represented the process step associated with the use of the particular form. Identifi- cation and resolution of the first instance of each such problem provided a templated recognition-and-resolution strategy that was applied repeatedly and that significantly sped up the data-preparation phase. Another data-quality issue resulted in the project’s inability to address one of the key questions from the project’s stakeholders, that is, the impact of conducting routine clinical activities on patient transit times. Our inability to do so was because the data required to address the question was not stored in accessible format in the hospital information systems. This issue highlights the importance of aligning data with research questions (and research questions with data) if the prosecution of a process-mining analysis (or any form of analysis) is to be successful. We offer two recommendations to address this issue: improving hospital information recording practices through real-time, electronic recording of data, and introducing methods that allow hospital data to be correlated with related data held by external health services providers (e.g., pathology labs). Finally, we found that there was no existing automated, intuitive way to perform process-performance comparison, particularly where multiple process models were involved. This issue led to the design initiative described in Pini et al. (2015) and to the development of static and animated multi-model and multi-cohort comparison techniques described in Conforti et al. (2015). These techniques are general enough to be applicable in a wider context, including to other hospital processes and to other domains. Acknowledgements The research for this article was supported by an Australian Centre for Health Services Innovation (AusHSI) Stimulus Grant. We gratefully acknowledge the contributions to this project of Dr. Kelly Foster, Annette Bailey, Cath Voysey, Dr. Raffaele Conforti, Dr. Anastasiia Pika, and Huang Huy Nguyen. References Australian Institute of Health and Welfare. (2015). Emergency Department Care 2013–14: Australian Hospital statistics. Health Services Series (No. 65, Cat. No. HSE 168), Canberra, Australia. http://www.aihw.gov.au/WorkArea/DownloadAsset.aspx?id¼60129553618 Catchpole, K. R., Gangi, A., Blocker, R. C., Ley, E. J., Blaha, J., Gewertz, B. L., Wiegmann, D. A. (2013). Flow disruptions in trauma care handoffs. Journal of Surgical Research, 184(1), 586–591. http://www.sciencedirect.com/science/article/pii/S0022480413001157. 330 R. Andrews et al.
  • 21.
    Conforti, R., Dumas,M., La Rosa, M., Maaradji, A., Nguyen, H. H., Ostovar, A., Raboczi, S. (2015). Analysis of business process variants in apromore. http://eprints.qut.edu.au/86669/ Forero, R., Hillman, K., McCarthy, S., Fatovich, D., Joseph, A., Richardson, D. W. (2010). Access block and emergency department overcrowding. Emergency Medicine Australasia, 22, 119–135. Lakshmanan, G. T., Keyser, P. T., Duan, S. (2011). Detecting changes in a semi-structured business process through spectral graph analysis. In IEEE 27th International Conference on Data Engineering Workshops (ICDEW) (pp. 255–260). Liew, D., Kennedy, M. P. (2003). Emergency department length of stay independently predicts excess inpatient length of stay. Medical Journal of Australia, 179(10), 524–526. Partington, A., Wynn, M., Suriadi, S., Ouyang, C., Karnon, J. (2015). Process mining for clinical processes: A comparative analysis of four Australian Hospitals. ACM Transactions on Man- agement Information Systems (TMIS), 5(4), 19. Pini, A., Brown, R., Wynn, M. T. (2015). Process visualization techniques for multi-perspective process comparisons. In Asia Pacific Business Process Management: Third Asia Pacific Conference, AP-BPM 2015, Proceedings (LNBIP, Vol. 219, pp. 183–197). Springer. Queensland Audit Office. Emergency Department Performance Reporting. (2015). Report 3:2014–15. https://www.qao.qld.gov.au/files/file/Reports%20and%20publications/Reports% 20to%20Parliament%202014-15/RtP3Emergencydepartmentperformancereporting.pdf Queensland Clinical Senate. (2014). 27–28 March 2014 meeting – Report and recommendations. Brisbane, Queensland. https://www.health.qld.gov.au/qldclinicalsenate/docs/fin-rep-mar2014. pdf Queensland Health. (2011). The State of Queensland (Queensland Health) annual report 2010–2011. https://publications.qld.gov.au/storage/f/2014-06-10T04%3A57%3A03.689Z/annual-report-2010- 11.pdf Queensland Health. (2015). Cardiac chest pain clinical pathway. https://www.health.qld.gov.au/ caru/pathways/docs/sw574-chest-pain-pathway.pdf Richardson, D. B. (2006). Increase in patient mortality at 10 days associated with emergency department overcrowding. Medical Journal of Australia, 184, 213–216. Showell, C., Ellis, L., Keen, E., Cummings, E., Georgiou, A., Turner, P. (2012). An evidence- based review and training resource on smooth patient flow. eHealth Services Research Group, University of Tasmania, Australia (on behalf of the Ministry of Health, New South Wales Government). Sprivulis, P. C., Da Silva, J. A., Jacobs, I. G., Frazer, A. R., Jelinek, G. A. (2006). The association between hospital overcrowding and mortality among patients admitted via Western Australian emergency departments. Medical Journal of Australia, 184, 208–212. Suriadi, S., Mans, R., Wynn, M., Partington, A., Karnon, J. (2014). Measuring patient flow variations: A cross-organisational process mining approach. In Asia Pacific business process management (pp. 43–58). Cham: Springer. Wiegmann, D., El Bardissi, A., Dearani, J., Daly, R., Sundt III, T. (2007). Disruptions in surgical flow and their relationship to surgical errors: An exploratory investigation. Surgery, 142(5), 658–665. Improving Patient Flows at St. Andrew’s War Memorial Hospital’s. . . 331
  • 22.
    Robert Andrews isa Research Fellow within the Business Process Management discipline of the School of Information Systems at Queensland University of Tech- nology. He obtained his PhD in 2003 from the Queensland University of Technology (QUT). Since 2015, after more than a decade in commercial practice, he has been involved in a number of research projects in the area of Business Process Management. His main research interests are in the area of process mining, machine learning and business intelligence. Suriadi Suriadi is a Senior Research Fellow at Queensland University of Technology. Before this, from 2014 to 2016, he was a Lecturer within the College of Sciences of Massey University, New Zealand. He obtained his PhD degree in the discipline of Information Security in late 2010 from the Queensland University of Technology (QUT). Since 2007, he has been involved in a number of research projects in the area of information security. From 2011 to late 2014, he was a Research Fellow within the Business Process Management discipline at Queensland University of Technology, Brisbane, Australia. He enjoys working in collaborative, cross-domain research projects that allow the application of research outcomes to address real-world problems. His main research interests are in the area of process mining and information security. Moe T. Wynn is a Senior Lecturer in the field of Business Process Management (BPM) within the School of Informa- tion Systems at Queensland University of Technology. Her research interests include process automation, process mining, data quality and comparative process analytics. She has published over 60 refereed research papers. Her work appeared in well-known journals in the field including Information Systems, Decision Support Systems, Information Sciences, Data and Knowledge Engineering, Information and Software technology, Formal Aspects of Computing, Journal of Computer and System Sciences, and Transactions on Petri Nets and Other Models of Concurrency. 332 R. Andrews et al.
  • 23.
    Arthur ter Hofstedeis a full Professor in the School of Information Systems of Queensland University of Technol- ogy in Brisbane, Australia. He has co-authored more than 80 journal articles, among others in Decision Support Systems, ACM Transactions on Software Engineering and Methodology, Information Systems, IEEE Transactions on Knowledge and Data Engineering, and Information Sciences. His main research interests are in business process automation and process mining. Sean Rothwell is a Fellow of the Australasian College for Emergency Medicine, an Associate Fellow of the Royal Australasian College of Medical Administrators and has a Masters in Health Management from the University of New South Wales. He is Director of Medical Services at Greenslopes Private Hospital and senior staff specialist at the Royal Brisbane and Women’s Hospital. He has previously held positions of Director of Emergency Services for St Andrew’s War Memorial Hospital and The Wesley Hospital and is Vice-Chair of the Australasian Col- lege for Emergency Medicine Private Practice Committee. Improving Patient Flows at St. Andrew’s War Memorial Hospital’s. . . 333