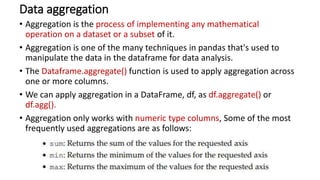
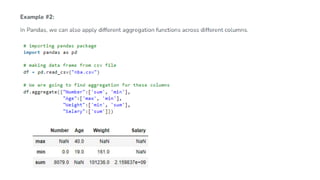
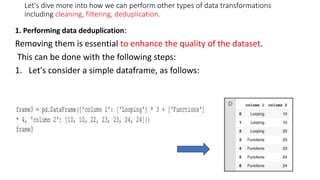
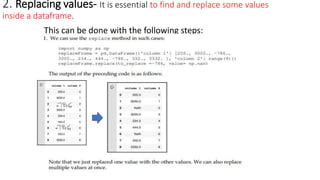
This document discusses various data transformation techniques in pandas including cleaning, filtering, deduplication, handling missing data, outlier detection, data grouping, and aggregation. It provides steps for performing data deduplication, replacing values, dropping and filling missing values, interpolating missing values, detecting and filtering outliers, using the groupby() method to split data into groups, and applying aggregation functions across columns.


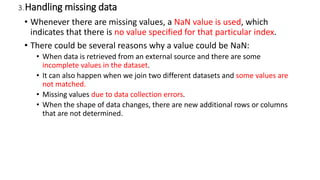
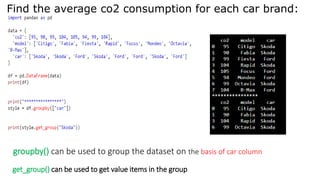
![Find the average co2 consumption for each car brand:
import pandas as pd
data = {
'co2': [95, 90, 99, 104, 105, 94, 99, 104],
'model': ['Citigo', 'Fabia', 'Fiesta', 'Rapid',
'Focus', 'Mondeo’, 'Octavia', 'B-Max'],
'car': ['Skoda', 'Skoda', 'Ford', 'Skoda', 'Ford’,
'Ford', 'Skoda’, 'Ford’]
}
df = pd.DataFrame(data)
print(df)](https://image.slidesharecdn.com/transformationtechniques-231013141418-47fd5cdf/85/Transformation-techniques-pptx-19-320.jpg)