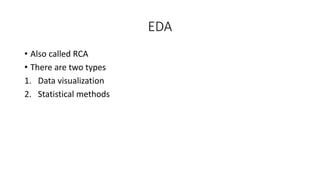
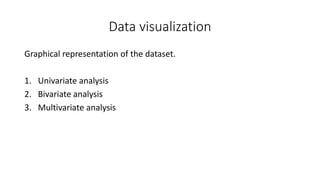
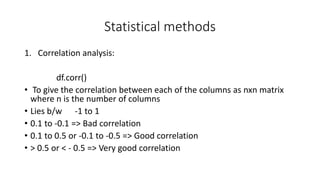
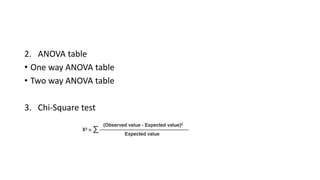
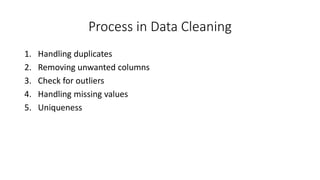
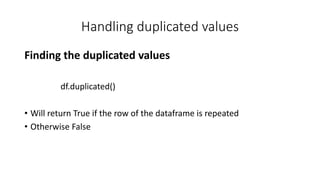
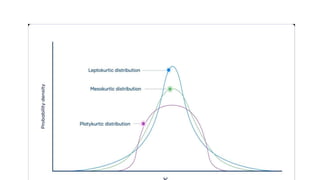
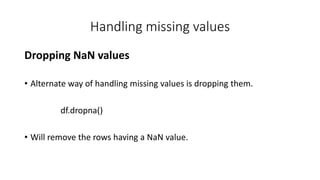
This document discusses various steps in the data cleaning process including handling duplicates, removing unwanted columns, checking for outliers, handling missing values, and ensuring uniqueness. It also provides examples of functions like df.duplicated(), df.drop(), df.isnull(), df.fillna(), and df.unique() to accomplish these cleaning tasks in Python. Additionally, it covers concepts like skewness, kurtosis, and EDA including data visualization techniques and statistical methods such as correlation analysis and ANOVA tables.


![Removing unwanted columns
• In our dataset there may be chances for columns present which is not
useful for analysis.
• We have to remove those columns for further analysis.
df.drop([“ColumnName”])](https://image.slidesharecdn.com/mlppt-230212142620-f9961bed/85/ml-ppt-pptx-5-320.jpg)
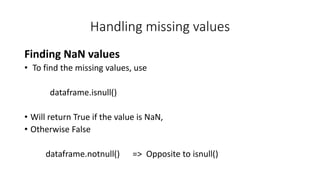
![Handling missing values
Filling missing values
• To fill the NaN values we can use
df.fillna()
• Inside the fillna() function we can add any numerical values or mean,
median, mode of the column.
df.fillna(df[“ColumnName” ].mean/median/mode)](https://image.slidesharecdn.com/mlppt-230212142620-f9961bed/85/ml-ppt-pptx-11-320.jpg)
![Uniqueness
To find the unique values present in the dataframe’s column
df[“ColumnName”].unique()
Will return the values that are unique in that column as an array.](https://image.slidesharecdn.com/mlppt-230212142620-f9961bed/85/ml-ppt-pptx-13-320.jpg)