Download as PDF, PPTX
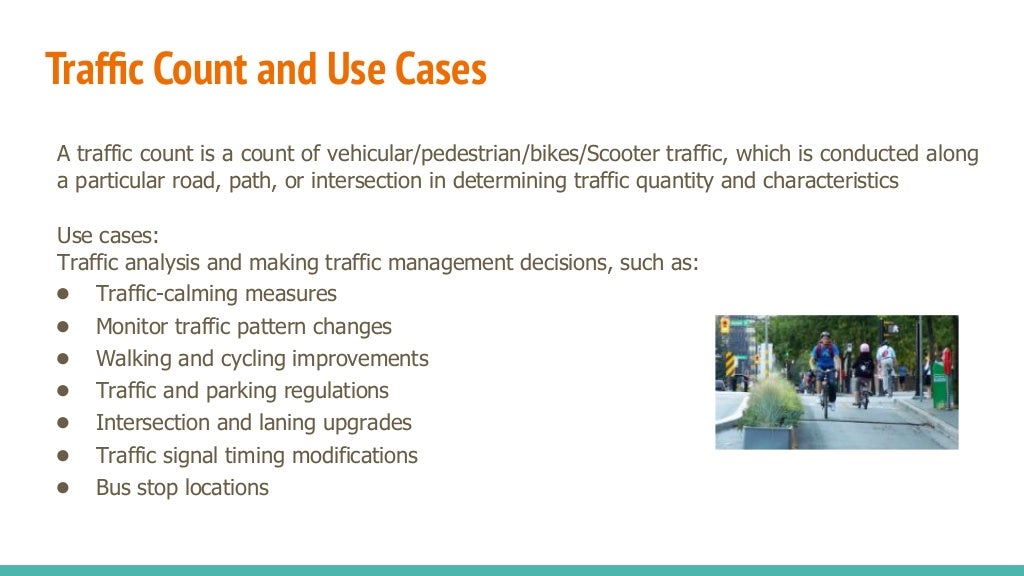
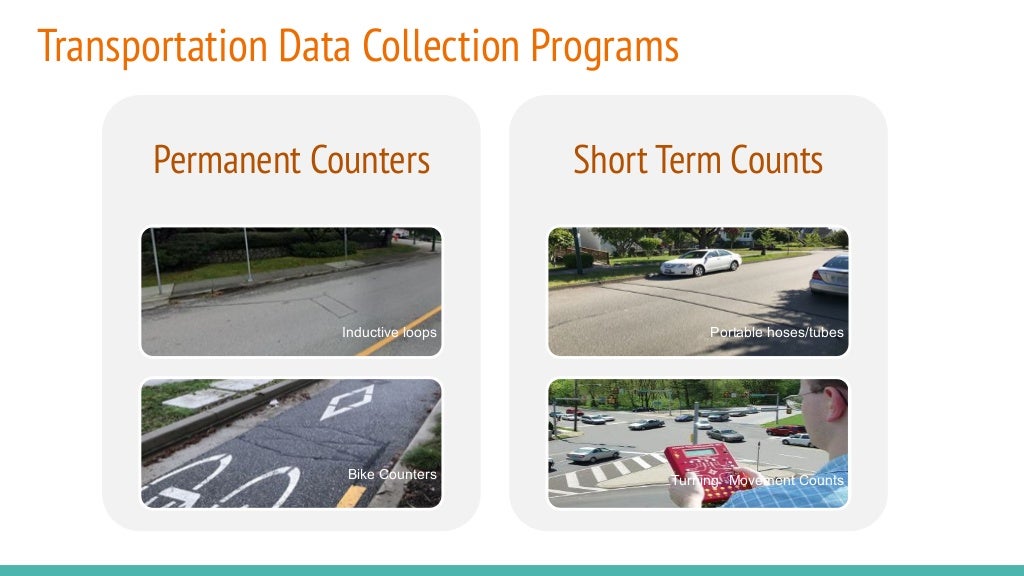
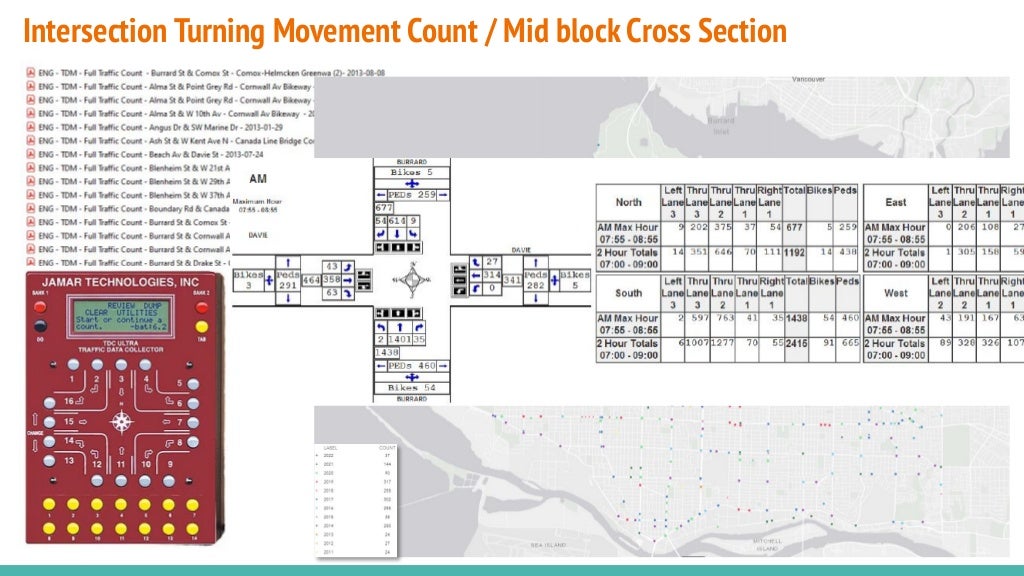
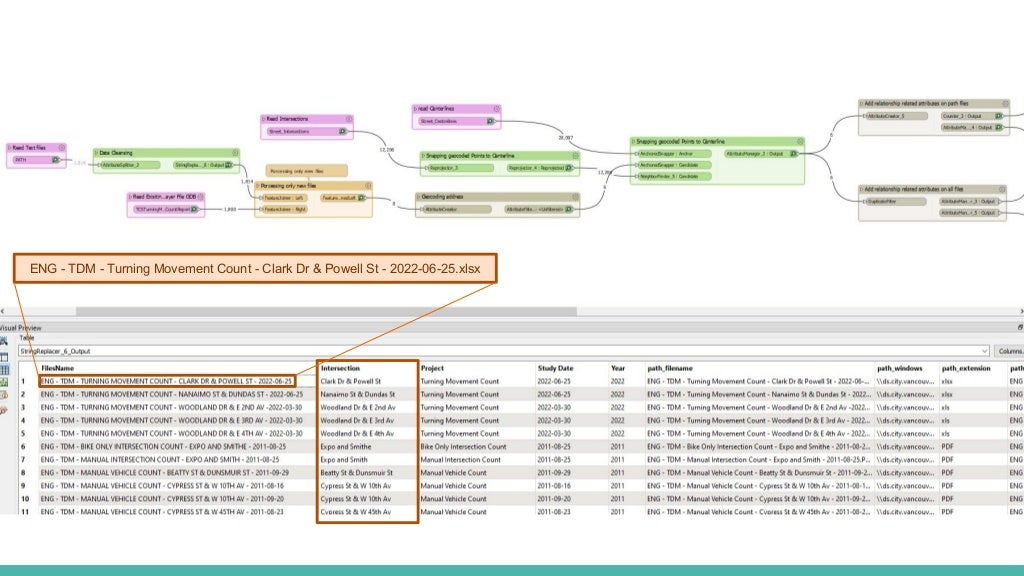
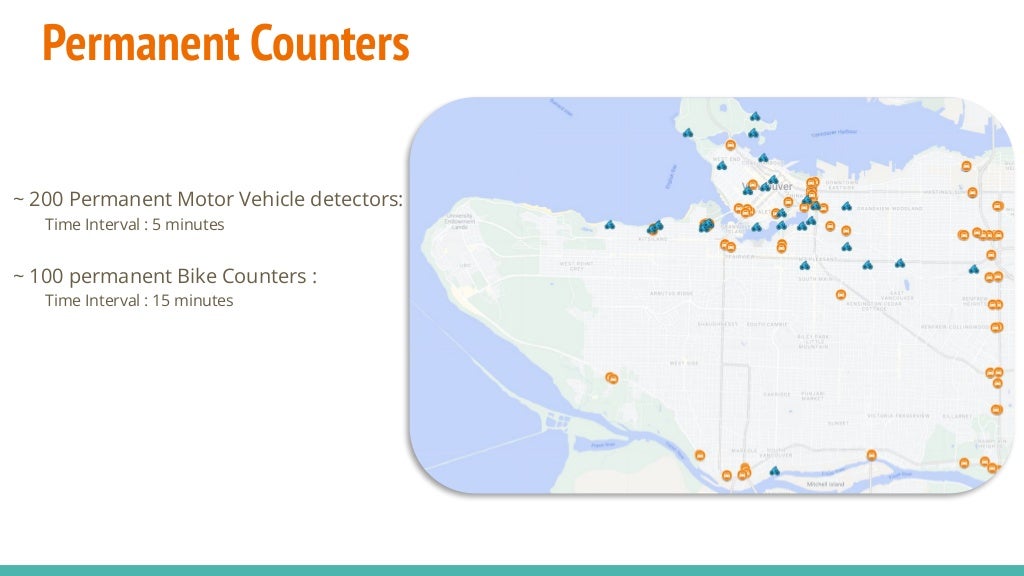
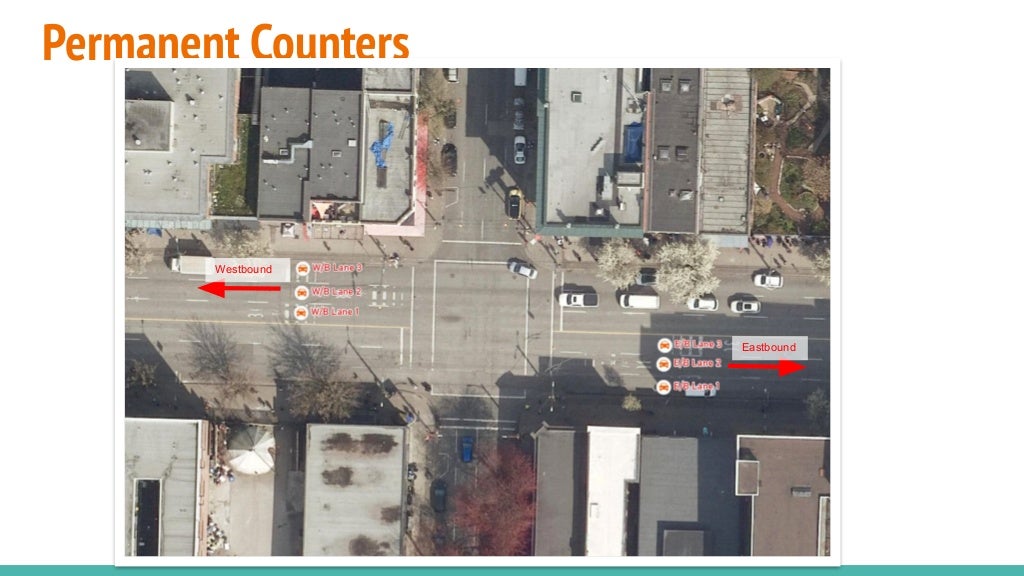
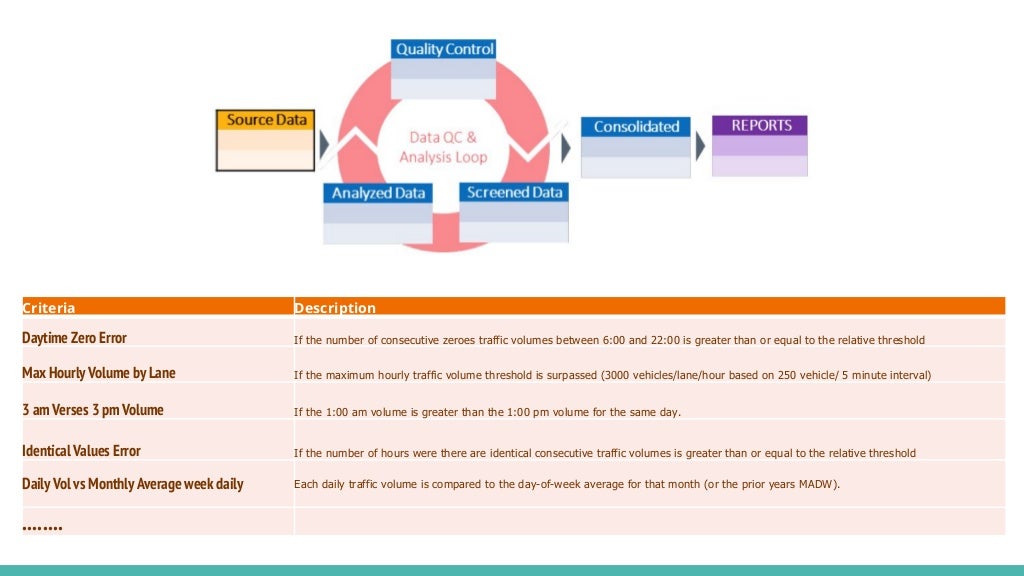
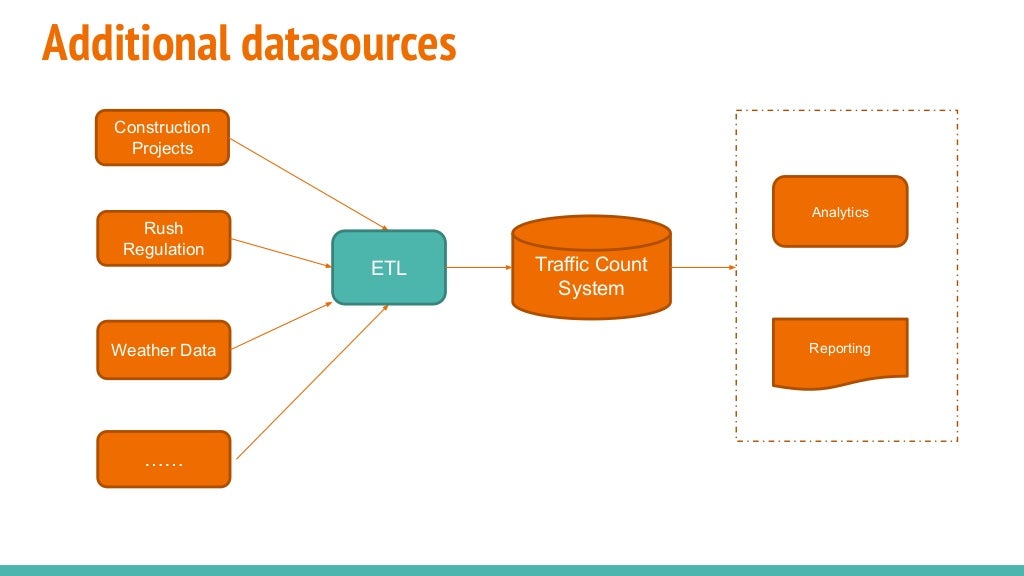
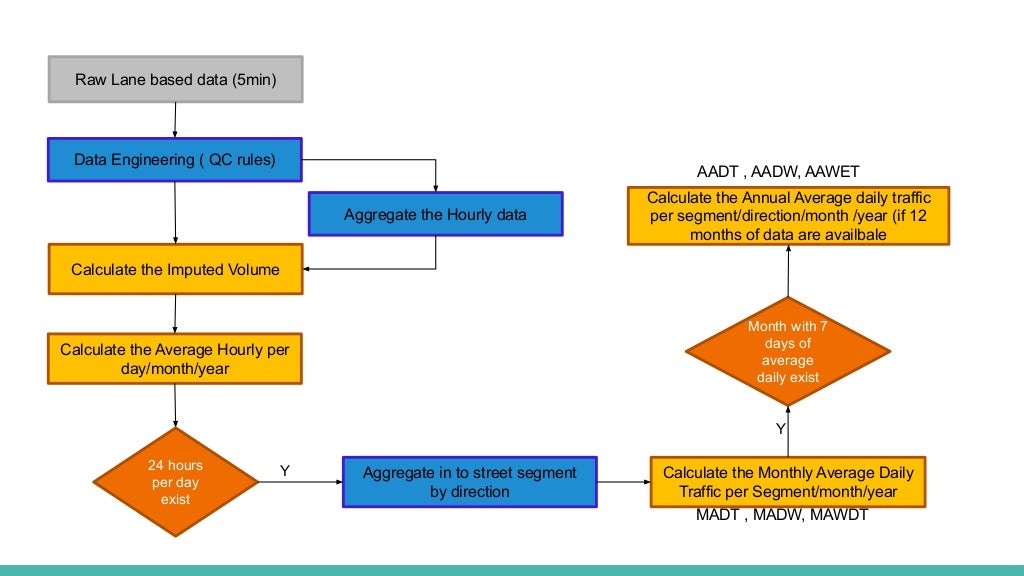
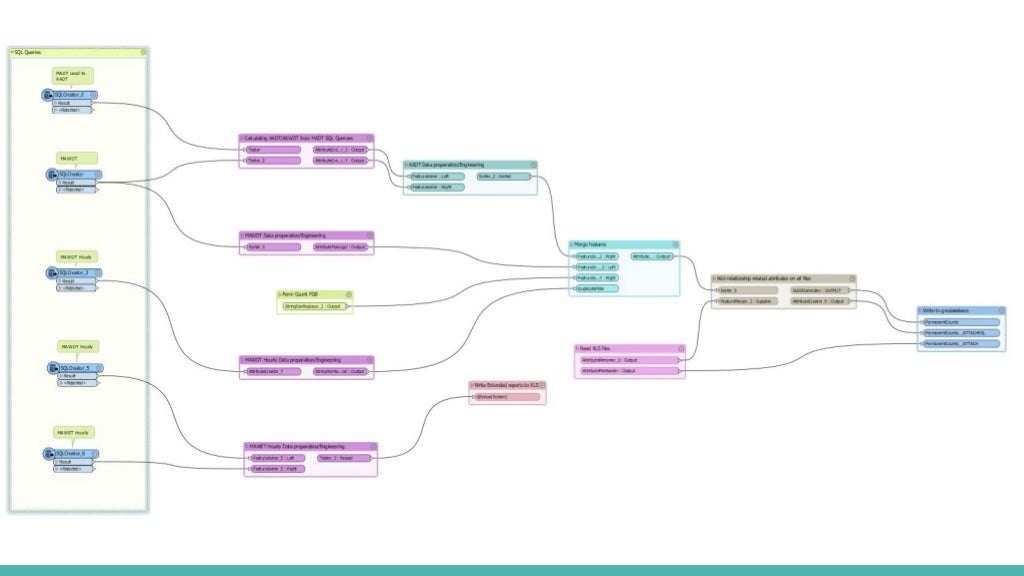
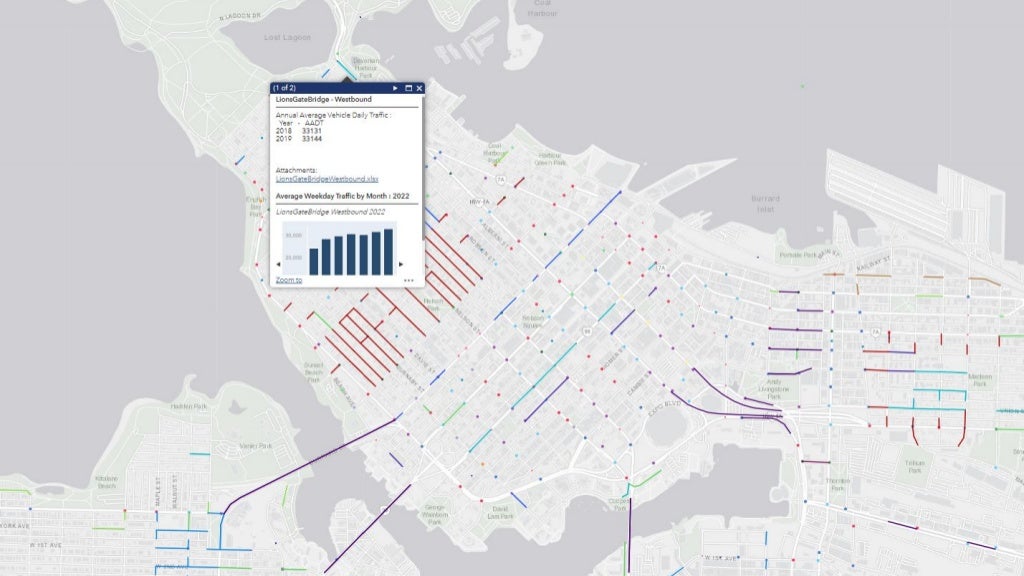

The document discusses traffic counts, detailing the methods and use cases for analyzing vehicular and pedestrian traffic to inform traffic management decisions. It includes descriptions of various data collection methods such as permanent counters and turning movement counts, alongside criteria for identifying errors in data. Additionally, it outlines processes for data processing and reporting, including calculating average daily traffic metrics.


