Toward a New Macro-Segregation? Decomposing Segregation within and between Metropolitan Cities and Suburbs

This document discusses emerging patterns of racial segregation at different geographic scales within US metropolitan areas from 1990 to 2010. It finds that while overall metropolitan segregation has declined, "macro-segregation" - segregation between cities and suburbs - has increased, offsetting declines in "micro-segregation" or segregation within places. The authors decompose a metropolitan segregation index into its micro and macro components and find that macro segregation accounts for about half the total segregation in the most segregated metro areas, and is increasing most rapidly for black populations. They conclude racial residential segregation is increasingly shaped by the cities and suburbs people live in, rather than just neighborhoods.

Recommended
Recommended
More Related Content
What's hot
What's hot (20)
Viewers also liked
Viewers also liked (20)
Similar to Toward a New Macro-Segregation? Decomposing Segregation within and between Metropolitan Cities and Suburbs
Similar to Toward a New Macro-Segregation? Decomposing Segregation within and between Metropolitan Cities and Suburbs (20)
More from Jonathan Dunnemann
More from Jonathan Dunnemann (20)
Recently uploaded
Recently uploaded (20)
Toward a New Macro-Segregation? Decomposing Segregation within and between Metropolitan Cities and Suburbs
- 1. American Sociological Review 2015, Vol. 80(4) 843–873 © American Sociological Association 2015 DOI:10.1177/0003122415588558 http://asr.sagepub.com The changing color line in the United States is perhaps best expressed in the geographic separation of racial groups—in shifting pat- terns of neighborhood residential segregation (Charles 2003). As we argue in this article, the optimism associated with recent declines in racial segregation in U.S. metropolitan areas may be dampened by new evidence of racial and ethnic geographic balkanization at other levels of geography (Fischer et al. 2004; Parisi, Lichter, and Taquino 2011, 2015). 588558ASRXXX10.1177/0003122415588558American Sociological ReviewLichter et al. 2015 a Cornell University b Mississippi State University Corresponding Author: Daniel T. Lichter, 249 MVR, Cornell University, Ithaca, NY 14850 E-mail: dtl28@cornell.edu Toward a New Macro- Segregation? Decomposing Segregation within and between Metropolitan Cities and Suburbs Daniel T. Lichter,a Domenico Parisi,b and Michael C. Taquinob Abstract This article documents a new macro-segregation, where the locus of racial differentiation resides increasingly in socio-spatial processes at the community or place level. The goal is to broaden the spatial lens for studying segregation, using decennial Census data on 222 metropolitan areas. Unlike previous neighborhood studies of racial change, we decompose metropolitan segregation into its within- and between-place components from 1990 to 2010. This is accomplished with the Theil index (H). Our decomposition of H reveals large post-1990 declines in metropolitan segregation. But, significantly, macro-segregation—the between-place component—has increased since 1990, offsetting declines in the within-place component. The macro component of segregation is also most pronounced and increasing most rapidly among blacks, accounting for roughly one-half of all metro segregation in the most segregated metropolitan areas of the United States. Macro-segregation is least evident among Asians, which suggests other members of these communities (i.e., middle-class or affluent ethnoburbs) have less resistance to Asians relocating there. These results on emerging patterns of macro-segregation are confirmed in fixed-effects models that control for unobserved heterogeneity across metropolitan areas. Unlike most previous studies focused on the uneven distribution of racial and ethnic groups across metropolitan neighborhoods, we show that racial residential segregation is increasingly shaped by the cities and suburban communities in which neighborhoods are embedded. Keywords segregation, diversity, suburban, neighborhood, race
- 2. 844 American Sociological Review 80(4) Indeed, many of the nation’s largest cities (e.g., Atlanta, Los Angeles, and San Antonio) now have majority-minority populations, reflecting the influx of blacks and new Asian and Hispanic immigrant populations over recent decades as well as accelerated white flight to the suburbs and beyond. For exam- ple, Detroit today is over 80 percent black— up from 62 percent in 1980. Over the same period, black-white neighborhood segrega- tion nevertheless declined from 67.5 to 62.1 (Logan and Stults 2011).1 In this case, declin- ing black-white segregation occurred in tan- dem with massive white depopulation. The white population of Detroit peaked at 1.5 million in 1950. In 2010, only about 76,000 whites remained in the city.2 Clearly, growing ethnoracial diversity and declining segregation in some big cities may have less to do with residential integration— and the breakdown of racial and ethnic boundaries—than with the slow population growth and even decline in the U.S. white population (Johnson and Lichter 2010; Lee and Hughes 2015; Parisi et al. 2015). White population growth and decline are occurring unevenly across the nation’s largest metro- politan areas (Logan and Zhang 2010). More- over, U.S. suburbs, especially those in close physical proximity to inner cities, have become more diverse at the same time that whites have moved even farther from the urban core into the fringe (i.e., the open coun- tryside, unincorporated housing develop- ments, and gated communities) (Hall and Lee 2010). The implication—one we test in this article—is that ethnoracial segregation has declined at some levels of geography (e.g., neighborhood-to-neighborhood racial segre- gation) (see Iceland, Sharp, and Timberlake 2013; Logan and Stults 2011), while perhaps increasing at other spatial scales (e.g., city-to- suburb or suburb-to-suburb differences). Trends in metropolitan segregation reflect both reinforcing and offsetting patterns of segregation at many different spatial scales (Fischer et al. 2004; Tienda and Fuentes 2014). The singular focus on declining big- city neighborhood segregation, as a measure of social distance or shifting racial bounda- ries, is arguably incomplete at best and mis- leading at worst. In this article, we reconsider the spatial scale of segregation, which typically empha- sizes the uneven distribution of racial and ethnic minorities across metropolitan neigh- borhoods (Massey and Denton 1993). We argue that metropolitan-wide segregation increasingly reflects socio-spatial processes at the community or place level.3 Segregation is not simply or only a product of neighborhood dynamics or local housing markets. Neighbor- hoods are embedded in specific places—cities and suburbs—that effectively include or exclude populations of color. Indeed, our study builds directly on recent studies informed by a new “political economy of place,” a theoretical perspective that recog- nizes that places of all sizes are political actors that compete with each other for economic development and growth, high-value commer- cial activity, and affluent taxpayers (Lichter, Parisi, and Taquino 2012; Massey, Rothwell, and Domina 2009; Rugh and Massey 2010). We argue here for a new macro-segregation, where the locus of racial differentiation within metropolitan areas resides increasingly at higher scales of geography (e.g., place-to- place differences and differences between central cities, suburban areas, and fringe areas) rather than in neighborhood-to-neighborhood differences (i.e., the micro component of seg- regation; see Lee et al. 2008; Reardon et al. 2008). Segregation may be taking on a new form at different spatial scales. Our fundamental objective is to identify the specific geographic sources of residential segregation between racial and ethnic minori- ties (i.e., African Americans, Hispanics, and Asians) and non-Hispanic whites in the larg- est metropolitan areas in the United States. First, we provide baseline estimates of the Theil index (H ) for all U.S. metropolitan areas using block-level decennial Census data for the 1990 to 2010 period.4 We also identify segregation levels in the 50 largest metropoli- tan areas for each decade as well as segrega- tion levels in the most segregated metropolitan
- 3. Lichter et al. 845 areas in 2010. Second, for each metropolitan area, H can then be additively decomposed into its micro (i.e., segregation within places) and macro (i.e., segregation between places— cities and suburbs) components. Our working hypothesis is that the macro (or place) com- ponent represents a large yet often unappreci- ated source of the overall segregation at the metropolitan level. Third, we estimate metro- politan fixed-effect models of H and its micro (micro-H) and macro (macro-H) compo- nents. This is accomplished by concatenating data for the three time periods (i.e., 1990, 2000, and 2010), 222 metropolitan areas (using fixed metropolitan boundaries), and the three racial group comparisons (i.e., black-white, Hispanic-white, and Asian- white) into a single file. We present alterna- tive theoretical frameworks that identify key social and demographic sources (e.g., minority- white income inequality, population size, and age composition) of macro- and micro- segregation, which have given rise to shifting overall patterns of metropolitan segregation since 1990. SEGREGATION IN THE NEW CENTURY The past several decades have ushered in a period of declining overall segregation levels in the nation’s largest metropolitan areas (Rugh and Massey 2013). Logan and Stults (2011), for example, show that black-white neighborhood segregation (measured with the index of dissimilarity) declined from an aver- age of 67 in 1970 to 59 in 2010 in the 50 largest U.S. metro areas. Moreover, isolation of blacks from nonblacks declined rapidly, but only because of greater exposure to other nonwhite minorities (Rugh and Massey 2013). Indeed, neighborhood exposure of blacks to whites hardly changed over the past two decades. In 1990, the average black per- son lived in a neighborhood that was 34 per- cent white; by 2010, this percentage increased only slightly to 35 percent (Logan and Stults 2011). The U.S. black population remains highly segregated from whites, particularly in comparison to U.S. Asian and Hispanic popu- lations. Black-white segregation in 2010 (59) exceeded Asian-white (41) and Hispanic- white (48) segregation levels, even as declines in segregation among Hispanics and Asians have seemingly come to a standstill (Logan and Stults 2011; Tienda and Fuentes 2014). Any optimism drawn from declines in black-white segregation also may be prema- ture if the geographic scale of segregation has changed over time, that is, if some cities and suburban communities have become more racially homogenous. In fact, the past decade has brought large increases in the shares of cities that now have majority-minority popu- lations (Lichter 2013; Tienda and Fuentes 2014). Declining segregation at the neighbor- hood level may be offset by growing segrega- tion between places or other levels of geography, such as the exurban fringe or small towns, which are typically excluded from metro-centric segregation studies. Like- wise, for Hispanics, stalled declines in segre- gation from whites may similarly reflect offsetting patterns of segregation within and between metropolitan places (Fischer et al. 2004; Tienda and Fuentes 2014). Hispanic segregation levels have remained steady, largely because any declines in neighborhood segregation have occurred at the same time that Hispanics have become more segregated in rapidly growing “new destinations” (Fis- cher and Tienda 2006; Hall 2013; Lichter et al. 2010). The past two decades also have ushered in the emergence and growth of new Asian ethnoburbs outside central cities (Li 1998), a pattern of minority resettlement that some scholars characterize as evidence of “resurgent ethnicity” (Wen, Lauderdale, and Kandula 2009). In short, resettlement patterns among the nation’s minority populations may have made some places more racially homogenous while others became more diverse, that is, the pro- duction of “global communities” (Logan and Zhang 2010). Whites may be increasingly concentrating in places that are overwhelm- ing white, especially at the metro fringe, while fleeing places like Detroit, Cleveland,
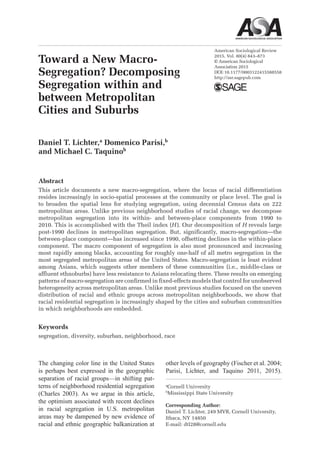
- 4. 846 American Sociological Review 80(4) and Houston (South, Crowder, and Pais 2011). Increasing white spatial integration with nonwhites may be occurring simultane- ously with greater spatial isolation among some affluent segments of the white popula- tion, who may be hunkering down in all- white neighborhoods, affluent gated communities, or unincorporated housing developments at the exurban fringe. Our sub- stantive point is straightforward: segregation between places (e.g., city-suburb or suburb- suburb) may be increasing, even as overall metro neighborhood segregation declines. Indeed, the 1990s and 2000s were decades of extraordinary change in the composition and distribution of racial and ethnic minori- ties in U.S. metropolitan neighborhoods (Logan and Zhang 2011). Some cities (e.g., Washington, DC) have experienced an inner- city economic revival, which has been accom- panied by the return of affluent younger whites to the city and the exodus of minority groups to poorer and more racially diverse neighborhoods. Most of the nation’s largest cities, however, have experienced white depopulation (from both natural decrease and white suburbanization and out-migration) (Johnson 2011; U.S. Census Bureau 2013b). At the same time, many minorities and new immigrants have resettled in suburban desti- nations—often in close proximity to the cen- tral city but also near typically poorer communities with older housing stocks and deteriorating physical infrastructures. Not surprisingly, the past decade brought new growth to these communities but also higher poverty rates, reflecting the influx of histori- cally disadvantaged minority populations (Howell and Timberlake 2014). Many suburban places now have majority- minority populations (Lichter 2013). They have become majority black, majority His- panic, or majorityAsian—a new racial homog- enization of places, even as many others have become much more racially diverse (Lee, Ice- land, and Farrell 2014; Logan and Zhang 2010). Detroit is the prototypical or iconic case but is only one of many examples across the urban size-of-place hierarchy. As a case in point, Dover, New Jersey, is illustrative of new intra-metro settlement patterns. Dover is a community of about 18,000 people near the Pennsylvania border; it is located about 30 miles west but within commuting distance of New York City, Newark, and the Poconos. Its population in 2010 was nearly 70 percent His- panic. In 1980, Hispanics accounted for only about 25 percent of Dover’s population of 14,681 (U.S. Census Bureau 1982). Outside San Jose (in Santa Clara County, south of San Francisco), Milpitas was home to a population of 66,700 in 2010, of which 62.2 percent were Asian. Under these circumstances, the usual imagery of the “Chocolate City, Vanilla Sub- urbs” now seems anachronistic (Farley et al. 1978). Neighborhood residential segregation has been shaped and reshaped over the past several decades by place-specific demographic and economic processes. A CONCEPTUAL FRAMEWORK FOR STUDYING MACRO- SEGREGATION These recent trends in U.S. settlement pat- terns raise important theoretical questions about the changing basis for segregation in today’s multiracial, multicultural metropoli- tan regions (Lichter 2013; Massey et al. 2009; Tienda and Fuentes 2014). Metropolitan-wide neighborhood segregation has within- and between-area components, which we call micro-segregation and macro-segregation (see Lee et al. 2008; Reardon et al. 2008). Macro-segregation, as conceptualized and measured here, explicitly acknowledges that political units—places—are key actors in the process of neighborhood ethnoracial change and segregation.5 Heuristically, this is illustrated in Figure 1 with a straightforward example. Each panel shows the same hypothetical metropolitan area but with very different shares of blacks in the neighborhoods located within each of four suburban communities.6 The top panel shows the low macro-segregation case; the bottom panel illustrates high macro-segregation. In
- 5. Lichter et al. 847 the low macro-segregation metropolitan area, a single racially diverse neighborhood is located in each suburban community. In the high macro-segregation case, the four “black neighborhoods” are located in just two subur- ban communities (suburbs C and D); the other suburbs are predominately nonblack (suburbs A and B). In this example, metro-wide segre- gation is the same, but the between-place component—the macro-segregation compo- nent—is clearly larger in one than the other. Our guiding theoretical assumption is that places—cities, suburban communities, and small communities in the exurbs—rather than neighborhoods are key political and legal units that engage in practices that either include or exclude specific populations (i.e., black or white, rich or poor). Simply put, cit- ies and suburban communities represent legal, political, and economic containers that hold U.S. neighborhoods. Massey (1996:405) argues that ongoing ecological processes in Figure 1. Stylized Illustration of Low and High Macro-Segregation Metropolitan Areas
- 6. 848 American Sociological Review 80(4) metropolitan areas have created “the potential for a new geopolitical order capable of com- pounding the benefits and liabilities of class by superimposing administrative segmenta- tion on economic segregation.” For example, intra-urban racial differences in settlement patterns reveal place-to-place differences in zoning restrictions, public housing, lending institutions and foreclosures, and racial and political climate (Massey et al. 2009; Rugh and Massey 2010). Class-based exclusionary policies at the community level sort people of different racial and ethnic backgrounds into different places and neighborhoods (Massey et al. 2009). Inter-community competition shapes overall metropolitan neighborhood segregation. Local political and economic elites compete for affluent taxpayers and high-value commercial activities to separate their communities from competitors. These place-oriented processes differentiate housing markets that, in turn, influence individual residential preferences and opportunities. Our conceptual framework emphasizes a new political economy of places (Logan and Molotch 1990), one in which local municipali- ties shape patterns of neighborhood segrega- tion within the community (micro-segregation) but also separate themselves through their political and economic actions from other places within the metropolitan region (macro- segregation). A place-based perspective is largely compatible with three alternative (but complementary) theoretical perspectives that typically frame previous studies of neighbor- hood racial segregation: place stratification models, spatial assimilation theory, and eco- logical models (Iceland et al. 2013; Kim and White 2010; Lichter et al. 2010). The place stratification model of neigh- borhood racial segregation is compatible with a place-based perspective. The place stratifi- cation model assumes that racial minorities and immigrants are sorted into segregated neighborhoods and excluded from good neighborhoods, even if they can afford to live anywhere. Neighborhood boundaries are reinforced by shared culture, language, class, religion, and local institutions (Kim and White 2010), and metropolitan neighbor- hoods are stratified in a status hierarchy. This hierarchy persists through ongoing demo- graphic and economic processes, including racial steering by lenders and real estate agents, white flight in response to minority population change, housing discrimination, and racial/immigrant family and friendship networks that share information and provide social support for newcomers. White flight from communities also accel- erates the racial transformation of cities and suburbs, while arguably exacerbating the macro component of racial segregation across a metropolitan region. Minority growth in older suburban communities in close proxim- ity to central cities is an illustrative case in point. In response to white flight, communi- ties undergoing rapid racial change, eroding tax bases, and deteriorating local infrastruc- tures and school systems sometimes take political action that accelerates racial change. As an example, the shooting of an unarmed black teenager by local police in Ferguson, Missouri, has become symptomatic of racial divisions and conflict in rapidly changing suburban communities. Between 1990 and 2010, the black composition of Ferguson increased from 25.1 to 67.4 percent. The size of the white population dropped from 16,454 to 6,206 over the same period (U.S. Census Bureau 2014). As whites left the community, the city council responded by accommodating the construction of new low- and mixed- income housing apartments; at the same time, outside investment firms bought up housing from underwater mortgagees and rented them to low-income minorities (Goldstein 2014). Ferguson became recognized as a “black sub- urb” that could be distinguished from other nearby suburban communities that made dif- ferent zoning and administrative decisions. In other communities, whites’ aversion to minority growth is expressed through land use regulations that effectively control the local housing market. This includes low-density only zoning, restrictions on rentals and multi-family units, building permit caps or moratoriums, racially selective annexation or
- 7. Lichter et al. 849 incorporation, and other practices that acceler- ate metropolitan-wide political and economic fragmentation (Lichter et al. 2007; Rothwell 2011; Rothwell and Massey 2009). Pendall (2000) finds that communities engaging in these practices have a low presence of minor- ity groups, such as blacks and Hispanics, that represent a threat to housing values and the stability of communities and neighborhoods. The place stratification model is comple- mentary rather than competitive with spatial assimilation theory, which argues that resi- dential integration reflects minority and immigrant incorporation on other economic and political indicators, such as income and education. Indeed, social and spatial mobility go hand in hand. As minorities are incorpo- rated into the economic mainstream, they are able to move up and out of minority commu- nities and neighborhoods or enclaves into integrated (and usually more affluent) neigh- borhoods. Relocating from the city to subur- ban neighborhoods represents achievement of the American Dream; racial and economic equality promotes greater residential integra- tion with middle-class whites. Thus, we expect improvements in minorities’ socioeco- nomic conditions to contribute to declines in metropolitan residential segregation. How- ever, previous studies also show that chang- ing black-white inequality is not strongly linked to black-white segregation (Iceland and Wilkes 2006; Lichter et al. 2012); com- pared with Hispanics and Asians, more black income is less likely to “whiten.” Race often trumps income. We therefore expect that declining ine- quality at the metropolitan level will play out unevenly across racial and ethnic groups and will be reflected in different segregation pat- terns across communities (macro-segregation) and in shifting neighborhood segregation within places (micro-segregation). Specifi- cally, our working assumption is that racial income inequality exacerbates competition between places as well as between neighbor- hoods within places for racial groups distrib- uted unevenly across the income hierarchy. This means neighborhoods are distinguished by their racial composition, as are cities and communities (Krysan and Bader 2009). Finally, the ecological model suggests that intergroup relations—and neighborhood seg- regation—are also influenced by opportuni- ties and constraints imposed by the larger metropolitan environment (Kim and White 2010). Older, larger, and more economically diverse metropolitan areas in the industrial North typically have higher segregation rates than do smaller and newly emerging metro- politan areas (Timberlake and Iceland 2007). Fast-growing but smaller metropolitan areas in the South are typically less segregated than manufacturing regions in the Rust Belt (Ice- land et al. 2013). The evolution of large met- ropolitan areas comes with greater spatial and racial differentiation. The demographic processes underlying ecological models presumably also operate at the place level. Viewed from a political econ- omy of place perspective, the cities and suburban communities within large and eco- nomically diverse metropolitan regions face substantially more competition for affluent residents and commercial activity than do their counterparts in smaller, more homoge- nous, emerging metropolitan regions. The substantive implication is clear: metropolitan segregation will consist of larger shares of macro-segregation in older, heavily popu- lated, industrial metropolitan areas. That is, place-to-place differentiation will be greater in these metropolitan areas, including greater differentiation by race and ethnicity (i.e., macro-segregation). In fact, previous studies show that segregation varies with the func- tional specialization of metropolitan areas (Farley and Frey 1994; Logan, Stults, and Farley 2004). Residential segregation is typi- cally higher in manufacturing-dependent met- ropolitan areas but lower in areas with a large government workforce. Zoning and other land use regulations steer manufacturing firms (and their employees) unevenly across places throughout metropolitan regions, which undoubtedly exacerbates place-to- place racial segregation—the macro compo- nent of segregation.
- 8. 850 American Sociological Review 80(4) THE EMPIRICS OF PARTITIONING SEGREGATION The data requirements for accurately identify- ing changing patterns of metropolitan segre- gation—including its macro and micro components—are large and often complex but not insurmountable in today’s age of big data, high-speed computing, and new GIS software. Scholars are no longer restricted to past con- ventions, such as focusing on a limited set of large metropolitan areas (or cities) or census tracts as basic accounting units from which segregation indices are calculated. For example, Massey and colleagues (2009) expanded the spatial lens of segrega- tion by considering black-white segregation across states, counties, cities, and tracts. They found large declines in black-white segrega- tion at the neighborhood or tract level since 1970 but virtually no change in black-white segregation across states, counties, and cities. The implication is that the macro share of segregation has increased over time. Massey and colleagues (2009) neither decomposed overall segregation into components nor did they examine segregation of other minority or immigrant populations. Their study neverthe- less raises important questions about whether segregating processes at different levels of geography are interconnected, that is, whether overall segregation trends represent a balanc- ing act among demographic and economic processes and competing political interests across the entire metropolitan landscape. Whether continuing suburbanization over the past 30 years is related to widespread declines in black segregation has been unclear. Fischer (2008:480) argues that “[a]lthough calculating indexes separately for each level of geography does a good job of illustrating differences in segregation across levels of geography, it does not reveal how much each element contributes to metropolitan-wide seg- regation.” She therefore used Theil’s (1972) entropy index (H) to partition black-nonblack segregation for 248 metropolitan areas in 2000 into within-city and within-suburb components (i.e., the micro component) and a between-city-and-suburban component (i.e., macro). Although Fischer (2008) considered suburban areas in the aggregate (rather than each suburban place separately), her results nevertheless effectively highlight the sources of segregation at two different levels of geog- raphy. Macro-segregation (i.e., the between- city-and-suburb component) accounted for a growing share of overall metro segregation, as did the within-suburb component (i.e., a grow- ing micro component was offset by a declin- ing within-city component). Although the macro component accounted for only about 20 percent of overall black-nonblack metropoli- tan segregation, this study did not partition the between-suburban-place component (see Far- rell 2008), which we argue here represents a growing share of all metropolitan-area segre- gation (because different suburbs attract or exclude different racial and minority populations). In fact, in one of the most comprehensive segregation studies at the time, Fischer and colleagues (2004) measured segregation for the metropolitan United States using the Theil index, which they additively decomposed into contributions of regions, metropolitan, central city–suburban, places, and tract segre- gation from 1960 to 2000. For blacks, the city-suburb barrier became relatively less important as suburbanization accelerated over the past several decades, but differences among suburbs sharpened over the study period (i.e., the macro-segregation compo- nent). Unlike the case for black-nonblack segregation, however, overall U.S. segrega- tion of Hispanics (from non-Hispanics) was largely unchanged between 1970 and 2000. The authors point to two countervailing trends: (1) declines in between-neighborhood segregation (i.e., tract-within-place) and (2) increases in the between-region, between- metropolitan area, and between-place compo- nents of segregation, which can be attributed to the rapid growth and spatial dispersion of Hispanics. Similarly, Parisi and colleagues (2011) calculated, for the first time, a single U.S. summary measure of black-white
- 9. Lichter et al. 851 segregation in 2000. They reported a national black-white Theil index (H) in 2000 of 61.5, of which micro-segregation (i.e., neighbor- hood segregation) and macro-segregation (i.e., the between-place component) repre- sented 52 and 48 percent, respectively, of H. Macro-segregation represents a large and sometimes unacknowledged share of black- white differences in residence patterns. Parisi and colleagues (2011), however, did not iden- tify the macro component for other racial and ethnic comparisons (i.e., Asian-white or Hispanic-white). If nothing else, results from previous multi- scale segregation studies suggest it may be premature to herald recent declines in neigh- borhood segregation—based on metro census tracts alone—as clear evidence of changing social distance or the breakdown of racial boundaries between blacks and whites or other racial and ethnic groups. Previous stud- ies based on data from 2000 or earlier provide a clear message: evidence of minority incor- poration or spatial assimilation must account for other levels of geography that now extend beyond the traditional focus on neighborhood segregation for metropolitan areas as a whole. Indeed, macro-segregation is on the ascend- ency (Fischer et al. 2004; Parisi et al. 2011). CURRENT STUDY The new emphasis in recent segregation stud- ies on the “political economy of places” does not obviate a metropolitan neighborhood per- spective but instead helps us establish that the political and economic activities of places matter. In this article, we focus on U.S. metro- politan areas, but unlike previous studies, our place-based approach decomposes metropoli- tan segregation into its micro and macro com- ponents (i.e., the within- and between-place components of segregation) over the most recent 20-year period. We argue that emerging patterns of segregation call for much greater sensitivity to how places and higher levels of geography have reshaped overall patterns of metropolitan-area segregation since 1990. Identifying different geographic sources of residential segregation is an important goal in light of the continuing centrifugal drift of the white population into suburbs and beyond and the fact that small (about 30 percent) and declining shares of the U.S. population (espe- cially the white population) now live in the largest central cities in the United States. An accurate assessment of changing patterns of metropolitan segregation should accommo- date changing residence patterns that are occurring at different levels of geography (Farrell 2008; Lee et al. 2008; Massey et al. 2009). This is our goal here. Our definitions of micro- and macro- segregation should not be confused with those used in recent metro studies of “segregation profiles.” In a series of innovative articles, Reardon, Lee, and their colleagues (see Lee et al. 2008; Reardon et al. 2008, 2009) refer to micro- and macro-segregation as neighbor- hood-to-neighborhood differences within “egocentric local environments.” Although these studies of segregation in the 1990s high- light the importance of macro-segregation, they represent a critique of census tracts and their arbitrary boundaries.7 Unlike our study, their goal did not include establishing the importance of cities and communities, espe- cially as they shape and reshape neighborhood segregation across the metropolis. Our place- based approach, as an alternative for the 2000s, reflects key political boundaries (i.e., cities and communities), conventional and readily available census geography, and con- venient and theoretically relevant areal units (e.g., places as arenas for political action and as growth machines) instead of rather arbi- trary spatial units (based on linear distance from specific blocks), which may have differ- ent meanings in places of much different sizes and different man-made and physical topogra- phies (e.g., highway location, rivers, or rail- ways). Our interest here in places is motivated by our conceptual concerns about the role of political or administrative units—cities and suburbs—as segregation-generating actors across metropolitan areas. To be sure, the idea of a “political economy of place” is not new (e.g., Logan and Molotch 1990); what is new here is our interest in establishing that the political dimensions of places have supplanted
- 10. 852 American Sociological Review 80(4) ecological models as a primary foci of chang- ing U.S. patterns of segregation over the past decade (Lichter et al. 2012; Massey et al. 2009). We cannot fully understand contempo- rary patterns of metropolitan segregation unless we recognize that “places matter,” especially as the United States moves toward a multiracial, majority-minority society. Our study makes several specific contribu- tions that build on previous studies of multi- scale segregation. First, we update previous multi-scale studies of neighborhood segrega- tion (i.e., Farrell 2008; Fischer et al. 2004; Fischer 2008; Parisi et al. 2011) based on 2000 or earlier data. The 2000s were a period of shifting minority population redistribution (e.g., suburbanization), and we take advan- tage of the release of the 2010 decennial Census to chart changes over the past two decades. Second, most previous multi-scale studies of segregation focus on black-white or black-nonblack segregation but generally ignore segregation among the fastest growing U.S. minority populations—Asians and His- panics—which have redefined U.S. eth- noburbs and new immigrant destinations (Tienda and Fuentes 2014). Finally, previous studies of multi-scale segregation have been useful but highly descriptive rather than ana- lytic. We have learned about changing shares of macro-segregation, variously defined (Fis- cher et al. 2004; Parisi et al. 2011), but our understanding of the specific correlates of recent patterns of macro- and micro-segregation is limited. Our metropolitan fixed-effects mod- els of H, macro-H, and micro-H address this research lacunae. METHODS Data and Geographic Units The data required to disaggregate the micro and macro components of residential segrega- tion across metropolitan areas come from the complete count or 100 percent items of the 1990, 2000, and 2010 decennial Census sum- mary files. The 2010 Census did not include a long-form questionnaire, so our multivariate analyses take advantage of the 2008 to 2012 American Community Survey to measure key independent variables that are compatible with earlier censuses. We consider segregation for U.S. metropolitan areas as defined by the Cen- sus Bureau in 2013 and restrict our sample to metropolitan areas that have populations of at least 1,000 for each minority group (self- identified single-race blacks, Hispanics, and Asians, not including native Hawaiians and other Pacific Islanders) in all three decades. This results in 222 metropolitan areas. Within each metropolitan area, we identi- fied the macro and micro geographic units. The macro component includes two parts: (1) the uneven distribution of racial groups among central cities, suburban areas (in the aggregate), and fringe or nonplace areas and (2) the uneven distribution of racial groups between specific suburban places. The micro component includes the uneven distribution of racial groups (1) within central cities, (2) within suburban places, and (3) within the exurban fringe (i.e., metropolitan areas that are neither central cities nor suburban places).8 For our purposes, census blocks are ideal accounting units to examine the micro compo- nent of residential segregation (Lichter et al. 2010; Reardon et al. 2008). Blocks can be nested perfectly within geographies at higher spatial scales, even in the case of small subur- ban places that are sometimes inappropriately circumscribed by a single census tract that does not adhere to a community’s legal boundaries. Moreover, blocks are the smallest geographic unit for which complete count data are made available by the U.S. Census Bureau. Thus, our estimates of segregation are not subject to sam- pling variability. Unlike census tracts, blocks do not delineate neighborhoods but represent spatial containers that provide a more granular picture of the spatial distributions of racial and ethnic groups (see Lichter et al. 2010). Measuring Multi-Scale Segregation The index of dissimilarity (D) is the work- horse of most segregation studies. But a com- mon criticism is that it is inherently aspatial; metropolitan areas could have the same D over time yet have very different
- 11. Lichter et al. 853 spatial distributions of majority and minority populations (Östh, Clark, and Malmberg 2015). The Theil index (H) circumvents this scale problem. H has a singular advantage over other conventional measures of segrega- tion: it can be additively decomposed into contributions from different geographic lev- els (Fischer et al. 2004; Reardon and O’Sullivan 2004). Here, for each metropoli- tan area, we use H to capture (1) overall seg- regation between non-Hispanic blacks and non-Hispanic whites (B-W), between Hispan- ics and non-Hispanic whites (H-W), and between Asians and non-Hispanic whites (A-W); and (2) the contributions of micro and macro geographic differences (defined ear- lier) to overall segregation. H measures how much less diverse indi- viduals in a geographic subunit are, on aver- age, than the total population in which the subunit is located (Fischer 2008; Reardon and O’Sullivan 2004). If the geographic subunits are census blocks within all places in a spe- cific metropolitan area, we can calculate how diverse black and white populations within blocks are compared to the metro-wide diver- sity of the total black and white populations. In our case, H would approach zero if all blocks had the same black-white makeup as the overall metropolitan area. Values approach 100 if each block lacks racial diversity, that is, each block consists of single racial groups (e.g., either blacks or whites). Because census blocks are nested within higher scales of geography (e.g., places), we can estimate the specific contributions of the macro and micro components to overall metropolitan area seg- regation (H). Formally, H is based on the entropy con- cept of diversity (Parisi et al. 2015; Theil 1972; Wong 2003). With only two groups (e.g., blacks and whites), the diversity score based on entropy (E) is calculated as E p p p p i i i i = ⎛ ⎝ ⎜ ⎞ ⎠ ⎟ + −( ) − ⎛ ⎝ ⎜ ⎞ ⎠ ⎟ln ln , 1 1 1 1 where pi is the proportion of blacks. E reaches a maximum value of .69 [log (K = 2)] or 69 when both groups are equally represented in the population, and a minimum value of .00 when only one group is present. With a met- ropolitan area as the total geography (M) and census blocks as subunits (B), the total H for the metropolitan area can be more formally represented as H N E N E EB M M M b M b b B ⊂ = = −( )∑ 1 1 , where NM is the total population of a metropoli- tan area, and Nb is the total population of a block. EM is the overall entropy of a metropoli- tan area, and Eb is the entropy of a block. For each metropolitan area, H can be formally decomposed into its micro and macro compo- nents (see Fischer et al. 2004). In our case, the entropy decomposition reveals the relative importance of the within-city, within-suburb, and within-fringe components (which sum to the micro-segregation component). The between-city-suburb-fringe and suburb-to- suburb components sum to the macro- segregation component. Together, micro- and macro-segregation sum to the overall H for each metropolitan area, an analytic distinction that cannot be made using conventional segre- gation indices (e.g., D or exposure measures). Modeling Approach Unlike previous multi-scale studies of segre- gation (Fischer et al. 2004; Parisi et al. 2011), we model metropolitan-to-metropolitan vari- ation in H, macro-H, and micro-H. Specifi- cally, we report results from metropolitan fixed-effects models. These models stack data for each combination of residential pairs (i.e., B-W, H-W, and A-W), time period (i.e., 1990, 2000, and 2010), and metro area (n = 222). Our fixed-effects models serve a specific pur- pose. They control for unobserved, unchang- ing metro characteristics over the 1990 to 2010 period. This is important because metro- politan areas likely differ on a number of unchanging characteristics (e.g., regional location, state laws or municipal regulations, and cultural attitudes) that are correlated with
- 12. 854 American Sociological Review 80(4) the observed indicators in our models and H. Failure to acknowledge these unobserved characteristics could introduce omitted vari- able bias. Fixed-effects models factor in unobserved characteristics that may account for the associations between the various inde- pendent variables and segregation.9 Because we use period-specific observations for each metropolitan area in 1990, 2000, and 2010, our metropolitan-year data also include two dummies for the three years of observation (N – 1) to control for time fixed effects. Table 1 provides descriptive statistics for the independent variables. These variables are drawn from previous studies designed to measure key dimensions of the spatial assimi- lation, place stratification, and ecological models of ethnoracial segregation. For exam- ple, the spatial assimilation model suggests that residential integration reflects declining racial and ethnic inequality. Because racial segregation is a product, at least in part, of income disparities, our models include ratios of minority-to-white median income for each of the 1,998 possible combinations of racial pairs (i.e., B-W, H-W, and A-W) by time period (i.e., 1990, 2000, and 2010) and metro area (for a similar modeling approach, see Kim and White 2010). From the place stratification model, we expect that segregation reflects community and neighborhood processes that emerge from intergroup conflict and racial antagonism. We measure minority composition by percent Table 1. Descriptive Statistics 1990 2000 2010 Mean SD Mean SD Mean SD Spatial Assimilation Theory Ratio Minority/White Median HH Income .65 .11 .69 .10 .69 .13 Ratio Black/White Median HH Income .63 .12 .66 .12 .64 .16 Ratio Hispanic/White Median HH Income .77 .12 .75 .10 .72 .11 Ratio Asian/White Median HH Income .92 .24 .98 .22 1.04 .21 Place Stratification Theory Political Fragmentation .80 .48 .79 .48 .85 .52 Minority Composition Percent Black 10.69 9.55 10.69 9.55 11.50 10.04 Percent Hispanic 7.58 11.63 10.70 13.80 14.22 15.43 Percent Asian 2.00 2.26 2.59 2.80 3.46 3.44 Ecological Context MSA population 837,928 1,657,449 965,976 1,854,024 1,070,035 1,974,802 Percent Foreign-Born 3.28 3.94 7.84 6.87 9.54 7.13 Percent Elderly 12.03 3.18 12.16 3.03 12.69 2.72 Functional Specialization Percent Manufacturing 16.54 6.64 13.46 5.84 10.55 4.40 Percent Military Population 1.93 4.85 1.25 3.42 1.01 2.57 Percent Government Employees 5.46 3.42 5.35 2.96 5.46 2.92
- 13. Lichter et al. 855 black, percent Hispanic, and percent Asian. We also consider the percent foreign-born; growing shares of immigrants will exacerbate minority segregation from whites (Iceland and Scopilliti 2008). Like previous segrega- tion studies (Lichter et al. 2010; Logan et al. 2004), these measures draw from Blalock’s (1967) theory of “minority group threat,” which posits that increasing shares of minori- ties represent a threat to whites (i.e., fear of crime, occupational competition, and declin- ing housing values) that will express itself in higher white-minority segregation (H). Com- munities will mobilize to exclude minorities when residents perceive a threat; positive racial attitudes are a negative function of minority population shares (Taylor 1998). We also measure metropolitan political fragmen- tation, which we define as the number of places in the metro area per 1,000 population (see Crowder, Pais, and South 2012). Blacks and other minorities living in highly frag- mented metropolitan areas are at greatest risk of land use zoning and other exclusionary tactics that exacerbate place-to-place segregation. We also consider conventional ecological variables (Lichter et al. 2007; Logan et al. 2004). Logged population size, because of its links to metropolis age and spatial differentia- tion, should be positively associated with segregation. Older, aging communities, as measured by the percent age 65 and older, should also be associated with more segrega- tion. Our models also identify the functional specialization of metropolitan areas. Specifi- cally, we measure the percent of workers employed in the manufacturing sector, in the military, and in government. Based on previ- ous research, we expect manufacturing will be positively associated with segregation as a proxy for old manufacturing cities. Manufac- turing is also distributed unevenly across the metropolitan landscape, which should influ- ence community and neighborhood segrega- tion. Employment in the military or government (which are arguably more race- neutral institutions) should be associated with less metropolitan segregation. RESULTS Macro- and Micro-Segregation We begin in Table 2 by providing the segrega- tion indices (H) for 222 metro areas, each with 1,000 whites, blacks, Hispanics, and Asians. Each metro area is decomposed into its macro and micro components (and into the subcomponents within them). The H’s reported in column 1 (Table 2) mostly con- firm results of previous metro-level segrega- tion studies (Logan and Stults 2011; Rugh and Massey 2013). That is, black-white seg- regation is exceptional (H = 41.9 in 2010) in comparison to the H indices for the Asian- white (30.4) and Hispanic-white (30.8) pairs. Nevertheless, black-white segregation declined significantly from 1990 to 2010, from 49.7 to 41.9, whereas Asian-white and Hispanic-white segregation indices changed very little over the past 20 years. The innovative feature of our study, how- ever, is the decomposition of H into its macro and micro components (i.e., macro-H and micro-H, respectively). Results for black- white segregation in Table 2 indicate that the macro component represented a compara- tively small but growing share of the H over time (from 24.9 to 29.7 percent), while the micro component declined in magnitude over this 20-year period. Still, our results indicate that, overall, micro-H represented a compara- tively large share of overall black-white seg- regation in the metropolitan United States. The same pattern of macro and micro change was also apparent for Hispanic-white and Asian-white segregation. Recent overall declines in U.S. segregation are clearly being driven by declines in micro-segregation within metropolitan areas rather than declines in segregation at higher levels of geography. But, as we report below, this general pattern is much less apparent for larger and more racially segregated metropolitan areas, where most of the metro population lives. Our analyses also indicate that black-white segregation within central cities represents the largest component of micro-segregation in metropolitan areas (34.0 percent in 2010).
- 15. Lichter et al. 857 While segregation within central cities declined from 1990 to 2010 (from 39.2 to 34.0), segregation within suburban places increased (17.1 to 19.5) between blacks and whites. This same pattern of within–central city decline and within–suburban place growth in micro-H was also apparent in Hispanic-white and Asian-white segregation. Suburban places became more racially segre- gated from 1990 to 2010. Turning to the macro component of black- white segregation, most of the macro-H occurred between central cities, suburbs (in the aggregate), and fringes rather than between suburban places. In 2010, this com- ponent, which is consistent with the conven- tional view of black cities and white suburbs, represented nearly 20 percent of overall seg- regation and over 60 percent of the overall macro component. Both types of macro- segregation increased from 1990 to 2010, however, unlike overall micro-H patterns. Sim- ilar patterns of change in macro-segregation were also evident for the Hispanic-white and Asian-white H’s. In these analyses, we gave equal weight to each metro area. Our results represent the average experience of metro areas but not necessarily of the people who live in them. The nation’s largest metropolitan areas hold the largest shares of metropolitan residents. To address this weighting issue, following Logan and Stults (2011), we limit our analy- ses to the 50 largest metro areas. These 50 metro areas account for about 75 percent of the nation’s metro minority population of blacks, Asians, and Hispanics. Table 3 reports these parallel results. Segregation patterns since 1990 for the largest 50 metro areas are similar to those reported for all metro areas. That is, our results reveal similar overall declines in the H for blacks and whites from 1990 to 2010 (from 57.6 to 48.5), along with a pattern of decreas- ing micro-segregation (especially within cen- tral cities) and growing macro-segregation (especially the between-suburb component). These patterns generally hold for both the Hispanic-white and Asian-white comparisons. Our results nevertheless reveal some dis- tinguishing characteristics of segregation in the largest metro areas (Table 3). First, segre- gation levels, as measured by H, are much higher between blacks and whites in the larg- est U.S. metropolitan areas. The black-white H was 48.5 in 2010 in the largest metro areas, compared with 41.9 overall (Table 2). We do not find a similar segregation pattern by pop- ulation size in the Hispanic-white or Asian- white comparisons. Second, the macro-H was also considerably larger in the largest metro areas. For example, in the black-white com- parison, the macro-H represented, on average, 36.7 percent of the overall H in 2010, com- pared to 29.7 percent, on average, for all metro areas (in our sample). Moreover, the between-suburb component (of macro-H ) was roughly twice as large (as a percentage) in the 50 largest metro areas as it was in all metropolitan areas. We observed a similar finding by population size in the Hispanic- white and Asian-white comparisons. Clearly, the macro component of segrega- tion—the between-area component—increases as minority population size increases. The macro component has also become a more important component of overall racial and ethnic segregation (H ) over time. Declining segregation at one level (i.e., neighborhoods within specific places) is offset by increases at another level (i.e., the between-place component). The Most Segregated Metropolitan Areas Our analyses also reveal rather sizeable dif- ferences in segregation (H) from one metro- politan area to another. Table 4 reports results for the 10 metro areas with the highest black- white, Hispanic-white, and Asian-white H values among the 50 largest U.S. metro areas (identified in Table 2) with at least 1,000 people of each minority group. These analyses, based on the 2010 H value, reveal that black-white segregation was high- est in the Chicago metropolitan area. Its H value of 70.8 is 69 percent larger than the
- 19. Lichter et al. 861 average for all metropolitan areas (H = 41.9) and 46 percent larger than the average for the 50 metropolitan areas (H = 48.5) with the larg- est black populations. Moreover, the average macro component in the 10 most segregated metropolitan areas was slightly over 50 per- cent (50.8). In the most segregated metropoli- tan areas (e.g., Chicago), the macro component was split between the city-suburb-fringe (60 percent of macro-H ) and suburb-to-suburb components (40 percent of macro-H). We cannot hope to fully understand metro segre- gation without first acknowledging that place- specific demographic processes are shaped by local political and economic processes that include or exclude minority and majority pop- ulations. Indeed, the macro component of black-white segregation accounted for 74 per- cent of overall segregation in Detroit. The macro component was also very large in the metro areas of Milwaukee, Cleveland, Saint Louis, and Birmingham. Of course, other metropolitan areas dis- played much smaller macro components of black-white segregation. The New York metro- politan region, for example, ranked fourth overall in black-white segregation (H = 67.4), but the macro component represented just 32.7 percent of the total H. New York City covers a lot of land area, which allows for greater neighborhood differentiation by race (and characteristics that affect the location of differ- ent populations). Indeed, almost one-half of all black-white segregation in the New York met- ropolitan region occurred within New York City itself. New Orleans and Philadelphia also had comparatively small shares of macro-H (i.e., less than 40 percent). Much of the segre- gation was observed within the city limits of New Orleans and Philadelphia. New Orleans was also distinctive in having highly segre- gated black suburban communities (i.e., the within–suburban place component), while Philadelphia’s within-fringe share (22 percent) exceeded that of the other nine most highly black-white segregated metropolitan areas. As in the previous analysis (Tables 2 and 3), the highest levels of metro Hispanic-white and Asian-white segregation were much lower than the highest levels of metro black- white segregation. For Hispanics, the highest H was 46.7 in the New York-Newark-Jersey City metropolitan area. Although high in comparison to average overall rates (see Table 2), this H nevertheless was less than the aver- age black-white H for the most segregated metropolitan areas (64.8) and the largest metro areas (48.5). In the New York region, the macro component accounted for only 37.6 percent of all Hispanic-white segregation; most Hispanic-white segregation—like the case of black-white segregation—occurs in the micro component, especially the within– central city (i.e., within New York City) com- ponent (42 percent). This is not true everywhere, however. The macro component exceeded the micro component in three of the 10 most segregated metro areas (i.e., Provi- dence, Boston, and Hartford), suggesting that Hispanics in these northeastern metropolitan areas are often separated place to place from whites (rather than just from neighborhood to neighborhood). Still, for the top-10 most seg- regated metropolitan areas, the average Hispanic-white H was 44.5, of which the macro component accounted for 41.5 percent. In the most segregated metropolitan areas, Asians were less segregated from whites, on average, than either blacks or Hispanics. Among the 50 largest metropolitan areas, the most segregated Asian population was located in New Orleans. Its H was 42.4 in 2010, but less than 12 percent of this total could be attributed to the between-place component; more than one-third (36.8 percent) resided in the within–central city component. More gen- erally, the macro component of Asian-white segregation typically was much smaller than the macro component observed in the black- white and Hispanic-white comparisons. In metropolitan areas with the most segregated Asian populations, the macro-H accounted for only 24.5 percent of overall H, compared to 50.8 percent for the black-white H and 41.5 percent for the Hispanic-white H. These data seem consistent with political and economic explanations that emphasize the exclusion of historically disadvantaged “people of color”
- 20. 862 American Sociological Review 80(4) but not relatively affluent minority popula- tions, such as Asians. For these populations, segregation is largely at the neighborhood level—within cities, suburbs, or at the fringe. Or, stated differently, places are much more indifferent to Asians than to blacks, if meas- ured by the relative sizes of macro-H for the Asian-white and black-white pairs. Multivariate Analysis Modeling segregation. Which specific metropolitan-wide characteristics—those framed by spatial assimilation theory, place stratifica- tion models, or ecological theory—have given rise to changing metropolitan segrega- tion (both its macro and micro components)? To address this question, Table 5 reports results from metropolitan fixed-effects mod- els for H, macro-H, and micro-H. For each dependent variable, we estimate baseline models—Models 1, 3, and 5—that include only dummy variables for the time period and the specific minority-white comparison groups (using B-W as the reference category). Models 2, 4, and 6 then include the other metropolitan-level variables drawn from pre- vious studies; their inclusion provides an empirical basis for identifying the sources of change in metropolitan segregation between 1990 and 2010. In general, the overall baseline estimates (Model 1) confirm the descriptive evidence reported in Tables 2 and 3. That is, the results show declining overall segregation between 1990 and 2010. For example, the 2010 dummy was –.020, which means overall seg- regation (across all groups) declined by .02 points (or 2 if H ranges between 0 and 100) over the past 20 years, net of metro fixed effects. Unlike previous studies of racial pairs, these results—considering all racial groups simultaneously—suggest only small overall changes in the nation’s racial segrega- tion (especially when considered relative to the size of the intercept showing B-W segre- gation). These results clearly confirm that blacks are the most segregated minority group from whites. The coefficients for H-W and A-W are both –.104 less than the B-W refer- ence category. Our findings clearly point to a continuing pattern of black exceptionalism (Parisi et al. 2011). This conclusion is reinforced with the addition of other metropolitan-level variables in Model 2 (Table 5). In fact, changes in met- ropolitan characteristics since 1990 have had the positive effect of slowing metropolitan racial segregation. The baseline effect for 2010 is –.020 but grows to –.032 in Model 2 (Table 5) when other variables are included in the model. The 1990 to 2010 period was marked by significant increases in the His- panic and Asian populations, which tend to have lower rates of segregation from whites (Lichter et al. 2012). Perhaps more signifi- cant, these results indicate that higher black- white segregation cannot be explained by the variables included in our models or by unob- served metropolitan characteristics (that may tend to expose blacks, compared to other minority populations, to different economic and political contexts). Other results from these models are also instructive. For example, H increases signifi- cantly as the metropolitan percentage of each minority group increases, a result consistent with the group threat hypothesis that under- lies the place stratification perspective. Immi- gration, however, is not strongly associated with metropolitan-wide segregation, but this result may reflect the indirect effects of immi- gration on racial composition rather than direct effects. Evidence supporting the place stratification model is buttressed by the statis- tically significant positive association between political fragmentation and overall segregation (b = .021). The proliferation of communities in a metropolis seemingly exac- erbates segregation, and, as we will describe, this effect operates largely through growth in the macro-segregation component. These results are also consistent overall with spatial assimilation theory: metropolitan segregation declines significantly with declin- ing minority-white income inequality. In other words, declining racial inequality con- tributed, as expected, to more rapid declines
- 21. Lichter et al. 863 Table 5. Metro Fixed-Effects Models of Total, Macro, and Micro Residential Segregation (H), 1990 to 2010 H Macro-H Micro-H (1) (2) (3) (4) (5) (6) Intercept .432*** (.007) .305*** (.047) .123*** (.005) –.109*** (.027) .325*** (.006) .203*** (.035) Decade (1990 as reference) 2000 –.005** (.002) –.007** (.003) .010*** (.001) .005** (.002) –.006** (.002) –.003 (.002) 2010 –.020*** (.002) –.032*** (.004) .013*** (.001) .007** (.002) –.011*** (.003) .001 (.003) Group Comparison (B-W as reference) H-W –.104*** (.007) –.149*** (.008) –.063*** (.005) –.007 (.004) –.073*** (.005) –.014*** (.004) A-W –.104*** (.006) –.151*** (.007) –.073*** (.005) –.022*** (.005) –.064*** (.005) –.001 (.004) H Value .329*** (.011) .526*** (.014) Spatial Assimilation Theory Ratio Minority/White Median HH Income –.077*** (.016) .010 (.008) –.026+ (.014) Place Stratification Theory Political Fragmentation .021*** (.004) .008** (.003) –.009* (.004) Minority Composition Percent Black .003*** (.000) –.001** (.000) .001** (.000) Percent Hispanic .001** (.000) .000 (.000) –.000 (.000) Percent Asian .003** (.001) .003*** (.001) –.002* (.001) Ecological Context Log Population .006+ (.003) .007*** (.002) –.007** (.002) Percent Foreign-Born .001 (.001) .000 (.000) –.001 (.000) Percent Elderly .006*** (.001) –.002** (.001) .001* (.001) Functional Specialization Percent Manufacturing .002*** (.000) –.001* (.000) .000 (.000) Percent Military Population –.004*** (.001) .001* (.000) –.001** (.000) Percent Government Employees –.003*** (.001) .001 (.000) –.002** (.001) Note: Numbers in parentheses are standard errors. +p < .1; *p < .05; **p < .01; ***p < .001 (two-tailed test).
- 22. 864 American Sociological Review 80(4) in metropolitan segregation. Finally, the ecol- ogy of metropolitan areas is associated with observed patterns of metropolitan segrega- tion. Older and larger metropolitan areas tend to be more highly segregated, as are areas that depend most heavily on manufacturing employment (i.e., older industrial metros). As expected, racial and ethnic segregation is least pronounced in metropolitan areas with comparatively high shares of employment in government and the military (an industrial and occupational sector where inequality is typically lower). Our descriptive baseline results (Table 2) show that overall declines in H since 1990 mask the upward tick in macro-segregation (the between-place component), even as neighborhood segregation within cities and suburbs generally declined over time. In Models 3 through 6 (Table 5), we repeat the multivariate analysis for the two components of H: micro-H and macro-H (i.e., the actual values rather than the percentage share of H). The full models also include H. At a given level of metropolitan segregation, our analy- sis thus identifies metropolitan characteristics that account for metropolitan-to-metropolitan variation in the macro and micro components of segregation.10 Indeed, as hypothesized, the period effects in the baseline models (Models 3 and 5) show that 1990 to 2010 was marked by declines in micro-H and increases in macro-H. The 2000 dummy for macro-H was .010, which increased to .013 in 2010. Moreover, the esti- mates of b in column 4 indicate that macro- segregation increased from 1990 to 2010, net of the unobserved time-invariant characteris- tics and the other observed variables in the models. This finding gives additional evi- dence to our claims of a new macro-segrega- tion in the metropolitan United States. In contrast, much of the overall decline in micro- H was eliminated altogether in the full model; indeed, in Model 6, the dummy variable for 2010 was statistically insignificant from 1990. These analyses also indicate that both the micro- and macro-segregation parts of H are generally largest for black-white segregation (vis-à-vis Hispanics and Asians), although these patterns are clearly attenuated when other variables are included in the models. Consistent with the place stratification model, increasing shares of blacks are posi- tively associated with micro-H but also with declines in the macro component of H. Also, whereas macro-H is largely unrelated to per- cent Hispanic, it increases as the share of Asians increases in the metro area. These results are seemingly consistent with the kinds of settlement patterns observed in suburban areas of the nation’s most racially diverse cit- ies and suburbs (e.g., Flushing in the New York metro area or Asian-concentrated sub- urbs outside Atlanta or San Francisco). In addition, political fragmentation has the expected positive association with macro- segregation and negative association with micro-segregation. The implication is that politically fragmented metropolitan areas have more place-to-place racial differentiation but less within-place differentiation (i.e., places are relatively more racially homogenous). Interestingly, the disaggregated results in Table 5 also show that macro-H (columns 3 and 4) and micro-H (columns 5 and 6) are largely unrelated to changing metro racial income inequality. Even though minority- white income is negatively related to metro- politan segregation, the former is not systematically associated with spatial varia- tion in the size of the macro and micro com- ponents of segregation. In this case, the substantive implication is that macro- and micro-segregation work in tandem—but dif- ferently—across metropolitan areas to pro- duce more or less segregation. Other results in Table 5—those dealing with ecological variables—provide fewer systematic and easy-to-interpret results. They nevertheless clearly suggest that macro-H increases significantly with metropolitan population size (b = .007) and that micro- segregation declines as metropolitan areas grow in population size. Macro-H also tends to decline in areas with growing elderly popu- lations (i.e., reflecting generational
- 23. Lichter et al. 865 neighborhood transitions from older white to younger minority populations) and where employment in manufacturing is more substantial. Race-specific models of H. In Table 6, we disaggregate our results separately by racial group for B-W, H-W, and A-W segrega- tion. That is, for each racial pair, we estimate the models for H, macro-H, and micro-H. Here, we expect to find a pattern of black exceptionalism, which is reflected best in evi- dence supporting the place stratification model and least in spatial assimilation theory. Indeed, for blacks, the results in column 1 (Table 6) clearly show large declines in over- all segregation since 1990. The b for 2010 is –.089, meaning H was roughly 8.7 points lower in 2010 than in 1990. Segregation of Hispanics and Asians from whites also declined over time in racially diverse U.S. metropolitan areas (see columns 4 and 7). But these declines were much smaller (about one- fourth to one-fifth as large) than those observed for blacks (column 1). Moreover, for Hispanic-white and Asian-white segrega- tion, the disaggregated results for the macro and micro components (columns 5, 6, 8, and 9) reveal some important differences.Whereas the past two decades brought significant increases in black-white macro-H, the magni- tude of increases in the macro component was much smaller for Hispanic-white segregation and negligible for Asian-white segregation. As containers of neighborhoods, places clearly play a much larger role in metropolitan- wide segregation for blacks than for Hispan- ics and Asians. This is another case of black exceptionalism in U.S. patterns of racial resi- dential segregation. As expected, the results also indicate that B-W segregation is highest in metropolitan areas with the largest percentage of blacks (b = .005), a pattern clearly consistent with the place stratification perspective. Moreover, an increasing percentage of metropolitan blacks is positively associated with increasing H-W and A-W segregation. Any “black threat” apparently spills over to Hispanics and Asians. Increasing shares of Asians at the metropolitan level are also associated with significantly more A-W segregation. The growth of Hispanics is unrelated to H-W seg- regation, however, which seems to suggest that Hispanic growth is not occurring in white neighborhoods. Yet for Hispanics—and only for Hispanics—an increasing foreign-born population is positively associated with more H-W segregation, which is consistent with the group threat hypothesis and with previous studies showing greater segregation of His- panic immigrants from whites (Iceland and Scopilliti 2008). For each racial group, politi- cal fragmentation is associated positively with increasing segregation (H) from whites, as expected. Changing black-white income inequality is statistically unrelated to shifting levels of segregation, an empirical result that can be interpreted to mean B-W segregation is largely immune to declining black-white income inequality. Like in the 1980s and 1990s (Farley and Frey 1994; Iceland and Wilkes 2006), the movement toward black economic incorporation in the 2000s was no guarantee of spatial integration with whites. For blacks, our results provide little support for spatial assimilation theory. For Hispanics and Asians, however, declines in income ine- quality were, as expected, associated with a downward trend in H-W and A-W segrega- tion, which is consistent with spatial assimila- tion theory. Income whitens, if measured by less segregation from whites. Like the overall results (Table 5), black- white segregation—both micro and macro components—is positively associated with increasing population size of the metropolitan area (b = .040) and manufacturing employ- ment (b = .003). The black-white H and macro-H are also positively associated with increasing elderly shares. We obtain similar results for Hispanics. The substantive impli- cation is that blacks and Hispanics living in larger, older Rust Belt areas (e.g., Detroit) are more racially segregated than those living in smaller metropolitan areas. In the case of Asians, however, Asian-white segregation
- 26. 868 American Sociological Review 80(4) tends to be lower in the largest metropolitan areas, a result consistent with the recent rapid growth of Asian ethnoburbs in large metro- politan areas (e.g., San Francisco or Atlanta). Finally, results for Asian-white segrega- tion also suggest a few distinguishing features from black-white and Hispanic-white segre- gation that merit attention. For example, unlike the case with other minority segrega- tion, where the macro component increased over time with increasing metropolitan popu- lation size, the Asian-white macro- and micro-H components of H were statistically unrelated to the size of the metropolitan area. Instead, growth in the relative size of the Asian population was associated with signifi- cant increases in A-W macro-segregation, a result again consistent with the resettlement of Asians into newer ethnoburbs (i.e., place- to-place differences in the spatial concentra- tion of Asians). The implication, perhaps, is that less inequality means a larger share of Asians are “at risk” of resettling in largely white, middle-class, and affluent suburban communities. We did not observe similar pat- terns among blacks and Hispanics. Race and ethnicity trumped income in sorting blacks and Hispanics into specific cities, suburbs, and fringe areas. Like other studies, the empirical evidence presented here suggests a clear racial and ethnic hierarchy in U.S. set- tlement patterns (Frey and Farley 1996; Logan et al. 2004). DISCUSSION AND CONCLUSIONS In this article, we argued for a new sensitivity to emerging patterns of macro-segregation, that is, to the sorting of racial and ethnic groups between places within U.S. metropoli- tan areas. We updated previous studies of changing patterns of racial residential segre- gation from 1990 to 2010 in the nation’s most racially diverse metropolitan areas. But unlike previous studies, we decomposed recent changes in metropolitan-area segregation into between- and within-place components. We used metropolitan-area, place, and block data from the 1990, 2000, and 2010 decennial Cen- suses and the five-year summary files (2008 to 2012) of the American Community Survey. Our results support several specific con- clusions. First, they confirm the findings of other studies showing declines in metro racial segregation since 1990. Our results also pro- vide empirical evidence of black exceptional- ism in U.S. patterns of racial residential segregation, even as the post-1990 period ushered in rapid declines in segregation between blacks and whites. Our analyses reveal familiar patterns of high residential segregation between blacks and whites and comparatively low Asian-white segregation, with Hispanic-white segregation occupying an intermediate position. Some metropolitan areas—like Chicago, Detroit, and Milwau- kee—continued to have exceptionally high levels of black-white segregation. Second, our decomposition of the H index into the macro and micro components reveals that recent segregation declines were located primarily in the micro component of H, or, more substantively, in declines in the uneven distribution of racial minorities from neigh- borhood to neighborhood. This finding is not especially surprising. What is new is that the macro component (macro-H) increased over the same period. These results, especially for blacks, seem to reflect continuing patterns of white depopulation from many large cities, growing place-to-place economic differentia- tion, and the emergence of a new “political economy of place” that emphasizes cities and communities rather than neighborhoods as political actors that exclude undesirable popu- lations, including historically disadvantaged minorities (Massey et al. 2009). These results are largely consistent with a place stratifica- tion perspective of racial residential segrega- tion. Indeed, the macro component of segregation is most pronounced in the case of black-white segregation, accounting for roughly one-half of metro segregation in the most segregated U.S. metropolitan areas. Macro-segregation is a much less prominent component of Asian-white segregation, which suggests there is much less political resistance
- 27. Lichter et al. 869 to Asians’ relocation in specific places (i.e., middle-class or affluent ethnoburbs). Third, these descriptive results on emerg- ing patterns of macro-segregation are largely confirmed in the multivariate fixed-effects models. Our analyses support descriptive evi- dence of high and growing macro-segregation among blacks in the United States. The empir- ical evidence further suggests that metro income equality among blacks and whites (unlike patterns among Asians and whites) is of little consequence in eradiating or reducing macro-segregation of blacks from whites. These results highlight the need to examine resettlement patterns that contribute to a new kind of metro segregation that often remains hidden by the current empirical approach that focuses on neighborhood segregation only. Drawing on place stratification models, a place-based, spatially inclusive perspective explicitly acknowledges persistence and change in minority and white resettlement pat- terns within U.S. urban conglomerations. Our study provides a point of departure for future research. It bridges conventional neigh- borhood studies with more recent research that challenges the commonplace assumption that metropolitan areas represent single, undifferentiated housing markets defined exclusively or mostly by neighborhood pro- cesses rather than by the political and eco- nomic actions of competing places. Metropolitan areas represent systems of com- peting places that contain different interests along class and racial lines while circum- scribing and defining neighborhoods and micro housing markets. Stated differently, neighborhoods (i.e., census tracts) are appro- priate accounting units for measuring change in racial composition or segregation, but these neighborhood processes are also shaped by place and metropolitan political and eco- nomic processes (see Lee et al. 2014; Parisi et al. 2015). As we show here, racial segrega- tion has demonstrable neighborhood (micro) and place (macro) components. This article is not without some limitations. Although we established the significance of places—cities and communities—in accounting for large shares of neighborhood-to-neighbor- hood variation in shares of whites, blacks, Asians, and Hispanics, our multivariate analy- ses were necessarily restricted to a limited num- ber of variables that drew on previous studies of place stratification, spatial assimilation, and ecological perspectives of metropolitan segre- gation. Our results characterize metropolitan areas. We did not identify variation in specific place-based political and economic activities (e.g., housing policies) that may now be giving rise to new patterns of segregation across U.S. cities and suburban neighborhoods. Neverthe- less, our findings strongly support ongoing research of this genre, one based on a new “political economy of place” that reinforces an urban hierarchy of both places and neighbor- hoods across the metropolitan region (e.g., Mas- sey et al. 2009; Rugh and Massey 2010). Our place-based approach affirms recent speculation that places represent important competing actors within metropolitan regions. Farrell (2008:467) claims that “[u]rban and suburban municipali- ties are replacing neighborhoods as the central organizing units of metro segregation.” In a similarvein,Crowderandcolleagues(2012:349) argue that “patterns of inter-neighborhood migration are much more place-specific than current theorizing acknowledges.” Our results buttress such claims and point to the need to consider alternative geogra- phies of segregation. Separating macro from micro segregation is no easy task, and other researchers undoubtedly will have different ideas or statistical approaches for accom- plishing this task (Fischer et al. 2004; Parisi et al. 2011; Reardon et al. 2008). We chose, for theoretical and methodological reasons, to define macro-segregation in terms of places— both cities and communities—rather than at other spatial scales (e.g., individualized neighborhood segregation). Our place-based approach is hardly the final answer but repre- sents a point of departure for reconceptualiz- ing the scale of metropolitan segregation and perhaps racial segregation at even higher lev- els of geography—regions, states, and metro and nonmetro counties. At a minimum, our results suggest the need to rethink our past
- 28. 870 American Sociological Review 80(4) reliance on neighborhoods (i.e., proxied by census tracts) in the current era of big data and powerful new GIS software. We also need to consider how the social and economic consequences of segregation depend on the scale of metropolitan segregation (Reardon et al. 2008). Our results, for example, suggest that places—as political and economic actors—play a large and typically unappreci- ated role in excluding blacks and other minor- ities from the geographic mainstream. And this macro component, vis-à-vis the micro or neighborhood component of segregation, may suggest a new kind of sorting of disad- vantaged minority populations into disadvan- taged place-based labor markets and school districts. It also suggests that traditional resi- dential attainment models (Crowder et al. 2012; South et al. 2011) must accommodate intra-metropolitan mobility between places, not just between neighborhoods. In future research, it will be important to further consider residential segregation at the urban-rural or exurban fringe. Although most metropolitan residents live in places— defined here as cities and suburbs—the U.S. metropolitan population increasingly resides outside census-defined places. In 2010, 22 percent of the metro population resided in fringe areas; this population is disproportion- ately white but also highly segregated. In additional analyses, we calculated the segre- gation index (index of dissimilarity) for the nonplace metropolitan populations (i.e., the fringe). The average black-white segregation index at the fringe for all metropolitan areas was very high—74 in 2010. Although we cannot identify the place-based macro-share of segregation in fringe areas, these fringe areas (e.g., housing developments) are likely identifiable by name and have reputations as to their racial makeup that reflect demo- graphic reality (see Krysan and Balder 2010).11 If so, our estimates of macro- segregation are probably underestimated in these analyses, which argues for a stronger theoretical and empirical basis for dividing up the U.S. exurban fringe into appropriate macro components. In the final analysis, our empirical goals have been straightforward but labor- and data-intensive in their execution. Unlike most previous studies focused on the uneven distri- butions of racial and ethnic groups across metropolitan neighborhoods (Iceland et al. 2013; Logan and Stults 2011), we have shown that changes in neighborhood racial segrega- tion are shaped by places—cities and suburbs. Indeed, place-based macro-segregation increased over time while micro or neighbor- hood segregation declined. Different levels of geography may either reinforce or offset declining neighborhood segregation between minorities and whites. Recent declines in metropolitan segregation have taken an unex- pected turn, one that requires new theory, new data, and new empirical approaches, espe- cially at a time of unprecedented and growing racial and ethnic diversity (Parisi et al. 2015; Tienda and Fuentes 2014). Acknowledgments A preliminary draft of this article was presented in Bos- ton at the annual meetings of the Population Association of America, May 1, 2014. The authors acknowledge the support of the Cornell Population Center and the National Strategic Planning & Analysis Research Center (nSPARC) at Mississippi State University. The authors also acknowledge the helpful comments of Jacob Rugh, Matt Hall, Sharon Sassler, the ASR editors, and several anonymous ASR reviewers. Notes 1. For 2010, this means that 62.1 percent of blacks, on average, would have to move to other neighbor- hoods (i.e., disproportionately white census tracts) to achieve equality in the percentage distribution of blacks and whites across all neighborhoods. 2. It is important to acknowledge that the black popu- lation in Detroit has also dropped about 200,000 from its peak, a demographic trend reflecting the black suburbanization to inner suburbs that is simi- lar to post-WWII patterns of white suburbanization. 3. Places are defined here using the Census Bureau’s technical definition. This definition includes incor- porated places, such as a city, town, or village, and census designated places (CDPs). The Census Bureau defines CDPs as “statistical counterparts of incorporated places, and are delineated to pro- vide data for settled concentrations of population that are identifiable by name but are not legally
- 29. Lichter et al. 871 incorporated under the laws of the state in which they are located” (U.S. Census Bureau 2013a). Neighborhoods are not places. 4. The H is often used to decompose earnings, income, or wealth inequality. For example, Firebaugh and Goesling (2004) decompose global income inequality (measured with the Theil index) into its between- and within-country components. They report that China and South Asia—representing part of the between-country component—account for a significant share of overall declines in global inequality. In our case, metropolitan inequality in residence patterns (i.e., segregation or the uneven distributions of majority and minority populations) can similarly be decomposed into the part due to places (i.e., between-place segregation) and the part due to within-place differences (i.e., analogous to within-country declines in income inequality). 5. Our definitions of micro- and macro-segregation should not be confused with recent metropolitan studies of “segregation profiles,” which also refer to micro- and macro-segregation as neighborhood-to- neighborhood differences within “egocentric local environments” of varying sizes (see Lee et al. 2008; Reardon et al. 2008). Our approach instead reflects political and social boundaries using conventional census concepts and geography, which are espe- cially relevant for the purposes of our study. 6. For simplicity, we assume here that overall segrega- tion is the same (as calculated with a D or H) in the low and high macro-segregation examples, and that the four suburbs are of the same population size, as are the two neighborhoods in each suburb. 7. According to Reardon and colleagues (2009:69), racial segregation may be evident at “geographic scales ranging from thousands of kilometers (think of the concentration of the U.S. black population in the Southeast) to less than a kilometer (block-to- block variation in racial composition) . . . there is no single geographical scale of segregation—no one ‘right’ scale at which to measure it.” This is true, especially if distance-based measures of segrega- tion are involved, but it also is true that geographic scales linked to political boundaries have a special appeal, especially in establishing places as central organizing units for conceptualizing and measuring metropolitan-wide segregation. 8. The Census Bureau labels metropolitan areas by the names of its principal cities (e.g., Chicago- Naperville-Elgin). For the purposes of our study, we identify principal cities as the first-listed city of the metropolitan statistical area (e.g., Chicago), with the “trailing cities” included in our analysis as suburban communities. In the case of Chicago, it clearly makes sense conceptually to view Naper- ville as a suburb rather than a principal city. But this decision may be less appropriate for other metro- politan areas, such as the New York-Newark-Jersey City metropolitan area. In practice, however, it makes only small overall differences—and no sub- stantive differences—if we consider trailing cities either as principal cities or suburbs. These addi- tional analyses are available from the authors upon request. 9. We estimated these repeated measures models using the MIXED SAS procedure. 10. Similar metropolitan-wide H’s across areas can have very different shares of macro- and micro- H. It is important to include H to identify the key metropolitan-level characteristics that give rise to area-to-area differences in micro- and macro-H, independent of the overall level of segregation in the metropolitan region. Macro- and micro-H are expected to increase, quite mechanically, as overall segregation in a metropolitan area increases. 11. An interesting illustration of this point is repre- sented by the Washington, DC, metropolitan area, in which there is a clear East-West racial divide in the suburbs and exurban fringe. Prince George’s county in Maryland is much different racially from the innermost Virginia suburbs, and these differ- ences also show up in areas outside of the fringe (as we have defined it). References Blalock, Hubert M. 1967. Toward a Theory of Minority Group Relations. New York: John Wiley and Sons. Charles, Camille Z. 2003. “The Dynamics of Racial Residential Segregation.” Annual Review of Sociol- ogy 29:167–207. Crowder, Kyle, Jeremy Pais, and Scott J. South. 2012. “Neighborhood Diversity, Metropolitan Constraints, and Household Migration.” American Sociological Review 77(3):325–53. Farley, Reynolds, and William H. Frey. 1994. “Changes in the Segregation of Whites from Blacks during the 1980s: Small Steps toward a More Integrated Soci- ety.” American Sociological Review 59(1):23–45. Farley, Reynolds, Howard Schuman, Suzanne Bianchi, Diane Colasanto, and Shirley Hatchett. 1978. “‘Choc- olate City, Vanilla Suburbs’: Will the Trend toward Racially Separate Communities Continue?” Social Science Research 7(4):319–44. Farrell, Chad R. 2008. “Bifurcation, Fragmentation, or Integration? The Racial and Geographic Structure of U.S. Metropolitan Segregation, 1990–2000.” Urban Studies 45(3):467–99. Firebaugh, Glenn, and Brian Goesling. 2004. “Account- ing for the Recent Decline in Global Income Inequal- ity.” American Journal of Sociology 110(2):283–312. Fischer, Claude S., Gretchen Stockmayer, Jon Stiles, and Michael Hout. 2004. “Distinguishing the Geographic Levels and Social Dimensions of U.S. Metropolitan Segregation, 1960–2000.” Demography 41(1):37–59. Fischer, Mary J. 2008. “Shifting Geographies: Examin- ing the Role of Suburbanization in Blacks’ Declining Segregation.” Urban Affairs Review 43(4):475–96.