Download to read offline


![Gillian, W.S., A.N. Maupin, C.R. Reyes, M. Accavitti
and F. Shic. 2016. “Do Early Educators’ Implicit Biases
Regarding Sex and Race Relate to Behavior Expectations
and Recommendations of Preschool Expulsions and
Suspensions?” Research Study Brief. Yale University, Yale
Child Study Center, New Haven, CT.
GIZ (Deutsche Gesellschaft für Internationale
Zusammenarbeit). 2014. Developing an Environmental
Technology Centre (CTA) in Peru. Triangular Cooperation
Brazil–Peru–Germany. Eschborn, Germany. www.giz.de/
en/downloads/giz2014-en-zentrum-umwelttechnologien-
peru.pdf. Accessed 8 November 2016.
Gjerde, K.M. 2006. “Ecosystems and Biodiversity in Deep
Waters and High Seas.” UNEP Regional Seas Reports and
Studies No. 178. United Nations Environment Programme,
Nairobi. www.unep.org/pdf/EcosystemBiodiversity_
DeepWaters_20060616.pdf. Accessed 11 October 2016.
Global Citizen. 2016. “Sweden’s New Global Deal Will
Boost Employment and the SDGs.” 12 October. New York.
www.globalcitizen.org/en/content/sweden-new-global-
deal/. Accessed 7 November 2016.
Global Initiative to End All Corporal Punishment
of Children. 2015. “Towards Non-violent Schools:
Prohibiting All Corporal Punishment, Global Report 2015.”
London. www.endcorporalpunishment.org/assets/pdfs/
reports-thematic/Schools%20Report%202015-EN.pdf.
Accessed 26 October 2016.
Global Witness. 2016. “On Dangerous Ground.” London.
www.globalwitness.org/en/reports/dangerous-ground/.
Accessed 26 October 2016.
Gómez, O.A., A. Muto and S.G. Kamidohzono. 2016.
“Sharing the Journey: The Way Ahead for Human
Development and Human Security Frameworks.”
Background paper for Human Development Report
2016. United Nations Development Programme, Human
Development Report Office, New York.
Grant Thornton. 2016. “Women in Business: Turning
Promise into Practice.” London. www.grantthornton.
global/en/insights/articles/women-in-business-2016/.
Greenpeace. 2016a. “Refrigeration that Won’t Heat Up
the Planet.” www.greenpeace.org/international/en/
campaigns/climate-change/Solutions/Climate-friendly-
refrigeration/. Accessed 8 November 2016.
———. 2016b. “10 Years Ago the Amazon Was Being
Bulldozed for Soy—Then Everything Changed.” www.
greenpeace.org/usa/victories/amazon-rainforest-
deforestation-soy-moratorium-success/. Accessed 8
November 2016.
Greytak, E.A., J.G. Kosciw, C. Villenas and N.M.
Giga. 2016. “From Teasing to Torment: School Climate
Revisited, A Survey of U.S. Secondary School Students
and Teachers.” GLSEN, New York. www.glsen.org/sites/
default/files/TeasingtoTorment%202015%20FINAL%20
PDF%5B1%5D_0.pdf. Accessed 14 October 2016.
Griffith-Jones, S. 2016. “Global Governance and Growth
for Human Development.” Background paper for Human
Development Report 2016. United Nations Development
Programme, Human Development Report Office, New York.
Griffith-Jones, S., and G. Cozzi. 2015. “Investment-led
Growth: A Solution to the European Crisis.” Political
Quarterly 86: 119–133.
The Guardian. 2016a. “Brazil is ‘Badly Losing’ the Battle
against Zika Virus, Says Health Minister.” 26 January.
www.theguardian.com/world/2016/jan/26/brazil-zika-
virus-health-minister-armed-forces-eradication. Accessed
30 November 2016.
———. 2016b. “South Africa to Quit International Criminal
Court.” www.theguardian.com/world/2016/oct/21/south-
africa-to-quit-international-criminal-court-document-
shows. Accessed 8 November 2016.
GWG (Global Working Group on Big Data for Official
Statistics). 2016. “UN Big Data for Official Statistics.”
United Nations Department of Economic and Social
Affairs, New York. http://unstats.un.org/bigdata/.
Accessed 7 November 2016.
Hallegatte, S., M. Bangalore, L. Bonzanigo, M. Fay,
T. Kane, U. Narloch, J. Rozenberg, D. Treguer and
A. Vogt-Schilb. 2016. Shock Waves: Managing the
Impacts of Climate Change on Poverty. Climate Change
and Development Series. Washington, DC: World Bank.
https://openknowledge.worldbank.org/bitstream/
handle/10986/22787/9781464806735.pdf. Accessed 25
August 2016.
Harris, R.D., and W.M. Marks. 2009. “Compact Ultrasound
for Improving Maternal and Perinatal Care in Low-
Resource Settings: Review of the Potential Benefits,
Implementation Challenges and Public Health Issues.”
Journal of Ultrasound Medicine 28: 1067–1076.
Heckman, J., R. Pinto and P. Savelyev. 2013.
“Understanding the Mechanisms through Which an
Influential Early Childhood Program Boosted Adult
Outcomes.” American Economic Review 103(6): 2052–86.
HelpAge International and Center for Demographic
Research. 2015. “Breaking the Silence: Elder Abuse in the
Republic of Moldova.” Chisinau, Moldova. www.refworld.
org/pdfid/566a972e4.pdf. Accessed 26 October 2016.
Hemmelgarn, T., G. Nicodème, B. Tasnadi and P.
Vermote. 2015. “Financial Transaction Taxes in the
European Union.” Taxation Papers Working Paper 62.
Brussels. www.steuer-gegen-armut.org/fileadmin/
Dateien/Kampagnen-Seite/Unterstuetzung_Ausland/
EU/2015-2016/1602_EU_Commission.pdf. Accessed 30
September 2016.
Herzer, D., P. Huhne and P. Nunnenkamp. 2014. “FDI
and Income Inequality: Evidence from Latin American
Economies.” Review of Development Economics 18(4):
778–793.
Hillis, S., J. Mercy, A. Amobi and H. Kress. 2014. “Global
Prevalence of Past-year Violence against Children: A
Systematic Review and Minimum Estimates.” Pediatrics
137(3):e20154079.
Hillman, A.L., and E. Jenkner. 2004. “Educating Children
in Poor Countries.” Economic Issues 33. International
Monetary Fund, Washington, DC. www.imf.org/external/
pubs/ft/issues/issues33/. Accessed 7 November 2016.
Hollow, M. 2013. “Crowdfunding and Civic Society in
Europe: A Profitable Partnership?” Open Citizenship 4(1):
68–73. www.academia.edu/3415172/Crowdfunding_
and_Civic_Society_in_Europe_A_Profitable_Partnership.
Accessed 11 October 2016.
HOPE XXL. 2015. “The Liemers List: Final Version.” Duiven,
The Netherlands. www.hope-xxl.com/downloads/liemers-
list-final-version.pdf. Accessed 7 November 2016.
Hunt, A., and E. Samman. 2016. “Women’s Economic
Empowerment: Navigating Enablers and Constraints.”
Research Report. Overseas Development Institute,
London. www.odi.org/sites/odi.org.uk/files/resource-
documents/10683.pdf. Accessed 7 November 2016.
IANYD (United Nations Inter-Agency Network on Youth
Development). 2016. “Young People’s Participation
in Peacebuilding: A Practice Note.” New York. www.
un.org/en/peacebuilding/pbso/pdf/Practice%20Note%20
Youth%20%20Peacebuilding%20-%20January%202016.
pdf. Accessed 11 October 2016.
ICAP (International Carbon Action Partnership). 2016.
“Korea Emissions Trading Scheme.” 26 September, Berlin.
https://icapcarbonaction.com/en/?option=com_etsma
ptask=exportformat=pdflayout=listsystems[]=47.
Accessed 22 November 2016.
ICF International. 2016. “Data.” DHS Program. Rockville,
MD. www.dhsprogram.com/Data/. Accessed 15 July
2016.
IEA (International Energy Agency). 2016a. “Decoupling
of Global Emissions and Economic Growth Confrmed.”
Press release, 16 March. Paris. www.iea.org/newsroom/
news/2016/march/decoupling-of-global-emissions-and-
economic-growth-confirmed.html. Accessed 24 October
2016.
———. 2016b. Energy and Air Pollution: World Energy
Outlook Special Report. Paris. www.iea.org/publications/
freepublications/publication/WorldEnergyOutlookSpecial
Report2016EnergyandAirPollution.pdf. Accessed 23
August 2016.
———. 2016c. “WEI 2016: Fact Sheet.” Paris. www.iea.
org/media/publications/wei/WEI2016FactSheet.pdf.
Accessed 14 October 2016.
———. 2016d. World Energy Outlook 2016. www.iea.
org/media/publications/weo/WEO2016Factsheet.pdf.
Accessed 1 November 2016.
IEP (Institute for Economics and Peace). 2015. “Global
Terrorism Index 2015: Measuring and Understanding the
Impact of Terrorism.” New York. http://economicsandpeace.
org/wp-content/uploads/2015/11/Global-Terrorism-
Index-2015.pdf. Accessed 23 August 2016.
———. 2016. “Global Peace Index 2016: Ten Years of
Measuring Peace.” New York. http://economicsandpeace.
org/wp-content/uploads/2016/06/GPI-2016-Report_2.pdf.
Accessed 23 August 2016.
IFAD (International Fund for Agricultural Development).
2009. “Macedonia: Agricultural Financial Services
Project.” Project Completion Digests. Rome. http://
operations.ifad.org/documents/654016/037e464d-864a-
458d-b142-dcdf0086bca8. Accessed 7 November 2016.
———. 2012. “Indigenous Peoples: Valuing, Respecting
and Supporting Diversity.” Rome. www.ifad.org/
documents/10180/0f2e8980-09bc-45d6-b43b-
8518a64962b3. Accessed 1 November 2016.
———. 2016. “Rural Poverty Portal.” Rome. www.
ruralpovertyportal.org/country/statistics/tags/macedonia.
Accessed 7 November 2016.
IFPRI (International Food Policy Research Institute).
2015. Global Nutrition Report 2015: Actions and
Accountability to Advance Nutrition and Sustainable
Development. Washington, DC. http://ebrary.ifpri.
org/utils/getfile/collection/p15738coll2/id/129443/
filename/129654.pdf. Accessed 24 August 2016.
IHME (Institute for Health Metrics and Evaluation).
2016. “Rethinking Development and Health: Findings from
the Global Burden of Disease Study.” IHME University of
178 | HUMAN DEVELOPMENT REPORT 2016](https://image.slidesharecdn.com/humandevelopmentreport2016humandevelopmentforeveryone-170622191653/85/Human-Development-Report-2016-192-320.jpg)
![Washington, Seattle. www.healthdata.org/policy-report/
rethinking-development-and-health-findings-global-
burden-disease-study. Accessed 4 November 2016.
IHS (Indian Health Service, Federal Health Program
for American Indians and Alaska Natives). 2016.
“Disparities.” Fact sheet. Rockville, MD. www.ihs.gov/news-
room/factsheets/disparities/. Accessed 28 October 2016.
IISD (International Institute for Sustainable
Development). 2016. “Fossil-Fuel Subsidies.” Global
Subsidies Initiative, Geneva. www.iisd.org/gsi/fossil-fuel-
subsidies. Accessed 7 November 2016.
ILGA (International Lesbian, Gay, Bisexual, Trans and
Intersex Association). 2016a. “Global Attitudes Survey
on LGBTI People.” Geneva. http://ilga.org/what-we-do/
ilga-riwi-global-attitudes-survey-lgbti-logo/. Accessed 2
November 2016.
———. 2016b. “Sexual Orientation Laws in the World:
Criminalisation.” Geneva. http://ilga.org/downloads/04_
ILGA_WorldMap_ENGLISH_Crime_May2016.pdf.
Accessed 26 October 2016.
———. 2016c. “Sexual Orientation Laws in the World:
Overview.” Geneva. http://ilga.org/downloads/03_ILGA_
WorldMap_ENGLISH_Overview_May2016.pdf. Accessed
26 October 2016.
ILO (International Labour Organization). 2012.
“ILO Global Estimate of Forced Labour: Results and
Methodology.” Geneva. www.ilo.org/wcmsp5/groups/
public/---ed_norm/---declaration/documents/publication/
wcms_182004.pdf. Accessed 26 October 2016.
———. 2014a. “Brazil, Cadastro Único: Operating a
Registry through a National Public Bank.” Geneva.
———. 2014b. “Decent Work and Social Justice in Pacific
Small Island Developing States: Challenges, Opportunities
and Policy Responses.” ILO Office for Pacific Island
Countries, Suva, Fiji Islands. www.ilo.org/wcmsp5/
groups/public/---dgreports/---nylo/documents/publication/
wcms_242172.pdf. Accessed 28 November 2016.
———. 2015a. “Global Employment Trends for Youth
2015: Scaling Up Investments in Decent Jobs for
Youth.” Geneva. www.ilo.org/wcmsp5/groups/public/-
--dgreports/---dcomm/---publ/documents/publication/
wcms_412015.pdf. Accessed 23 August 2016.
———. 2015b. World Employment and Social Outlook: The
Changing Nature of Jobs. Geneva. www.ilo.org/wcmsp5/
groups/public/---dgreports/---dcomm/---publ/documents/
publication/wcms_368626.pdf. Accessed 11 October
2016.
———. 2015c. World Employment and Social Outlook:
Trends 2015. Geneva. www.ilo.org/wcmsp5/groups/
public/---dgreports/---dcomm/---publ/documents/
publication/wcms_337069.pdf. Accessed 14 October
2016.
———. 2016a. “Our Impact, Their Voices: Helping
Syrian Refugees Formalize Their Work Status through
Cooperatives.” 26 June. Geneva. www.ilo.org/beirut/
media-centre/fs/WCMS_493964/lang--en/index.htm.
Accessed 10 November 2016.
———. 2016b. “Women in Business and Management:
Gaining Momentum in the Middle East and North
Africa.” Regional Office for Arab States, Beirut. www.
ilo.org/wcmsp5/groups/public/---arabstates/---ro-beirut/
documents/publication/wcms_446101.pdf. Accessed 7
November 2016.
———. 2016c. “Women at Work: Trends 2016.” Geneva.
http://ilo.org/wcmsp5/groups/public/---dgreports/---
dcomm/---publ/documents/publication/wcms_457317.pdf.
Accessed 7 November 2016.
———. 2016d. World Employment and Social Outlook
2016: Transforming Jobs to End Poverty. Geneva.
https://sustainabledevelopment.un.org/content/
documents/10290ILO%20WESO(2016).pdf. Accessed 11
October 2016.
———. 2016e. World Employment and Social Outlook:
Trends for Youth 2016. Geneva. www.ilo.org/wcmsp5/
groups/public/---dgreports/---dcomm/---publ/documents/
publication/wcms_513739.pdf. Accessed 20 October
2016.
IMF (International Monetary Fund). 2012. The
Liberalization and Management of Capital Flows: An
Institutional View. Washington, DC.
———. 2016a. “IMF Members’ Quotas and Voting Power,
and IMF Board of Governors.” Washington, DC. www.imf.
org/external/np/sec/memdir/members.aspx. Accessed 16
December 2016.
———. 2016b. “IMF Survey: IMF Reforms Policy for
Exceptional Access Lending.” www.imf.org/external/
pubs/ft/survey/so/2016/pol012916a.htm. Accessed 21
December 2016.
———. 2016c. “Past IMF Disbursements and Repayments
for All Members.” Washington, DC. www.imf.org/external/
np/fin/tad/extrep1.aspx. Accessed 10 November 2016.
———. 2016d. World Economic Outlook: October 2016:
Subdued Demand: Symptoms and Remedies. World
Economic and Financial Surveys. Washington, DC. www.
imf.org/external/pubs/ft/weo/2016/02/pdf/text.pdf.
Accessed 7 November 2016.
Independent Commission on Multilateralism. 2016.
UN 2030: Rebuilding Order in a Fragmenting World. New
York. www.ipinst.org/wp-content/uploads/2016/08/
IPI-ICM-UN-2030-Chairs-Report2FINAL.pdf. Accessed 26
September 2016.
Independent Evaluation Office of the International
Monetary Fund. 2013. The Role of the IMF as Trusted
Advisor. Evaluation Report. www.ieo-imf.org/ieo/
files/completedevaluations/RITA_-_Main_Report.pdf.
Accessed 8 November 2016.
Indrawati, S.M. 2015. “Discriminating against Women
Keeps Countries Poorer.” Voices: Perspectives on
Development (Blog), 10 September. Washington, DC.
http://blogs.worldbank.org/voices/discriminating-against-
women-keeps-countries-poorer. Accessed 14 October
2016.
INSD (Burkina Faso Institut National de la Statistique
et de la Démographie). 2016. “Chiffres clés.”
Ouagadougou. www.insd.bf/n/. Accessed 22 November
2016.
IOC (International Olympic Committee). 2016. “Kimia
Alizadeh: The Yog Star Flying the Flag for Female Athletes
in Iran.” 26 August. Lausanne, Switzerland. www.olympic.
org/news/kimia-alizadeh-the-yog-star-flying-the-flag-for-
female-athletes-in-iran. Accessed 14 October 2016.
IOM (International Organization for Migration). 2014.
“Global Migration Trends: An Overview.” Geneva. http://
missingmigrants.iom.int/sites/default/files/Global-
migration-trends_December-2014_final.pdf. Accessed 26
October 2016.
———. 2015. World Migration Report 2015: Migrants and
Cities: New Partnerships to Manage Mobility. Geneva.
http://publications.iom.int/system/files/wmr2015_en.pdf.
Accessed 26 September 2016.
———. 2016a. IOM Regional Response to the Syria Crisis.
Geneva. http://reliefweb.int/sites/reliefweb.int/files/
resources/IOM%20Regional%20Response%20to%20
the%20Syria%20Crisis%20Sitrep%20%28June%20
2016%29.pdf. Accessed 7 November 2016.
———. 2016b. IOM Regional Response to the Syria Crisis
[infographic]. Geneva. www.iom.int/sites/default/files/
country/docs/IOM-Regional-Response-to-the-Syria-Crisis-
Map-March2016.pdf. Accessed 16 December 2016.
IPCC (Intergovernmental Panel on Climate Change).
2000. Special Report on Emission Scenarios. Cambridge,
UK: Cambridge University Press.
IPPR (Institute for Public Policy Research). 2012.
“Modern Women Marrying Men of the Same or Lower
Social Class.” 5 April. London. www.ippr.org/news-and-
media/press-releases/modern-women-marrying-men-
of-the-same-or-lower-social-class. Accessed 27 October
2016.
IPU (Inter-Parliamentary Union). 2016. Women in na-
tional parliaments. www.ipu.org/wmn-e/classif-arc.htm.
Accessed 19 July 2016.
ITC (International Trade Centre). 2014. “Trade in
Environmental Goods and Services: Opportunities and
Challenges.” Technical Paper. Geneva. www.intracen.
org/uploadedFiles/intracenorg/Content/Publications/
AssetPDF/EGS%20Ecosystems%20Brief%20040914%20
-%20low%20res.pdf. Accessed 27 October 2016.
ITU (International Telecommunication Union). 2016a.
End-2016 Estimates for Key ICT Indicators. Geneva. www.
itu.int/en/ITU-D/Statistics/Documents/statistics/2016/
ITU_Key_2005-2016_ICT_data.xls. Accessed 4 December
2016.
———. 2016b. “ICT Facts and Figures 2016.” Geneva.
www.itu.int/en/ITU-D/Statistics/Documents/facts/
ICTFactsFigures2016.pdf. Accessed 26 October 2016.
IWGIA (International Work Group for Indigenous
Affairs). 2016. “Indigenous Peoples’ Education.”
Copenhagen. www.iwgia.org/culture-and-identity/
indigenous-peoples-and-education. Accessed 28 October
2016.
Jahan, S. 2003. “Evolution of the Human Development
Index.” In S. Fukuda-Parr and A.K. Shiva Kumar, eds.,
Readings in Human Development: Concepts, Measures
and Policies for a Development Paradigm. New Delhi:
Oxford University Press.
———. 2010. Freedom for Choice: Essays in Human
Development. Dhaka: Shahitya Prakash.
Jenks, B., and J. Topping. 2016. Financing the United
Nations Development System: Current Trends and
New Directions. Uppsala, Sweden: Dag Hammarskjold
Foundation and Multi-Partner Trust Fund Office.
Johnson, C., and D. Start. 2001.”Rights, Claims and
Capture: Understanding the Politics of Pro-Poor Policy.”
Working Paper 145. Overseas Development Institute,
London. www.odi.org/sites/odi.org.uk/files/odi-assets/
publications-opinion-files/2319.pdf. Accessed 27 October
2016.
Joshi, A. 2010. “Review of Impact and Effectiveness
of Transparency and Accountability Initiatives:
References | 179](https://image.slidesharecdn.com/humandevelopmentreport2016humandevelopmentforeveryone-170622191653/85/Human-Development-Report-2016-193-320.jpg)
![———. 2016g. “Legal Aid Service in Georgia.” New
York. www.undp.org/content/undp/en/home/ourwork/
democraticgovernance/projects_and_initiatives/georgia_
justice_forall.html. Accessed 17 November 2016.
———. 2016h. “Managing Droughts and Floods in
Azerbaijan.” New York. www.undp.org/content/undp/en/
home/ourwork/ourstories/managing-droughts-and-floods-
in-azerbaijan-.html. Accessed 16 November 2016.
———. 2016i. Mongolia Human Development Report
2016: Building a Better Tomorrow: Including Youth in the
Development of Mongolia. Ulaanbaatar. www.hdr.undp.
org/sites/default/files/mongolia_human_devlopment_
report_2016_english_full_report_2016_06_28.pdf.
Accessed 1 November 2016.
———. 2016j. “Together, Sri Lankan Communities Build
Back with Resilience.” New York. www.undp.org/content/
undp/en/home/ourwork/ourstories/together-sri-lankan-
communities-build-back-with-resilience.html. Accessed 16
November 2016.
———. 2017. Human Development Report Office’s Library
[online database]. http://hdr.undp.org/en/reports.
Accessed 16 January 2017.
UNDP (United Nations Development Programme) and
IAER (Institute for Applied Economic Research, João
Pinheiro Foundation). 2013. Human Development Atlas
in Brazil. http://atlasbrasil.org.br/2013/en/o_atlas/o_
atlas_/. Accessed 14 December 2016.
UNEP (United Nations Environment Programme). 2016.
“Developing Countries Show World Way Forward on
Green Finance.” UNEP News Centre, 18 July. Geneva.
www.unep.org/newscentre/default.aspx?DocumentID=27
079ArticleID=36231l=en. Accessed 9 November 2016.
UNEP (United Nations Environment Programme) and
UNDP (United Nations Development Programme).
2016. “The Poverty-Environment Initiative in the Context
of the Sustainable Development Goals: Relevance and
Experience for National and Subnational Implementation.”
UNDP-UNEP Poverty-Environment Facility, United Nations,
Nairobi. www.undp.org/content/dam/undp/library/
Environment%20and%20Energy/sustainable%20land%20
management/Factsheet-PEI.pdf. Accessed 16 November
2016.
UNESCO (United Nations Educational, Scientific and
Cultural Organization). 2013a. “Children Still Battling to
go to School.” Education for all Global Monitoring Report,
Policy Paper 10. Montreal. http://unesdoc.unesco.org/
images/0022/002216/221668E.pdf. Accessed 26 October
2016.
———. 2013b. Education for All Global Monitoring Report –
Girls’ Education – the Facts. Paris.
———. 2013c. “Girls’ Education: The Facts.” Education for
All Global Monitoring Report, Fact Sheet. Paris. http://
en.unesco.org/gem-report/sites/gem-report/files/girls-
factsheet-en.pdf. Accessed 7 November 2016.
———. 2014a. Education for All: Global Monitoring Report
2014: Teaching and Learning: Achieving Quality for All.
Paris.
———. 2014b. Teaching and Learning: Achieving Quality for
All: EFA Global Monitoring Report 2013/4: Summary. Paris.
http://unesdoc.unesco.org/images/0022/002256/225654e.
pdf. Accessed 3 November 2016.
———. 2015a. “A Growing Number of Children and
Adolescents Are out of School as Aid Fails to Meet the
Mark.” Policy Paper 22/Fact sheet 31. Paris. www.uis.
unesco.org/Education/Documents/fs-31-out-of-school-
children-en.pdf. Accessed 25 August 2016.
———. 2015b. 2015 Global Monitoring Report: Education
for All 2000-2015: Achievements and Challenges. Paris.
http://unesdoc.unesco.org/images/0023/002322/232205e.
pdf. Accessed 14 October 2016.
———. 2016a. Global Education Monitoring Report 2016:
Education for People and Planet: Creating Sustainable
Futures for All. Paris. http://unesdoc.unesco.org/
images/0024/002457/245752e.pdf. Accessed 11 October
2016.
———. 2016b. “UNESCO eAtlas of Gender Inequality in
Education.” UNESCO Institute for Statistics, Montreal.
www.tellmaps.com/uis/gender/#!/tellmap/-1195952519.
Accessed 10 June 2016.
UNESCO (United Nations Educational, Scientific and
Cultural Organization) Institute for Statistics. 2016.
“Education: Illiterate Population.” Montreal. http://data.
uis.unesco.org. Accessed 8 December 2016.
UNESCO (United Nations Educational, Scientific
and Cultural Organization) and UNICEF (United
Nations Children’s Fund). 2015. “Fixing the Broken
Promise of Education for All: Findings from the Global
Initiative on Out-of-School Children.” UNESCO Institute
for Statistics, Montreal. http://unesdoc.unesco.org/
images/0023/002315/231511e.pdf. Accessed 26 October
2016.
UNFCCC (United Nations Framework Convention on
Climate Change). 2015. “Paris Agreement on Climate
Change.” Paris. http://unfccc.int/paris_agreement/
items/9485.php. Accessed on 3 December 2016.
UNFPA (United Nations Population Fund). 2014. State of
World Population 2014: The Power of 1.8 Billion. New York.
www.unfpa.org/sites/default/files/pub-pdf/EN-SWOP14-
Report_FINAL-web.pdf. Accessed 20 October 2016.
———. 2015. “Migration.” 23 December. New York. www.
unfpa.org/migration. Accessed 26 October 2016.
———. 2016. “World Population Day.” New York. www.
unfpa.org/events/world-population-day. Accessed 11
October 2016.
UNFPA (United Nations Population Fund) and HelpAge
International. 2012. Ageing in the Twenty-First Century:
A Celebration and a Challenge. New York. www.unfpa.
org/publications/ageing-twenty-first-century. Accessed 22
November 2016.
UN-Habitat (United Nations Human Settlements
Programme). 2014. “Proportion of Urban Population
Living in Slums 1990–2014.” Nairobi. http://unhabitat.
org/wp-content/uploads/2014/03/Table-2.2-Proportion-of-
urban-population-living-in-slums-1990-2014.pdf. Accessed
26 October 2016.
UNHCR (United Nations High Commissioner for
Refugees). 1997. “Memorandum of Understanding
between the United Nations High Commissioner
for Refugees and the International Organization for
Migration.” Geneva. www.unhcr.org/4aa7a3ed9.pdf.
Accessed 11 November 2016.
———. 2014. UNHCR Global Report 2014: Progressing
towards Solutions. Geneva. www.unhcr.org/en-us/
publications/fundraising/5575a78813/unhcr-global-report-
2014-progressing-towards-solutions.html?query=17years.
Accessed 26 September 2016.
———. 2015a. “Funding UNHCR’s Programmes.” In Global
Report 2015. Geneva. www.unhcr.org/574ed5574.pdf.
Accessed 7 November 2016.
———. 2015b. “Needs and Funding Requirements.” In
UNHCR Global Appeal 2016-2017. Geneva. www.unhcr.
org/564da0e20.pdf. Accessed 16 December 2016.
———. 2016a. Global Trends: Forced Displacement
in 2015. Geneva. https://s3.amazonaws.com/
unhcrsharedmedia/2016/2016-06-20-global-trends/2016-
06-14-Global-Trends-2015.pdf. Accessed 23 August 2016.
———. 2016b. “Syria Regional Refugee Response.”
Geneva. http://data.unhcr.org/syrianrefugees/regional.
php. Accessed 1 November 2016.
———. 2016c. “UNHCR Statistics: The World in Numbers.”
Geneva. http://popstats.unhcr.org/en/overview. Accessed
26 October 2016.
UNICEF (United Nations Children’s Fund). 2004. “Nepal,
Welcome to School: Enrolment and Retention in the
Education for All Initiative.” New York. www.unicef.org/
innovations/files/fa2_nepal_welcome_to_school(1).doc.
Accessed 14 October 2016.
———. 2011. “Children’s Vulnerability to Climate Change
and Disaster Impacts in East Asia and the Pacific.” UNICEF
East Asia and Pacific Regional Office, Bangkok. www.
unicef.org/environment/files/Climate_Change_Regional_
Report_14_Nov_final.pdf. Accessed 26 October 2016.
———. 2014a. Ending Child Marriage: Progress and
Prospects. New York. www.unicef.org/media/files/Child_
Marriage_Report_7_17_LR..pdf. Accessed 23 August 2016
———. 2014b. A Statistical Snapshot of Violence against
Adolescent Girls. New York. www.unicef.org/publications/
files/A_Statistical_Snapshot_of_Violence_Against_
Adolescent_Girls.pdf. Accessed 25 August 2016.
———. 2016a. “Female Genital Mutilation/Cutting: A
Global Concern.” New York. www.unicef.org/media/
files/FGMC_2016_brochure_final_UNICEF_SPREAD.pdf.
Accessed 26 August 2016.
———. 2016b. “Multiple Indicator Cluster Surveys.” New
York. http://mics.unicef.org. Accessed 15 July 2016.
———. 2016c. State of the World’s Children 2016: A Fair
Chance for Every Child. New York. www.unicef.org/
publications/files/UNICEF_SOWC_2016.pdf. Accessed 24
August 2016.
———. 2016d. “UNICEF Data: Monitoring the Situation of
Children and Women.” New York. http://data.unicef.org/
child-protection/child-marriage.html. Accessed 27 October
2016.
———. 2016e. Uprooted: The Growing Crisis of Migrant
Children. New York. www.unicef.org/publications/files/
Uprooted_growing_crisis_for_refugee_and_migrant_
children.pdf. Accessed 11 October 2016.
UNICEF (United Nations Children’s Fund) and World
Bank. 2016. “Ending Extreme Poverty: A Focus on
Children.” New York. www.unicef.org/publications/
files/Ending_Extreme_Poverty_A_Focus_on_Children_
Oct_2016.pdf. Accessed 11 October 2016.
UNISDR (United Nations Office for Disaster Risk
Reduction). 2015. Global Assessment Report on Disaster
Risk Reduction 2015: Making Development Sustainable:
The Future of Disaster Risk Management. Geneva. www.
preventionweb.net/english/hyogo/gar/2015/en/gar-pdf/
GAR2015_EN.pdf. Accessed 11 October 2016.
References | 185](https://image.slidesharecdn.com/humandevelopmentreport2016humandevelopmentforeveryone-170622191653/85/Human-Development-Report-2016-199-320.jpg)
![———. 2015a. “5 Ways to Reduce the Drivers of Climate
Change.” Washington, DC. www.worldbank.org/en/news/
feature/2015/03/18/5-ways-reduce-drivers-climate-
change?cid=CCG_TTccgEN_D_EXT. Accessed 7 November
2016.
———. 2015b. “Boosting the Health of Toddlers’ Bodies
and Brains Brings Multiple Benefits: But Too Often the
Wrong Methods Are Used.” Washington, DC. www.
worldbank.org/en/topic/earlychildhooddevelopment/
overview. Accessed 7 November 2016.
———. 2015c. “Dominican Republic: Integrated Social
Protection and Promotion Project.” Report PAD1070.
Washington, DC.
———. 2015d. Ending Poverty and Hunger by 2030:
An Agenda for the Global Food System. Washington,
DC. http://documents.worldbank.org/curated/
en/700061468334490682/pdf/95768-REVISED-WP-
PUBLIC-Box391467B-Ending-Poverty-and-Hunger-by-2030-
FINAL.pdf. Accessed 26 October 2016.
———. 2015e. “Overview.” 22 December. Washington, DC.
www.worldbank.org/en/topic/earlychildhooddevelopment/
overview. Accessed 7 November 2016.
———. 2015f. “Philippines: CCT Proven to Keep Poor
Children Healthy and in School.” Press release, 23
September. Washington, DC. www.worldbank.org/en/
news/press-release/2015/09/23/philippines-cct-proven-
to-keep-poor-children-healthy-and-in-school. Accessed 7
November 2016.
———. 2015g. “Urban Development: Overview.” 10
October. Washington, DC. www.worldbank.org/en/topic/
urbandevelopment/overview. Accessed 11 October 2016.
———. 2015h. Women, Business and the Law 2016:
Getting to Equal. Washington, DC. http://wbl.worldbank.
org/~/media/WBG/WBL/Documents/Reports/2016/
Women-Business-and-the-Law-2016.pdf. Accessed 14
October 2016.
———. 2015i. World Development Report 2015: Mind,
Society, and Behavior. Washington, DC.
———. 2016a. “Climate-Driven Water Scarcity Could Hit
Economic Growth by Up to 6 Percent in Some Regions,
Says World Bank.” Press release, 3 May. www.worldbank.
org/en/news/press-release/2016/05/03/climate-driven-
water-scarcity-could-hit-economic-growth-by-up-to-
6-percent-in-some-regions-says-world-bank. Accessed 14
October 2016.
———. 2016b. “Drug-Resistant Infections: A Threat to Our
Economic Future.” Discussion Draft. Washington, DC.
http://pubdocs.worldbank.org/en/527731474225046104/
AMR-Discussion-Draft-Sept18updated.pdf. Accessed 14
October 2016.
———. 2016c. “The Economic Effects of War and
Peace.” MENA Quarterly Economic Brief 6. Washington,
DC. http://documents.worldbank.org/curated/
en/644191468191061975/pdf/103013-REPLACEMENT-
PUBLIC-MENA-QEB-ISSUE-6-JANUARY-2016.pdf.
Accessed 14 October 2016.
———. 2016d. “Eight Stubborn Facts about Housing
Policies.” Washington, DC. http://blogs.worldbank.org/
sustainablecities/eight-stubborn-facts-about-housing-
policies. Accessed 11 October 2016.
———. 2016e. “High-Technology Exports (Current US$).”
Washington, DC. http://data.worldbank.org/indicator/
TX.VAL.TECH.CD. Accessed 4 December 2016.
———. 2016f. “I4D, Identification for Development:
Strategic Framework.” 25 January. Washington, DC.
http://pubdocs.worldbank.org/en/21571460567481655/
April-2016-ID4D-Strategic-RoadmapID4D.pdf. Accessed 7
November 2016.
———. 2016g. “Living Standards Measurement Study.”
Washington, DC. http://go.worldbank.org/IPLXWMCNJ0.
Accessed 7 November 2016.
———. 2016h. “Personal Remittances, Received (% of
GDP).” http://data.worldbank.org/indicator/BX.TRF.PWKR.
DT.GD.ZS. Accessed 2 November 2016.
———. 2016i. Poverty and Shared Prosperity 2016: Taking
on Inequality. Washington, DC. www.worldbank.org/en/
publication/poverty-and-shared-prosperity. Accessed 22
November 2016.
———. 2016j. “Pricing Carbon.” Washington, DC. www.
worldbank.org/en/programs/pricing-carbon. Accessed 7
November 2016.
———. 2016k. “Remittances to Developing Countries
Edge Up Slightly in 2015.” Press release, 13 April.
Washington, DC. www.worldbank.org/en/news/press-
release/2016/04/13/remittances-to-developing-countries-
edge-up-slightly-in-2015. Accessed 7 November 2016.
———. 2016l. “Urban Violence: A Challenge of Epidemic
Proportions.” 6 September. Washington, DC. www.
worldbank.org/en/news/feature/2016/09/06/urban-
violence-a-challenge-of-epidemic-proportions. Accessed
11 October 2016.
———. 2016m. “World Bank Group Finances Top 8
Countries Voting Power.” Washington, DC. https://
finances.worldbank.org/Shareholder-Equity/Top-8-
countries-voting-power/udm3-vzz9/data. Accessed 5
December 2016.
———. 2016n. “World Bank Group: Forest Action Plan
FY16–20.” Washington, DC. http://documents.worldbank.
org/curated/en/240231467291388831/pdf/106467-
REVISED-v1-PUBLIC.pdf. Accessed 23 August 2016.
———. 2016o. World Development Indicators database.
Washington, DC. http://data.worldbank.org. Accessed
14 October 2016.
———. 2016p. World Development Report: Digital
Dividends. Washington, DC. www.worldbank.org/en/
publication/wdr2016. Accessed 22 November 2016.
———. 2017. PovcalNet [online database]. http://iresearch.
worldbank.org/PovcalNet/povDuplicateWB.aspx.
Accessed 5 December 2016.
World Bank and ECOFYS. 2016. “Carbon Pricing Watch
2016.” Washington, DC. https://openknowledge.
worldbank.org/handle/10986/24288. Accessed 26 August
2016.
World Bank and IHME (Institute for Health Metrics
and Evaluation). 2016. “The Cost of Air Pollution:
Strengthening the Economic Case for Action.”
Washington, DC. https://openknowledge.worldbank.
org/bitstream/handle/10986/25013/108141.
pdf?sequence=4isAllowed=y. Accessed 20 October 2016.
World Resources Institute. 2016. “The Roads to
Decoupling: 21 Countries Are Reducing Carbon Emissions
While Growing GDP.” www.wri.org/blog/2016/04/roads-
decoupling-21-countries-are-reducing-carbon-emissions-
while-growing-gdp. Accessed 26 September 2016.
WVSA (World Values Survey Association). 2016.
“Data and Documentation.” Institute for Comparative
Survey Research, Vienna. www.worldvaluessurvey.org/
WVSContents.jsp. Accessed 2 November 2016.
WWF-Korea. 2016. Korea Ecological Footprint Report 2016:
Measuring Korea’s Impact on Nature. Seoul.
Yi, I. 2012. “Economic and Social Development in the
Republic of Korea: Processes, Institutions and Actors.”
Research and Policy Brief 14. United Nations Research
Institute for Social Development, Geneva.
———. 2014. “How Could the Enhancement of Education
and Health Contribute to Economic Growth in South
Korea?” In I. Yi and T. Mkandawire, eds., Learning from
the South Korean Developmental Success: Effective
Developmental Cooperation and Synergistic Institutions
and Policies. London: Palgrave Macmillan UK.
Yi, I., C. Olive, H. Rhee and Y.-A. Chung. 2011. “The
Korean Experience within the Context of Development
Cooperation Effectiveness.” Presentation at the 5th Seoul
ODA International Conference, 13 Ocotober, Seoul.
Yi, l., O. Cocoman, Y.-A. Chung and H. Rhee. 2014.
“Effective Aid and Development Cooperation in South
Korea.” In I. Yi and T. Mkandawire, eds., Learning from
the South Korean Developmental Success: Effective
Development Cooperation and Synergistic Institutions and
Policies. London: Palgrave Macmillan UK.
Zimmer, C. 2016. “Ebola Evolved Into Deadlier Enemy during
the African Epidemic.” New York Times, 3 November.
www.nytimes.com/2016/11/04/science/ebola-evolution-
african-epidemic.html. Accessed 7 November 2016.
Zucman, G. 2015. The Hidden Wealth of Nations: The Scourge
of Tax Havens. Chicago, IL: University of Chicago Press.
188 | HUMAN DEVELOPMENT REPORT 2016](https://image.slidesharecdn.com/humandevelopmentreport2016humandevelopmentforeveryone-170622191653/85/Human-Development-Report-2016-202-320.jpg)


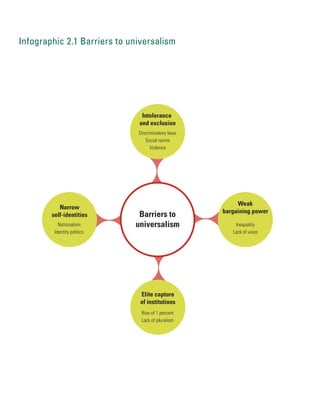
The 2016 Human Development Report examines human development for everyone. It discusses both the progress that has been made in human development over the past 25 years, as well as the challenges that remain in ensuring opportunities for a better life are available to all. While extreme poverty and hunger have declined globally, inequalities persist and some groups remain marginalized. The Report emphasizes the need to reach universal human development as called for in the 2030 Agenda for Sustainable Development by addressing barriers faced by disadvantaged populations and adopting inclusive policies at both national and global levels.


