Download to read offline


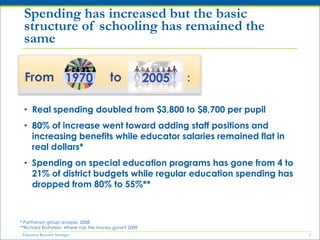
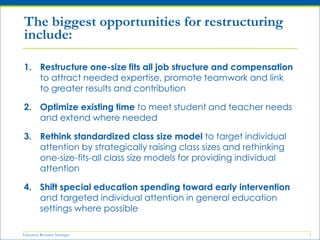
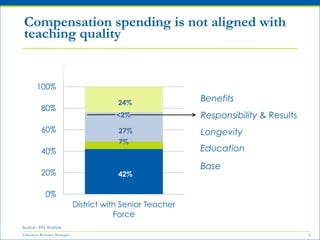
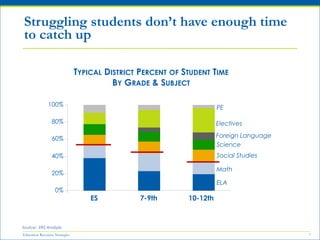
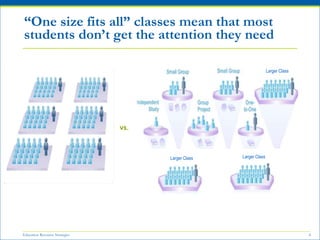
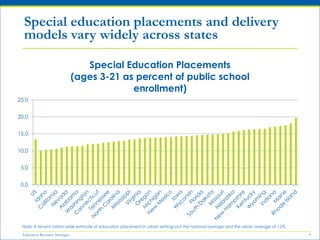
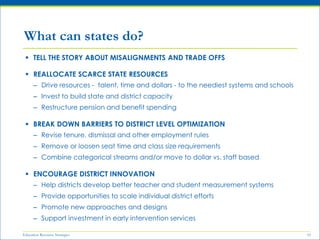

The document discusses misalignments in how K-12 education funding is currently spent and opportunities to restructure spending to better support student success. Specifically: 1. Spending has doubled since 1970 but the basic school structure has not changed, with 80% of increased funds going to staffing rather than other priorities. 2. Job structures, compensation, and class sizes are "one-size-fits-all" but do not meet the needs of all students. Struggling students in particular do not get enough individual attention and time. 3. Special education placements and models vary widely between states despite serving similar percentages of students. The document argues states should reallocate resources to needier schools, break down


