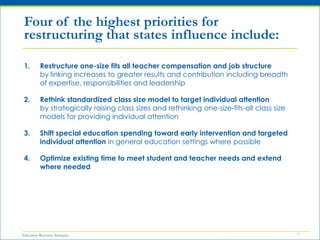
Transformation or DeclineHow can states promote restructuring in tough times?CCSSO Institute, July 18th, 2011
We are a non-profit firm dedicated to helping school systems spend and organize time, talent and technology to create great schools at scaleWe partner with system leaders to analyze spending, human resource, organization and student data to better align with high performance strategiesWe leverage insight from this work to provide lessons and tools for school leaders and those who support them Our work is grounded in over a decade of experience working with school districts across the country 2Education Resource Strategies
Restructuring Priorities			25 MinutesSchool Budget Hold ‘em Game		40 Minutes“Aha”s & Implications for Action		30 MinutesMitchell Chester, MARobert Hammond, COLillian Lowery, DEFrom Game to Reality			20 MinutesDiscussion with Tom Luna, ID3Agenda: An Interactive Exploration
4We know what it takes to create high performing schoolsStrategic School Design  Effective Teaching Teams
  Targeted Individual Attention
  Maximized, Flexible Academic TimeAligned Standards, Curriculum, & Assessments
5FUNDINGinequitable, unintelligible, rigidBut the school systems we have …TEACHING COMPENSATION & JOB STRUCTURE discourage effectivenessSCHOOL DESIGNantiquated schedules and staffingA FewHigh FliersINSTRUCTIONAL SUPPORTnot strategicLEADERSHIPunsupported, underinvestedCENTRAL OFFICE SERVICESinefficient, unresponsivePARTNERS & TECHNOLOGYunderleveraged
6FUNDINGequitable, transparent, and flexible Are not the school systems we needTEACHER COMPENSATION & JOB STRUCTURElinked to contributionSCHOOL DESIGNschedules and staffing match needsINSTRUCTIONAL SUPPORTstrategically alignedHigh-PerformingSchools at ScaleLEADERSHIPsupported and rewardedCENTRAL OFFICE SERVICESaccountable, efficientPARTNERS & TECHNOLOGYleveraged
Restructure one-size fits all teacher compensation and job structureby linking increases to greater results and contribution including breadth of expertise, responsibilities and leadershipRethink standardized class size model to target individual attention by strategically raising class sizes and rethinking one-size-fits-all class size models for providing individual attentionShift special education spending toward early intervention and targeted individual attention in general education settings where possibleOptimize existing time to meet student and teacher needs and extend where needed 7Four of the highest priorities for restructuring that states influence include:
8High-performing schools are about team, not just individual performanceDeliberate assignments to teaching teamEach school’s specificcurricular,faculty, andstudent needsSchool-based expert supportCollaborative planning timeFormative assessments
9Maximum Teacher Salary ComponentsERS Analysis  of partner and Aspen district salary structuresTypical DistrictMaximum Teacher Salary =$90,000
Most districts devote less than 2% of all teacher compensation spending to reward increased teacher contribution or performance$500 million$350 millionSenior Teacher ForceMore balanced Teacher Force10
Stop or reduce increases for steps and credits to redirect compensation spending toward increased responsibilities and contributionActively manage low performers out of the system using existing evaluation toolsRevise compensation structures to link pay to increases in responsibility and contribution as well as individual resultsRevise work rules to insure flexibility in teacher assignment to match team and school needs11What can be done to optimize compensation spending?Start NowBuild Toward
12Most districts have opportunities to strategically raise class size in upper gradesSource: Elementary Grades Homeroom file Oct 2009; Includes elementary schools and K-8 schools (grades K0-5); excludes classes that are special ed 60%+, ELL 60%+; includes Advanced Work classes; excludes schools with Two-Way bilingual program; excludes classes with “mixed” grade (mainly due to teacher data NA)
13…and to target class sizes to priority subjects and studentsIn these districts class sizes for core subjects are higher than non-core*Core class defined as ELA, Math, Science, Social Studies; Non-core defined as Art, Computer Literacy, Vocational, Foreign LanguageSource: District A and B 9th and 12th grade course data (internal – Resource Mapping presentation)
Districts have more teaching staff, but use them for specialist positions outside of the core classroom and planning during the dayGeneral Education Class Size versus Student-Teacher Ratio14
15A cycle of isolation and specialization pulls students with additional needs out of regular education classroomsLarge, diverse classesOverextended teachersRemove “problem” student fromclassroomCurrentStructure of SWD & ELL servicesProvide additional support:- Social services- Pull-out instructionAdministration to coordinate, monitor special servicesResources and responsibility move outside regular classroom
16Moving students into rigidly defined programs diverts dollars from early intervention and targeted small groups for all studentsNote:  Excluded are all district  Alternative/Adult schools. Sources: SY10 October enrollment, district  budget as of 10/09.  Excludes students who did not report; ELL includes those currently in programs, excludes students who opted-outPovertyIncrement
17Districts vary widely in how many students they place in special education settingsFY06: National ID rate: 9%*Rochester SWD enrollment includes all students with a designated category of disability.Source: ERS Benchmark Database, National data from U.S. DOE Programs, SDP Special Ed student data (PIMS); Self contained typically defined as 60% or more time in special education setting.
18What can be done to rethink one-size-fits-all class size model and redirect special education spending to targeted individual attention for all students?Highlight the class size vs. teacher quality trade-offStrategically raise class sizes in non-core classes and later gradesReview special education spending to reduce compliance spending and unplanned extra spending on subscale programsEncourage movement away from class size mandates in state regulations and contractsClarify rules on maintenance of effort spendingChampion revisions to special education funding that create incentives for more integrated servicesExplore improved ways to measure special education outcomesStart NowBuild Toward
19Many districts have an opportunity to optimize instructional time by lengthening the school day Sources: District figures are from Time and Attention in Urban High Schools: Lessons for School Systems (Frank, 2010) and from ERS analyses for the Aspen CFO network.  Leading Edge school figures are from Shields, R. A., and K. H. Miles. 2008. Strategic Designs: Lessons from Leading Edge Small Urban High Schools. Watertown, MA: Education Resource Strategies. Charter school figures are from The Boston Foundation report (May 2010) “Out of the Debate and Into the Schools.”National Avg. = 1170
20….and by varying time by grade and subjectTypical District Percent of Student Time By Grade & Subject 100%PE80%ElectivesForeign Language60%ScienceSocial Studies40%Math20%ELA0%ES7-9th10-12th
21By taking on tough choices, schools can move toward transformed practiceFor the same cost a typical 25,000 student urban district can:Reduce K-6 class size by 2Add 90 minutes of collaborative planning time  for all teachersORIncrease % SPED in HS by 2 percentage pointsInvest in 1 RTI Specialist for every 160 K-2 studentsORDouble the salary of the top 5% of teachersGive all teachers a 5% raiseORERS’ District Reallocation Modeler (DREAM)
Restructure compensation to link to individual and team contribution.Rethink standardized class size models to target individual attention.Use existing time better and extend time in critical areas to meet student needs.Redirect Special Education spending to early intervention and targeted individual attention in general education settings.Maximize use of buildings and facilities.Develop leadership capacity by redirecting spending from compliance and monitoring to support and training.Leverage technology & community partners.22Seven Tough Times Restructuring Priorities
The Object of the Game:  	Use the Hold’em cards provided to create a “hand” of investment and savings options to create a budget that moves toward improved district performance while still meeting a budget reduction target of 8%Step 1:  Assign Roles and Review Rules		5 minutesStep 2:  Read and Respond			10 minutesStep 3:  Review priorities & select investments 	10 minutesStep 4:  Select savings to finalize hand		5 minutesStep 5:  Discussion Questions: 			15 minutes23Time to Play the Game

Transformation or Decline: How can states promote restructuring in tough times?

  • 1.
    Transformation or DeclineHowcan states promote restructuring in tough times?CCSSO Institute, July 18th, 2011
  • 2.
    We are anon-profit firm dedicated to helping school systems spend and organize time, talent and technology to create great schools at scaleWe partner with system leaders to analyze spending, human resource, organization and student data to better align with high performance strategiesWe leverage insight from this work to provide lessons and tools for school leaders and those who support them Our work is grounded in over a decade of experience working with school districts across the country 2Education Resource Strategies
  • 3.
    Restructuring Priorities 25 MinutesSchoolBudget Hold ‘em Game 40 Minutes“Aha”s & Implications for Action 30 MinutesMitchell Chester, MARobert Hammond, COLillian Lowery, DEFrom Game to Reality 20 MinutesDiscussion with Tom Luna, ID3Agenda: An Interactive Exploration
  • 4.
    4We know whatit takes to create high performing schoolsStrategic School Design Effective Teaching Teams
  • 5.
    TargetedIndividual Attention
  • 6.
    Maximized,Flexible Academic TimeAligned Standards, Curriculum, & Assessments
  • 7.
    5FUNDINGinequitable, unintelligible, rigidButthe school systems we have …TEACHING COMPENSATION & JOB STRUCTURE discourage effectivenessSCHOOL DESIGNantiquated schedules and staffingA FewHigh FliersINSTRUCTIONAL SUPPORTnot strategicLEADERSHIPunsupported, underinvestedCENTRAL OFFICE SERVICESinefficient, unresponsivePARTNERS & TECHNOLOGYunderleveraged
  • 8.
    6FUNDINGequitable, transparent, andflexible Are not the school systems we needTEACHER COMPENSATION & JOB STRUCTURElinked to contributionSCHOOL DESIGNschedules and staffing match needsINSTRUCTIONAL SUPPORTstrategically alignedHigh-PerformingSchools at ScaleLEADERSHIPsupported and rewardedCENTRAL OFFICE SERVICESaccountable, efficientPARTNERS & TECHNOLOGYleveraged
  • 9.
    Restructure one-size fitsall teacher compensation and job structureby linking increases to greater results and contribution including breadth of expertise, responsibilities and leadershipRethink standardized class size model to target individual attention by strategically raising class sizes and rethinking one-size-fits-all class size models for providing individual attentionShift special education spending toward early intervention and targeted individual attention in general education settings where possibleOptimize existing time to meet student and teacher needs and extend where needed 7Four of the highest priorities for restructuring that states influence include:
  • 10.
    8High-performing schools areabout team, not just individual performanceDeliberate assignments to teaching teamEach school’s specificcurricular,faculty, andstudent needsSchool-based expert supportCollaborative planning timeFormative assessments
  • 11.
    9Maximum Teacher SalaryComponentsERS Analysis of partner and Aspen district salary structuresTypical DistrictMaximum Teacher Salary =$90,000
  • 12.
    Most districts devoteless than 2% of all teacher compensation spending to reward increased teacher contribution or performance$500 million$350 millionSenior Teacher ForceMore balanced Teacher Force10
  • 13.
    Stop or reduceincreases for steps and credits to redirect compensation spending toward increased responsibilities and contributionActively manage low performers out of the system using existing evaluation toolsRevise compensation structures to link pay to increases in responsibility and contribution as well as individual resultsRevise work rules to insure flexibility in teacher assignment to match team and school needs11What can be done to optimize compensation spending?Start NowBuild Toward
  • 14.
    12Most districts haveopportunities to strategically raise class size in upper gradesSource: Elementary Grades Homeroom file Oct 2009; Includes elementary schools and K-8 schools (grades K0-5); excludes classes that are special ed 60%+, ELL 60%+; includes Advanced Work classes; excludes schools with Two-Way bilingual program; excludes classes with “mixed” grade (mainly due to teacher data NA)
  • 15.
    13…and to targetclass sizes to priority subjects and studentsIn these districts class sizes for core subjects are higher than non-core*Core class defined as ELA, Math, Science, Social Studies; Non-core defined as Art, Computer Literacy, Vocational, Foreign LanguageSource: District A and B 9th and 12th grade course data (internal – Resource Mapping presentation)
  • 16.
    Districts have moreteaching staff, but use them for specialist positions outside of the core classroom and planning during the dayGeneral Education Class Size versus Student-Teacher Ratio14
  • 17.
    15A cycle ofisolation and specialization pulls students with additional needs out of regular education classroomsLarge, diverse classesOverextended teachersRemove “problem” student fromclassroomCurrentStructure of SWD & ELL servicesProvide additional support:- Social services- Pull-out instructionAdministration to coordinate, monitor special servicesResources and responsibility move outside regular classroom
  • 18.
    16Moving students intorigidly defined programs diverts dollars from early intervention and targeted small groups for all studentsNote: Excluded are all district Alternative/Adult schools. Sources: SY10 October enrollment, district budget as of 10/09. Excludes students who did not report; ELL includes those currently in programs, excludes students who opted-outPovertyIncrement
  • 19.
    17Districts vary widelyin how many students they place in special education settingsFY06: National ID rate: 9%*Rochester SWD enrollment includes all students with a designated category of disability.Source: ERS Benchmark Database, National data from U.S. DOE Programs, SDP Special Ed student data (PIMS); Self contained typically defined as 60% or more time in special education setting.
  • 20.
    18What can bedone to rethink one-size-fits-all class size model and redirect special education spending to targeted individual attention for all students?Highlight the class size vs. teacher quality trade-offStrategically raise class sizes in non-core classes and later gradesReview special education spending to reduce compliance spending and unplanned extra spending on subscale programsEncourage movement away from class size mandates in state regulations and contractsClarify rules on maintenance of effort spendingChampion revisions to special education funding that create incentives for more integrated servicesExplore improved ways to measure special education outcomesStart NowBuild Toward
  • 21.
    19Many districts havean opportunity to optimize instructional time by lengthening the school day Sources: District figures are from Time and Attention in Urban High Schools: Lessons for School Systems (Frank, 2010) and from ERS analyses for the Aspen CFO network. Leading Edge school figures are from Shields, R. A., and K. H. Miles. 2008. Strategic Designs: Lessons from Leading Edge Small Urban High Schools. Watertown, MA: Education Resource Strategies. Charter school figures are from The Boston Foundation report (May 2010) “Out of the Debate and Into the Schools.”National Avg. = 1170
  • 22.
    20….and by varyingtime by grade and subjectTypical District Percent of Student Time By Grade & Subject 100%PE80%ElectivesForeign Language60%ScienceSocial Studies40%Math20%ELA0%ES7-9th10-12th
  • 23.
    21By taking ontough choices, schools can move toward transformed practiceFor the same cost a typical 25,000 student urban district can:Reduce K-6 class size by 2Add 90 minutes of collaborative planning time for all teachersORIncrease % SPED in HS by 2 percentage pointsInvest in 1 RTI Specialist for every 160 K-2 studentsORDouble the salary of the top 5% of teachersGive all teachers a 5% raiseORERS’ District Reallocation Modeler (DREAM)
  • 24.
    Restructure compensation tolink to individual and team contribution.Rethink standardized class size models to target individual attention.Use existing time better and extend time in critical areas to meet student needs.Redirect Special Education spending to early intervention and targeted individual attention in general education settings.Maximize use of buildings and facilities.Develop leadership capacity by redirecting spending from compliance and monitoring to support and training.Leverage technology & community partners.22Seven Tough Times Restructuring Priorities
  • 25.
    The Object ofthe Game: Use the Hold’em cards provided to create a “hand” of investment and savings options to create a budget that moves toward improved district performance while still meeting a budget reduction target of 8%Step 1: Assign Roles and Review Rules 5 minutesStep 2: Read and Respond 10 minutesStep 3: Review priorities & select investments 10 minutesStep 4: Select savings to finalize hand 5 minutesStep 5: Discussion Questions: 15 minutes23Time to Play the Game

Editor's Notes

  • #2 Title Page Example
  • #3 Source: ERS Library SlidesJDAUG08Location: \\\\Minerva\\ers_data\\Internal ERS\\Slide Library Documents\\1-ERS Slides
  • #17 Source file: BPS budget; tab=Weights FA