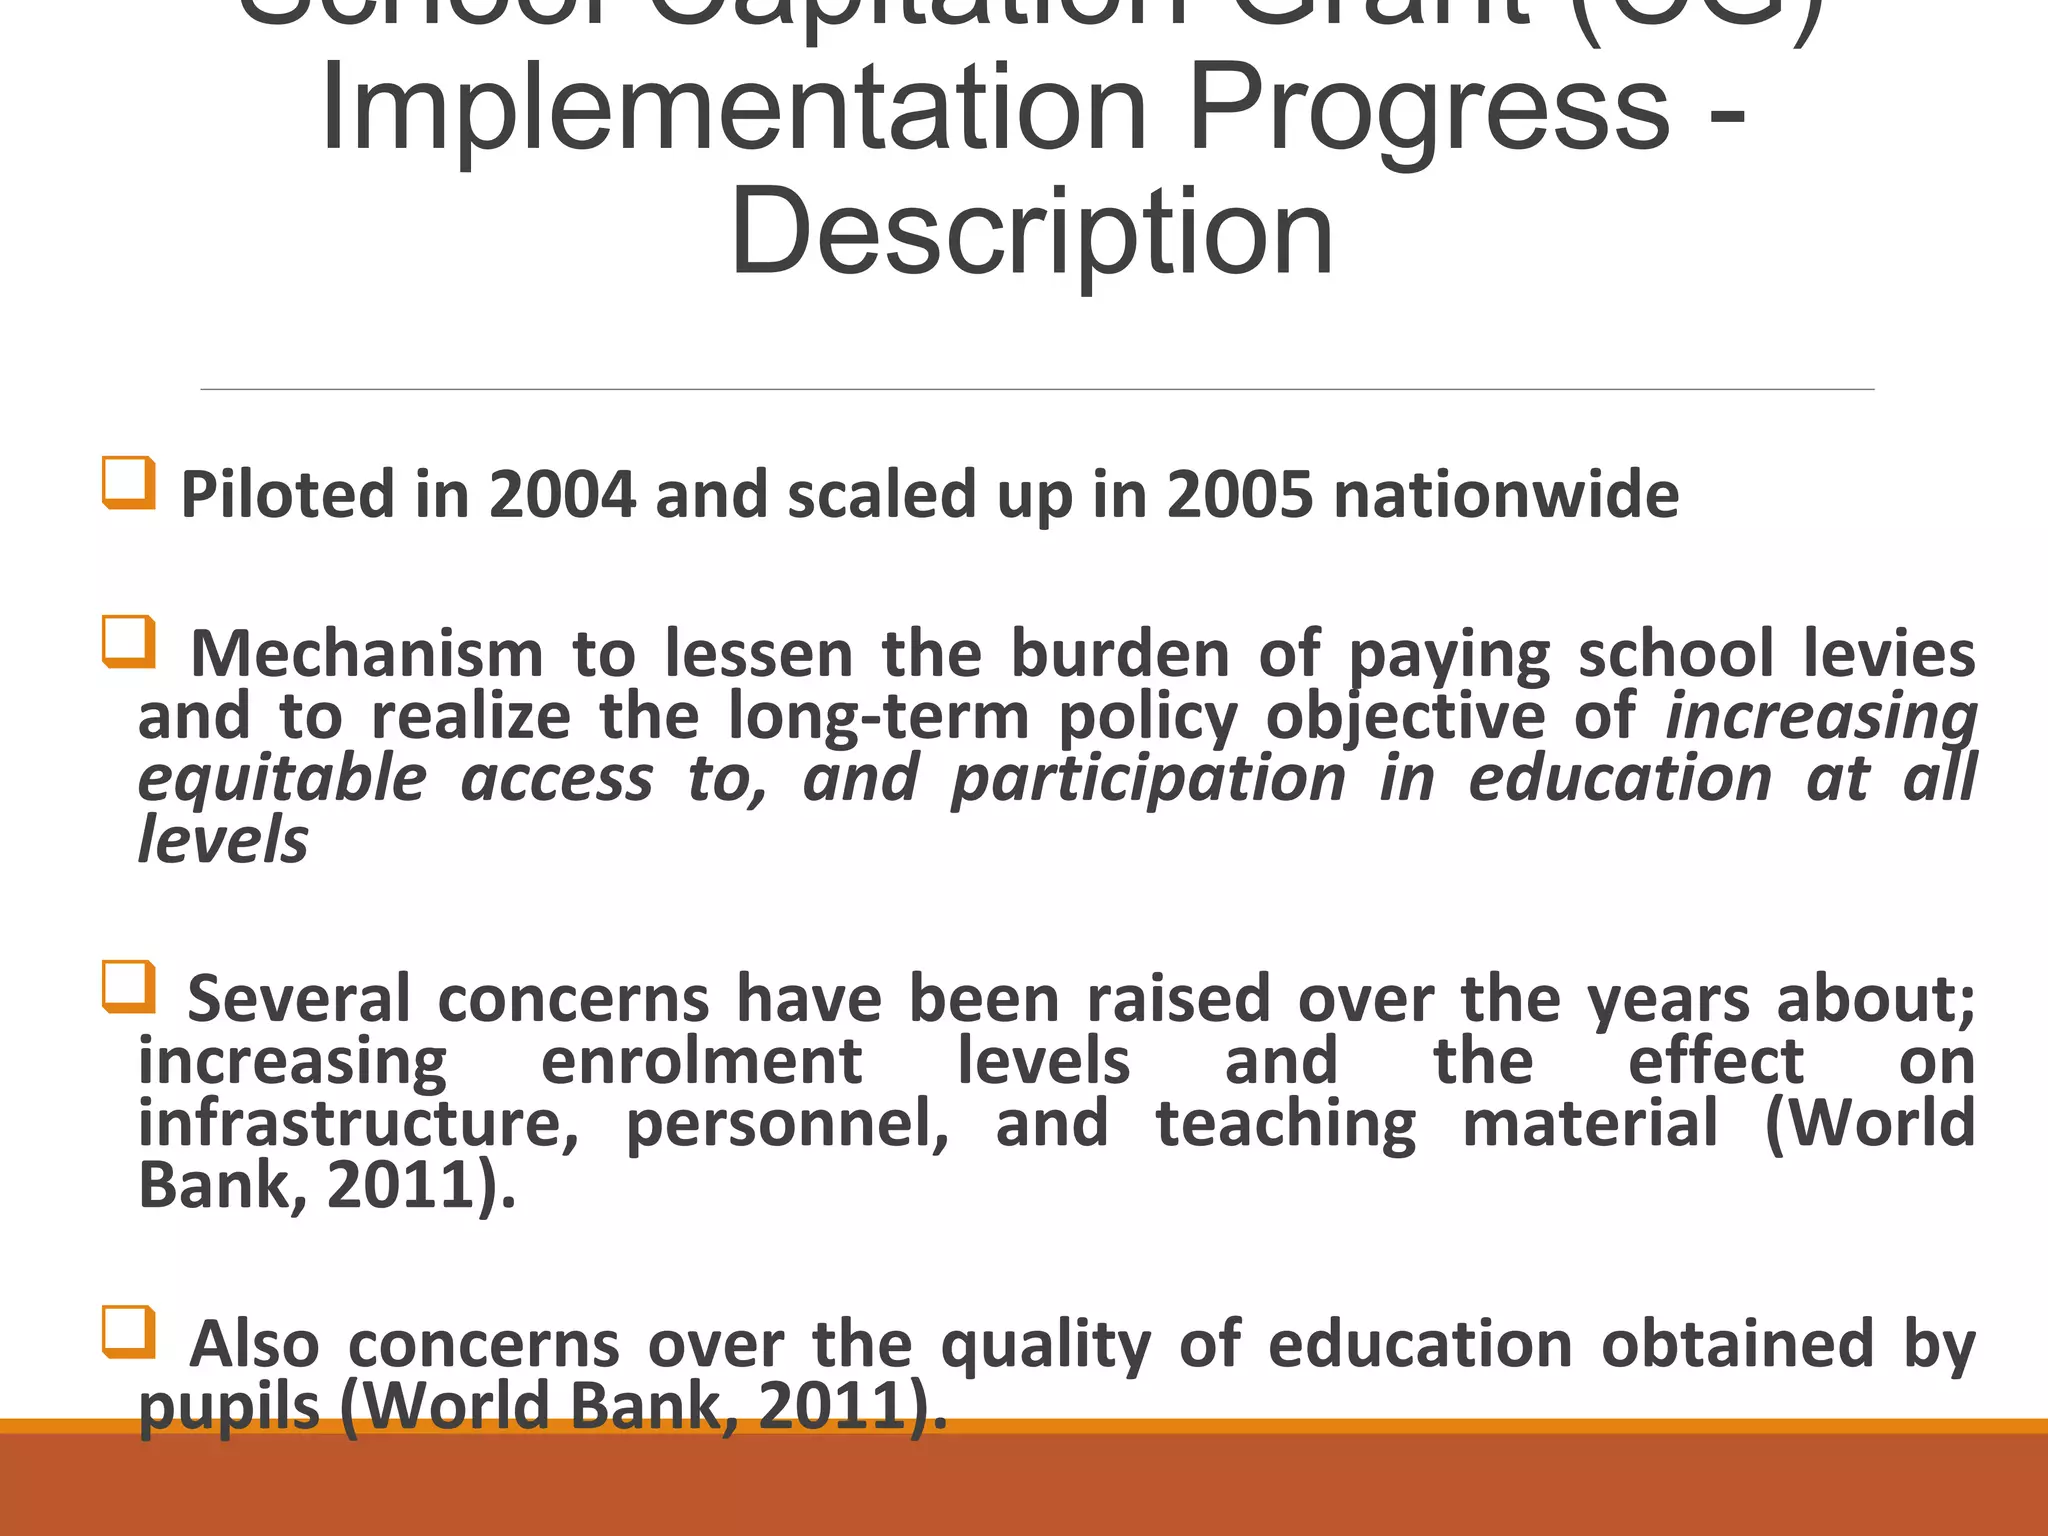
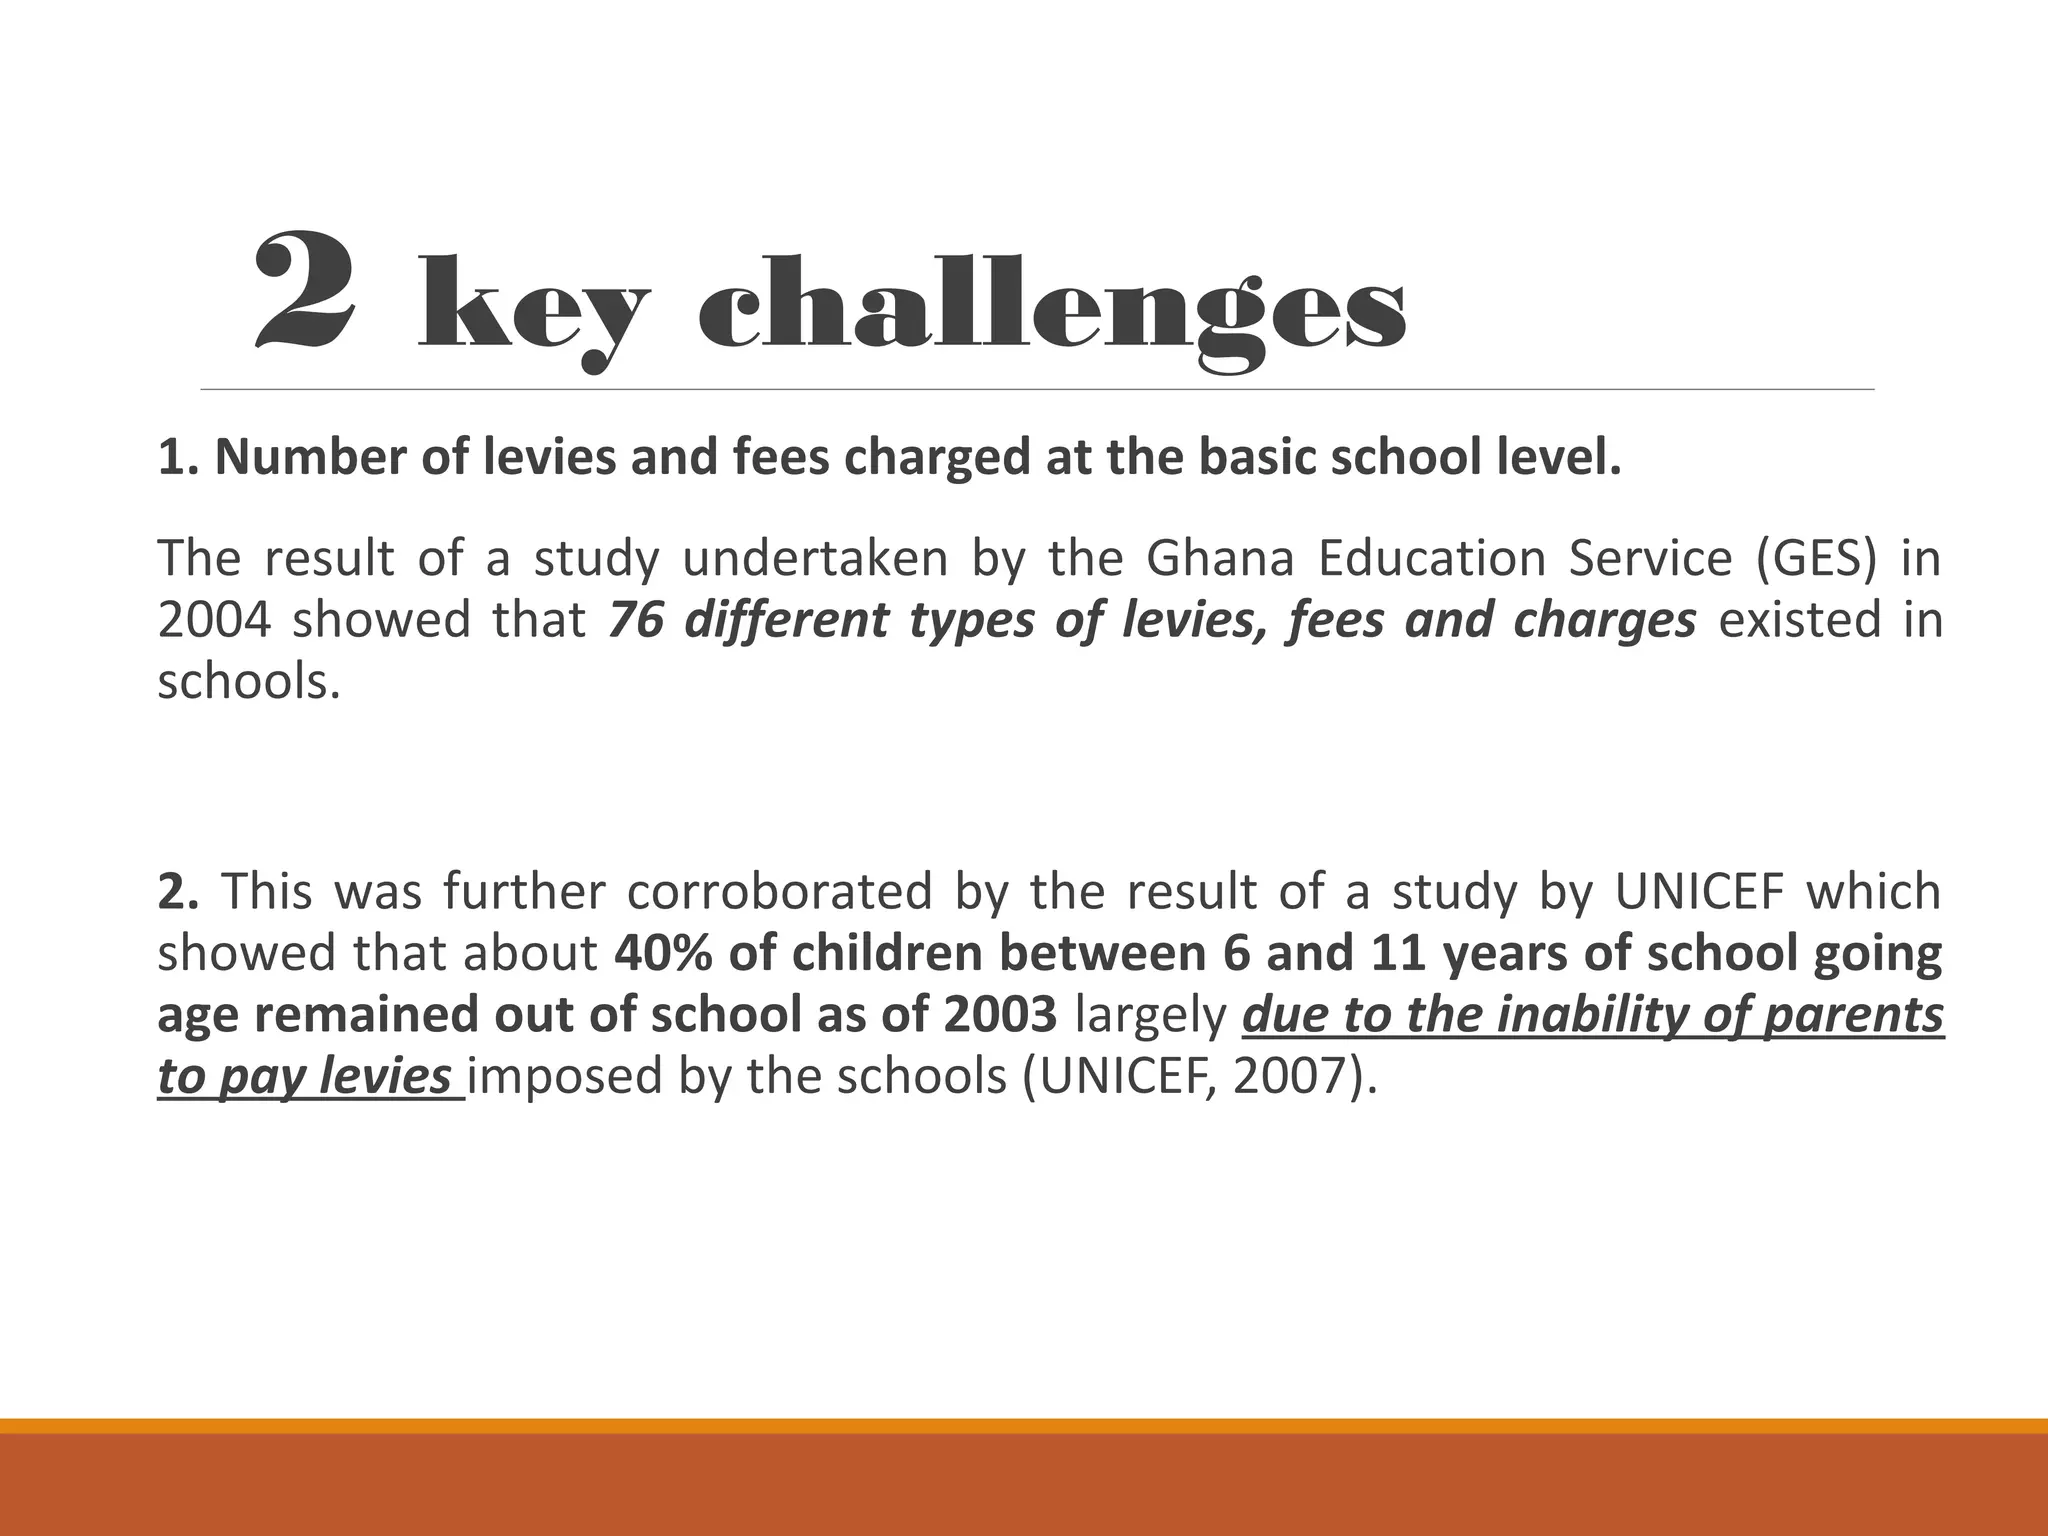
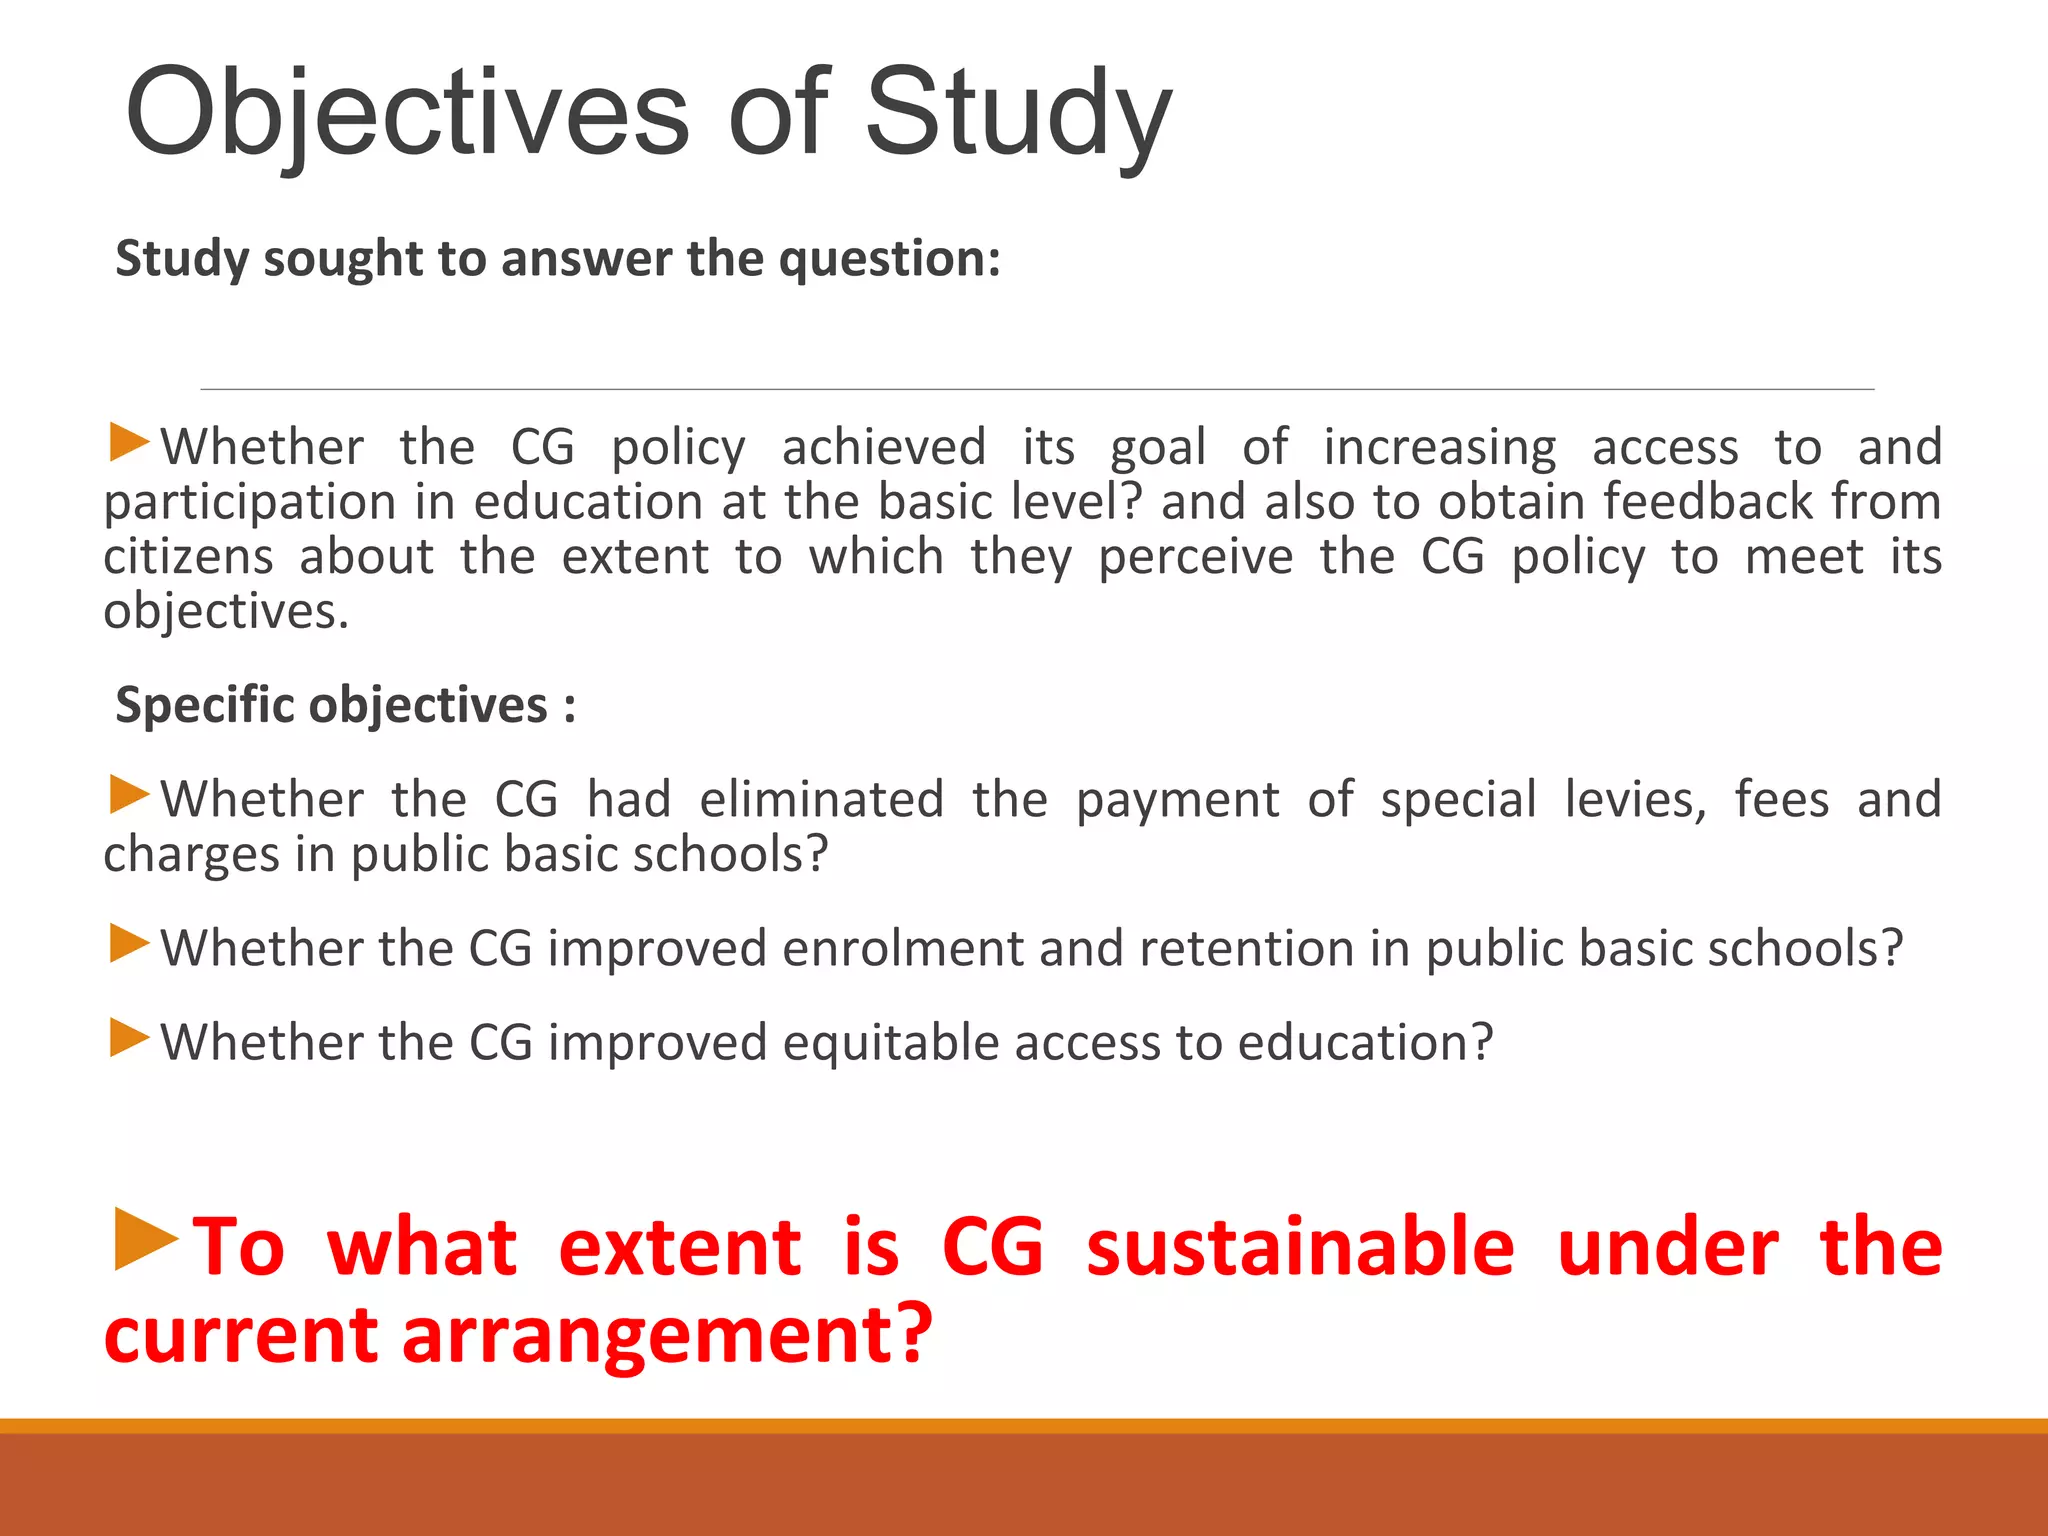
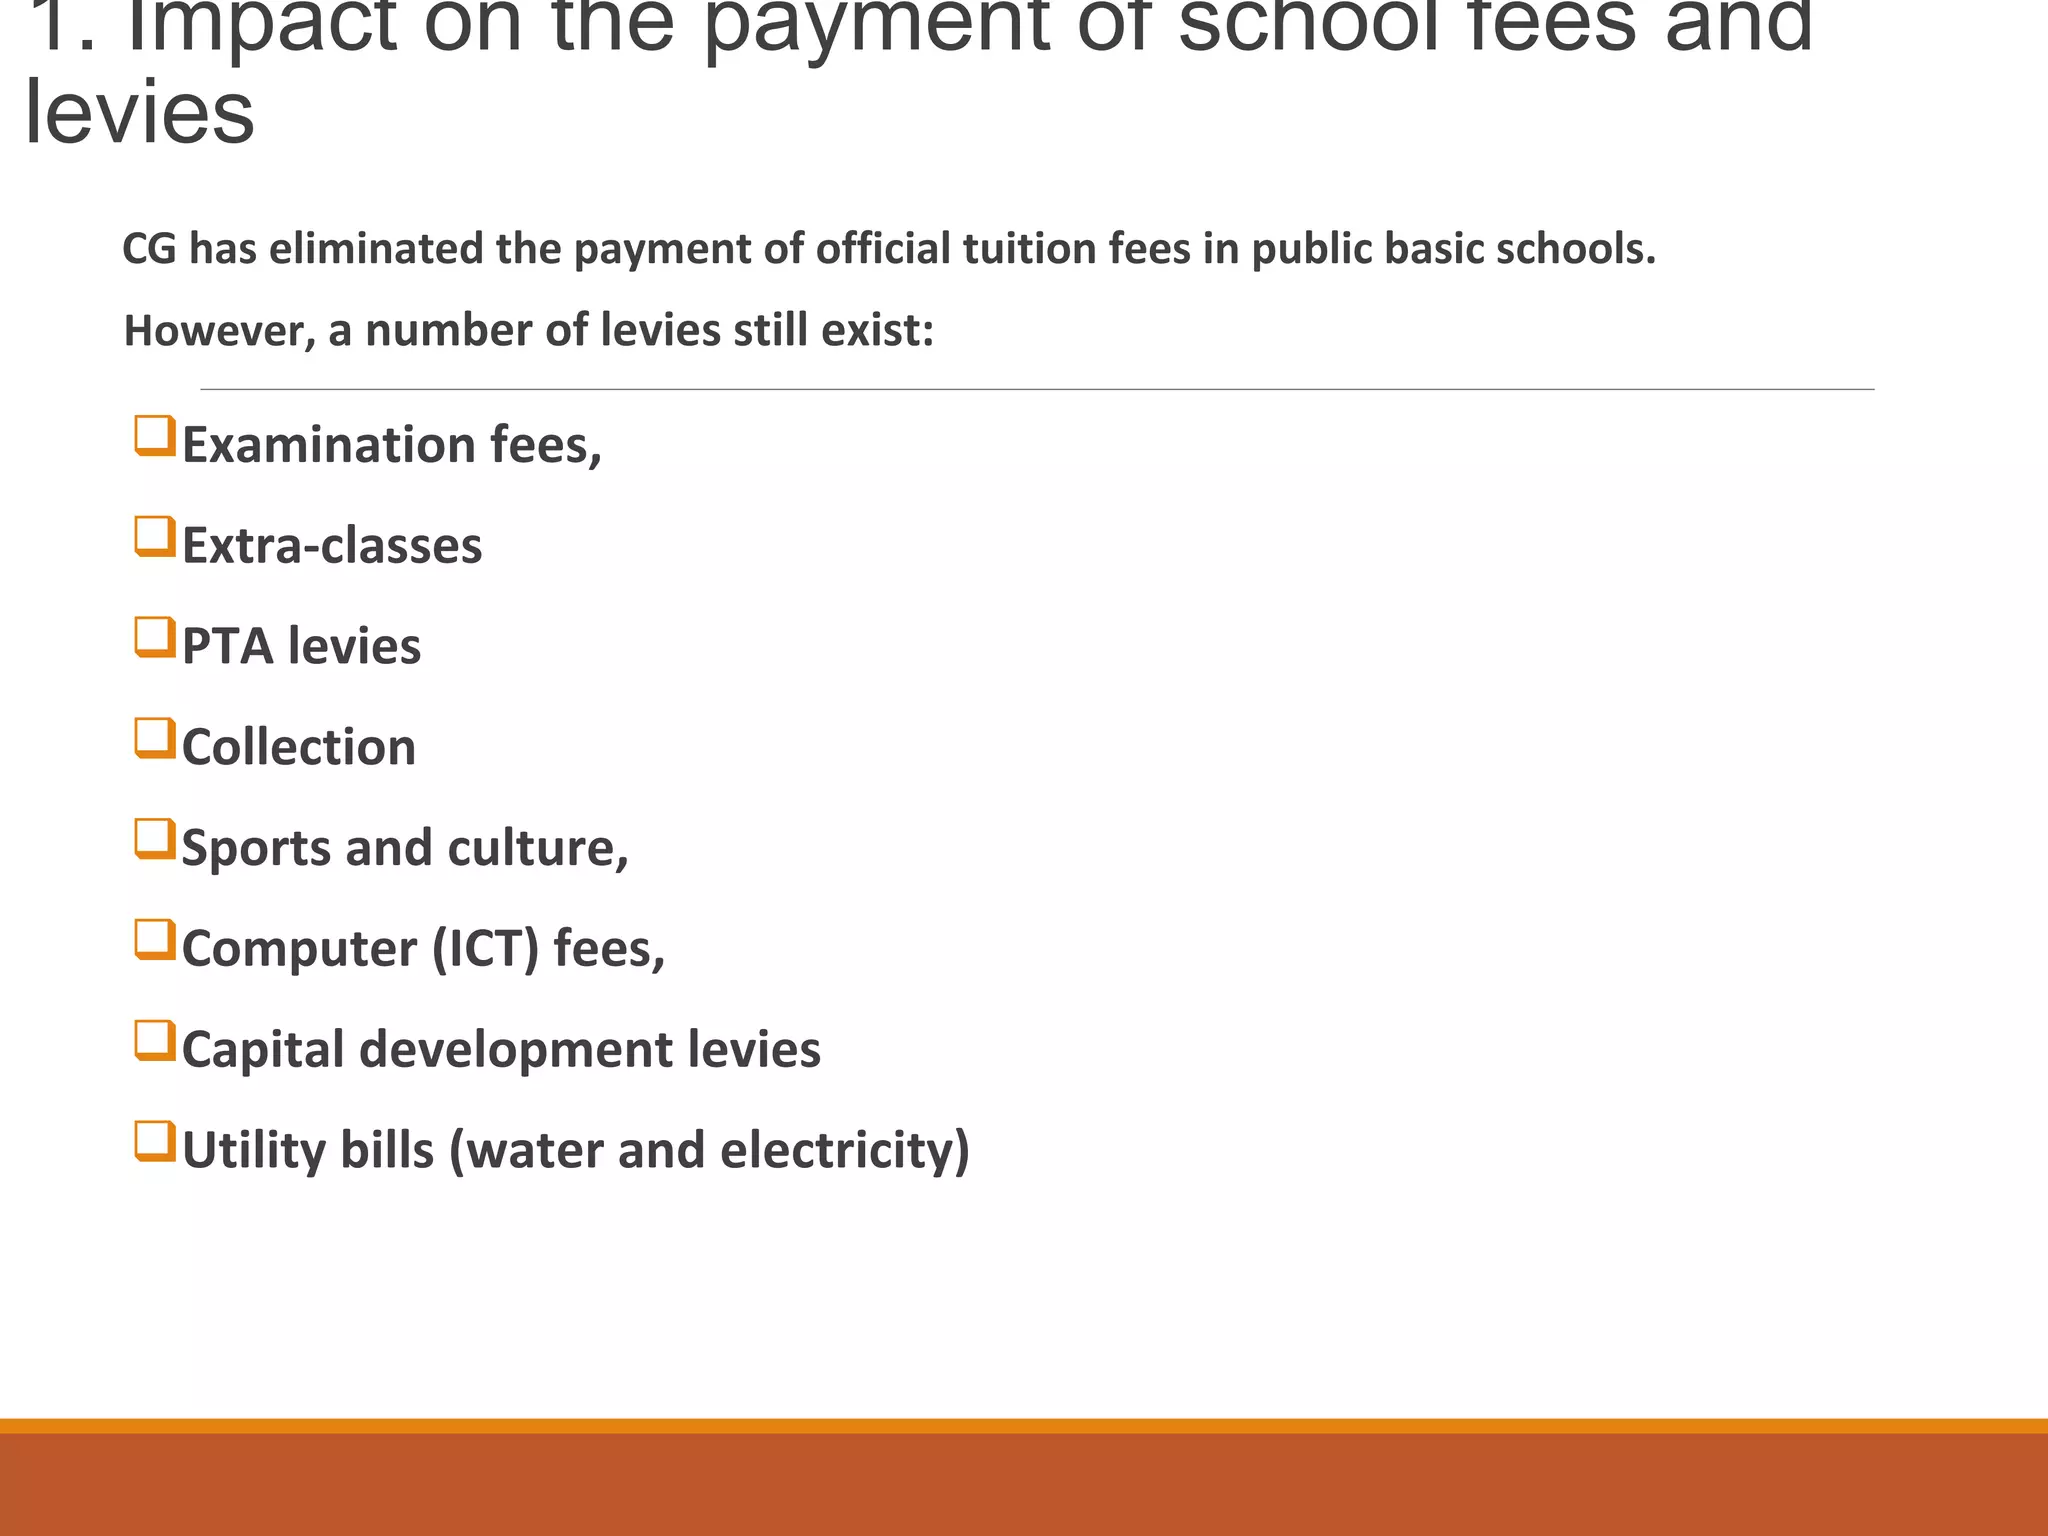
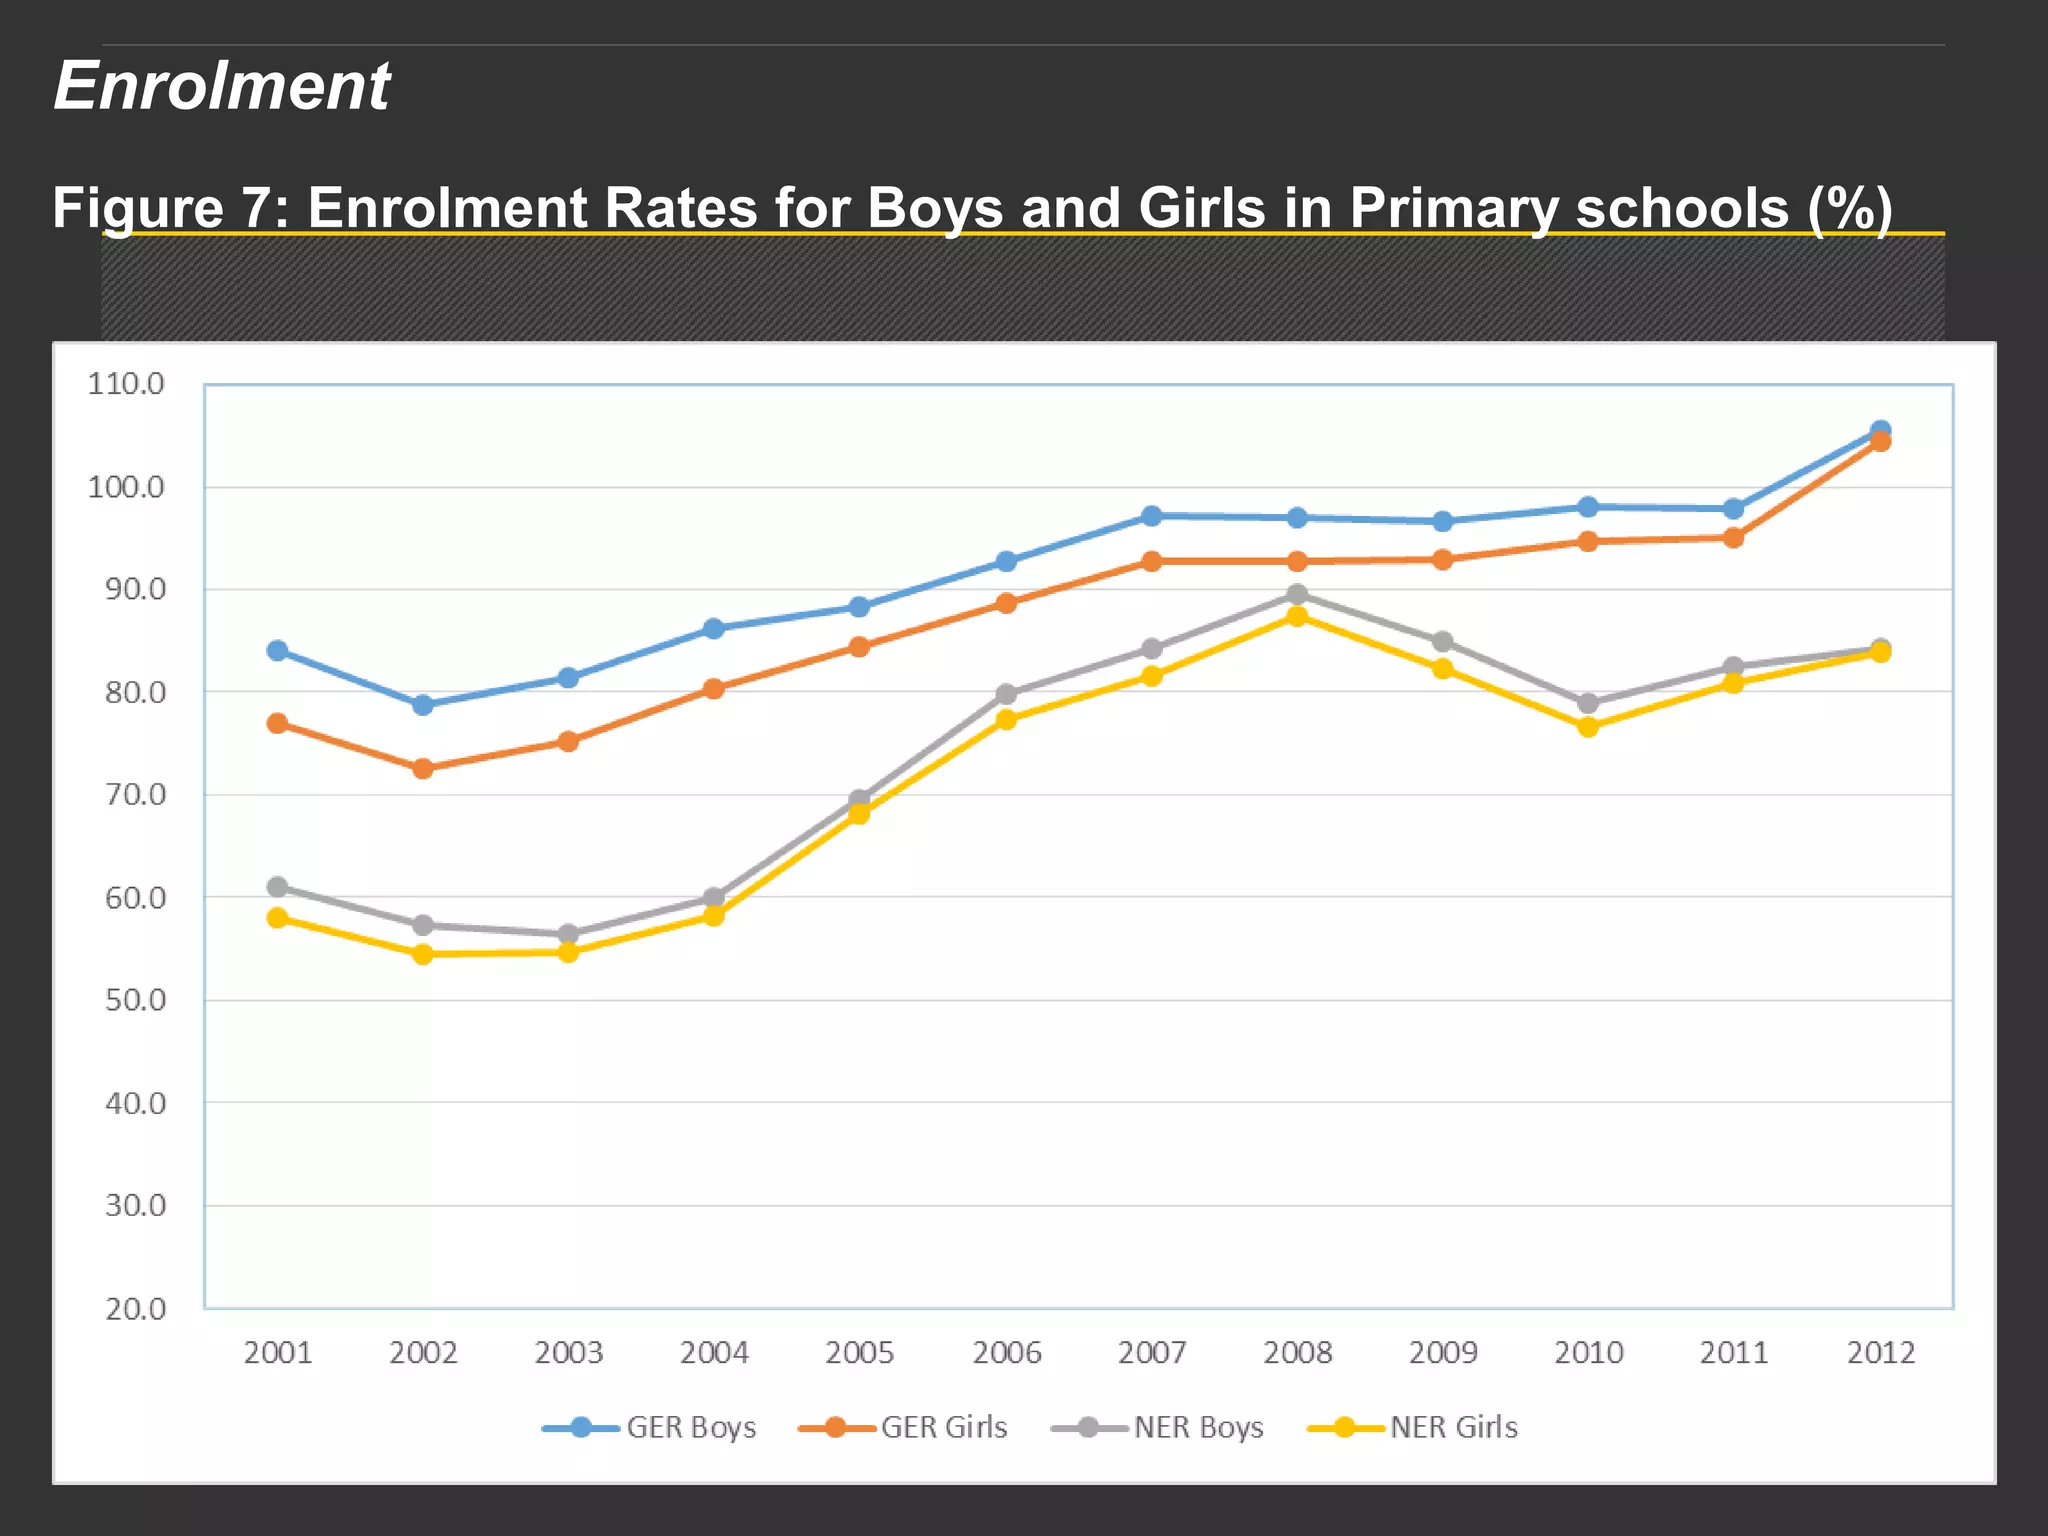
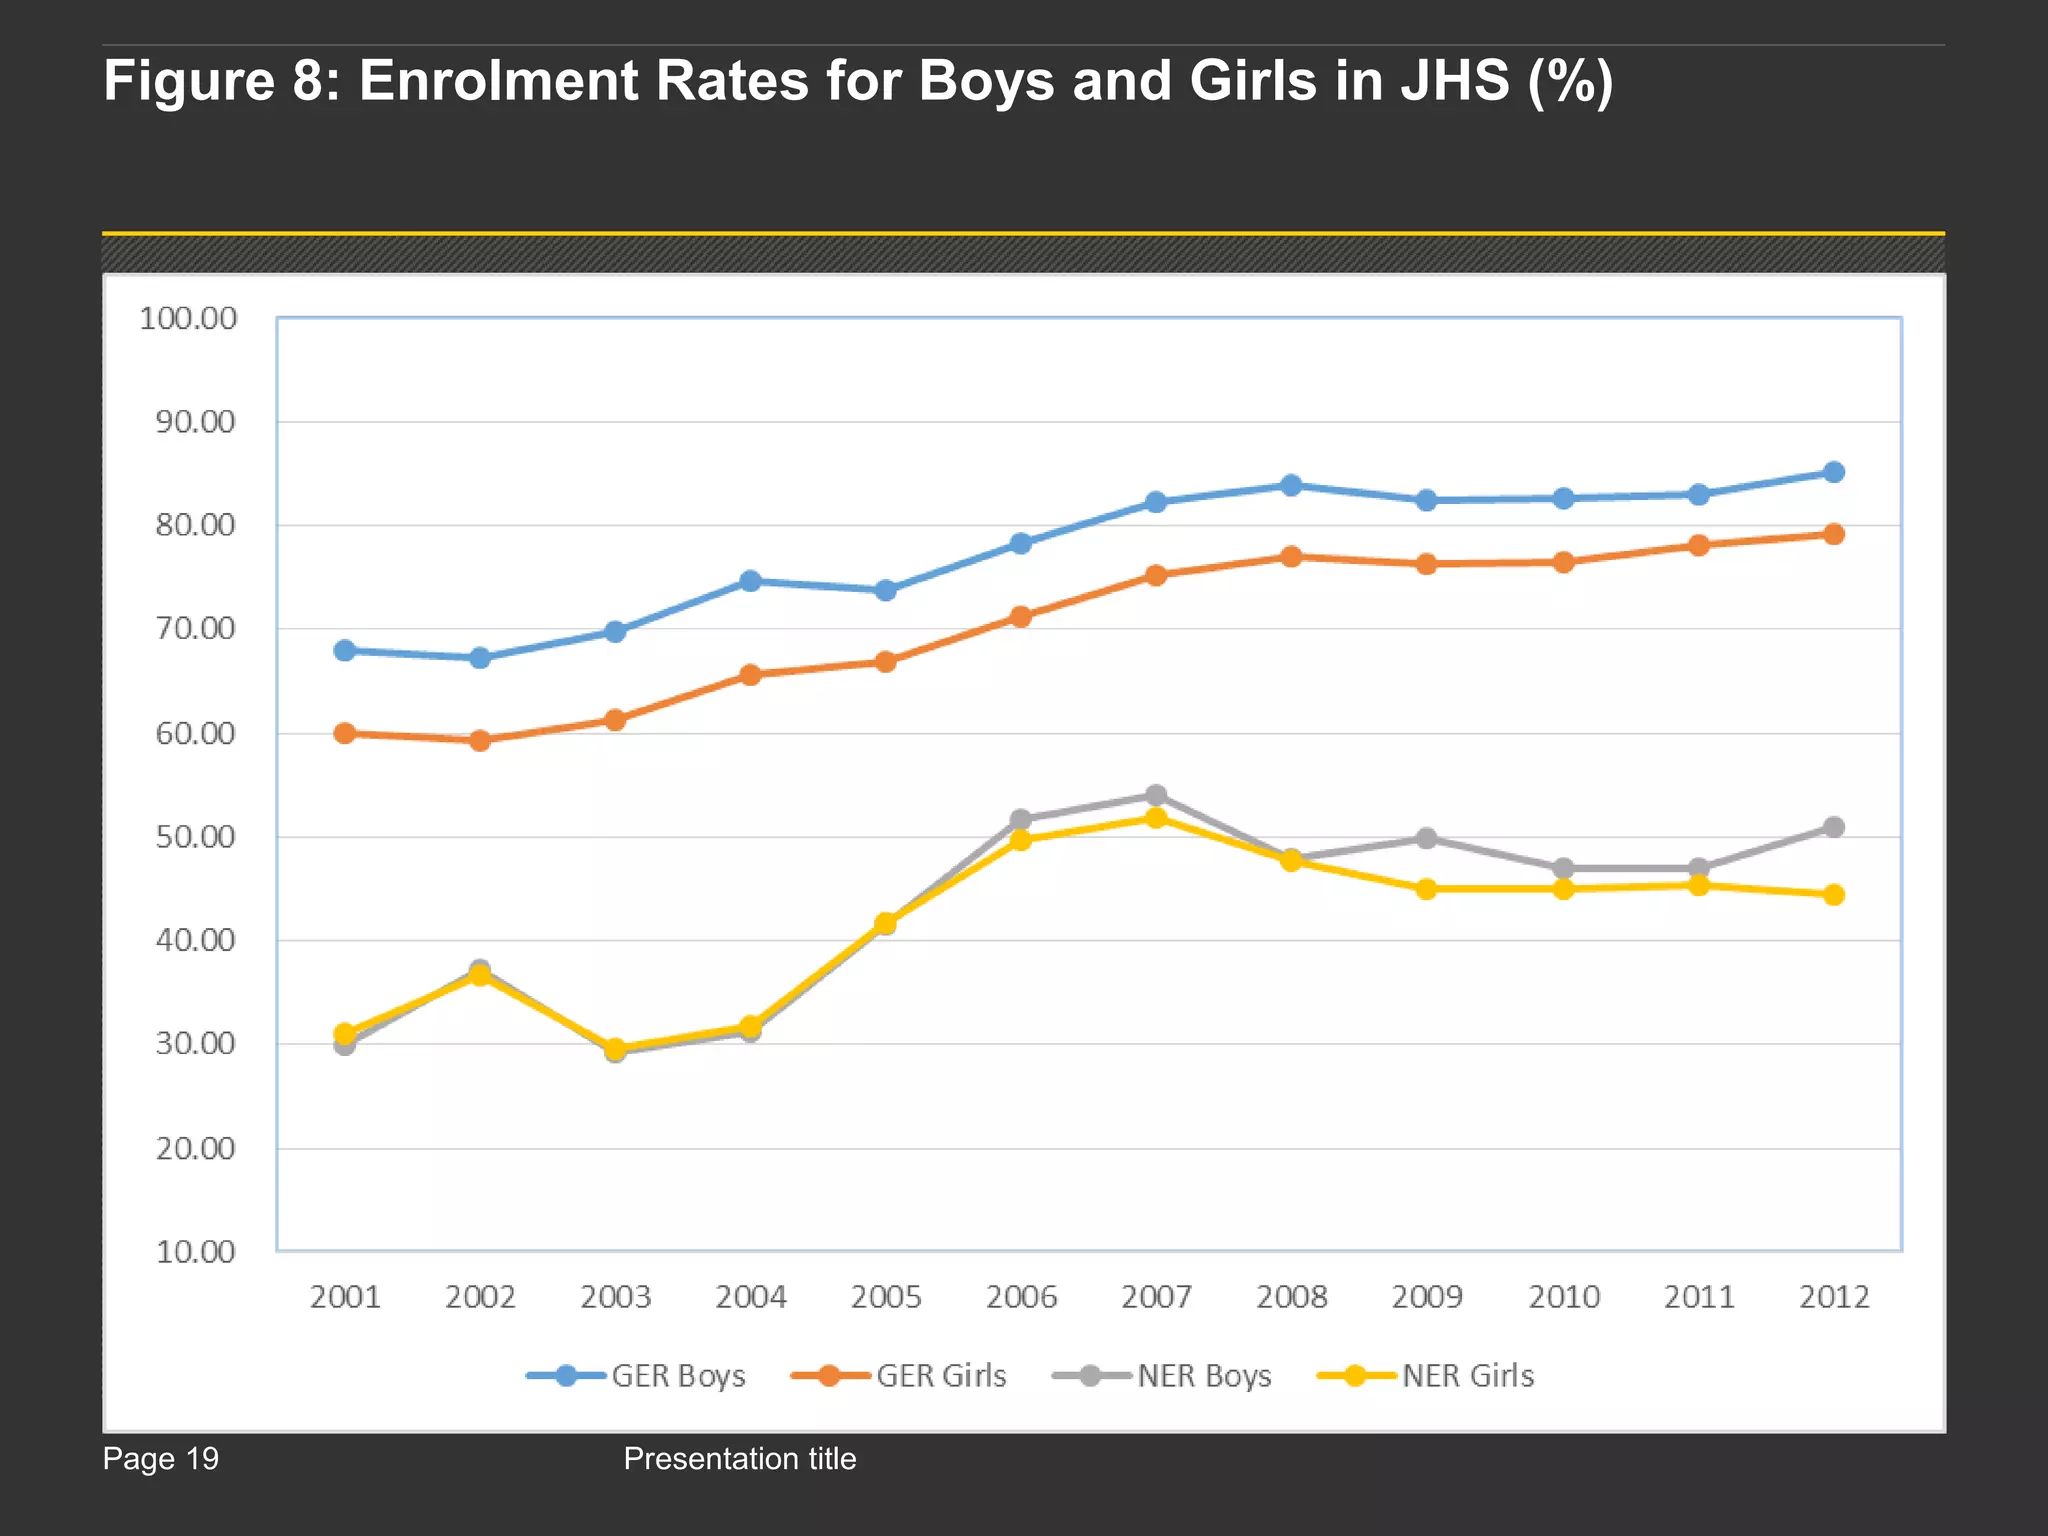
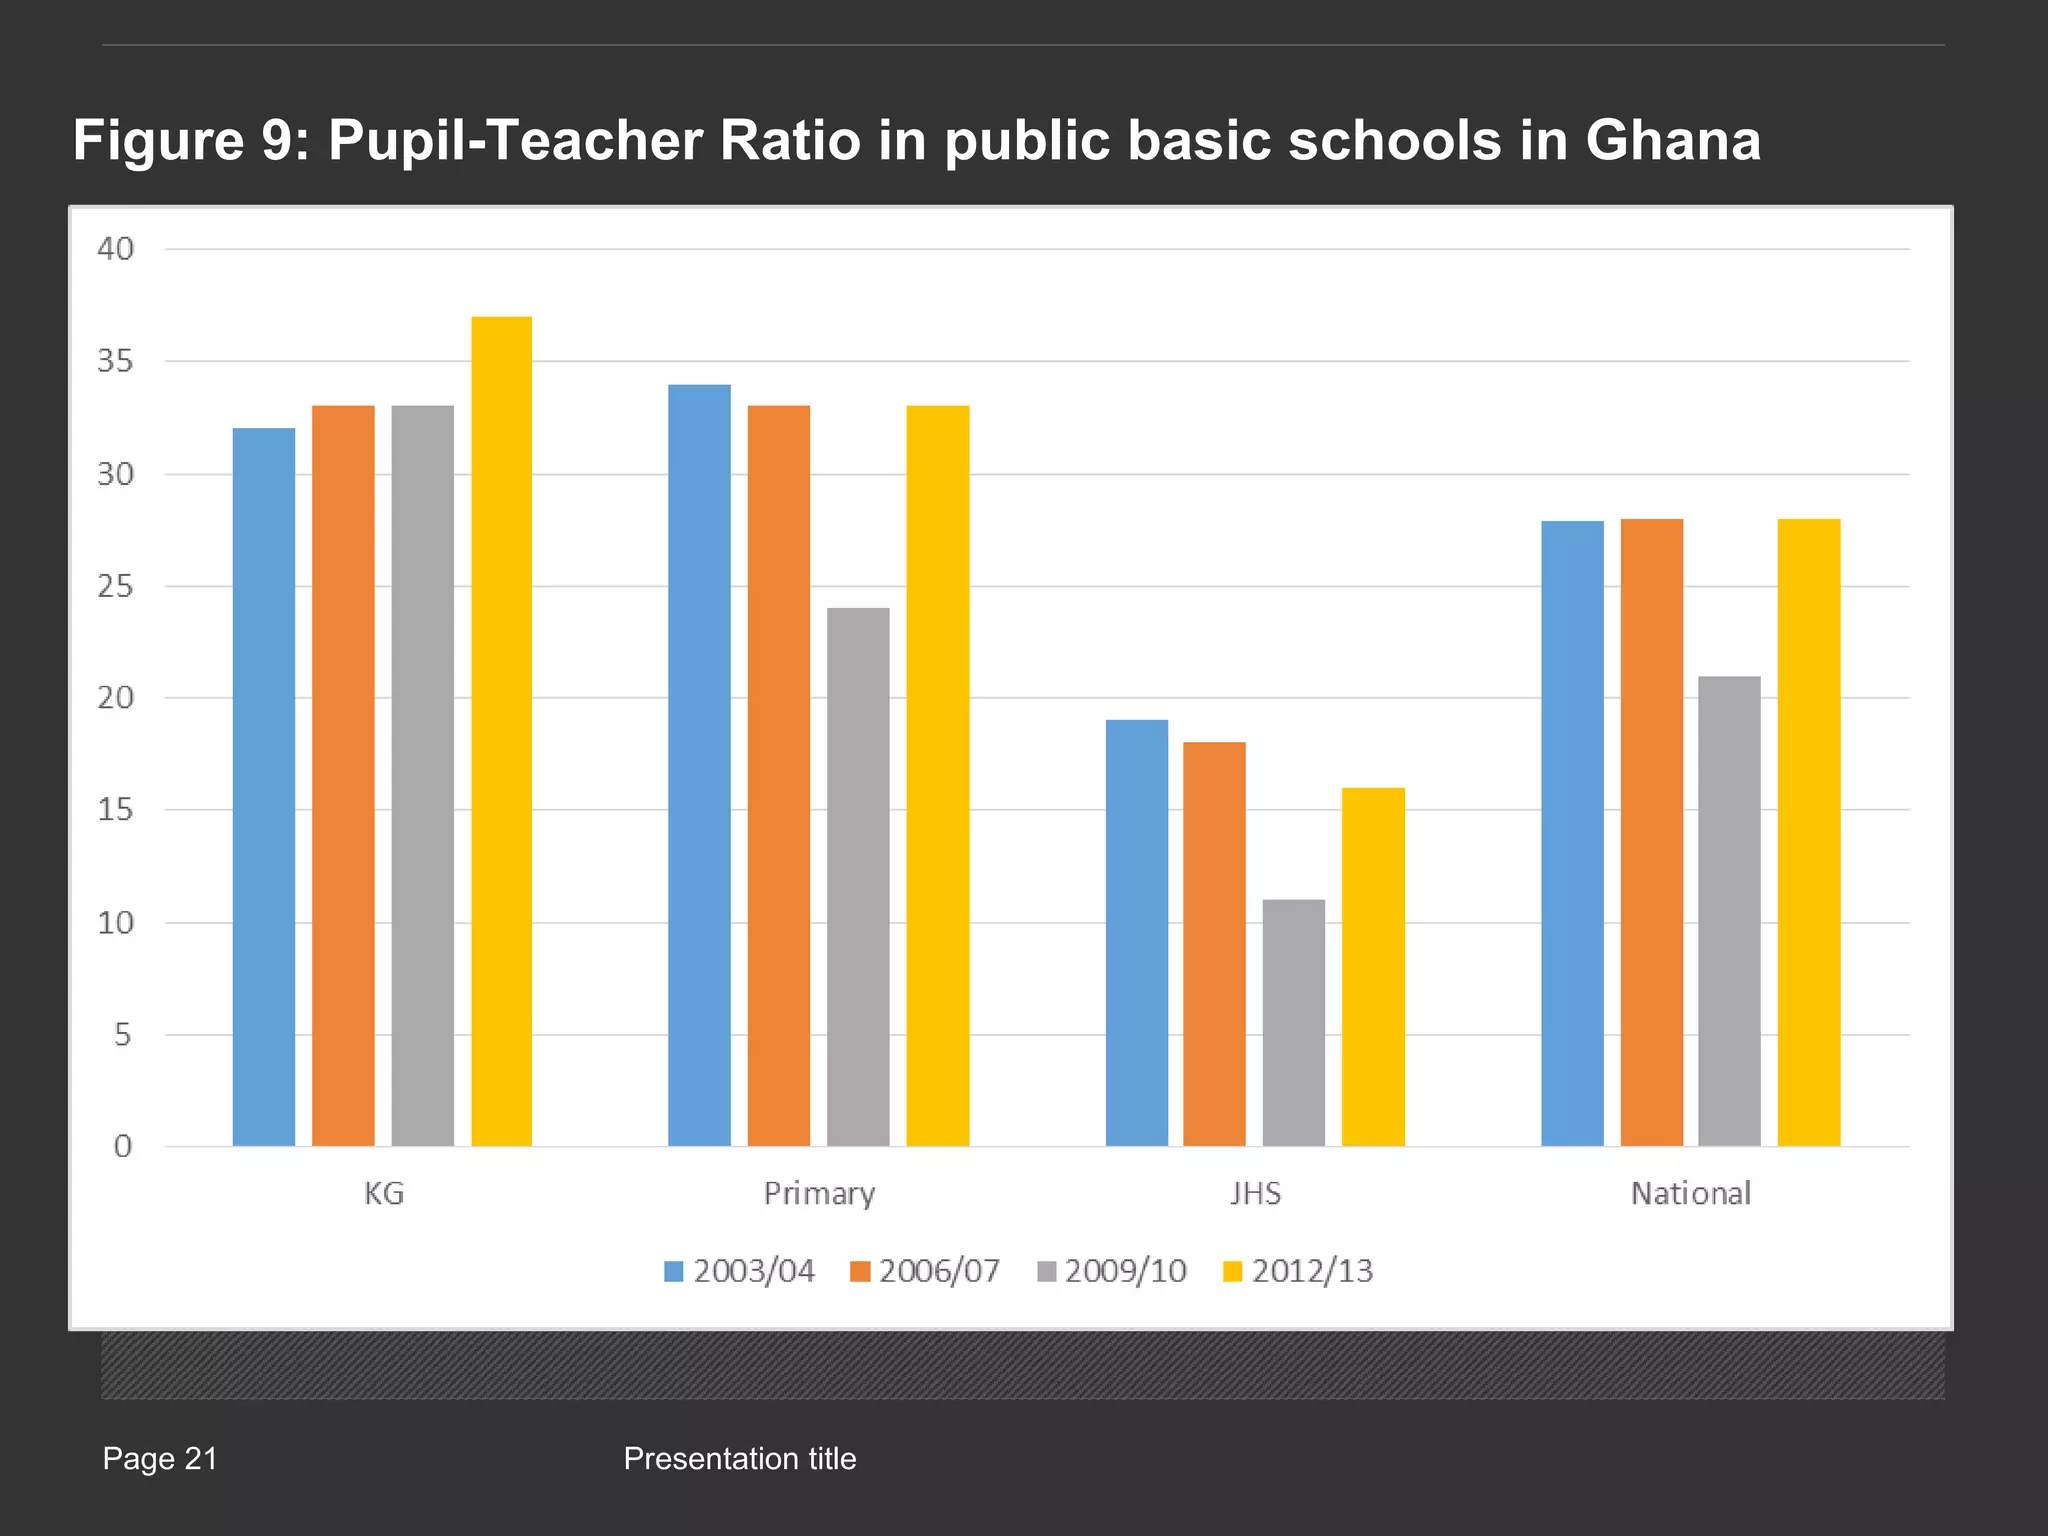
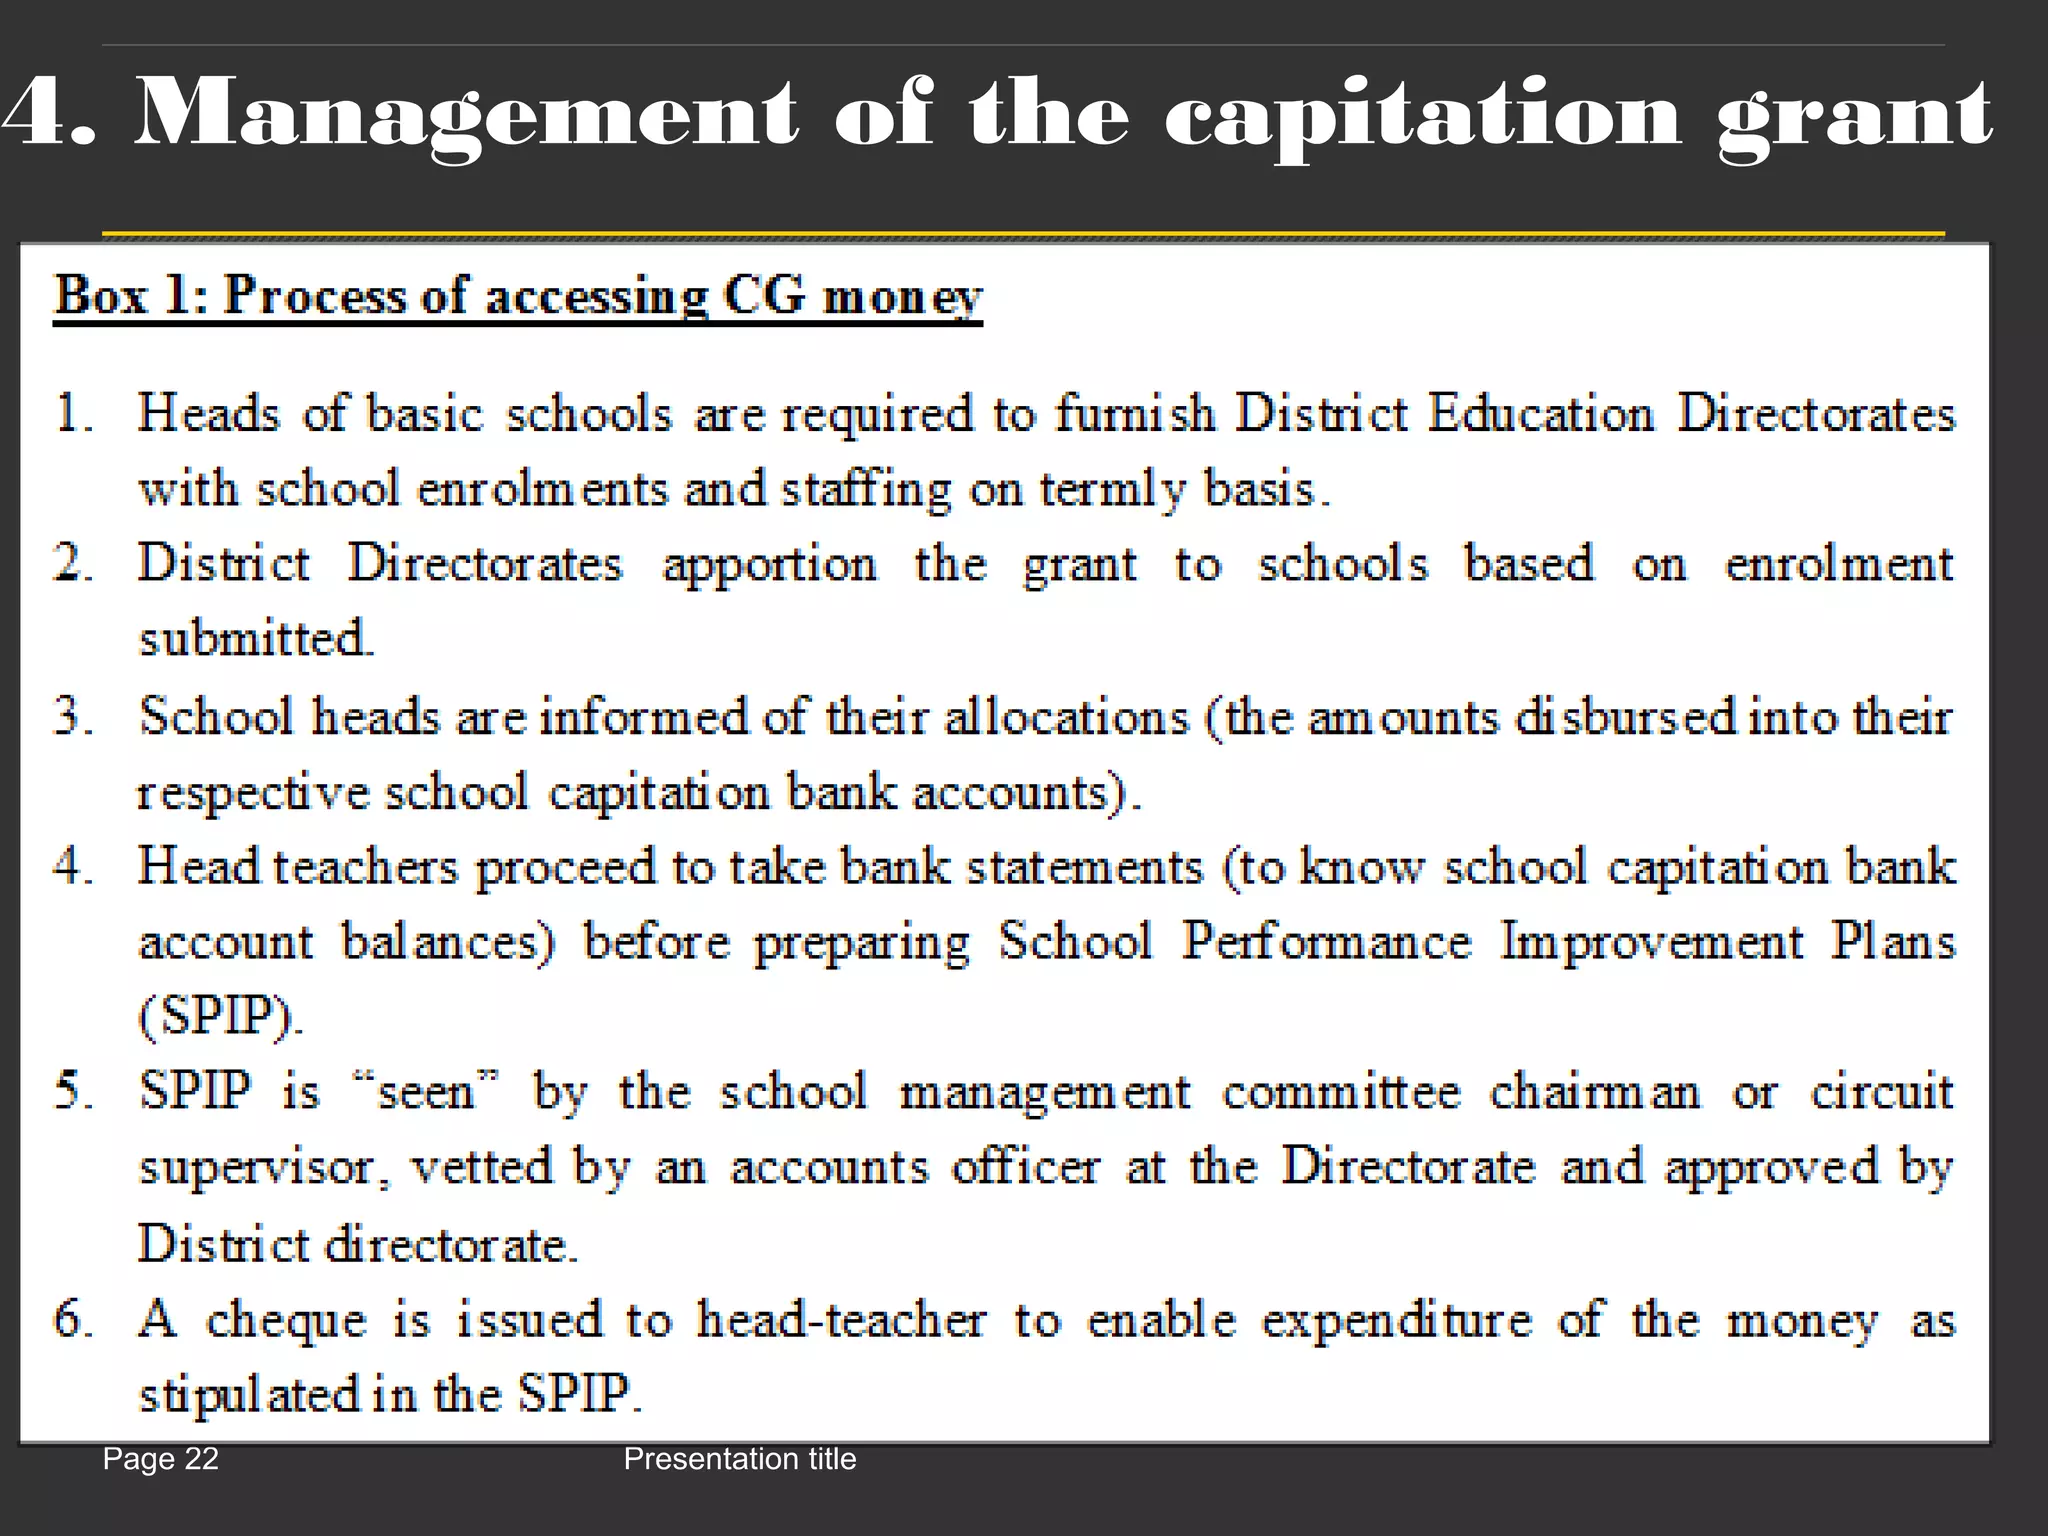
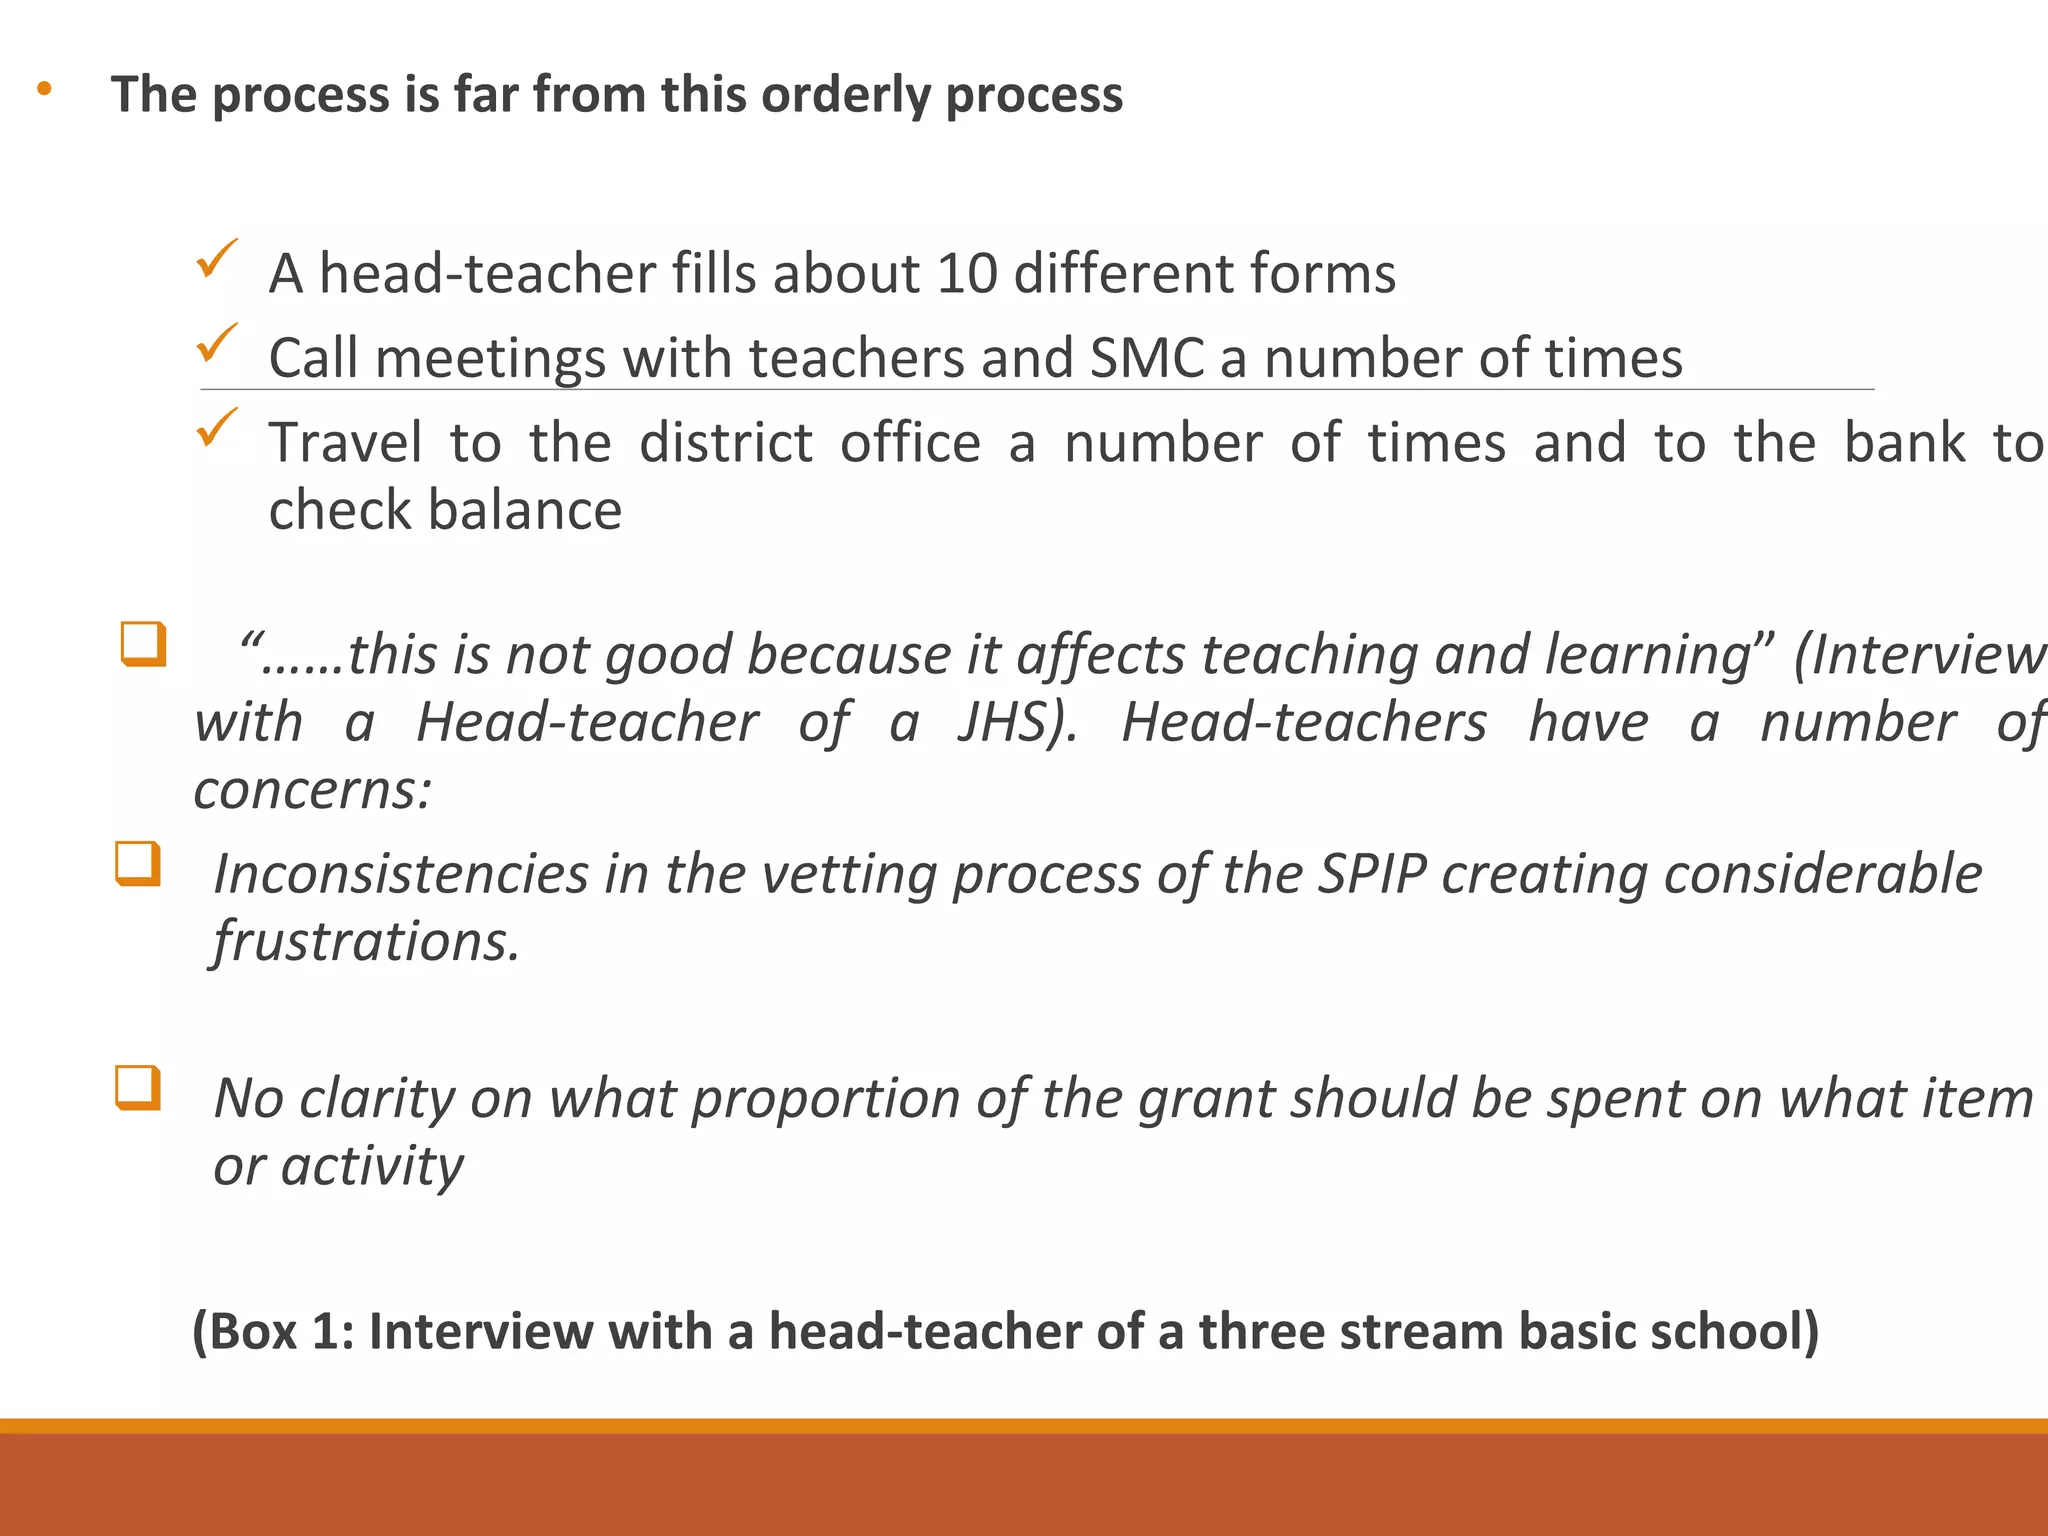
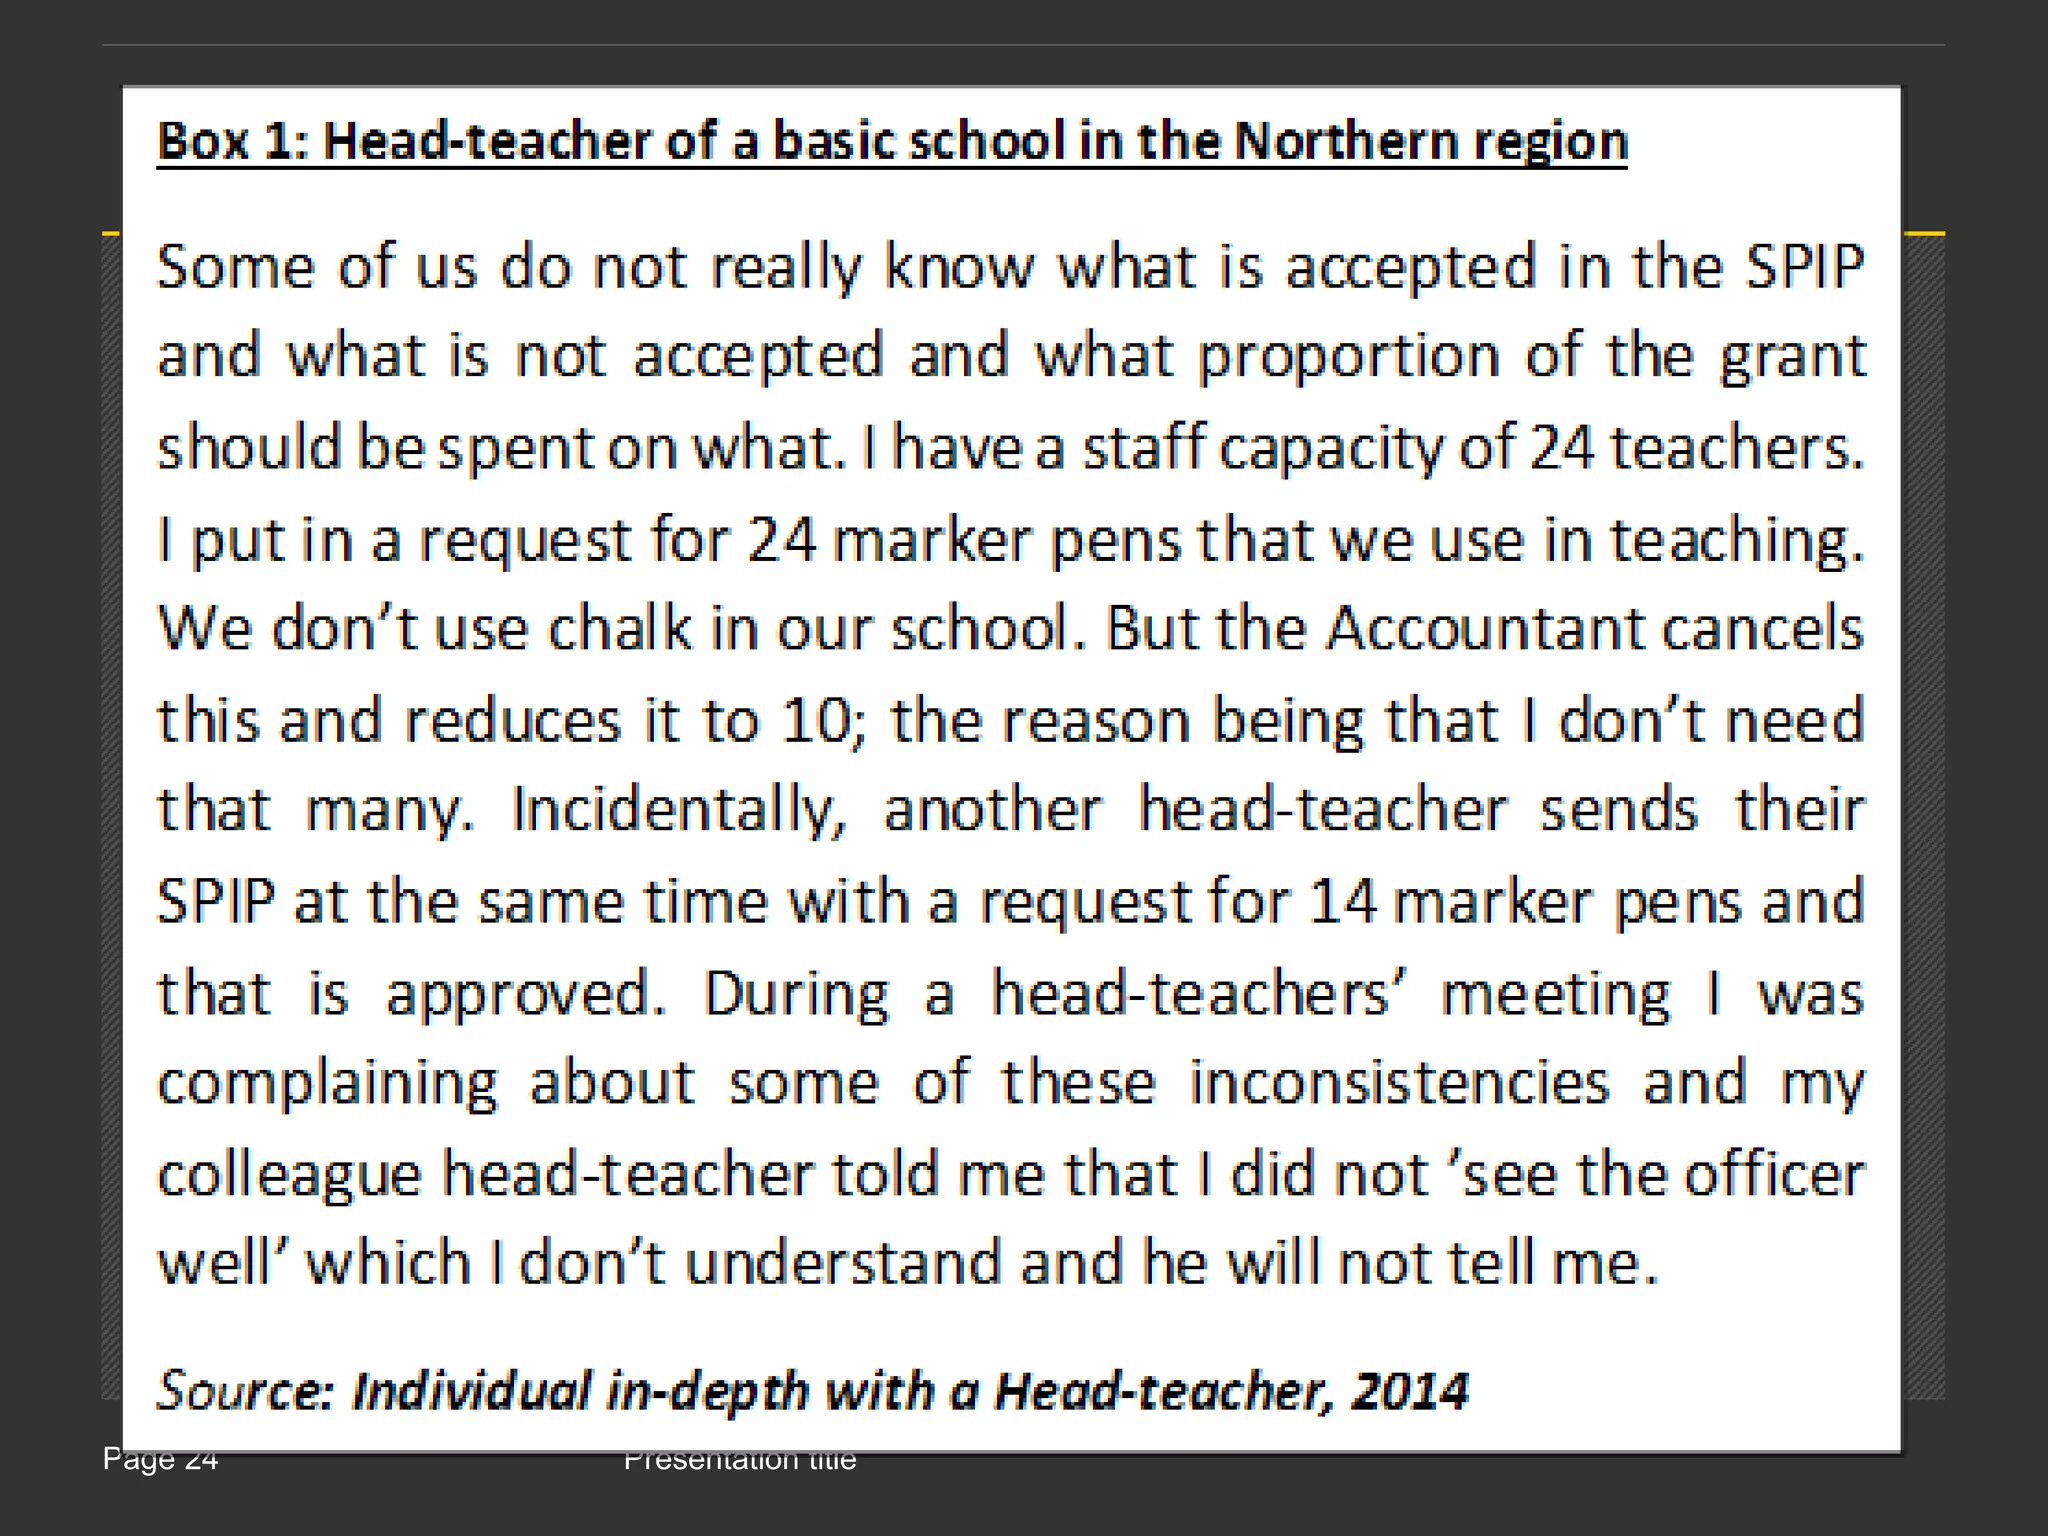
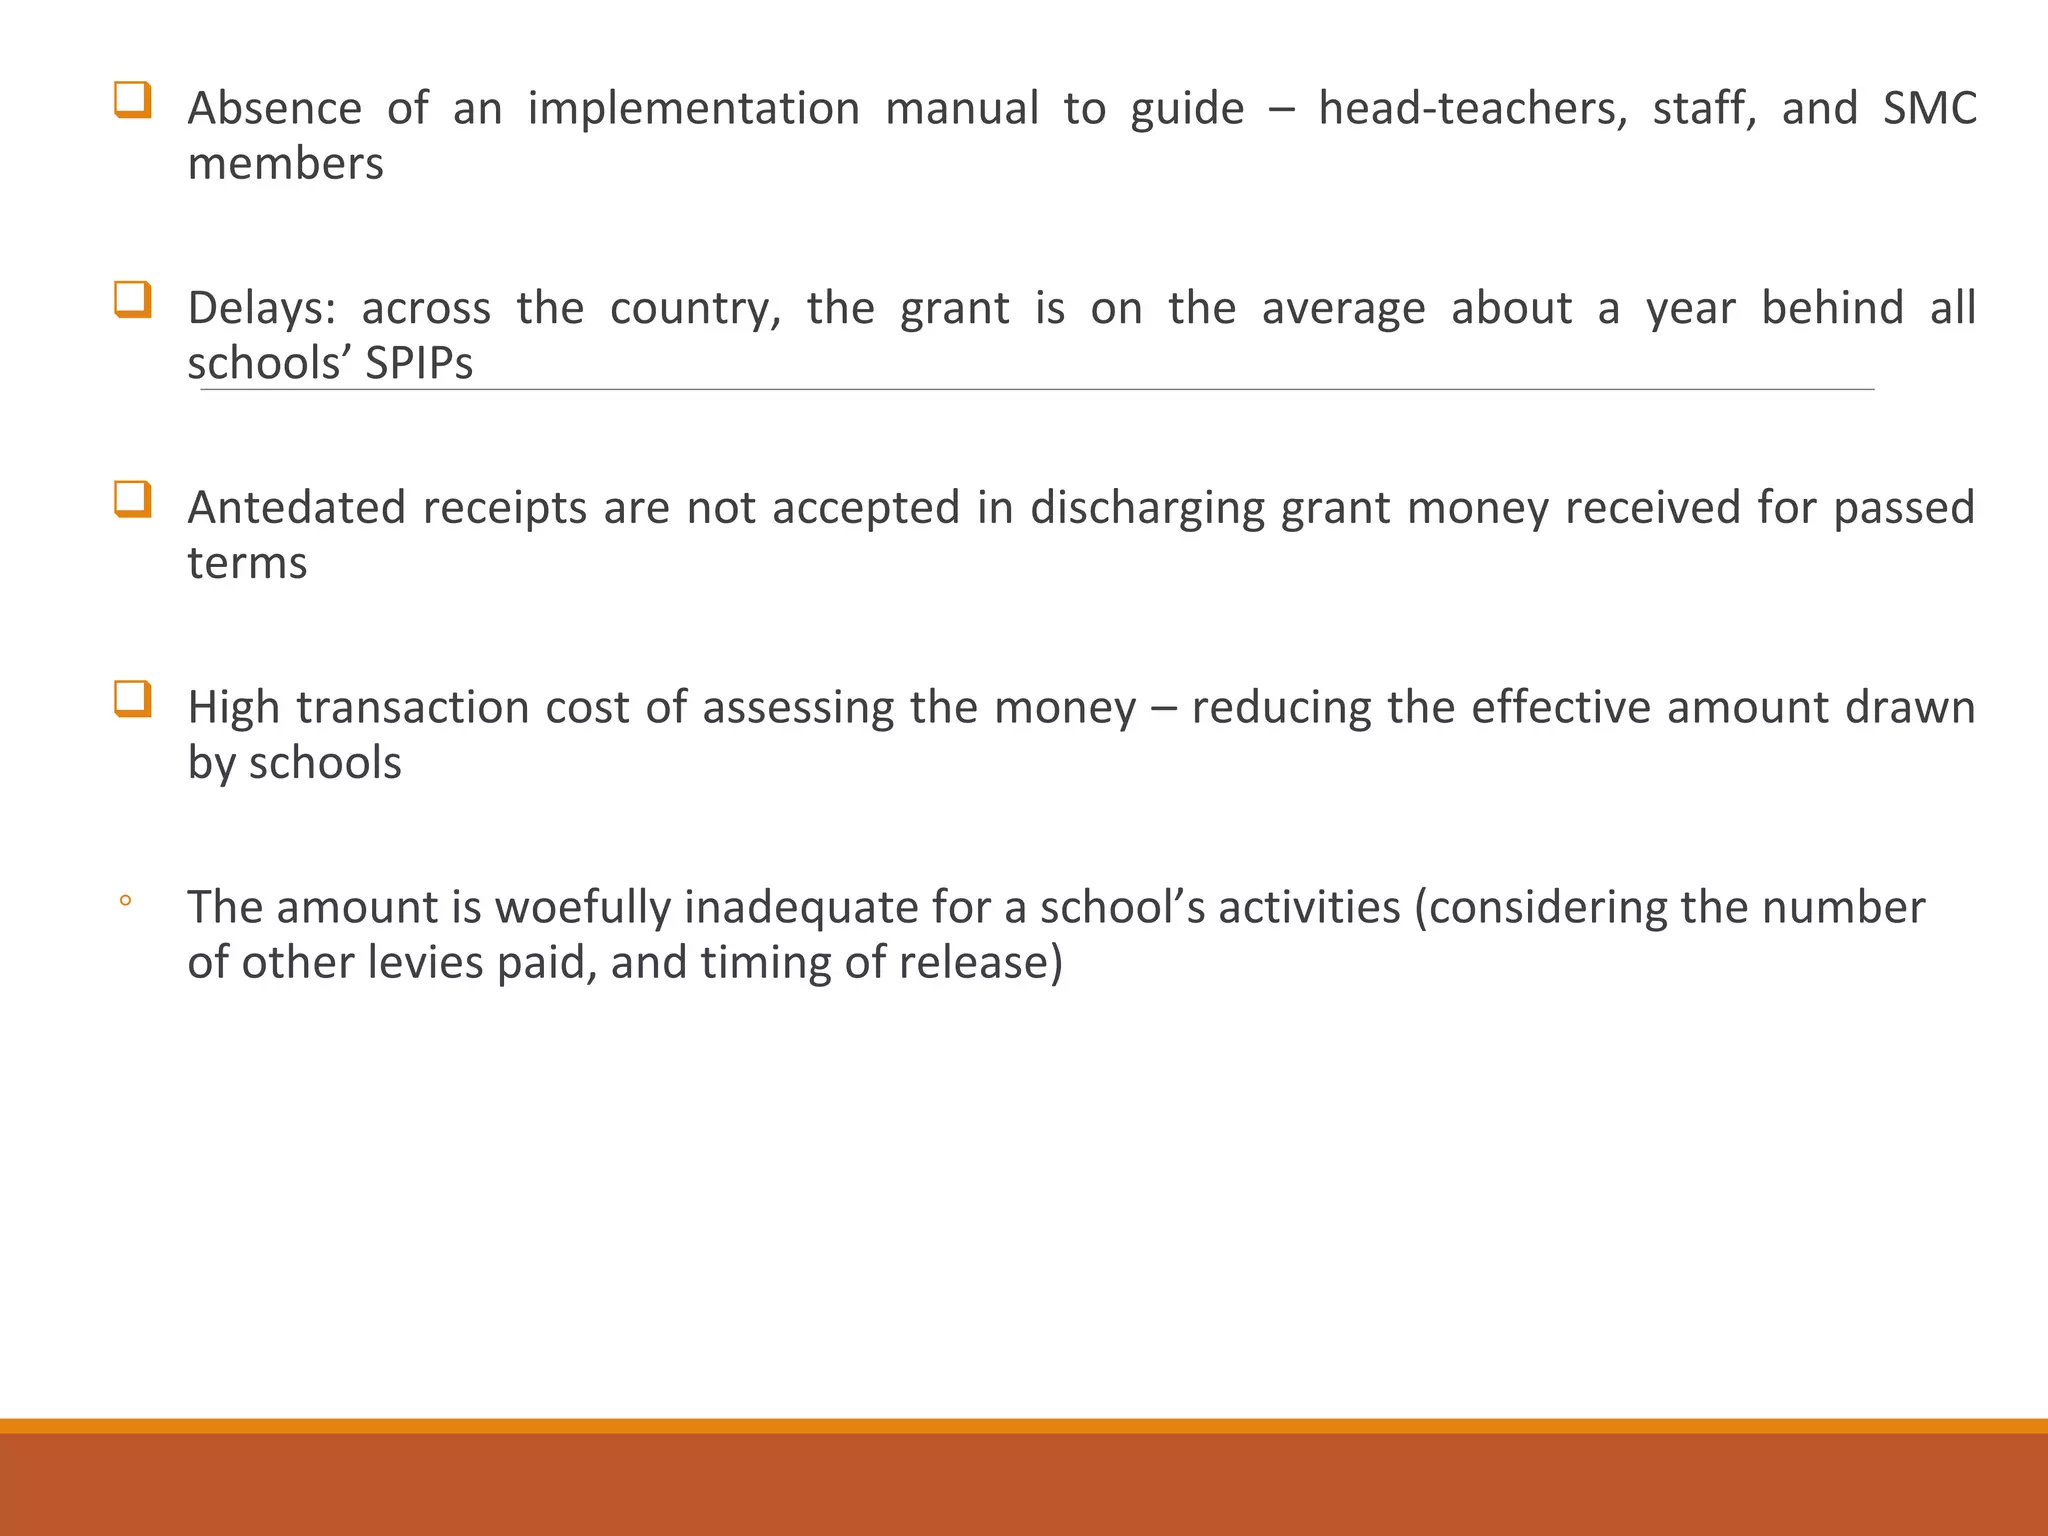
Citizens’ Assessment of the
School Capitation Grant Scheme
Nana Opare-Djan, Deputy Director,
M&E Division, NDPC
EVIDENCE-BASED POLICY-MAKING AND
IMPLEMENTATION PROGRAMME
ERINVALE ESTATE HOTEL & SPA, SOMERSET WEST
Tuesday, October 25, 2016
Outline
Background
Study Objectives
Methodology
Findings
Recommendations
Outline extended
1) Brief description of the work
2) How the policy process was initiated
3) A summary of the assessment of how the
department uses evidence
4) An overview of the stakeholders and different
motivations/interests were at play
5) An overview of the types of evidence used
6) Details of some of the challenges
7) Lessons for public sector officials working on
evidence-based processes
School Capitation Grant (CG)
Implementation Progress -
Description
 Piloted in 2004 and scaled up in 2005 nationwide
 Mechanism to lessen the burden of paying school levies
and to realize the long-term policy objective of increasing
equitable access to, and participation in education at all
levels
 Several concerns have been raised over the years about;
increasing enrolment levels and the effect on
infrastructure, personnel, and teaching material (World
Bank, 2011).
 Also concerns over the quality of education obtained by
pupils (World Bank, 2011).
2 key challenges
1. Number of levies and fees charged at the basic school level.
The result of a study undertaken by the Ghana Education Service (GES) in
2004 showed that 76 different types of levies, fees and charges existed in
schools.
2. This was further corroborated by the result of a study by UNICEF which
showed that about 40% of children between 6 and 11 years of school going
age remained out of school as of 2003 largely due to the inability of parents
to pay levies imposed by the schools (UNICEF, 2007).
Objectives of Study
Study sought to answer the question:
►Whether the CG policy achieved its goal of increasing access to and
participation in education at the basic level? and also to obtain feedback from
citizens about the extent to which they perceive the CG policy to meet its
objectives.
Specific objectives :
►Whether the CG had eliminated the payment of special levies, fees and
charges in public basic schools?
►Whether the CG improved enrolment and retention in public basic schools?
►Whether the CG improved equitable access to education?
►To what extent is CG sustainable under the
current arrangement?
Methodology
 Nationally representative survey of 2,165 households
 440 schools (Across the whole country)
 20 Community-based FGDs (2 in each region; average of
15 members per group)
 10 FGDs with Teachers (1 in each region; average of 10
members per group)
 10 In-depth Interviews with Heads of basic schools.
 10 In-depth Interviews with directors of education (and
other officers where present)
Key findings
1. Impact on the payment of school fees and
levies
CG has eliminated the payment of official tuition fees in public basic schools.
However, a number of levies still exist:
Examination fees,
Extra-classes
PTA levies
Collection
Sports and culture,
Computer (ICT) fees,
Capital development levies
Utility bills (water and electricity)
Presentation titlePage 10
Figure 1: Percentage of schools that charged various levies by urban
and rural areas (2013/14)
Presentation titlePage 11
Figure 2: Proportion of households who paid and those who did not
pay levies (2013/14)
Presentation titlePage 12
Figure 3: Average per capita amount paid as levies in public Primary by
region (GHC) for the academic year 2013/2014
Presentation titlePage 13
Figure 4: Per capita amount paid as levies in public Primary schools
by locality and socioeconomic status (GHC) for the academic year
(2013/2014)
Presentation titlePage 14
• On average, special levies and fees per capita paid by parents
are 6 and a half times the CG per child in a primary school
Figure 5: Per capita CG as a proportion of amount paid as levies per
child in Primary school by region - 2013/14 (%)
2. Impact on School attendance and enrolment
Attendance
Community members note that children of school-going age are
no more seen loitering about during school hours.
To them, it is an indication of improvement in enrolment and
school attendance.
They however noted that, due to difficulties some parents face in
terms of inability to pay levies pupils absent from school and many
others being denied participation in terminal examinations
Table 1: Reasons for child absenteeism (%)
Presentation titlePage 17
Figure 6: Households with at least a child absenting from school for at
least a day
Presentation titlePage 18
Enrolment
Figure 7: Enrolment Rates for Boys and Girls in Primary schools (%)
Presentation titlePage 19
Figure 8: Enrolment Rates for Boys and Girls in JHS (%)
3. Impact on quality education
 Households: 50+% (urban & rural) think the CG has had no
impact on the quality of education.
 40% households says it has had a positive impact
 70% schools positive impact of CG as it contributes about
40% of school’s total expenditures
 Concerns about class size: 32% and 25% head-teachers in
rural and urban areas respectively think the CG has had a
negative impact on management of class sizes.
Presentation titlePage 21
Figure 9: Pupil-Teacher Ratio in public basic schools in Ghana
Presentation titlePage 22
4. Management of the capitation grant
• The process is far from this orderly process
 A head-teacher fills about 10 different forms
 Call meetings with teachers and SMC a number of times
 Travel to the district office a number of times and to the bank to
check balance
 “……this is not good because it affects teaching and learning” (Interview
with a Head-teacher of a JHS). Head-teachers have a number of
concerns:
 Inconsistencies in the vetting process of the SPIP creating considerable
frustrations.
 No clarity on what proportion of the grant should be spent on what item
or activity
(Box 1: Interview with a head-teacher of a three stream basic school)
Presentation titlePage 24
 Absence of an implementation manual to guide – head-teachers, staff, and SMC
members
 Delays: across the country, the grant is on the average about a year behind all
schools’ SPIPs
 Antedated receipts are not accepted in discharging grant money received for passed
terms
 High transaction cost of assessing the money – reducing the effective amount drawn
by schools
◦ The amount is woefully inadequate for a school’s activities (considering the number
of other levies paid, and timing of release)
Coping strategies:
Head-teachers adopt two main coping strategies essentially to get the schools
running whilst waiting for the capitation grant money, avoid receipts being rejected
and also to minimise the high transaction cost:
 Rely on PTA support and also levies to run schools.
 Make purchases from these resources but ask for receipts to be signed undated. Such
receipts are then later dated to account for the expenditure of the capitation grant
money.
 Some head-teachers, especially those in rural schools, leave the money in their school
account to accumulate for about two or three tranches and then go for it as a lump sum.
Presentation titlePage 27
Figure 10: Parents' perception of the relevance of the capitation grant, by
type of locality of residence (%)
5. Relevance of the policy and the counterfactual
Presentation titlePage 28
 What can be done additionally to improve the quality of basic 
school education 
Figure 11: Head-teachers’ suggestions how to improve the quality of basic 
education
Presentation titlePage 29
 How to improve access to basic school education 
Figure 12: Head-teachers’ suggestions to help more pupils to have access 
to basic education (%)  
Conclusion
 There are considerable positives to the scheme.
 However, citizens are not satisfied with the implementation.
 They are concerned that, they are still made to pay some levies such as
examination fees, extra-classes, collection, and sports and culture
levies.
Recommendations
The continuous relevance of the policy depends largely on timely release of grant
amount to the schools.
At the governmental level, the MoE & the GES must:
Find a way of facilitating a quicker release of the grant to
the schools at the beginning of the school academic year.
Parents and heads of schools make two appeals; 1) an
increase of the amount, and 2) the use of a base amount
given to all schools according to need in addition to the
grant per a child
Policy recommendations at the low level:
Find a way to reduce the transaction cost associated with accessing the money.
Let the Capitation grant utilization manuals get down to the school level and not
remain only with the accountants or circuit supervisors.
There must be a way of vetting and accepting antedated receipts bearing in mind
that whilst head-teachers are waiting for the grant the schools have to be ran.
Thank you

Ghana case study evidence-based policy making

  • 1.
    Citizens’ Assessment ofthe School Capitation Grant Scheme Nana Opare-Djan, Deputy Director, M&E Division, NDPC EVIDENCE-BASED POLICY-MAKING AND IMPLEMENTATION PROGRAMME ERINVALE ESTATE HOTEL & SPA, SOMERSET WEST Tuesday, October 25, 2016
  • 2.
  • 3.
    Outline extended 1) Briefdescription of the work 2) How the policy process was initiated 3) A summary of the assessment of how the department uses evidence 4) An overview of the stakeholders and different motivations/interests were at play 5) An overview of the types of evidence used 6) Details of some of the challenges 7) Lessons for public sector officials working on evidence-based processes
  • 4.
    School Capitation Grant(CG) Implementation Progress - Description  Piloted in 2004 and scaled up in 2005 nationwide  Mechanism to lessen the burden of paying school levies and to realize the long-term policy objective of increasing equitable access to, and participation in education at all levels  Several concerns have been raised over the years about; increasing enrolment levels and the effect on infrastructure, personnel, and teaching material (World Bank, 2011).  Also concerns over the quality of education obtained by pupils (World Bank, 2011).
  • 5.
    2 key challenges 1.Number of levies and fees charged at the basic school level. The result of a study undertaken by the Ghana Education Service (GES) in 2004 showed that 76 different types of levies, fees and charges existed in schools. 2. This was further corroborated by the result of a study by UNICEF which showed that about 40% of children between 6 and 11 years of school going age remained out of school as of 2003 largely due to the inability of parents to pay levies imposed by the schools (UNICEF, 2007).
  • 6.
    Objectives of Study Studysought to answer the question: ►Whether the CG policy achieved its goal of increasing access to and participation in education at the basic level? and also to obtain feedback from citizens about the extent to which they perceive the CG policy to meet its objectives. Specific objectives : ►Whether the CG had eliminated the payment of special levies, fees and charges in public basic schools? ►Whether the CG improved enrolment and retention in public basic schools? ►Whether the CG improved equitable access to education? ►To what extent is CG sustainable under the current arrangement?
  • 7.
    Methodology  Nationally representativesurvey of 2,165 households  440 schools (Across the whole country)  20 Community-based FGDs (2 in each region; average of 15 members per group)  10 FGDs with Teachers (1 in each region; average of 10 members per group)  10 In-depth Interviews with Heads of basic schools.  10 In-depth Interviews with directors of education (and other officers where present)
  • 8.
  • 9.
    1. Impact onthe payment of school fees and levies CG has eliminated the payment of official tuition fees in public basic schools. However, a number of levies still exist: Examination fees, Extra-classes PTA levies Collection Sports and culture, Computer (ICT) fees, Capital development levies Utility bills (water and electricity)
  • 10.
    Presentation titlePage 10 Figure1: Percentage of schools that charged various levies by urban and rural areas (2013/14)
  • 11.
    Presentation titlePage 11 Figure2: Proportion of households who paid and those who did not pay levies (2013/14)
  • 12.
    Presentation titlePage 12 Figure3: Average per capita amount paid as levies in public Primary by region (GHC) for the academic year 2013/2014
  • 13.
    Presentation titlePage 13 Figure4: Per capita amount paid as levies in public Primary schools by locality and socioeconomic status (GHC) for the academic year (2013/2014)
  • 14.
    Presentation titlePage 14 •On average, special levies and fees per capita paid by parents are 6 and a half times the CG per child in a primary school Figure 5: Per capita CG as a proportion of amount paid as levies per child in Primary school by region - 2013/14 (%)
  • 15.
    2. Impact onSchool attendance and enrolment Attendance Community members note that children of school-going age are no more seen loitering about during school hours. To them, it is an indication of improvement in enrolment and school attendance. They however noted that, due to difficulties some parents face in terms of inability to pay levies pupils absent from school and many others being denied participation in terminal examinations
  • 16.
    Table 1: Reasonsfor child absenteeism (%)
  • 17.
    Presentation titlePage 17 Figure6: Households with at least a child absenting from school for at least a day
  • 18.
    Presentation titlePage 18 Enrolment Figure7: Enrolment Rates for Boys and Girls in Primary schools (%)
  • 19.
    Presentation titlePage 19 Figure8: Enrolment Rates for Boys and Girls in JHS (%)
  • 20.
    3. Impact onquality education  Households: 50+% (urban & rural) think the CG has had no impact on the quality of education.  40% households says it has had a positive impact  70% schools positive impact of CG as it contributes about 40% of school’s total expenditures  Concerns about class size: 32% and 25% head-teachers in rural and urban areas respectively think the CG has had a negative impact on management of class sizes.
  • 21.
    Presentation titlePage 21 Figure9: Pupil-Teacher Ratio in public basic schools in Ghana
  • 22.
    Presentation titlePage 22 4.Management of the capitation grant
  • 23.
    • The processis far from this orderly process  A head-teacher fills about 10 different forms  Call meetings with teachers and SMC a number of times  Travel to the district office a number of times and to the bank to check balance  “……this is not good because it affects teaching and learning” (Interview with a Head-teacher of a JHS). Head-teachers have a number of concerns:  Inconsistencies in the vetting process of the SPIP creating considerable frustrations.  No clarity on what proportion of the grant should be spent on what item or activity (Box 1: Interview with a head-teacher of a three stream basic school)
  • 24.
  • 25.
     Absence ofan implementation manual to guide – head-teachers, staff, and SMC members  Delays: across the country, the grant is on the average about a year behind all schools’ SPIPs  Antedated receipts are not accepted in discharging grant money received for passed terms  High transaction cost of assessing the money – reducing the effective amount drawn by schools ◦ The amount is woefully inadequate for a school’s activities (considering the number of other levies paid, and timing of release)
  • 26.
    Coping strategies: Head-teachers adopttwo main coping strategies essentially to get the schools running whilst waiting for the capitation grant money, avoid receipts being rejected and also to minimise the high transaction cost:  Rely on PTA support and also levies to run schools.  Make purchases from these resources but ask for receipts to be signed undated. Such receipts are then later dated to account for the expenditure of the capitation grant money.  Some head-teachers, especially those in rural schools, leave the money in their school account to accumulate for about two or three tranches and then go for it as a lump sum.
  • 27.
    Presentation titlePage 27 Figure10: Parents' perception of the relevance of the capitation grant, by type of locality of residence (%) 5. Relevance of the policy and the counterfactual
  • 28.
  • 29.
  • 30.
    Conclusion  There areconsiderable positives to the scheme.  However, citizens are not satisfied with the implementation.  They are concerned that, they are still made to pay some levies such as examination fees, extra-classes, collection, and sports and culture levies.
  • 31.
    Recommendations The continuous relevanceof the policy depends largely on timely release of grant amount to the schools. At the governmental level, the MoE & the GES must: Find a way of facilitating a quicker release of the grant to the schools at the beginning of the school academic year. Parents and heads of schools make two appeals; 1) an increase of the amount, and 2) the use of a base amount given to all schools according to need in addition to the grant per a child
  • 32.
    Policy recommendations atthe low level: Find a way to reduce the transaction cost associated with accessing the money. Let the Capitation grant utilization manuals get down to the school level and not remain only with the accountants or circuit supervisors. There must be a way of vetting and accepting antedated receipts bearing in mind that whilst head-teachers are waiting for the grant the schools have to be ran.
  • 33.

Editor's Notes

  • #2 For information on applying this template onto existing presentations, refer to the notes on slide 2 of this presentation. The Input area of the Beam can be customized to reflect the content of thepresentation. The Input area is an AutoShape with a picture fill. To change this, ensure you have the image you wish to use (ideally a .jpg or a .png file) in an accessible folder. The image should have a ratio of 1:1 to ensure it does not appear distorted. Acceptable images for importing into the Input area of the Beam are the three approved graphics (lines), and black and white photography or illustrations which follow the principles laid out on The Branding Zone. Color images should never be imported into this area. To create a thank you slide with a picture in the Input area of the Beam, duplicate this master slide and create a new master slide. If using the graphic on the title slide the same should be used on the thank you slide. If using a picture in the Input area of the Beam in the title slide, the same or different but related picture can be used on the thank you slide. Customize the Input area of the Beam as described below. Click on the View tab from the menu bar and select Master>Slide Master Right-click on the Input graphic and select Format AutoShape From the Fill menu, under the Color and Lines tab, click on the drop-down arrow next to Color and select the Fill Effects menu From the Picture tab, click on Select Picture. Navigate to the folder containing the image you wish to insert in the Input area. Highlight the image and tick the Lock picture aspect ratio box. Click on OK. You can now preview the image before continuing. If you are happy with how it looks, click OK to continue. Otherwise, repeat the process until you are happy with your selected image To exit from Master View, click on View>Normal. The change you made to the Input graphic should now be visible on the title slide
  • #13 9 out of 12 and 10 out of 12 of the districts sampled from the upper east and upper west regions respectively are GPEG beneficiary districts.