Download as PDF, PPTX

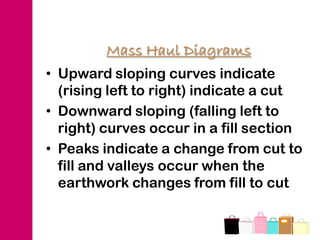
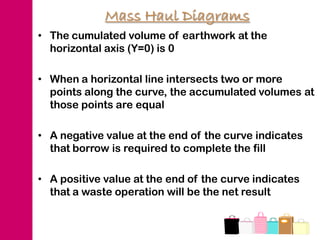
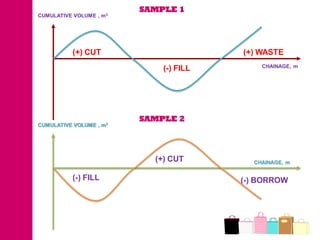
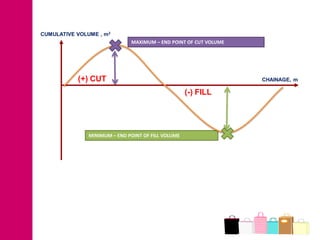
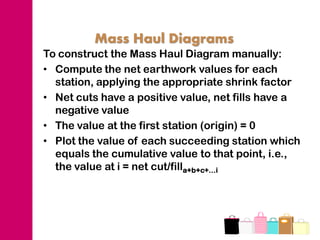
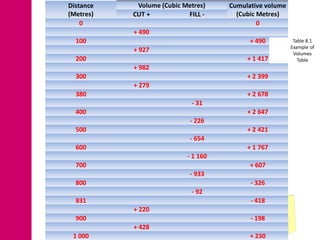
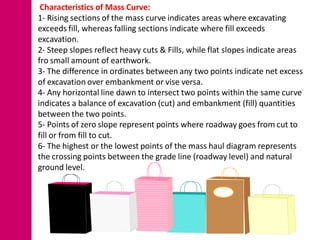
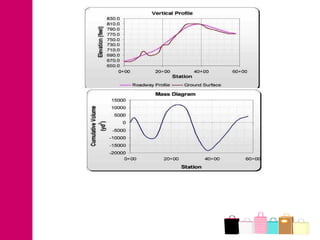
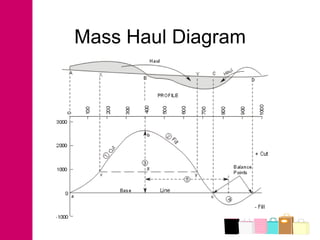
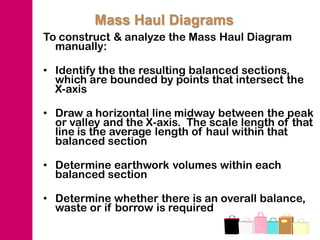
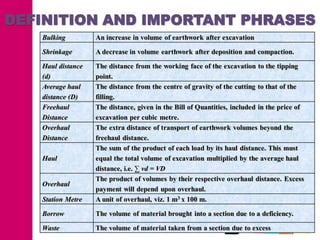
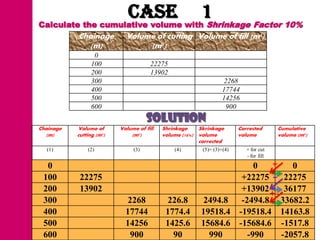
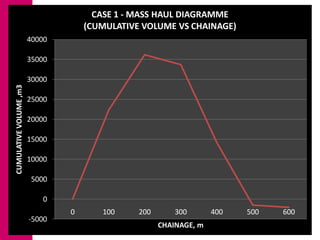
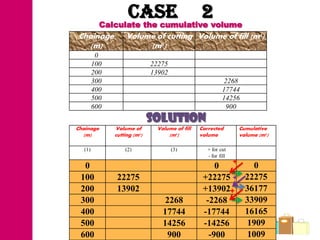
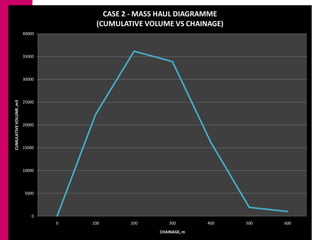
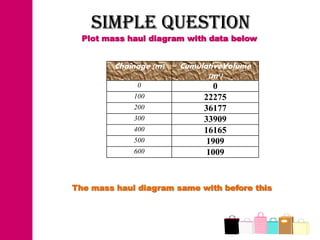
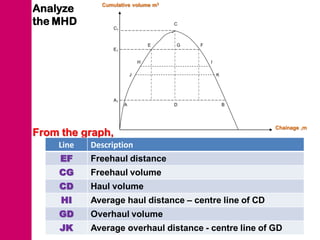


The document discusses mass haul diagrams (MHD), which are used to compare earthwork distribution costs for construction projects. MHDs graphically represent cumulative earthwork volumes along a linear profile. Peaks indicate transitions between cuts and fills, and balanced sections are bounded by points intersecting the x-axis. MHDs can identify where cuts and fills balance, quantities of material movement, and if borrow or waste is required. Construction of MHDs involves plotting cumulative earthwork values along the y-axis by stationing along the x-axis. Analysis of MHDs determines balanced sections and their average haul distances to estimate transportation costs.


![Geotechnical Engineering-I [Lec #27: Flow Nets]](https://cdn.slidesharecdn.com/ss_thumbnails/27-180924141458-thumbnail.jpg?width=640&height=640&fit=bounds)
![Geotechnical Engineering-II [Lec #23: Rankine Earth Pressure Theory]](https://cdn.slidesharecdn.com/ss_thumbnails/23-181123050516-thumbnail.jpg?width=640&height=640&fit=bounds)