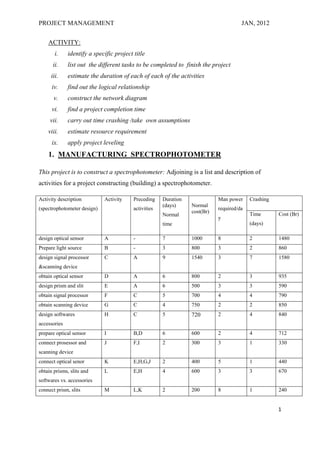
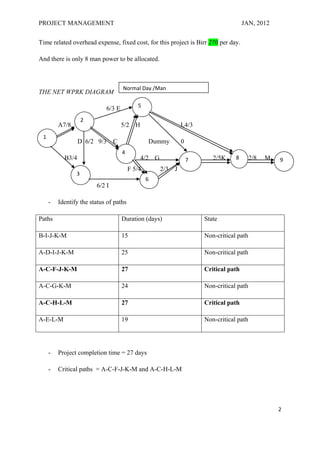
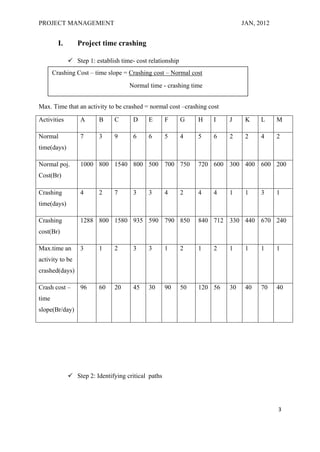
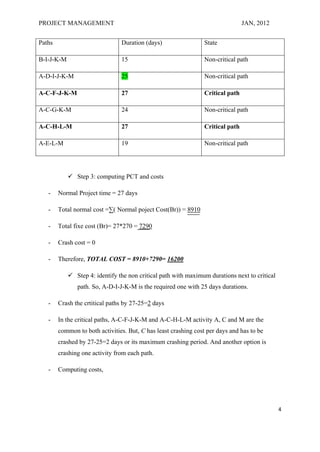
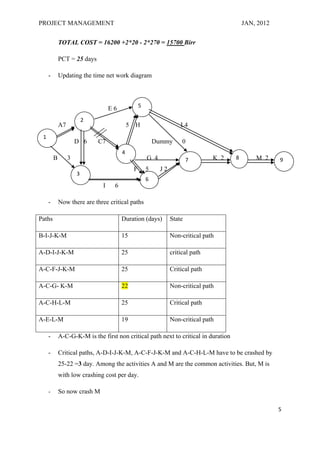
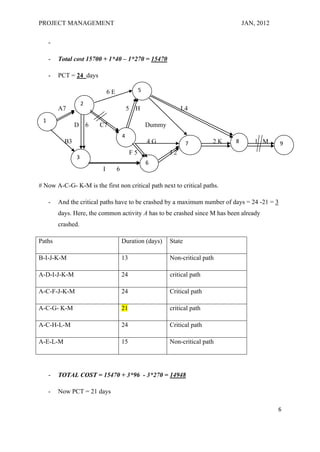
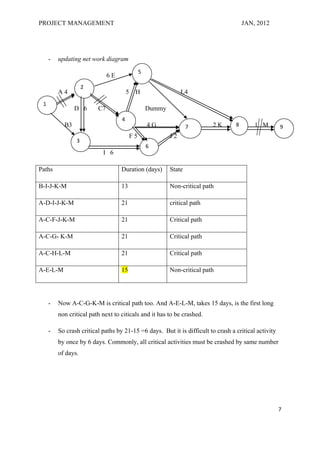
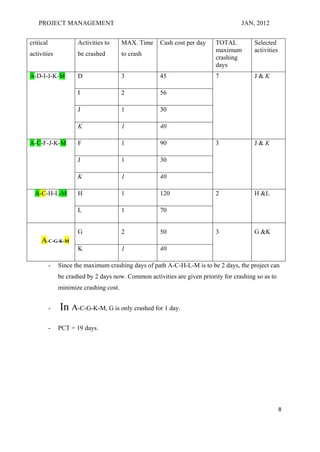
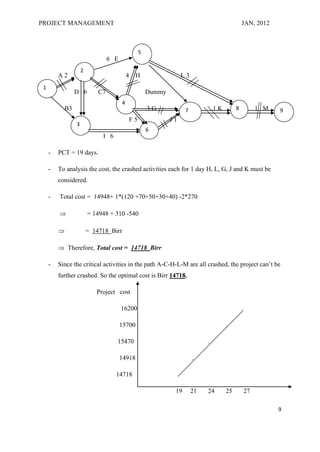
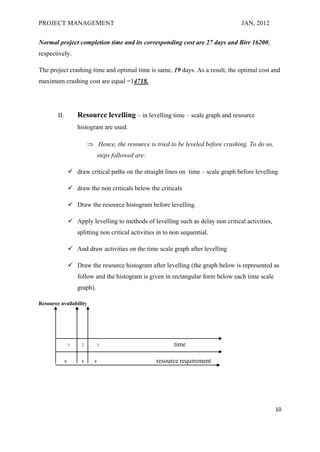
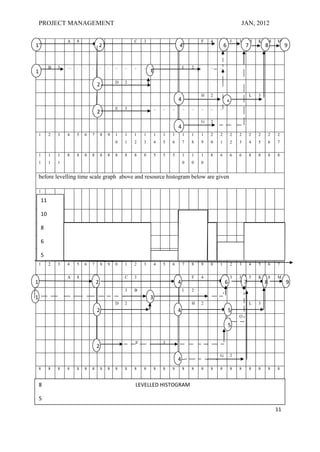
PROJECT MANAGEMENT                                      JAN, 2012


      BAHIR DAR UNIVERSITY


INSTITUTE OF TECHNOLOGY FOR TEXTILE, GARMENT AND FASHION
DESIGN


    TEXTILE ENGINEERING PROGRAMM


    OPERATIONS RESEARCH –PROJECT MANAGEMENT


                            Phone: +251920774757

                            E_mail:tadeleasmare@yahoo.com
                                                            JAN, 2012

                                                                        0
PROJECT MANAGEMENT                                                                     JAN, 2012

    ACTIVITY:
       i.     identify a specific project title
      ii.     list out the different tasks to be completed to finish the project
     iii.     estimate the duration of each of each of the activities
      iv.     find out the logical relationship
       v.     construct the network diagram
      vi.     find a project completion time
     vii.     carry out time crashing /take own assumptions
    viii.     estimate resource requirement
      ix.     apply project leveling
    1. MANUFACTURING SPECTROPHOTOMETER

This project is to construct a spectrophotometer: Adjoining is a list and description of
activities for a project constructing (building) a spectrophotometer.

Activity description         Activity     Preceding    Duration              Man power     Crashing
                                                       (days)     Normal
(spectrophotometer design)                activities                         required/da
                                                                  cost(Br)                 Time       Cost (Br)
                                                       Normal
                                                                             y
                                                       time                                (days)

design optical sensor        A            -            7          1000       8             2          1480
Prepare light source         B            -            3          800        3             2          860
design signal processor      C            A            9          1540       3             7          1580
&scanning device
obtain optical sensor        D            A            6          800        2             3          935
design prism and slit        E            A            6          500        3             3          590
obtain signal processor      F            C            5          700        4             4          790
obtain scanning device       G            C            4          750        2             2          850
design softwares             H            C            5          720        2             4          840
accessories
prepare optical sensor       I            B,D          6          600        2             4          712
connect prosessor and        J            F,I          2          300        3             1          330
scanning device
connect optical senor        K            E,H,G,J      2          400        5             1          440
obtain prisms, slits and     L            E,H          4          600        3             3          670
softwares vs. accessories
connect prism, slits         M            L,K          2          200        8             1          240


                                                                                                      1
PROJECT MANAGEMENT                                                                    JAN, 2012

Time related overhead expense, fixed cost, for this project is Birr 270 per day.

And there is only 8 man power to be allocated.


                                    Normal Day /Man
THE NET WPRK DIAGRAM

                                           5
                            6/3 E
                    2
         A7/8                       5/2 H                     L4/3
 1
                  D 6/2 9/3     C               Dummy         0
                                    4
           B3/4                             4/2 G                 7      2/5K     8       2/8   M   9
                                        F 5/4       2/3   J
                3
                                                6
                        6/2 I

     -   Identify the status of paths

Paths                               Duration (days)                   State

B-I-J-K-M                           15                                Non-critical path

A-D-I-J-K-M                         25                                Non-critical path

A-C-F-J-K-M                         27                                Critical path

A-C-G-K-M                           24                                Non-critical path

A-C-H-L-M                           27                                Critical path

A-E-L-M                             19                                Non-critical path


     -   Project completion time = 27 days

     -   Critical paths = A-C-F-J-K-M and A-C-H-L-M


                                                                                                    2
PROJECT MANAGEMENT                                                             JAN, 2012


         I.      Project time crashing

               Step 1: establish time- cost relationship
       Crashing Cost – time slope = Crashing cost – Normal cost
                                     Normal time - crashing time


Max. Time that an activity to be crashed = normal cost –crashing cost

Activities        A       B     C      D     E       F      G    H   I    J     K    L     M

Normal            7       3     9      6     6       5      4    5   6    2     2    4     2
time(days)

Normal poj.       1000 800 1540 800 500 700 750                  720 600 300 400 600 200
Cost(Br)

Crashing          4       2     7      3     3       4      2    4   4    1     1    3     1
time(days)

Crashing          1288 800 1580 935 590 790 850                  840 712 330 440 670 240
cost(Br)

Max.time an       3       1     2      3     3       1      2    1   2    1     1    1     1
activity to be
crashed(days)

Crash cost –      96      60    20     45    30      90     50   120 56   30    40   70    40
time
slope(Br/day)


               Step 2: Identifying critical paths


                                                                                           3
PROJECT MANAGEMENT                                                               JAN, 2012


Paths                           Duration (days)                  State

B-I-J-K-M                       15                               Non-critical path

A-D-I-J-K-M                     25                               Non-critical path

A-C-F-J-K-M                     27                               Critical path

A-C-G-K-M                       24                               Non-critical path

A-C-H-L-M                       27                               Critical path

A-E-L-M                         19                               Non-critical path


             Step 3: computing PCT and costs

   -    Normal Project time = 27 days

   -    Total normal cost =∑( Normal poject Cost(Br)) = 8910

   -    Total fixe cost (Br)= 27*270 = 7290

   -    Crash cost = 0

   -    Therefore, TOTAL COST = 8910+7290= 16200

             Step 4: identify the non critical path with maximum durations next to critical
               path. So, A-D-I-J-K-M is the required one with 25 days durations.

   -    Crash the crtitical paths by 27-25=2 days

   -    In the critical paths, A-C-F-J-K-M and A-C-H-L-M activity A, C and M are the
        common to both activities. But, C has least crashing cost per days and has to be
        crashed by 27-25=2 days or its maximum crashing period. And another option is
        crashing one activity from each path.

   -    Computing costs,


                                                                                               4
PROJECT MANAGEMENT                                                                           JAN, 2012


             TOTAL COST = 16200 +2*20 - 2*270 = 15700 Birr

             PCT = 25 days

     -       Updating the time net work diagram


                                                    5
                                   E6
                          2
             A7                             5   H                      L4
 1
                      D 6     C7                            Dummy       0
                                        4
         B        3                                     G 4                7       K 2   8       M 2     9
                                                F       5     J2
                      3
                                                        6
                               I    6

     -       Now there are three critical paths

Paths                                   Duration (days)            State

B-I-J-K-M                               15                         Non-critical path

A-D-I-J-K-M                             25                         critical path

A-C-F-J-K-M                             25                         Critical path

A-C-G- K-M                              22                         Non-critical path

A-C-H-L-M                               25                         Critical path

A-E-L-M                                 19                         Non-critical path

     -       A-C-G-K-M is the first non critical path next to critical in duration

     -       Critical paths, A-D-I-J-K-M, A-C-F-J-K-M and A-C-H-L-M have to be crashed by
             25-22 =3 day. Among the activities A and M are the common activities. But, M is
             with low crashing cost per day.

     -       So now crash M

                                                                                                         5
PROJECT MANAGEMENT                                                                   JAN, 2012

     -

     -   Total cost 15700 + 1*40 – 1*270 = 15470

     -   PCT = 24 days

                             6E                 5

                    2
         A7                               5   H                  L4
 1
                D 6      C7                         Dummy
                                      4
           B3                                       4G              7       2K   8       1 M     9
                                           F5               J2
                3
                                                    6
                         I        6

# Now A-C-G- K-M is the first non critical path next to critical paths.

     -   And the critical paths have to be crashed by a maximum number of days = 24 -21 = 3
         days. Here, the common activity A has to be crashed since M has been already
         crashed.

Paths                                 Duration (days)       State

B-I-J-K-M                             13                    Non-critical path

A-D-I-J-K-M                           24                    critical path

A-C-F-J-K-M                           24                    Critical path

A-C-G- K-M                            21                    critical path

A-C-H-L-M                             24                    Critical path

A-E-L-M                               15                    Non-critical path


     -   TOTAL COST = 15470 + 3*96 - 3*270 = 14948

     -   Now PCT = 21 days

                                                                                                 6
PROJECT MANAGEMENT                                                                    JAN, 2012


     -   updating net work diagram
                                             5
                              6E
                    2
         A4                            5   H                  L4
 1
                D 6      C7                      Dummy
                                   4
           B3                                    4G              7       2K       8       1 M         9
                                        F5               J2
                3
                                                 6
                           I 6

Paths                              Duration (days)       State

B-I-J-K-M                          13                    Non-critical path

A-D-I-J-K-M                        21                    critical path

A-C-F-J-K-M                        21                    Critical path

A-C-G- K-M                         21                    Critical path

A-C-H-L-M                          21                    Critical path

A-E-L-M                            15                    Non-critical path


     -   Now A-C-G-K-M is critical path too. And A-E-L-M, takes 15 days, is the first long
         non critical path next to citicals and it has to be crashed.

     -   So crash critical paths by 21-15 =6 days. But it is difficult to crash a critical activity
         by once by 6 days. Commonly, all critical activities must be crashed by same number
         of days.


                                                                                                      7
PROJECT MANAGEMENT                                                                JAN, 2012


critical              Activities to      MAX. Time    Cash cost per day    TOTAL          Selected
                                                                           maximum        activities
activities            be crashed         to crash
                                                                           crashing
                                                                           days
A-D-I-J-K-M           D                  3            45                   7              J&K

                      I                  2            56

                      J                  1            30

                      K                  1            40

A-C-F-J-K-M           F                  1            90                   3              J&K

                      J                  1            30

                      K                  1            40

  A-C-H-L-M           H                  1            120                  2              H &L

                      L                  1            70


                      G                  2            50                   3              G &K
     A-C-G-K-M
                      K                  1            40

           -   Since the maximum crashing days of path A-C-H-L-M is to be 2 days, the project can
               be crashed by 2 days now. Common activities are given priority for crashing so as to
               minimize crashing cost.


           -   In A-C-G-K-M, G is only crashed for 1 day.
           -   PCT = 19 days.


                                                                                                       8
PROJECT MANAGEMENT                                                                                  JAN, 2012


                                                   5
                                   6 E
                      2
         A2                                  4   H                      L3
 1
                  D 6         C7                       Dummy
                                         4
             B3                                        3G                7            1K        8        1 M    9
                                              F5               J1
                  3
                                                       6
                               I 6

     -   PCT = 19 days.

     -   To analysis the cost, the crashed activities each for 1 day H, L, G, J and K must be
         considered.

     -   Total cost = 14948+ 1*(120 +70+50+30+40) -2*270

                         = 14948 + 310 -540

                         = 14718 Birr

          Therefore, Total cost = 14718 Birr

     -   Since the critical activities in the path A-C-H-L-M are all crashed, the project can’t be
         further crashed. So the optimal cost is Birr 14718.

                             Project cost

                                         16200                                                      .

                                         15700                                             .

                                     15470                                        .

                                         14918                               .

                                     14718                          .

                                                                19           21   24       25       27

                                                                                                                9
PROJECT MANAGEMENT                                                                    JAN, 2012

Normal project completion time and its corresponding cost are 27 days and Birr 16200,
respectively.

The project crashing time and optimal time is same, 19 days. As a result, the optimal cost and
maximum crashing cost are equal =14718.


        II.           Resource levelling – in levelling time – scale graph and resource
                      histogram are used.

                            Hence, the resource is tried to be leveled before crashing. To do so,
                                 steps followed are:

                   draw critical paths on the straight lines on time – scale graph before levelling

                   draw the non criticals below the criticals

                   Draw the resource histogram before levelling.

                   Apply levelling to methods of levelling such as delay non critical activities,
                      splitting non critical activities in to non sequential.

                   And draw activities on the time scale graph after levelling

                   Draw the resource histogram after levelling (the graph below is represented as
                      follow and the histogram is given in rectangular form below each time scale
                      graph).

Resource availability


                  1    2         3                            time

              8        8     8                         resource requirement


                                                                                                     10
PROJECT MANAGEMENT                                                                                                        JAN, 2012

                  A   8                                 C    3                                     F    4             J   3        5   K       8   M
1                                     2                                              4                            6            7           8            9


          B   3   …   .   .   .       .   .   ..   ..   ..   ..                          I    2         ..   ..
1                                                                 3
                                              D    2
                                  2
                                                                                                   H    2                          L   3
                                                                                     4                                5
                                              E    3                  ..   ..   ..       ..   ..   ..   ..   ..
                                  2
                                                                                                   G    2
                                                                                     4
    1     2   3   4   5   6   7       8   9   1    1    1    1        1    1    1        1    1    1    2    2        2   2        2   2       2   2
                                              0    1    2    3        4    5    6        7    8    9    0    1        2   3        4   5       6   7


    1     1   1   8   8   8   8       8   8   8    8    8    8        5    5    5        1    1    1    8    6        6   6        8   8       8   8
    1     1   1                                                                          0    0    0


    before levelling time scale graph above and resource histogram below are given

    1
    011


    8
    10
    6
    8
    5
    6

    5
    1     2   3   4   5   6   7       8   9   0    1    2    3        4    5    6        7    8    9    0    1        2   3        4   5       6   7


                  A   8                            C    3                                     F    4                  3   J        5   K       8   M
1                                 2                                                  4                            6           7            8            9
                                                   3    B                                I    2
1                                                                 3
                                              D    2                                          H    2                               L   3
                                  2                                                  4                                5
                                                                                                                          O

                                                                                                                      5

                                                        E                  3
                                  2
                                                                                                             G        2
                                                                                     4
    8     8   8   8   8   8   8       8   8   8    8    8    8        8    8    8        8    8    8    8    8        8   8        8   8       8   8


    8                                                   LEVELLED HISTOGRAM
    FG
    5
                                                                                                                                                   11

Project management activity task

  • 1.
    PROJECT MANAGEMENT JAN, 2012 BAHIR DAR UNIVERSITY INSTITUTE OF TECHNOLOGY FOR TEXTILE, GARMENT AND FASHION DESIGN TEXTILE ENGINEERING PROGRAMM OPERATIONS RESEARCH –PROJECT MANAGEMENT Phone: +251920774757 E_mail:tadeleasmare@yahoo.com JAN, 2012 0
  • 2.
    PROJECT MANAGEMENT JAN, 2012 ACTIVITY: i. identify a specific project title ii. list out the different tasks to be completed to finish the project iii. estimate the duration of each of each of the activities iv. find out the logical relationship v. construct the network diagram vi. find a project completion time vii. carry out time crashing /take own assumptions viii. estimate resource requirement ix. apply project leveling 1. MANUFACTURING SPECTROPHOTOMETER This project is to construct a spectrophotometer: Adjoining is a list and description of activities for a project constructing (building) a spectrophotometer. Activity description Activity Preceding Duration Man power Crashing (days) Normal (spectrophotometer design) activities required/da cost(Br) Time Cost (Br) Normal y time (days) design optical sensor A - 7 1000 8 2 1480 Prepare light source B - 3 800 3 2 860 design signal processor C A 9 1540 3 7 1580 &scanning device obtain optical sensor D A 6 800 2 3 935 design prism and slit E A 6 500 3 3 590 obtain signal processor F C 5 700 4 4 790 obtain scanning device G C 4 750 2 2 850 design softwares H C 5 720 2 4 840 accessories prepare optical sensor I B,D 6 600 2 4 712 connect prosessor and J F,I 2 300 3 1 330 scanning device connect optical senor K E,H,G,J 2 400 5 1 440 obtain prisms, slits and L E,H 4 600 3 3 670 softwares vs. accessories connect prism, slits M L,K 2 200 8 1 240 1
  • 3.
    PROJECT MANAGEMENT JAN, 2012 Time related overhead expense, fixed cost, for this project is Birr 270 per day. And there is only 8 man power to be allocated. Normal Day /Man THE NET WPRK DIAGRAM 5 6/3 E 2 A7/8 5/2 H L4/3 1 D 6/2 9/3 C Dummy 0 4 B3/4 4/2 G 7 2/5K 8 2/8 M 9 F 5/4 2/3 J 3 6 6/2 I - Identify the status of paths Paths Duration (days) State B-I-J-K-M 15 Non-critical path A-D-I-J-K-M 25 Non-critical path A-C-F-J-K-M 27 Critical path A-C-G-K-M 24 Non-critical path A-C-H-L-M 27 Critical path A-E-L-M 19 Non-critical path - Project completion time = 27 days - Critical paths = A-C-F-J-K-M and A-C-H-L-M 2
  • 4.
    PROJECT MANAGEMENT JAN, 2012 I. Project time crashing  Step 1: establish time- cost relationship Crashing Cost – time slope = Crashing cost – Normal cost Normal time - crashing time Max. Time that an activity to be crashed = normal cost –crashing cost Activities A B C D E F G H I J K L M Normal 7 3 9 6 6 5 4 5 6 2 2 4 2 time(days) Normal poj. 1000 800 1540 800 500 700 750 720 600 300 400 600 200 Cost(Br) Crashing 4 2 7 3 3 4 2 4 4 1 1 3 1 time(days) Crashing 1288 800 1580 935 590 790 850 840 712 330 440 670 240 cost(Br) Max.time an 3 1 2 3 3 1 2 1 2 1 1 1 1 activity to be crashed(days) Crash cost – 96 60 20 45 30 90 50 120 56 30 40 70 40 time slope(Br/day)  Step 2: Identifying critical paths 3
  • 5.
    PROJECT MANAGEMENT JAN, 2012 Paths Duration (days) State B-I-J-K-M 15 Non-critical path A-D-I-J-K-M 25 Non-critical path A-C-F-J-K-M 27 Critical path A-C-G-K-M 24 Non-critical path A-C-H-L-M 27 Critical path A-E-L-M 19 Non-critical path  Step 3: computing PCT and costs - Normal Project time = 27 days - Total normal cost =∑( Normal poject Cost(Br)) = 8910 - Total fixe cost (Br)= 27*270 = 7290 - Crash cost = 0 - Therefore, TOTAL COST = 8910+7290= 16200  Step 4: identify the non critical path with maximum durations next to critical path. So, A-D-I-J-K-M is the required one with 25 days durations. - Crash the crtitical paths by 27-25=2 days - In the critical paths, A-C-F-J-K-M and A-C-H-L-M activity A, C and M are the common to both activities. But, C has least crashing cost per days and has to be crashed by 27-25=2 days or its maximum crashing period. And another option is crashing one activity from each path. - Computing costs, 4
  • 6.
    PROJECT MANAGEMENT JAN, 2012 TOTAL COST = 16200 +2*20 - 2*270 = 15700 Birr PCT = 25 days - Updating the time net work diagram 5 E6 2 A7 5 H L4 1 D 6 C7 Dummy 0 4 B 3 G 4 7 K 2 8 M 2 9 F 5 J2 3 6 I 6 - Now there are three critical paths Paths Duration (days) State B-I-J-K-M 15 Non-critical path A-D-I-J-K-M 25 critical path A-C-F-J-K-M 25 Critical path A-C-G- K-M 22 Non-critical path A-C-H-L-M 25 Critical path A-E-L-M 19 Non-critical path - A-C-G-K-M is the first non critical path next to critical in duration - Critical paths, A-D-I-J-K-M, A-C-F-J-K-M and A-C-H-L-M have to be crashed by 25-22 =3 day. Among the activities A and M are the common activities. But, M is with low crashing cost per day. - So now crash M 5
  • 7.
    PROJECT MANAGEMENT JAN, 2012 - - Total cost 15700 + 1*40 – 1*270 = 15470 - PCT = 24 days 6E 5 2 A7 5 H L4 1 D 6 C7 Dummy 4 B3 4G 7 2K 8 1 M 9 F5 J2 3 6 I 6 # Now A-C-G- K-M is the first non critical path next to critical paths. - And the critical paths have to be crashed by a maximum number of days = 24 -21 = 3 days. Here, the common activity A has to be crashed since M has been already crashed. Paths Duration (days) State B-I-J-K-M 13 Non-critical path A-D-I-J-K-M 24 critical path A-C-F-J-K-M 24 Critical path A-C-G- K-M 21 critical path A-C-H-L-M 24 Critical path A-E-L-M 15 Non-critical path - TOTAL COST = 15470 + 3*96 - 3*270 = 14948 - Now PCT = 21 days 6
  • 8.
    PROJECT MANAGEMENT JAN, 2012 - updating net work diagram 5 6E 2 A4 5 H L4 1 D 6 C7 Dummy 4 B3 4G 7 2K 8 1 M 9 F5 J2 3 6 I 6 Paths Duration (days) State B-I-J-K-M 13 Non-critical path A-D-I-J-K-M 21 critical path A-C-F-J-K-M 21 Critical path A-C-G- K-M 21 Critical path A-C-H-L-M 21 Critical path A-E-L-M 15 Non-critical path - Now A-C-G-K-M is critical path too. And A-E-L-M, takes 15 days, is the first long non critical path next to citicals and it has to be crashed. - So crash critical paths by 21-15 =6 days. But it is difficult to crash a critical activity by once by 6 days. Commonly, all critical activities must be crashed by same number of days. 7
  • 9.
    PROJECT MANAGEMENT JAN, 2012 critical Activities to MAX. Time Cash cost per day TOTAL Selected maximum activities activities be crashed to crash crashing days A-D-I-J-K-M D 3 45 7 J&K I 2 56 J 1 30 K 1 40 A-C-F-J-K-M F 1 90 3 J&K J 1 30 K 1 40 A-C-H-L-M H 1 120 2 H &L L 1 70 G 2 50 3 G &K A-C-G-K-M K 1 40 - Since the maximum crashing days of path A-C-H-L-M is to be 2 days, the project can be crashed by 2 days now. Common activities are given priority for crashing so as to minimize crashing cost. - In A-C-G-K-M, G is only crashed for 1 day. - PCT = 19 days. 8
  • 10.
    PROJECT MANAGEMENT JAN, 2012 5 6 E 2 A2 4 H L3 1 D 6 C7 Dummy 4 B3 3G 7 1K 8 1 M 9 F5 J1 3 6 I 6 - PCT = 19 days. - To analysis the cost, the crashed activities each for 1 day H, L, G, J and K must be considered. - Total cost = 14948+ 1*(120 +70+50+30+40) -2*270  = 14948 + 310 -540  = 14718 Birr  Therefore, Total cost = 14718 Birr - Since the critical activities in the path A-C-H-L-M are all crashed, the project can’t be further crashed. So the optimal cost is Birr 14718. Project cost 16200 . 15700 . 15470 . 14918 . 14718 . 19 21 24 25 27 9
  • 11.
    PROJECT MANAGEMENT JAN, 2012 Normal project completion time and its corresponding cost are 27 days and Birr 16200, respectively. The project crashing time and optimal time is same, 19 days. As a result, the optimal cost and maximum crashing cost are equal =14718. II. Resource levelling – in levelling time – scale graph and resource histogram are used.  Hence, the resource is tried to be leveled before crashing. To do so, steps followed are:  draw critical paths on the straight lines on time – scale graph before levelling  draw the non criticals below the criticals  Draw the resource histogram before levelling.  Apply levelling to methods of levelling such as delay non critical activities, splitting non critical activities in to non sequential.  And draw activities on the time scale graph after levelling  Draw the resource histogram after levelling (the graph below is represented as follow and the histogram is given in rectangular form below each time scale graph). Resource availability 1 2 3 time 8 8 8 resource requirement 10
  • 12.
    PROJECT MANAGEMENT JAN, 2012 A 8 C 3 F 4 J 3 5 K 8 M 1 2 4 6 7 8 9 B 3 … . . . . . .. .. .. .. I 2 .. .. 1 3 D 2 2 H 2 L 3 4 5 E 3 .. .. .. .. .. .. .. .. 2 G 2 4 1 2 3 4 5 6 7 8 9 1 1 1 1 1 1 1 1 1 1 2 2 2 2 2 2 2 2 0 1 2 3 4 5 6 7 8 9 0 1 2 3 4 5 6 7 1 1 1 8 8 8 8 8 8 8 8 8 8 5 5 5 1 1 1 8 6 6 6 8 8 8 8 1 1 1 0 0 0 before levelling time scale graph above and resource histogram below are given 1 011 8 10 6 8 5 6 5 1 2 3 4 5 6 7 8 9 0 1 2 3 4 5 6 7 8 9 0 1 2 3 4 5 6 7 A 8 C 3 F 4 3 J 5 K 8 M 1 2 4 6 7 8 9 3 B I 2 1 3 D 2 H 2 L 3 2 4 5 O 5 E 3 2 G 2 4 8 8 8 8 8 8 8 8 8 8 8 8 8 8 8 8 8 8 8 8 8 8 8 8 8 8 8 8 LEVELLED HISTOGRAM FG 5 11