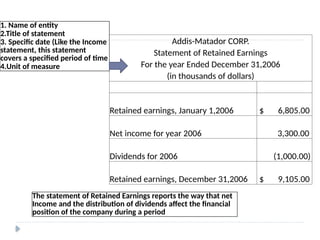
Addis-Matador CORP.
Statement ofRetained Earnings
For the year Ended December 31,2006
(in thousands of dollars)
Retained earnings, January 1,2006 $ 6,805.00
Net income for year 2006 3,300.00
Dividends for 2006 (1,000.00)
Retained earnings, December 31,2006 $ 9,105.00
1. Name of entity
2.Title of statement
3. Specific date (Like the Income
statement, this statement
covers a specified period of time
4.Unit of measure
The statement of Retained Earnings reports the way that net
Income and the distribution of dividends affect the financial
position of the company during a period
3.
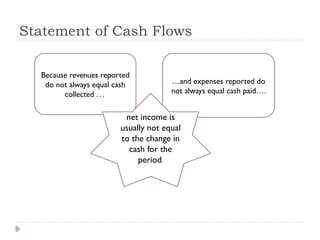
Statement of CashFlows
Because revenues reported
do not always equal cash
collected . . .
…and expenses reported do
not always equal cash paid….
net income is
usually not equal
to the change in
cash for the
period.
4.
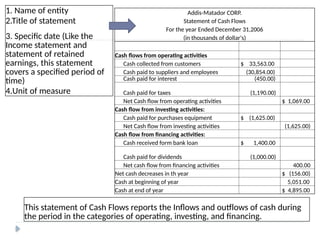
Addis-Matador CORP.
Statement ofCash Flows
For the year Ended December 31,2006
(in thousands of dollar's)
Cash flows from operating activities
Cash collected from customers $ 33,563.00
Cash paid to suppliers and employees (30,854.00)
Cash paid for interest (450.00)
Cash paid for taxes (1,190.00)
Net Cash flow from operating activities $ 1,069.00
Cash flow from investing activities:
Cash paid for purchases equipment $ (1,625.00)
Net Cash flow from investing activities (1,625.00)
Cash flow from financing activities:
Cash received form bank loan $ 1,400.00
Cash paid for dividends (1,000.00)
Net cash flow from financing activities 400.00
Net cash decreases in th year $ (156.00)
Cash at beginning of year 5,051.00
Cash at end of year $ 4,895.00
1. Name of entity
2.Title of statement
3. Specific date (Like the
Income statement and
statement of retained
earnings, this statement
covers a specified period of
time)
4.Unit of measure
This statement of Cash Flows reports the Inflows and outflows of cash during
the period in the categories of operating, investing, and financing.
5.
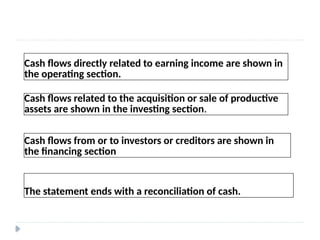
Cash flows directlyrelated to earning income are shown in
the operating section.
Cash flows related to the acquisition or sale of productive
assets are shown in the investing section.
Cash flows from or to investors or creditors are shown in
the financing section
The statement ends with a reconciliation of cash.
6.
Financial Analysis
Assessmentof the firm’s past, present and
future financial conditions
Done to find firm’s financial strengths and
weaknesses
Primary tools:
Financial statements
Comparison of financial ratios to past,
industry sector and all firms
7.
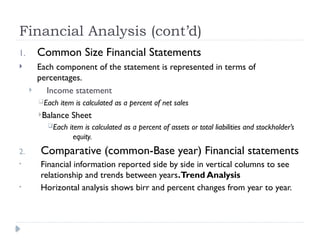
Financial Analysis (cont’d)
1.Common Size Financial Statements
Each component of the statement is represented in terms of
percentages.
Income statement
Each item is calculated as a percent of net sales
Balance Sheet
Each item is calculated as a percent of assets or total liabilities and stockholder’s
equity.
2. Comparative (common-Base year) Financial statements
• Financial information reported side by side in vertical columns to see
relationship and trends between years.Trend Analysis
• Horizontal analysis shows birr and percent changes from year to year.
8.
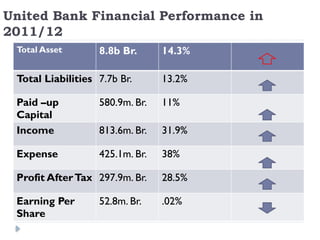
United Bank FinancialPerformance in
2011/12
Total Asset 8.8b Br. 14.3%
Total Liabilities 7.7b Br. 13.2%
Paid –up
Capital
580.9m. Br. 11%
Income 813.6m. Br. 31.9%
Expense 425.1m. Br. 38%
Profit AfterTax 297.9m. Br. 28.5%
Earning Per
Share
52.8m. Br. .02%
9.
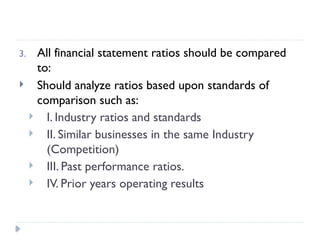
3. All financialstatement ratios should be compared
to:
Should analyze ratios based upon standards of
comparison such as:
I. Industry ratios and standards
II. Similar businesses in the same Industry
(Competition)
III. Past performance ratios.
IV. Prior years operating results
10.
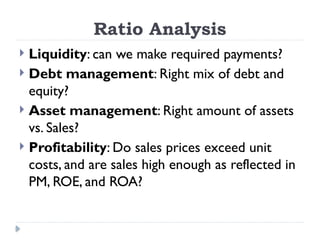
Ratio Analysis
Liquidity:can we make required payments?
Debt management: Right mix of debt and
equity?
Asset management: Right amount of assets
vs. Sales?
Profitability: Do sales prices exceed unit
costs, and are sales high enough as reflected in
PM, ROE, and ROA?
11.
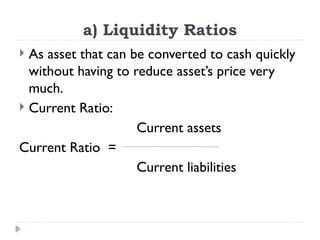
a) Liquidity Ratios
As asset that can be converted to cash quickly
without having to reduce asset’s price very
much.
Current Ratio:
Current assets
Current Ratio =
Current liabilities
12.
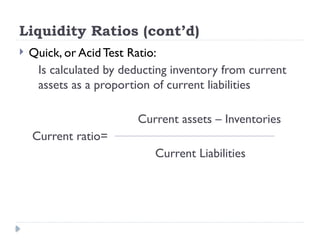
Liquidity Ratios (cont’d)
Quick, or Acid Test Ratio:
Is calculated by deducting inventory from current
assets as a proportion of current liabilities
Current assets – Inventories
Current ratio=
Current Liabilities
13.
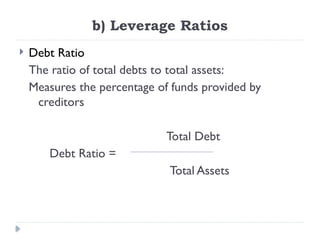
b) Leverage Ratios
Debt Ratio
The ratio of total debts to total assets:
Measures the percentage of funds provided by
creditors
Total Debt
Debt Ratio =
Total Assets
14.
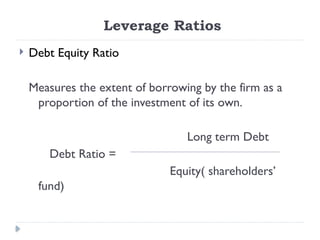
Leverage Ratios
DebtEquity Ratio
Measures the extent of borrowing by the firm as a
proportion of the investment of its own.
Long term Debt
Debt Ratio =
Equity( shareholders’
fund)
15.
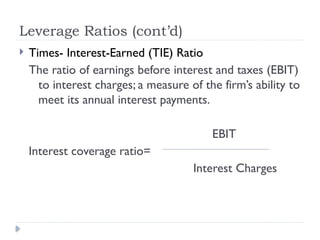
Leverage Ratios (cont’d)
Times- Interest-Earned (TIE) Ratio
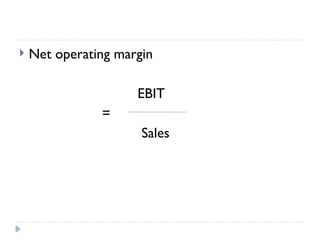
The ratio of earnings before interest and taxes (EBIT)
to interest charges; a measure of the firm’s ability to
meet its annual interest payments.
EBIT
Interest coverage ratio=
Interest Charges
16.
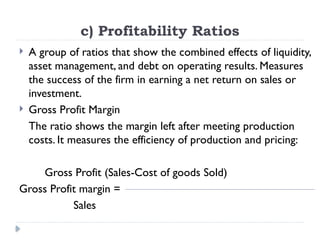
c) Profitability Ratios
A group of ratios that show the combined effects of liquidity,
asset management, and debt on operating results. Measures
the success of the firm in earning a net return on sales or
investment.
Gross Profit Margin
The ratio shows the margin left after meeting production
costs. It measures the efficiency of production and pricing:
Gross Profit (Sales-Cost of goods Sold)
Gross Profit margin =
Sales
Profitability Ratios (cont’d)
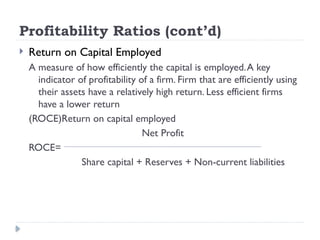
Return on Capital Employed
A measure of how efficiently the capital is employed.A key
indicator of profitability of a firm. Firm that are efficiently using
their assets have a relatively high return. Less efficient firms
have a lower return
(ROCE)Return on capital employed
Net Profit
ROCE=
Share capital + Reserves + Non-current liabilities
20.
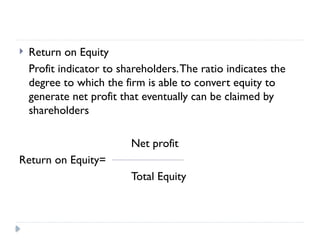
Return onEquity
Profit indicator to shareholders.The ratio indicates the
degree to which the firm is able to convert equity to
generate net profit that eventually can be claimed by
shareholders
Net profit
Return on Equity=
Total Equity
21.
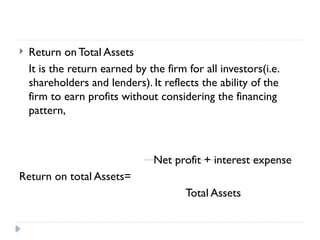
Return onTotal Assets
It is the return earned by the firm for all investors(i.e.
shareholders and lenders). It reflects the ability of the
firm to earn profits without considering the financing
pattern,
Net profit + interest expense
Return on total Assets=
Total Assets
22.
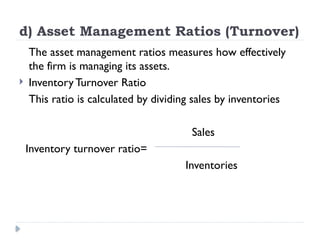
d) Asset ManagementRatios (Turnover)
The asset management ratios measures how effectively
the firm is managing its assets.
Inventory Turnover Ratio
This ratio is calculated by dividing sales by inventories
Sales
Inventory turnover ratio=
Inventories
23.
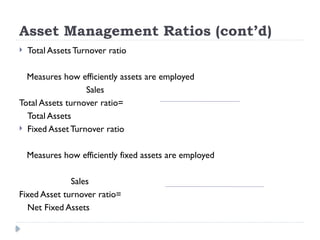
Asset Management Ratios(cont’d)
Total Assets Turnover ratio
Measures how efficiently assets are employed
Sales
Total Assets turnover ratio=
Total Assets
Fixed Asset Turnover ratio
Measures how efficiently fixed assets are employed
Sales
Fixed Asset turnover ratio=
Net Fixed Assets