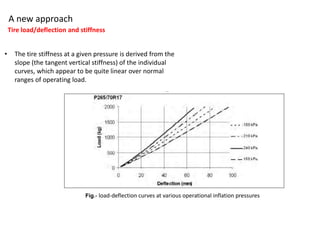
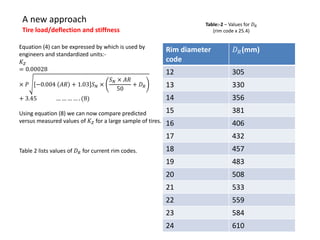
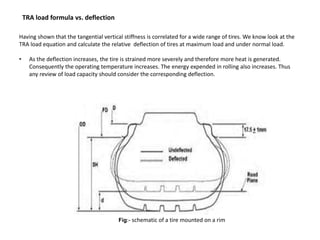
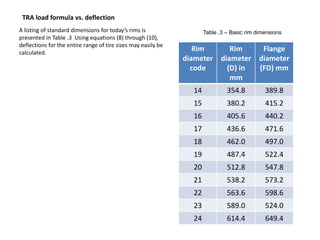
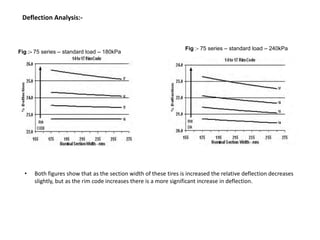
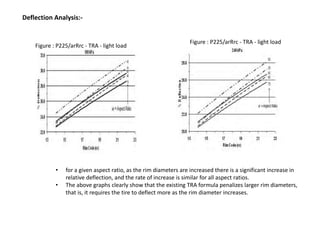
Design parameters responsible for tire load carrying capacity.
It consist TRA (Tire rim association, USA) formula for tire load carrying capacity.
How stiffness is effected by tire design. It also consist tire stiffness analytical formula.
Module 4 numerical problems on cams - cycloidal motiontaruian
This document provides instructions for constructing the displacement diagram and cam profile for a numerical problem involving cycloidal motion of a cam and roller follower. It describes a 10-step process for drawing the displacement diagram, including constructing the rolling circle, dividing it into parts, and transferring displacement values between the outstroke and return stroke. It also outlines how to account for the offset of the roller follower axis from the cam shaft axis when constructing the cam profile, using base, prime and offset circles.
The document discusses balancing of reciprocating masses in engines. It explains that reciprocating parts produce both a shaking force and shaking couple due to varying inertia forces during the engine cycle. The purpose of balancing is to eliminate these effects and reduce vibrations. It describes how balancing masses are used to partially balance primary forces in engines with multiple cylinders arranged in a line. The maximum unbalanced primary and secondary forces and couples are calculated for a example 5 cylinder engine, and it is determined that these peak when the third crank is at 45 degrees position.
Longitudinal Vehicle Dynamics
-Maximum tractive effort of two-axle and track-semitrailer vehicles.
-The braking force of a two-axle vehicle.
-Acceleration time and distance.
-Relationship between engine torque and thrust force.
-Relationship between engine speed and vehicle speed
I. Gear C is fixed:
- Gear D rotates at 1000 rpm in the same direction as B
- Gear E rotates at 1000 rpm in the opposite direction of D
- Output shaft F rotates at 1000 rpm in the opposite direction of B
II. Gear C rotates at 10 rpm:
- Gear D rotates at 1010 rpm in the same direction as B
- Gear E rotates at 1010 rpm in the opposite direction of D
- Output shaft F rotates at 1010 rpm in the opposite direction of B
The document defines and describes the main parts of a tire, including the bead, plies, tread, sidewall, liner, and belts. It discusses different types of tires based on tread pattern (summer, winter, all-season), carcass construction (cross ply, radial ply, belted bias), and whether they use a tube. The main parts of a conventional tube tire and tubeless tire are also outlined. Finally, common tread patterns and important tire markings on the sidewall are briefly mentioned.
This document provides information and steps to design a flat belt drive system to transmit 20 kW of power at 720 rpm from a driving pulley to a driven pulley with a speed ratio of 3 and center distance of 3 meters.
The standard pulley diameters are selected as 400 mm for the driver and 1200 mm for the driven pulley. The design power is calculated to be 25 kW considering a shock load, arc of contact of 164 degrees, and transmission ratio of 3. A 6-ply 112 mm wide Dunlop "FORT" belt is selected to transmit this power.
The length of the belt is calculated to be 8566.6 mm. The pulley widths are selected as 125 mm with 4 arms for
The document discusses spring rates, motion ratios, roll stiffness, and anti-roll bars. It provides equations to calculate spring rates for coil springs and torsion bars based on material properties and geometry. Motion ratio is defined as the displacement ratio between the spring and wheel center, and affects wheel rate. Roll stiffness is determined from individual wheel rates and track width. Asymmetric spring rates and locations are also addressed. Anti-roll bars contribute additional roll stiffness that depends on bar properties and motion ratio.
The document discusses calculating vehicle roll properties and load transfer. It provides information needed to determine roll centers, roll axis, tire stiffness rates, sprung mass center of gravity location, and distribution of sprung weight between the front and rear of the vehicle. Parameters like roll center heights, track widths, spring rates, and vehicle weight distributions are required. Roll centers are defined as the intersection points of lines drawn from the center of the tire contact patch through the suspension. The total sprung weight is calculated by subtracting the unsprung weight from the total vehicle weight.
The document discusses the selection of tires for BAJA vehicles. It provides a brief history of tire development. It then discusses tire definitions, components, construction methods, selection criteria based on vehicle type and performance, and new development approaches including simulation and testing methods. The key factors considered for tire selection include safety, handling, economics, comfort, rolling resistance, traction, wear and ride/handling performance. Predictive methods like FEA simulation and various tests are used to optimize tire design.
The document describes the design of a 12-speed gearbox with an input speed range of 1600 rpm and output speed range of 160-2000 rpm. It involves calculating the step ratio of 1.12, selecting standard speeds between 160-1973 rpm, and determining the kinematic arrangement and number of teeth for each gear to achieve the 12 speeds. The structural formula of the gearbox is 3(1) 2(3) 2(6), meaning the input is split into 3 speeds in stage 1, each of those 3 inputs is split into 2 speeds in stage 2, and each of those 6 inputs is split into 2 speeds in stage 3 to achieve the 12 output speeds.
V-Belts are the very most common type of belt drive used for power transmission. Their important function is to transmit power from a one primary source, like an electric motor, to a secondary unit. They provide the excellent combination of traction, speed transfer, load distribution, and extended service life.
It is obvious that vehicle weight has a linear relationship
with the energy to be dissipated (stored) and the change
in velocity required has a exponential relationship.
• Deceleration times and stopping distances vary
somewhat for all vehicles on a given road surface.
• It should then be obvious that sizing the brake system
components has critical importance with respect to the
potential vehicle velocity and the mass of the vehicle.
• Note that heavy trucks generally have greater stopping
distances as compared to typical passenger cars.
The document discusses tires and the forces acting on vehicles. It provides details on different tire designs like radial and cross-ply tires. Tires transmit motive, braking, and lateral forces between the vehicle and road. These forces depend on factors like the tire construction, road conditions, and weather. The document also examines other forces like normal force, circumferential force, lateral force, braking torque, and yaw moment and how they influence vehicle motion and handling.
This is Part 6 of a 10 Part Series in Automotive Dynamics and Design, with an emphasis on Mass Properties. This series was intended to constitute the basis of a semester long course on the subject.
This document discusses different types of tires. There are two main types - tubed tires which have an inner tube, and tubeless tires which do not have an inner tube. Tubeless tires have advantages like lesser weight, better cooling, lower rolling resistance, and more comfortable ride.
The document also describes different tire constructions - cross-ply/bias ply tires which have fabric plies laid across each other at alternating angles, radial ply tires which have fabric arcs from bead to bead at 90 degree angles, and belted bias ply tires which have belt plies reinforced with wire. Radial ply tires provide benefits like better shock absorption and fuel efficiency compared to cross-ply tires.
This document provides an overview of automotive suspension design. It begins with acknowledging references used and defining an automotive suspension as a 3D four bar linkage system that gives a vehicle maneuverability. The document then outlines the process of suspension design, including selecting targets, architecture, hard points, rates, loads, springs, dampers, and components. Design considerations like ride height, travel, roll stiffness, and load distribution are discussed. Finally, the document discusses how suspension geometry affects vehicle handling characteristics like understeer, oversteer, grip, and wear.
The document discusses the design and components of a gear box. It explains that a gear box provides variable speed and torque from a rotating power source to another device using gears and gear trains. The main components of a gear box include gears, shafts, clutches and forks. Different types of gear boxes are described such as sliding mesh, constant mesh and synchromesh gear boxes. The functions, working and advantages of using preferred numbers in gear box design are also summarized.
This document summarizes the design of an intermediate gearbox for the trailing edge flaps of an Airbus A350. The gearbox assembly consists of a sealed housing, input and output shafts, two spur gears, and four roller bearings. Analysis was conducted to ensure the design met requirements for operating speed, torque limits, life, sealing, and other factors. The key stress point was identified as the shaft shoulder. The gearbox design was modeled in Solidworks and analysis showed it met all specified technical parameters, with minimum margins of 0% and maximum of 16.3%.
The Active suspension system
is a type of
automotive suspension system
which controls
the vertical movement
of the wheels
with respect to
the chassis and the vehicle body
1. Passive Suspensions
2. Self Leveling Suspensions
3. Semi-Active Suspension - Slow Active
- Low Bandwidth
- High Bandwidth
4. Full Active Suspension System
A document discusses various types of brakes, including block or shoe brakes, band brakes, and internal expanding brakes. It provides examples to calculate braking torque, normal force, tension in brake bands, and forces required to stop motion. It explains factors like coefficient of friction, drum diameter, angle of contact, and fulcrum position impact brake design and performance. Design considerations include making brakes self-energizing without becoming self-locking. Materials and dimensions are selected based on stresses, pressures, and ability to dissipate heat from absorbed energy.
1. The document discusses braking systems for four-wheeled vehicles, including braking the rear wheels only, front wheels only, or all four wheels.
2. Mathematical equations are provided for calculating the retardation (deceleration) of the vehicle based on factors like mass, coefficient of friction, and wheelbase.
3. Specific equations are given for calculating retardation when braking the rear wheels only, front wheels only, or all four wheels, with braking all four wheels providing the shortest braking distance.
This document provides an overview of conveyor belt techniques, including:
- A brief history of conveyor belt development from the late 19th century to present day. Key milestones included the introduction of rubber belts, steel cord belts, and new reinforcing materials.
- The document aims to assist operators, engineers, and project managers by providing elementary data, instructions, and tips for accurate calculations and component selection.
- It covers topics like belt and drive system design, belt materials, calculations, installation examples, and more. The goal is to help understand the background and criteria for optimizing belt and conveyor system selection.
This document discusses different types of gear trains including simple, compound, reverted, and epicyclic gear trains. It provides details on the components, configurations, terminology, and methods for calculating speed and velocity ratios for each type of gear train. Key points covered include how simple gear trains involve one gear on each shaft, compound gear trains have multiple gears on a shaft, reverted gear trains have coaxial input and output shafts, and epicyclic gear trains allow shaft axes to move relative to a fixed axis. Formulas and a tabular method are presented for analyzing epicyclic gear trains.
Frame is a ladder shaped structure with two longitudinal rails/beams (Frame side members) and properly located many integrating and reinforcing cross members, which form the ladder structure that is used as the interface/platform between the power package and the body package in Automobiles.
Ratio of Driving Tension for Flat Belts | Mechanical EngineeringTransweb Global Inc
This document discusses belt drives and provides information on the ratio of driving tensions for flat belt drives. It covers types of belts, including flat, V-belts, and circular belts. It also discusses tight and slack side tensions, coefficient of friction, and angle of contact as they relate to calculating the ratio of tensions in a flat belt drive system. The document provides an example calculation and recommends a link for more detailed information.
The document discusses the process of designing an automotive suspension system. It describes selecting a suspension architecture and targets, designing components to be strong yet light, and analyzing loads, dynamics, and compliance. Static targets include geometry and ride heights. Dynamic targets include wheel frequency and rollover threshold. The suspension design aims to achieve handling and ride quality goals within packaging and cost constraints.
The document discusses stress concentration and fatigue failure in machine elements. It defines stress concentration as the localization of high stresses due to irregularities or abrupt changes in cross-section. Stress concentration can be reduced by avoiding sharp changes in cross-section and providing fillets and chamfers. Fatigue failure occurs when fluctuating stresses cause cracks over numerous load cycles. The endurance limit is the maximum stress amplitude that causes failure after an infinite number of cycles. Factors like stress concentration, surface finish, size, and mean stress affect the endurance limit. Designs should minimize stress raisers and protect against corrosion to prevent fatigue failures.
The document discusses design considerations for machine elements subjected to fluctuating loads. It covers topics such as stress concentration, fatigue failure, endurance limit, factors affecting fatigue strength, and methods to reduce stress concentration and improve fatigue life. Stress concentration occurs due to discontinuities and can be reduced by avoiding abrupt changes in cross-section and providing fillets. Fatigue failure is caused by fluctuating stresses and depends on factors like the number of cycles and mean stress. The endurance limit is the maximum stress amplitude a material can withstand without failure under completely reversed loading. Surface finish, size, and mean stress affect the endurance limit.
This document discusses vehicle aerodynamics and flow optimization techniques. It covers:
1) The objectives of optimizing flow past vehicles include reducing fuel consumption, improving comfort, and enhancing driving characteristics.
2) Vehicle aerodynamics involves flow around the body, components, and passenger compartment. Approaches to optimization evolved from streamlining to detailed analyses.
3) Numerical simulations and wind tunnel tests are used to analyze flow and optimize shapes to reduce drag, lift, and mud deposition. Rounding edges, tapering rear ends, and adding spoilers can all improve aerodynamic performance.
The document describes research into optimizing the design of cam profiles for radial piston hydraulic motors. It develops equations to calculate displacement, pressure angle, torque, and cumulative torque at different points on the cam profile based on varying design parameters like roller radius, number of rollers, fluid pressure, etc. A computer code was created to automatically generate cam profiles by applying the equations, and analyze how changes to the input parameters affect the maximum and variation in cumulative torque output. The code found that 8 rollers produced the minimum variation in cumulative torque of 3.89% for their case.
This section calculates the hoop stress on a winch drum under pulling and braking loads using Hampe's solution method. It finds that:
1) The maximum hoop stress occurs at the same position (ξ=0.8) for both loads.
2) The stresses are lower than design code predictions due to accounting for decreasing rope tension.
3) A reinforced drum design is proposed, with thicker sections only where stresses are highest between the 18th-24th wraps.
4) Calculations show this design can withstand the loads with a 52mm thickness in high-stress sections versus the original 70mm.
This section calculates the hoop stress on a winch drum under pulling and braking loads using Hampe's solution method. It finds that:
1) The maximum hoop stress occurs at the 0.8 position from the near end of the drum for both pulling (348.4 MPa) and braking (370.7 MPa) loads.
2) The calculated maximum stresses are 19% and 42% lower than design code values for pulling and braking loads respectively.
3) It is proposed to reinforce the drum thickness only in the area around the 0.8 position to resist the higher stresses, rather than using a uniform thickness.
MAchine Design and CAD Presentation. its topic is about Hydrodynamic Journal bearings, Heat Generated in a Journal Bearing
Design Procedure for Journal Bearing
And Examples
The document discusses sliding contact bearings and hydrodynamic journal bearings. It provides classifications of bearings based on the nature of contact, advantages and disadvantages of sliding contact bearings over rolling contact bearings. It describes hydrodynamic and hydrostatic bearings. The document also includes examples of design calculations for hydrodynamic journal bearings, including determining minimum oil film thickness, coefficient of friction, power loss, oil flow rate, side leakage, and oil temperature selection.
TYRE WEAR
Tidy shoes just don't give an appearance boost but also underline the ground grip; somewhat analogous to tyre in vehicles.
Rolling wheels have always been a very dynamic subject to deal with. Apart from regular maintenance of the vehicle, tyre wear is a major point of concern for every automotive owner . Its more dear in the commercial segment . Its second largest element of cost of operation after fuel . Truck , bus , fleet owners or any commercial vehicle driver - carrier - owner would always be keen on getting tyre life irrespective how he drives and loads .
A considerable research has been done in tyre tread wear with
respect to road friction but still the suspension parameters and
steering arrangements are in phase on development. There is no evidence to suggest that certain types of suspensions or steering arrangements have any particular adverse impact on tire life, it's more of a perception than factuality.
We are trying to build an analytical / illustrative module which
explains the appropriate relationship between all geometric parameters and tire life in particular irregular tyre wear. This is been accomplished by varying the geometric angles and tracing their effect on tread wear. Archard' theory been the base of this research work we have sorted some equations, but still some parameters are not accounted altogether. For ex., while calculating the varying toe and camber angles temperature or global contact points remain unaccounted. And still some uncertainties remain regarding the friction coefficients.
The objective is to build an model which can explain and hence suggest correction to reduce tyre wear and enhance life. While its complex with varying geometry under various speeds, loads & road condition .
All leads are appreciated.
1. The document discusses different types of clutches including positive clutches and friction clutches. It describes the key components and operation of a single plate clutch commonly used in automotive applications.
2. Formulas are presented for calculating the torque capacity of clutches under uniform pressure and uniform wear conditions based on geometric parameters, pressure, and coefficient of friction.
3. The document provides an example problem demonstrating the use of the formulas to design a multi-plate clutch meeting specific torque and speed requirements.
Design of Machine Elements - Unit 5 Procedures Kumaravel
This document discusses terms used in hydrodynamic journal bearings such as diameter clearance, radial clearance, diameteral clearance ratio, and minimum oil film thickness. It also discusses methods for determining the coefficient of friction, critical pressure, and Sommerfeld number for journal bearings. The document outlines a 10 step design procedure for selecting journal bearings including calculating bearing size, pressure, clearance, characteristics number, heat generation, and material selection. It also discusses components, types, and selection procedures for rolling element bearings.
This document discusses optimizing haul road design for resource development projects in Northern Canada. It focuses on the interactions between ultra-heavy dump trucks and haul roads as a single transportation system. Stiffer road pavements can reduce rolling resistance and fuel consumption for trucks by decreasing deflection. The Critical Strain Method is advocated for more sophisticated pavement design over traditional CBR methods to model strains from heavy truck loads. A full-scale experiment is proposed to verify predicted displacements, stresses, and strains from this design method for ultra-heavy loading.
The document summarizes an experiment examining the deformation of a rubber band under an applied load up to 20 inches. Key findings include:
1) The rubber band undergoes considerable deformation from breaking of weak intermolecular bonds between polymer chains.
2) At larger displacements, stronger covalent bonds within polymer chains are stretched after they untangle, but recover upon unloading.
3) Rubber bands experience small initial stress for large strain as chains untangle, but higher stress for small strain at greater displacements.
4) Rubber is not perfectly elastic as believed, with some deformation and hysteresis observed.
عرض تقديمي لتصميم طريق وكيفية ابعاد الطريقssuser09e10f
This document discusses road-vehicle performance and its impact on highway engineering and design. It covers the following key points:
- Vehicle capabilities like acceleration/braking and human factors like reaction time form the basis of roadway design guidelines.
- Tractive effort and resistance are opposing forces that determine vehicle performance. The three major sources of resistance are aerodynamic, rolling, and grade.
- Aerodynamic resistance increases with speed squared and power required increases with speed cubed. Rolling resistance depends on factors like tire and surface properties. Grade resistance depends on road slope.
- Maximum tractive effort is limited by the coefficient of road adhesion and weight transfer during acceleration or braking. Braking performance is important
Gears are used to transmit mechanical power from one rotating shaft to another. There are several types of gears that are commonly used including spur gears, helical gears, bevel gears, and worm gears. Spur gears have straight teeth that allow for easy engagement and disengagement. This document discusses the design, specification, and selection of spur gears based on failure due to bending stress using the Lewis equation. It provides information on gear terminology, types of gear trains, tooth systems, force analysis, stresses, selection procedures, and wear failure. Examples are also included to demonstrate how to select suitable gears based on given design parameters and constraints.
lecture 4 (design procedure of journal bearing)ashish7185
This document provides information about the design procedure for sliding contact bearings. It defines key terms used in hydrodynamic journal bearings such as diametral clearance, radial clearance, eccentricity, minimum oil film thickness, and short/long bearings. It discusses bearing characteristic number and bearing modulus, and how they relate to the coefficient of friction. Equations are provided for critical pressure, heat generated in bearings, and heat dissipated by bearings. The design procedure involves selecting bearing dimensions, material properties, operating parameters, and verifying thermal equilibrium conditions.
This document provides an introduction to sliding contact bearings. It discusses the basic functions and applications of bearings, and classifications of bearings based on load direction and contact type. Specifically, it covers radial and thrust bearings, and sliding and rolling contact bearings. It describes the components, operation, and types of sliding contact or plain bearings, including journal, slipper, and thrust bearings. Key terms related to hydrodynamic journal bearings like diametral clearance are also defined.
IRJET- To Design a New Cross Section for Connecting Rod with a Target of ...IRJET Journal
This document describes the design and analysis of alternative cross-sections for a connecting rod to achieve a 10% weight reduction target. Three new cross-sections were designed and analyzed using finite element analysis: a T-section, C-section, and hollow C-section. Analysis found the C-section design achieved a 9% weight reduction while maintaining equivalent stresses within material limits. Response surface methodology was then used to further optimize the C-section design, resulting in a 14% weight reduction compared to the original I-section design.
The document analyzes the effect of adding dimples to the surface of an airfoil wing. It discusses how dimples can delay flow separation and transition the boundary layer from laminar to turbulent, reducing pressure drag. The study models a wing with and without dimples using design software to analyze lift and drag at different angles of attack. The results show that a wing with dimples has an increased critical angle of stall and variations in lift and drag compared to a smooth wing. Future work could include building prototypes to validate the numerical analysis.
This document provides details on the design of a continuous one-way reinforced concrete slab. It includes minimum thickness requirements, equations for calculating moments and shear, maximum reinforcement ratios, and minimum reinforcement ratios. An example is then provided to demonstrate the design process. The slab is designed to have a thickness of 6 inches with 0.39 in2/ft of tension reinforcement in the negative moment region and 0.33 in2/ft in the positive moment region.
Prediction of Electrical Energy Efficiency Using Information on Consumer's Ac...PriyankaKilaniya
Energy efficiency has been important since the latter part of the last century. The main object of this survey is to determine the energy efficiency knowledge among consumers. Two separate districts in Bangladesh are selected to conduct the survey on households and showrooms about the energy and seller also. The survey uses the data to find some regression equations from which it is easy to predict energy efficiency knowledge. The data is analyzed and calculated based on five important criteria. The initial target was to find some factors that help predict a person's energy efficiency knowledge. From the survey, it is found that the energy efficiency awareness among the people of our country is very low. Relationships between household energy use behaviors are estimated using a unique dataset of about 40 households and 20 showrooms in Bangladesh's Chapainawabganj and Bagerhat districts. Knowledge of energy consumption and energy efficiency technology options is found to be associated with household use of energy conservation practices. Household characteristics also influence household energy use behavior. Younger household cohorts are more likely to adopt energy-efficient technologies and energy conservation practices and place primary importance on energy saving for environmental reasons. Education also influences attitudes toward energy conservation in Bangladesh. Low-education households indicate they primarily save electricity for the environment while high-education households indicate they are motivated by environmental concerns.
Optimizing Gradle Builds - Gradle DPE Tour Berlin 2024Sinan KOZAK
Sinan from the Delivery Hero mobile infrastructure engineering team shares a deep dive into performance acceleration with Gradle build cache optimizations. Sinan shares their journey into solving complex build-cache problems that affect Gradle builds. By understanding the challenges and solutions found in our journey, we aim to demonstrate the possibilities for faster builds. The case study reveals how overlapping outputs and cache misconfigurations led to significant increases in build times, especially as the project scaled up with numerous modules using Paparazzi tests. The journey from diagnosing to defeating cache issues offers invaluable lessons on maintaining cache integrity without sacrificing functionality.
Supermarket Management System Project Report.pdfKamal Acharya
Supermarket management is a stand-alone J2EE using Eclipse Juno program.
This project contains all the necessary required information about maintaining
the supermarket billing system.
The core idea of this project to minimize the paper work and centralize the
data. Here all the communication is taken in secure manner. That is, in this
application the information will be stored in client itself. For further security the
data base is stored in the back-end oracle and so no intruders can access it.
Build the Next Generation of Apps with the Einstein 1 Platform.
Rejoignez Philippe Ozil pour une session de workshops qui vous guidera à travers les détails de la plateforme Einstein 1, l'importance des données pour la création d'applications d'intelligence artificielle et les différents outils et technologies que Salesforce propose pour vous apporter tous les bénéfices de l'IA.
Mechatronics is a multidisciplinary field that refers to the skill sets needed in the contemporary, advanced automated manufacturing industry. At the intersection of mechanics, electronics, and computing, mechatronics specialists create simpler, smarter systems. Mechatronics is an essential foundation for the expected growth in automation and manufacturing.
Mechatronics deals with robotics, control systems, and electro-mechanical systems.
Open Channel Flow: fluid flow with a free surfaceIndrajeet sahu
Open Channel Flow: This topic focuses on fluid flow with a free surface, such as in rivers, canals, and drainage ditches. Key concepts include the classification of flow types (steady vs. unsteady, uniform vs. non-uniform), hydraulic radius, flow resistance, Manning's equation, critical flow conditions, and energy and momentum principles. It also covers flow measurement techniques, gradually varied flow analysis, and the design of open channels. Understanding these principles is vital for effective water resource management and engineering applications.
Height and depth gauge linear metrology.pdfq30122000
Height gauges may also be used to measure the height of an object by using the underside of the scriber as the datum. The datum may be permanently fixed or the height gauge may have provision to adjust the scale, this is done by sliding the scale vertically along the body of the height gauge by turning a fine feed screw at the top of the gauge; then with the scriber set to the same level as the base, the scale can be matched to it. This adjustment allows different scribers or probes to be used, as well as adjusting for any errors in a damaged or resharpened probe.
DEEP LEARNING FOR SMART GRID INTRUSION DETECTION: A HYBRID CNN-LSTM-BASED MODELijaia
As digital technology becomes more deeply embedded in power systems, protecting the communication
networks of Smart Grids (SG) has emerged as a critical concern. Distributed Network Protocol 3 (DNP3)
represents a multi-tiered application layer protocol extensively utilized in Supervisory Control and Data
Acquisition (SCADA)-based smart grids to facilitate real-time data gathering and control functionalities.
Robust Intrusion Detection Systems (IDS) are necessary for early threat detection and mitigation because
of the interconnection of these networks, which makes them vulnerable to a variety of cyberattacks. To
solve this issue, this paper develops a hybrid Deep Learning (DL) model specifically designed for intrusion
detection in smart grids. The proposed approach is a combination of the Convolutional Neural Network
(CNN) and the Long-Short-Term Memory algorithms (LSTM). We employed a recent intrusion detection
dataset (DNP3), which focuses on unauthorized commands and Denial of Service (DoS) cyberattacks, to
train and test our model. The results of our experiments show that our CNN-LSTM method is much better
at finding smart grid intrusions than other deep learning algorithms used for classification. In addition,
our proposed approach improves accuracy, precision, recall, and F1 score, achieving a high detection
accuracy rate of 99.50%.
2. Content
• Objectives
• History: TRA load formula
• A new approach (load, deflection & stiffness)
• TRA load formula vs. deflection
• Deflection Analysis
• Proposed load formula
3. Objectives
The Tire and Rim Association, Inc. (TRA)
• This chapter presents the evolution of the TRA load formula
for passenger car tires from the early years to its current
application.
• The Tire and Rim Association, Inc. (TRA) for over 100 years
has been the establishment of interchangeability standards
for tires
• The load formula is then compared to one based upon
constant relative deflection.
4. History
TRA load formula
Prior to 1928:
• Loads were
not
dependent
on rim
diameters;
• Loads varied
in relation to
tire section
width;
• Loads varied
in direct ratio
to the air
pressure.
• For lesser loads the ratings were determined by taking a direct proportion of the
maximum inflation pressure as illustrated by the formula below:
𝐿 = 𝐿0 𝑃/𝑃0
Where:
L = load limit at pressure P
𝐿0= maximum load limit at 𝑃0
• The first formula adopted by TRA was developed in the mid 1930’s by C. G. Hoover, a
mathematician who later served as the staff director of TRA.
𝐿 = 6.65 × 𝑃0.585
× 𝑆1.702
× (𝐷𝑅 + 𝑆)/(19 + 𝑆)
Where:
𝐿 = tire load carrying capacity at pressure P
P = tire inflation pressure
S = tire section width (on rim width = 62.5% of tire
section width)
𝐷𝑅=nominal rim diameter
• The above formula was revised in 1936 to the following:
𝐿 = 𝐾 × 0.425 × 𝑃0.585
× 𝑆1.39
× (𝐷𝑅 + 𝑆) …………………………(1)
5. Basic formula:
The origins of the load formula are not well documented. However, based on the available information, Hoover related the tire load carrying
capacity to the tire volume in developing the formula.
• The direct proportionality, 𝐿 = 𝐿0 𝑃/𝑃0 , was adjusted to 𝐿 = 𝐿0 𝑃/𝑃0
𝑛
, with n = 0.585, since it was thought that the load-pressure
relationship would not really be a linear one.
• The new relationship indicates that for each tire design, a constant value exists for the ratio 𝐿/𝑃𝑛
=𝐿0/𝑃0
𝑛
.
• The tire load carrying capacity was assumed to be directly proportional to the air volume 𝑉. Thus, 𝐿/𝑃𝑛
would depend linearly on air
volume 𝑉. 𝐿/𝑃𝑛
=const. 𝑉.
As the cross-section of a tire was approximately circular in the 1930’s, the volume 𝑉 was given by :
𝑉= 𝑐𝑜𝑛𝑠𝑡. 𝑆2
(𝐷𝑅 + 𝑆)
Where 𝐷𝑅 is rim diameter, 𝑆 is section diameter. Combining the above equations yields:
𝐿= 𝑐𝑜𝑛𝑠𝑡. 𝑃𝑛
× 𝑆2
(𝐷𝑅 + 𝑆)
However the volume of a circular annulus is not exactly proportional to 𝑆2
. The exponent of 2 for 𝑆 was reduced to 1.39 – probably based on
field experience of tire performance at that time – so that the basic tire load formula became:
𝐿= 𝑐𝑜𝑛𝑠𝑡. 𝑃𝑛
× 𝑆1.39
(𝐷𝑅 + 𝑆)
6. A new approach
Tire load/deflection and stiffness
Fig.- load-deflection curves at various operational inflation pressures
• The tire stiffness at a given pressure is derived from the
slope (the tangent vertical stiffness) of the individual
curves, which appear to be quite linear over normal
ranges of operating load.
7. A new approach
Tire load/deflection and stiffness
• As a result of Rhyne’s work, we know that the tangent stiffness 𝐾𝑍 , is a function of tire pressure,
footprint width and outside diameter and may be expressed as follows:
𝐾𝑍 = 0.00028 × 𝑃 𝑊 × 𝑂𝐷 + 3.45
…………………. (2)
Where,
𝐾𝑍= tangent stiffness(kg/mm)
P= tire inflation pressure(kPa)
W= tire footprint width(mm)
OD= outside diameter(mm)
8. A new approach
Tire load/deflection and stiffness
Relationship between footprint width and nominal section
width:-
𝑊 ≈ −0.004 𝐴𝑅 + 1.03 𝑆𝑁 ≈ 𝑎 × 𝑆𝑁
………..(3)
Where:
W = Footprint width(mm)
AR = Aspect Ratio
𝑆𝑁= Nominal Section Width(mm)
a= factor from table 1
• The effect of equation (3) is that as the Aspect Ratio
decreases, the factor ‘a’ by which the nominal section
width, 𝑆𝑁, is multiplied, increases, as shown in Table 1.
• Thus, for lower aspect ratio tires, the footprint width as a
percentage of the width of the tire section, is inversely
proportional to the aspect ratio.
Aspect ratio “a”
25 .93
30 .91
35 .89
40 .87
45 .85
50 .83
55 .81
60 .97
65 .77
70 .75
75 .73
80 .71
Table:-1
9. A new approach
Tire load/deflection and stiffness
By using equation (2) & equation (3),
𝐾𝑍 = 0.00028 × 𝑃 −0.004 𝐴𝑅 + 1.03 𝑆𝑁 × 𝑂𝐷 + 3.45 … … … … (4)
We know, 𝑂𝐷 = 2𝐻 + 𝐷𝑅 ……………(5)
Where,
H = Design Section Height (mm)
𝐷𝑅= Rim Dia Code (mm)
And 𝐻 =
𝑆𝑁
100
× 𝐴𝑅 ………………….(6)
Where,
𝑆𝑁= nominal section width(mm)
𝐴𝑅= aspect ratio
Thus 𝑂𝐷 may be expressed in terms of section width, aspect ratio and rim code as follows:
𝑂𝐷 =
𝑆𝑁×𝐴𝑅
50
+ 𝐷𝑅 ………………..(7)
10. A new approach
Tire load/deflection and stiffness
Equation (4) can be expressed by which is used by
engineers and standardized units:-
𝐾𝑍
= 0.00028
× 𝑃 −0.004 𝐴𝑅 + 1.03 𝑆𝑁 ×
𝑆𝑁 × 𝐴𝑅
50
+ 𝐷𝑅
+ 3.45 … … … … . (8)
Using equation (8) we can now compare predicted
versus measured values of 𝐾𝑍 for a large sample of tires.
Table 2 lists values of 𝐷𝑅 for current rim codes.
Rim diameter
code
𝐷𝑅(mm)
12 305
13 330
14 356
15 381
16 406
17 432
18 457
19 483
20 508
21 533
22 559
23 584
24 610
Table:-2 – Values for 𝐷𝑅
(rim code x 25.4)
11. TRA load formula vs. deflection
Having shown that the tangential vertical stiffness is correlated for a wide range of tires. We know look at the
TRA load equation and calculate the relative deflection of tires at maximum load and under normal load.
• As the deflection increases, the tire is strained more severely and therefore more heat is generated.
Consequently the operating temperature increases. The energy expended in rolling also increases. Thus
any review of load capacity should consider the corresponding deflection.
Fig:- schematic of a tire mounted on a rim
12. TRA load formula vs. deflection
Equivalent static deflection formula can be written as:-
𝑑 =
𝐿
𝐾𝑍
…………………….(9)
Where,
d = deflection(mm)
L= load(in kg)
𝐾𝑍= tangential stiffness(kg/mm)
• The deflection under load is considered to be the main determinant of tire durability and for different types of
tire the relative deflection is the appropriate measure.
• Thus, to compare a variety of tire diameters, aspect ratios and rim diameters, it is desirable to express the
deflection as a percent of the section height (SH).
%𝑑 =
𝑑
𝑆𝐻
× 100 =
2𝐷
𝑂𝐷−𝐹𝐷
× 100 …………….(10)
where: FD = rim flange diameter (mm)
SH = section height (above rim flange) (mm)
OD = outside diameter (mm)
13. TRA load formula vs. deflection
A listing of standard dimensions for today’s rims is
presented in Table .3 Using equations (8) through (10),
deflections for the entire range of tire sizes may easily be
calculated.
Rim
diameter
code
Rim
diameter
(D) in
mm
Flange
diameter
(FD) mm
14 354.8 389.8
15 380.2 415.2
16 405.6 440.2
17 436.6 471.6
18 462.0 497.0
19 487.4 522.4
20 512.8 547.8
21 538.2 573.2
22 563.6 598.6
23 589.0 524.0
24 614.4 649.4
Table .3 – Basic rim dimensions
14. Deflection Analysis:-
Fig :- 75 series – standard load – 180kPa
Fig :- 75 series – standard load – 240kPa
• Both figures show that as the section width of these tires is increased the relative deflection decreases
slightly, but as the rim code increases there is a more significant increase in deflection.
15. Deflection Analysis:-
Figure : P225/arRrc - TRA - light load
• for a given aspect ratio, as the rim diameters are increased there is a significant increase in
relative deflection, and the rate of increase is similar for all aspect ratios.
• The above graphs clearly show that the existing TRA formula penalizes larger rim diameters,
that is, it requires the tire to deflect more as the rim diameter increases.
16. From equation (9), for the linear case, we see that load is equal to the product of deflection and stiffness, and we
have already developed equation (8) to calculate stiffness.
Transposing equation (10) to give the deflection in terms of the nominal section width and aspect ratio results in
the following equation:
𝑑 =
%𝑑×(𝐻−17.5)
100
=
%𝑑×(
𝑆𝑁×𝐴𝑅
100
−17.5)
100
……………..(11)
From equation (8) and (11)-
𝐿
=
%𝑑 × (
𝑆𝑁 × 𝐴𝑅
100
− 17.5)
100
× [0.00028 × 𝑃 −0.004 𝐴𝑅 + 1.03 𝑆𝑁 ×
𝑆𝑁 × 𝐴𝑅
50
+ 𝐷𝑅
+ 3.45 ] … … … … . (12)
Proposed load formula:-