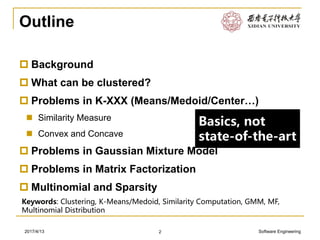
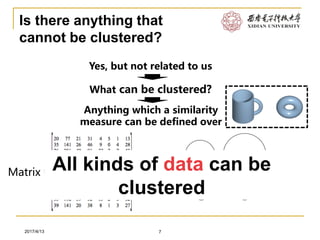
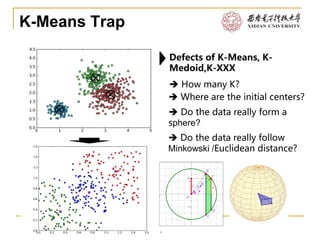
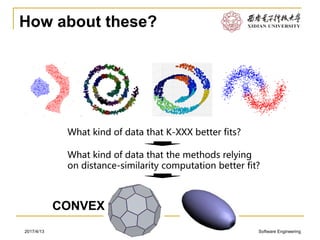
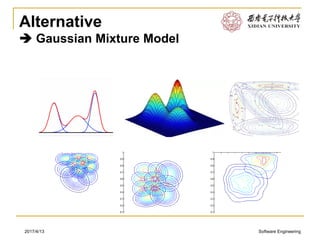
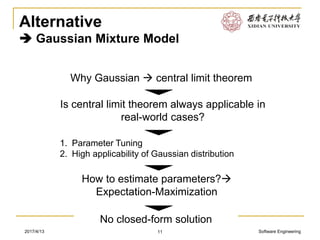
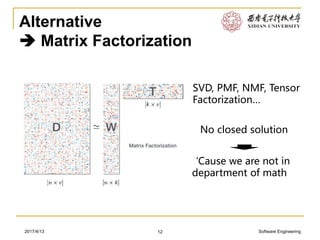
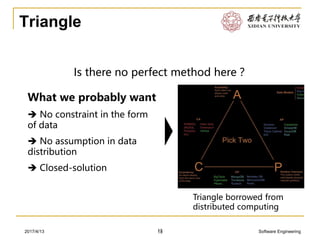
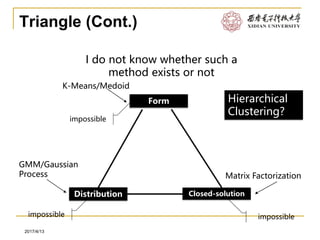
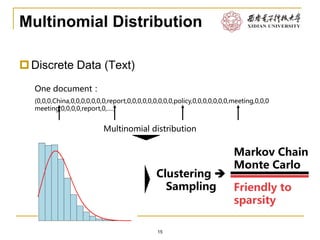
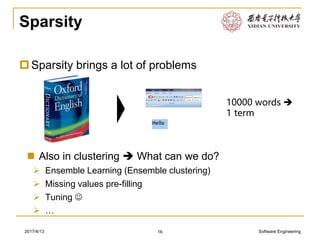
This document discusses various approaches to text clustering, including K-means clustering, Gaussian mixture models, and matrix factorization. It notes some of the limitations and assumptions of these approaches, such as the need to specify the number of clusters for K-means and the assumption of Gaussian distributions. The document also discusses other approaches like hierarchical clustering and methods that can handle sparse data like text. The goal is to provide an overview of clustering techniques for text without advanced mathematics.
An Abstract Framework for Agent-Based Explanations in AIGiovanni Ciatto
We propose an abstract framework for XAI based on MAS encompassing the main definitions and results from the literature, focussing on the key notions of interpretation and explanation.
Gabriella Casalino, Nicoletta Del Buono, Corrado Mencar (2011) Subtractive Initialization of Nonnegative Matrix Factorizations for Document Clustering, 188-195. In Fuzzy Logic and Applications (WILF 2011).
The 9th International Workshop on Fuzzy Logic and Applications, August 29-31 2011, Trani
Interactive Learning of Bayesian NetworksNTNU
Using domain/expert knowledge when learning Bayesian networks from data has been considered a promising idea since the very beginning of the field. However, in most of the previously proposed approaches, human experts do not play an active role in the learning process. Once their knowledge is elicited, they do not participate any more. The interactive approach for integrating domain/expert knowledge we propose in this work aims to be more efficient and effective. In contrast to previous approaches, our method performs an active interaction with the expert in order to guide the search based learning process. This method relies on identifying the edges of the graph structure which are more unreliable considering the information present in the learning data. Another contribution of our approach is the integration of domain/expert knowledge at different stages of the learning process of a Bayesian network: while learning the skeleton and when directing the edges of the directed acyclic graph structure.
one of the areas of discrete mathematics is graph theory. From a pure mathematics viewpoint, graph theory studies the pairwise relationships between objects. Those objects are vertices. Graph theory is frequently applied to analysing relationships between objects. It is a natural extension of graph theory to apply that mathematical tool to the evaluation of forensic evidence. In fact the literature reveals several, limited, forensic applications of graph theory. The current paper describes a more broad based application of graph theory to the problem of evaluation relationships in forensic investigation. The process takes standard graph theory and identifies entities in the investigation as vertices with the connections between the various entities as edges. Those entities can be suspects, victims, computer system, or any entity relevant to the investigation. Regardless of the nature of the entity, all entities are represented as vertices, and the relationship between them is represented as edges connecting the vertices. This allows the mathematical modelling of the events in question and facilitates analysis of the data.
A Study on Transition of Logic Connectives to Induced Linked Fuzzy Relational...ijcoa
Fuzzy logic had been applied in the area of creative literature by using logical connectives in it and also by employing basic fuzzy logic principles like projections and max-min composition. Now this paper incorporates the logical connectives and the transformation from logical connectives to fuzzy based model approach. This paper has following sections. In section one,we recall the logic connectives and its adaptation in the world of creative literature. In section two, we analyse our problem with induced fuzzy relational maps. In section three, we recall the notion of induced fuzzy relational maps. In section four, we analyse and extend the fuzzy logic connectives by applying the results in induced fuzzy relational maps. In section five, we interpret the result obtained by both ways. Final section gives the conclusions based on our study.
A brief introduction to data visualisation using R. It contains both basic and advanced visualisation techniques with sample codes. The datasets being used are mostly available with RStudio.
With argumentation trails we introduce an approach of finding relevant associations between arbitrary terms. An argumentation trail between two terms is an ordered list of cooccurrences, providing a connected path from the origin to the endpoint of the argumentation. Within this paper the automatic generation of argumentation trails is examined and assessed. Furthermore, the
formal representation of these trails as Topic Maps is implemented. This enables the integration of argumentation trails with further background information to support sensemaking or other discourse enriching techniques for academic or political debates.
FIRST-ORDER MATHEMATICAL FUZZY LOGIC WITH HEDGES cscpconf
In this paper, we consider first-order mathematical fuzzy logic expanded by many hedges. This is based on the fact that, in the real world, many hedges can be used simultaneously, and some hedge modifies truth (or meaning of sentences) more than another hedge. Moreover, each hedge may or may not have a dual one. We expand two axiomatizations for propositional mathematical fuzzy logic with many hedges to the first-order level and prove a number of completeness results for the resulting logics. We also consider logics with many hedges based on -core fuzzy logics.
Automated Education Propositional Logic Tool (AEPLT): Used For Computation in...CSCJournals
The Automated Education Propositional Logic Tool (AEPLT) is envisaged. The AEPLT is an automated tool that simplifies and aids in the calculation of the propositional logics of compound propositions of conjuction, disjunction, conditional, and bi-conditional. The AEPLT has an architecture where the user simply enters the propositional variables and the system maps them with the right connectives to form compound proposition or formulas that are calculated to give the desired solutions. The automation of the system gives a guarantee of coming up with correct solutions rather than the human mind going through all the possible theorems, axioms and statements, and due to fatigue one would bound to miss some steps. In addition the AEPL Tool has a user friendly interface that guides the user in executing operations of deriving solutions.
For non-grid 3D images like point clouds and meshes, and inherently graph-based data.
Inherently graph-based data include for example brain connectivity analysis, scientific article citation networks, (social) network analysis, etc.
Alternative download link:
https://www.dropbox.com/s/2o3cofcd6d6e2qt/geometricGraph_deepLearning.pdf?dl=0
Leveraging Flat Files from the Canvas LMS Data Portal at K-StateShalin Hai-Jew
A lot of data are created in an LMS instance, and much of this can be analyzed for insight. In 2016, Instructure, the makers of Canvas, made their LMS data available to their customers through a data portal (updated monthly). This portal enables access to a number of flat files related to that particular instance. This presentation showcases how this big data was analyzed on a regular laptop with basic office software, to summarize Kansas State University’s use of the LMS. Methods for analysis include the following: basic descriptive statistics, survival analysis, computational linguistic analysis, and others.
The results are reported out with both numbers and data visualizations, including classic pie charts, line graphs, bar charts, mixed-charts, word clouds, and others. The findings provide some insights about how to approach the data, how to use a data dictionary, and other methods for extracting the data for awareness and practical decision-making. This work also is suggestive of next steps for more advanced analysis (using the flat files in a SQL database).
More information about this may be accessed at http://scalar.usc.edu/works/c2c-digital-magazine-spring--summer-2017/wrangling-big-data-in-a-small-tech-ecosystem.
A STUDY ON SIMILARITY MEASURE FUNCTIONS ON ENGINEERING MATERIALS SELECTION cscpconf
While designing a new type of engineering material one has to search for some existing
materials which suits design requirement and then he can try to produce new kind of
engineering material. This selection process itself is tedious as he has to select few numbers of
materials out of a set of lakhs of materials. Therefore in this paper a model is proposed to select
a particular material which suits the user requirement, by using some similarity/distance
measuring functionalities. Here thirteen different types of similarity/distance measuring
functionalities are examined. Performance Index Measure(PIM) is calculated to verify the
relative performance of the selected material with the target material. Then all the results are
normalised for the purpose of analysing the results. Hence the proposed model reduces the
wastage of time in selection and also avoids the haphazardly selection of the materials in materials design and manufacturing industries.
T OWARDS A S YSTEM D YNAMICS M ODELING M E- THOD B ASED ON DEMATELijcsit
If System Dynamics (SD) models are constructed based
solely on decision makers' mental models and u
n-
derstanding of the context subject to study, then the resulting systems must necessarily bear some d
e
gree of
deficiency due to the subjective, limited, and internally inconsistent mental models which led to t
he conce
p-
tion of these systems. As such, a systematic method for constructing SD models could be esse
n
tially helpful
in overcoming the biases dictated by the human mind's limited understanding and conceptualization of
complex systems. This paper proposes a
novel combined method to su
p
port SD model construction. The
classical Dec
i
sion Making Trial and Evaluation Laboratory (DEMATEL) technique is used to define causal
relationships among variables of a system, and to construct the corresponding Impact Relatio
n Maps
(IRMs). The novelty of this paper stems from the use of the resulting total influence m
a
trix to derive the
system dynamic's Causal Loop Diagram (CLD) and then define variable weights in the stock
-
flow chart
equations. This new method allows to overc
ome the subjectivity bias of SD
mode
ling while projecting D
E-
MATEL in a more d
y
namic simulation environment, which could significantly improve the strategic choices
made by an
a
lysts and policy makers
A brief introduction to deep learning, providing rough interpretation to deep neural networks and simple implementations with Keras for deep learning beginners.
Recommender system slides for undergraduateYueshen Xu
Slides for undergraduate in IR class. Presented in Chinese
Mainly focus on the background, application, real case, idea, basic method of recommender systems
This is an introduction of Topic Modeling, including tf-idf, LSA, pLSA, LDA, EM, and some other related materials. I know there are definitely some mistakes, and you can correct them with your wisdom. Thank you~
Show drafts
volume_up
Empowering the Data Analytics Ecosystem: A Laser Focus on Value
The data analytics ecosystem thrives when every component functions at its peak, unlocking the true potential of data. Here's a laser focus on key areas for an empowered ecosystem:
1. Democratize Access, Not Data:
Granular Access Controls: Provide users with self-service tools tailored to their specific needs, preventing data overload and misuse.
Data Catalogs: Implement robust data catalogs for easy discovery and understanding of available data sources.
2. Foster Collaboration with Clear Roles:
Data Mesh Architecture: Break down data silos by creating a distributed data ownership model with clear ownership and responsibilities.
Collaborative Workspaces: Utilize interactive platforms where data scientists, analysts, and domain experts can work seamlessly together.
3. Leverage Advanced Analytics Strategically:
AI-powered Automation: Automate repetitive tasks like data cleaning and feature engineering, freeing up data talent for higher-level analysis.
Right-Tool Selection: Strategically choose the most effective advanced analytics techniques (e.g., AI, ML) based on specific business problems.
4. Prioritize Data Quality with Automation:
Automated Data Validation: Implement automated data quality checks to identify and rectify errors at the source, minimizing downstream issues.
Data Lineage Tracking: Track the flow of data throughout the ecosystem, ensuring transparency and facilitating root cause analysis for errors.
5. Cultivate a Data-Driven Mindset:
Metrics-Driven Performance Management: Align KPIs and performance metrics with data-driven insights to ensure actionable decision making.
Data Storytelling Workshops: Equip stakeholders with the skills to translate complex data findings into compelling narratives that drive action.
Benefits of a Precise Ecosystem:
Sharpened Focus: Precise access and clear roles ensure everyone works with the most relevant data, maximizing efficiency.
Actionable Insights: Strategic analytics and automated quality checks lead to more reliable and actionable data insights.
Continuous Improvement: Data-driven performance management fosters a culture of learning and continuous improvement.
Sustainable Growth: Empowered by data, organizations can make informed decisions to drive sustainable growth and innovation.
By focusing on these precise actions, organizations can create an empowered data analytics ecosystem that delivers real value by driving data-driven decisions and maximizing the return on their data investment.
Adjusting primitives for graph : SHORT REPORT / NOTESSubhajit Sahu
Graph algorithms, like PageRank Compressed Sparse Row (CSR) is an adjacency-list based graph representation that is
Multiply with different modes (map)
1. Performance of sequential execution based vs OpenMP based vector multiply.
2. Comparing various launch configs for CUDA based vector multiply.
Sum with different storage types (reduce)
1. Performance of vector element sum using float vs bfloat16 as the storage type.
Sum with different modes (reduce)
1. Performance of sequential execution based vs OpenMP based vector element sum.
2. Performance of memcpy vs in-place based CUDA based vector element sum.
3. Comparing various launch configs for CUDA based vector element sum (memcpy).
4. Comparing various launch configs for CUDA based vector element sum (in-place).
Sum with in-place strategies of CUDA mode (reduce)
1. Comparing various launch configs for CUDA based vector element sum (in-place).
Explore our comprehensive data analysis project presentation on predicting product ad campaign performance. Learn how data-driven insights can optimize your marketing strategies and enhance campaign effectiveness. Perfect for professionals and students looking to understand the power of data analysis in advertising. for more details visit: https://bostoninstituteofanalytics.org/data-science-and-artificial-intelligence/
Techniques to optimize the pagerank algorithm usually fall in two categories. One is to try reducing the work per iteration, and the other is to try reducing the number of iterations. These goals are often at odds with one another. Skipping computation on vertices which have already converged has the potential to save iteration time. Skipping in-identical vertices, with the same in-links, helps reduce duplicate computations and thus could help reduce iteration time. Road networks often have chains which can be short-circuited before pagerank computation to improve performance. Final ranks of chain nodes can be easily calculated. This could reduce both the iteration time, and the number of iterations. If a graph has no dangling nodes, pagerank of each strongly connected component can be computed in topological order. This could help reduce the iteration time, no. of iterations, and also enable multi-iteration concurrency in pagerank computation. The combination of all of the above methods is the STICD algorithm. [sticd] For dynamic graphs, unchanged components whose ranks are unaffected can be skipped altogether.
1. Thinking in (Text) Clustering
(No math, be not afraid)
Yueshen Xu (lecturer)
ysxu@xidian.edu.cn / xuyueshen@163.com
Data and Knowledge Engineering Research Center
Xidian University
Text Mining & NLP & ML
2. Software Engineering2017/4/13
Outline
Background
What can be clustered?
Problems in K-XXX (Means/Medoid/Center…)
Similarity Measure
Convex and Concave
Problems in Gaussian Mixture Model
Problems in Matrix Factorization
Multinomial and Sparsity
2
Keywords: Clustering, K-Means/Medoid, Similarity Computation, GMM, MF,
Multinomial Distribution
Basics, not
state-of-the-art
5. Software Engineering2017/4/13
Related Research Areas
Dimensional Reduction (DR)
Text Mining
Natural Language Processing
Computational Linguistics
Information Retrieval
Artificial Intelligence
(Text) Clustering
Some Concepts
5
Information Retrieval
Computational Linguistics
Natural Language Processing
LSA/Topic Model
Text Mining
DR
Data Mining
ArtificialIntelligence
Machine
Learning
Machine
Translation
(Text)
Clustering
We all know what (text) clustering is, right?
Widely-accepted topic, since everyone knows it
6. Software Engineering2017/4/13
What can be clustered?
6
Data Sample 1:(1.2, 1.4, 2.234, 3.231), (8.2, 6.4, 4.243, 5.41),
(5.234, 3.56, 4.454, 6.78)
Data Sample 2:(1), (0),(1),(0),(1),(1),(1),(0),(1),(0)
Data Sample 3:(China, modern, people, gov.), (policy,
paper, conference, chair), (report, solution, UN, UK)
Data Sample 4:(aaabbbccc), (dddfffggg), (hhhiiiijjj)
Data Sample 5:(▲▼♦), (♣♠█),(■□●)
7. Software Engineering2017/4/13
Is there anything that
cannot be clustered?
7
Yes, but not related to us
What can be clustered?
Anything which a similarity
measure can be defined over
Matrix topology
All kinds of data can be
clustered
8. Software Engineering2017/4/13
K-Means Trap
8
Defects of K-Means, K-
Medoid,K-XXX
How many K?
Where are the initial centers?
Do the data really form a
sphere?
Do the data really follow
Minkowski /Euclidean distance?
9. Software Engineering2017/4/13
How about these?
What kind of data that K-XXX better fits?
What kind of data that the methods relying
on distance-similarity computation better fit?
CONVEX
11. Software Engineering2017/4/13
Alternative
Gaussian Mixture Model
11
Why Gaussian central limit theorem
Is central limit theorem always applicable in
real-world cases?
1. Parameter Tuning
2. High applicability of Gaussian distribution
How to estimate parameters?
Expectation-Maximization
No closed-form solution
13. Software Engineering2017/4/13
Triangle
1313
Is there no perfect method here?
What we probably want
No constraint in the form
of data
No assumption in data
distribution
Closed-solution
Triangle borrowed from
distributed computing
14. Software Engineering2017/4/13
Triangle (Cont.)
I do not know whether such a
method exists or not
Form
Distribution Closed-solution
Hierarchical
Clustering?
GMM/Gaussian
Process
K-Means/Medoid
impossible
Matrix Factorization
impossible impossible
15. Software Engineering2017/4/13
Multinomial Distribution
Discrete Data (Text)
15
One document:
(0,0,0,China,0,0,0,0,0,0,0,report,0,0,0,0,0,0,0,0,0,policy,0,0,0,0,0,0,0,meeting,0,0,0
meeting,0,0,0,0,report,0,….)
Multinomial distribution
Clustering
Sampling
Markov Chain
Monte Carlo
Friendly to
sparsity
16. Software Engineering2017/4/13
Sparsity
Sparsity brings a lot of problems
16
Also in clustering What can we do?
➢ Ensemble Learning (Ensemble clustering)
➢ Missing values pre-filling
➢ Tuning ☺
➢ …
10000 words
1 term
17. Software Engineering2017/4/13
Reference
My previous tutorials/notes (ZJU/UIC/Netease/ITRZJU as a Ph.D)
‘Random Thoughts in Clustering’
‘Non-parametric Bayesian learning in discrete data’
‘The research of topic modeling in text mining’
‘Matrix factorization with user generated content’
…, etc.
Website
You can download all slides of mine
➢ http://web.xidian.edu.cn/ysxu/teach.html
➢ http://liu.cs.uic.edu/yueshenxu/
➢ http://www.slideshare.net/obamaxys2011
➢ https://www.researchgate.net/profile/Yueshen_Xu
17