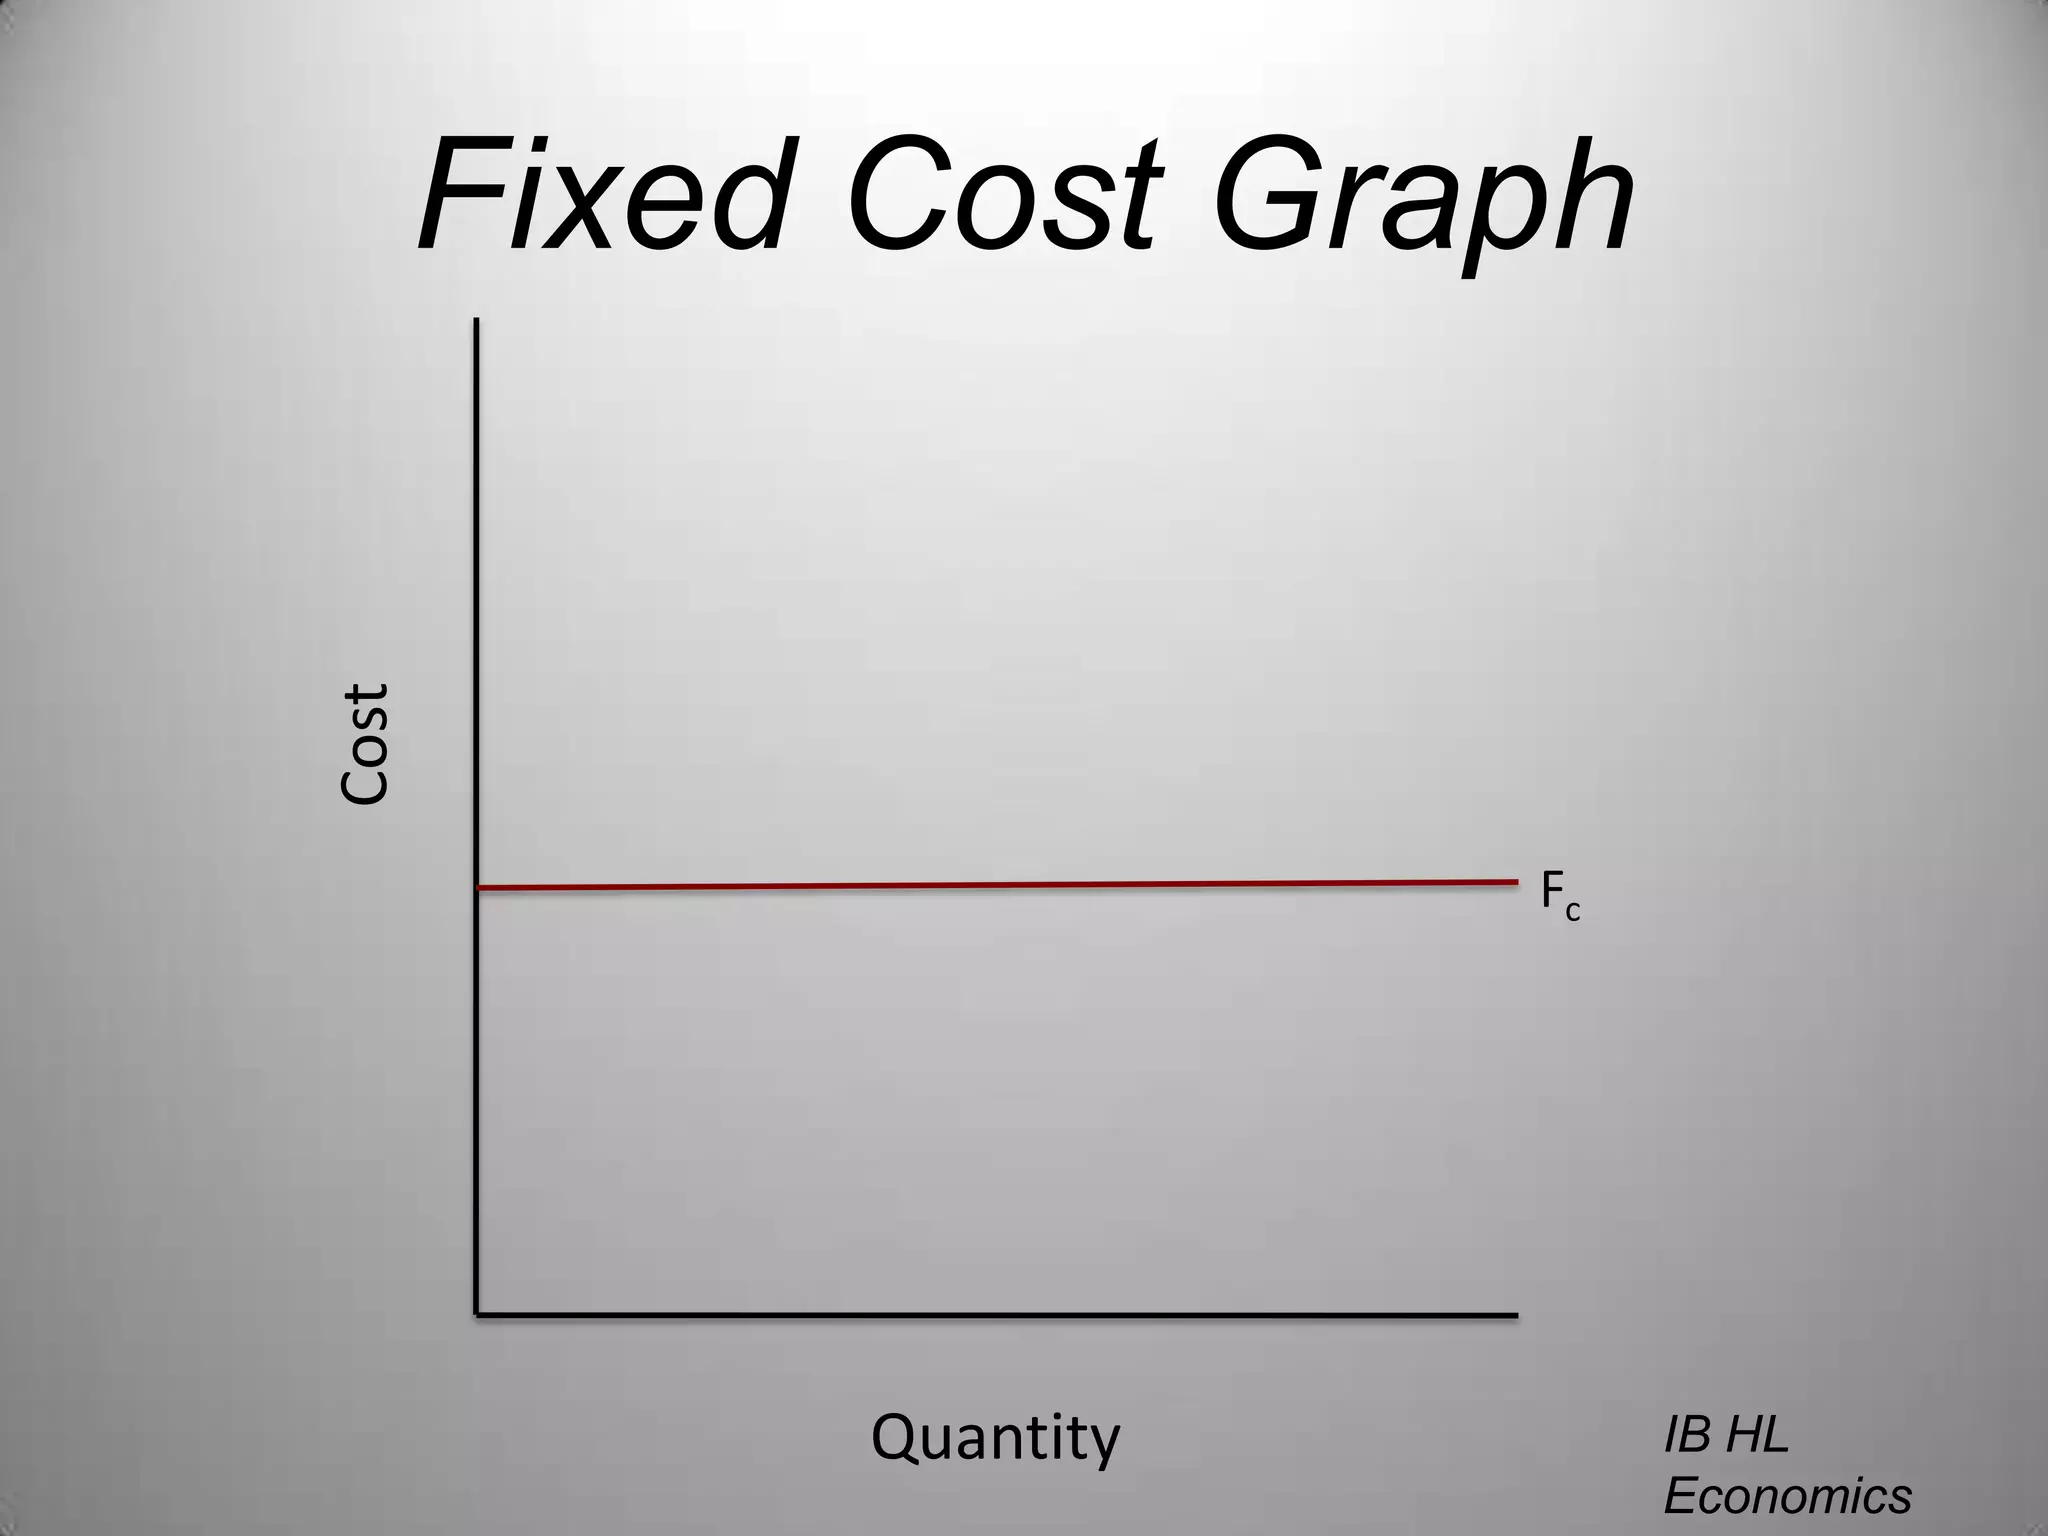
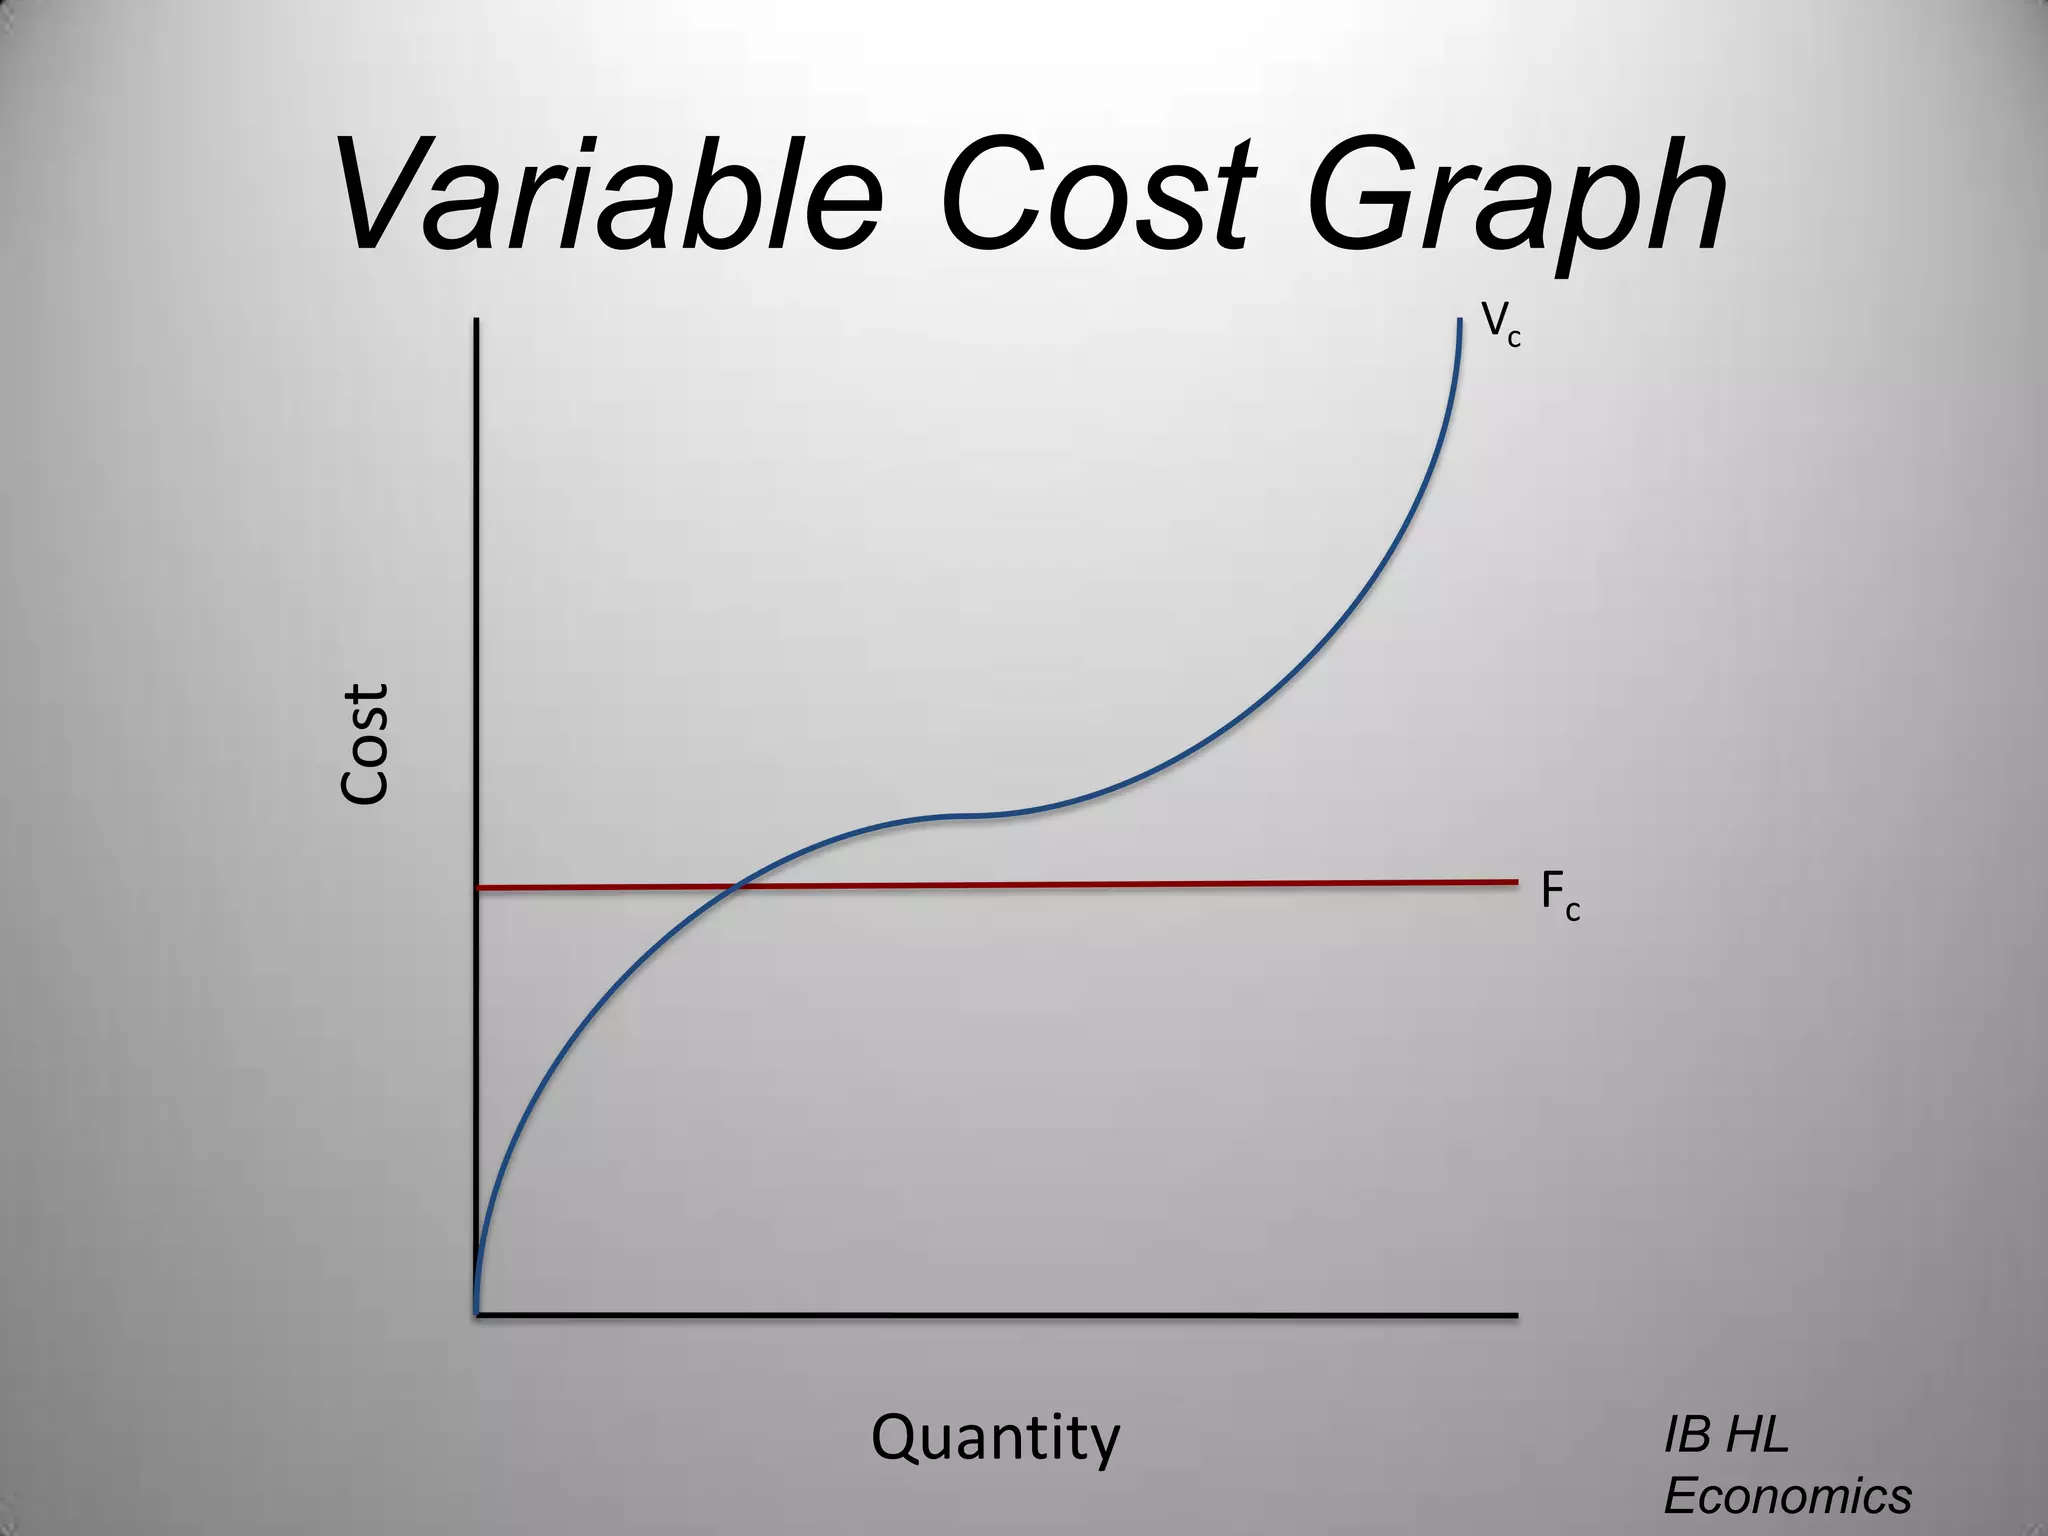
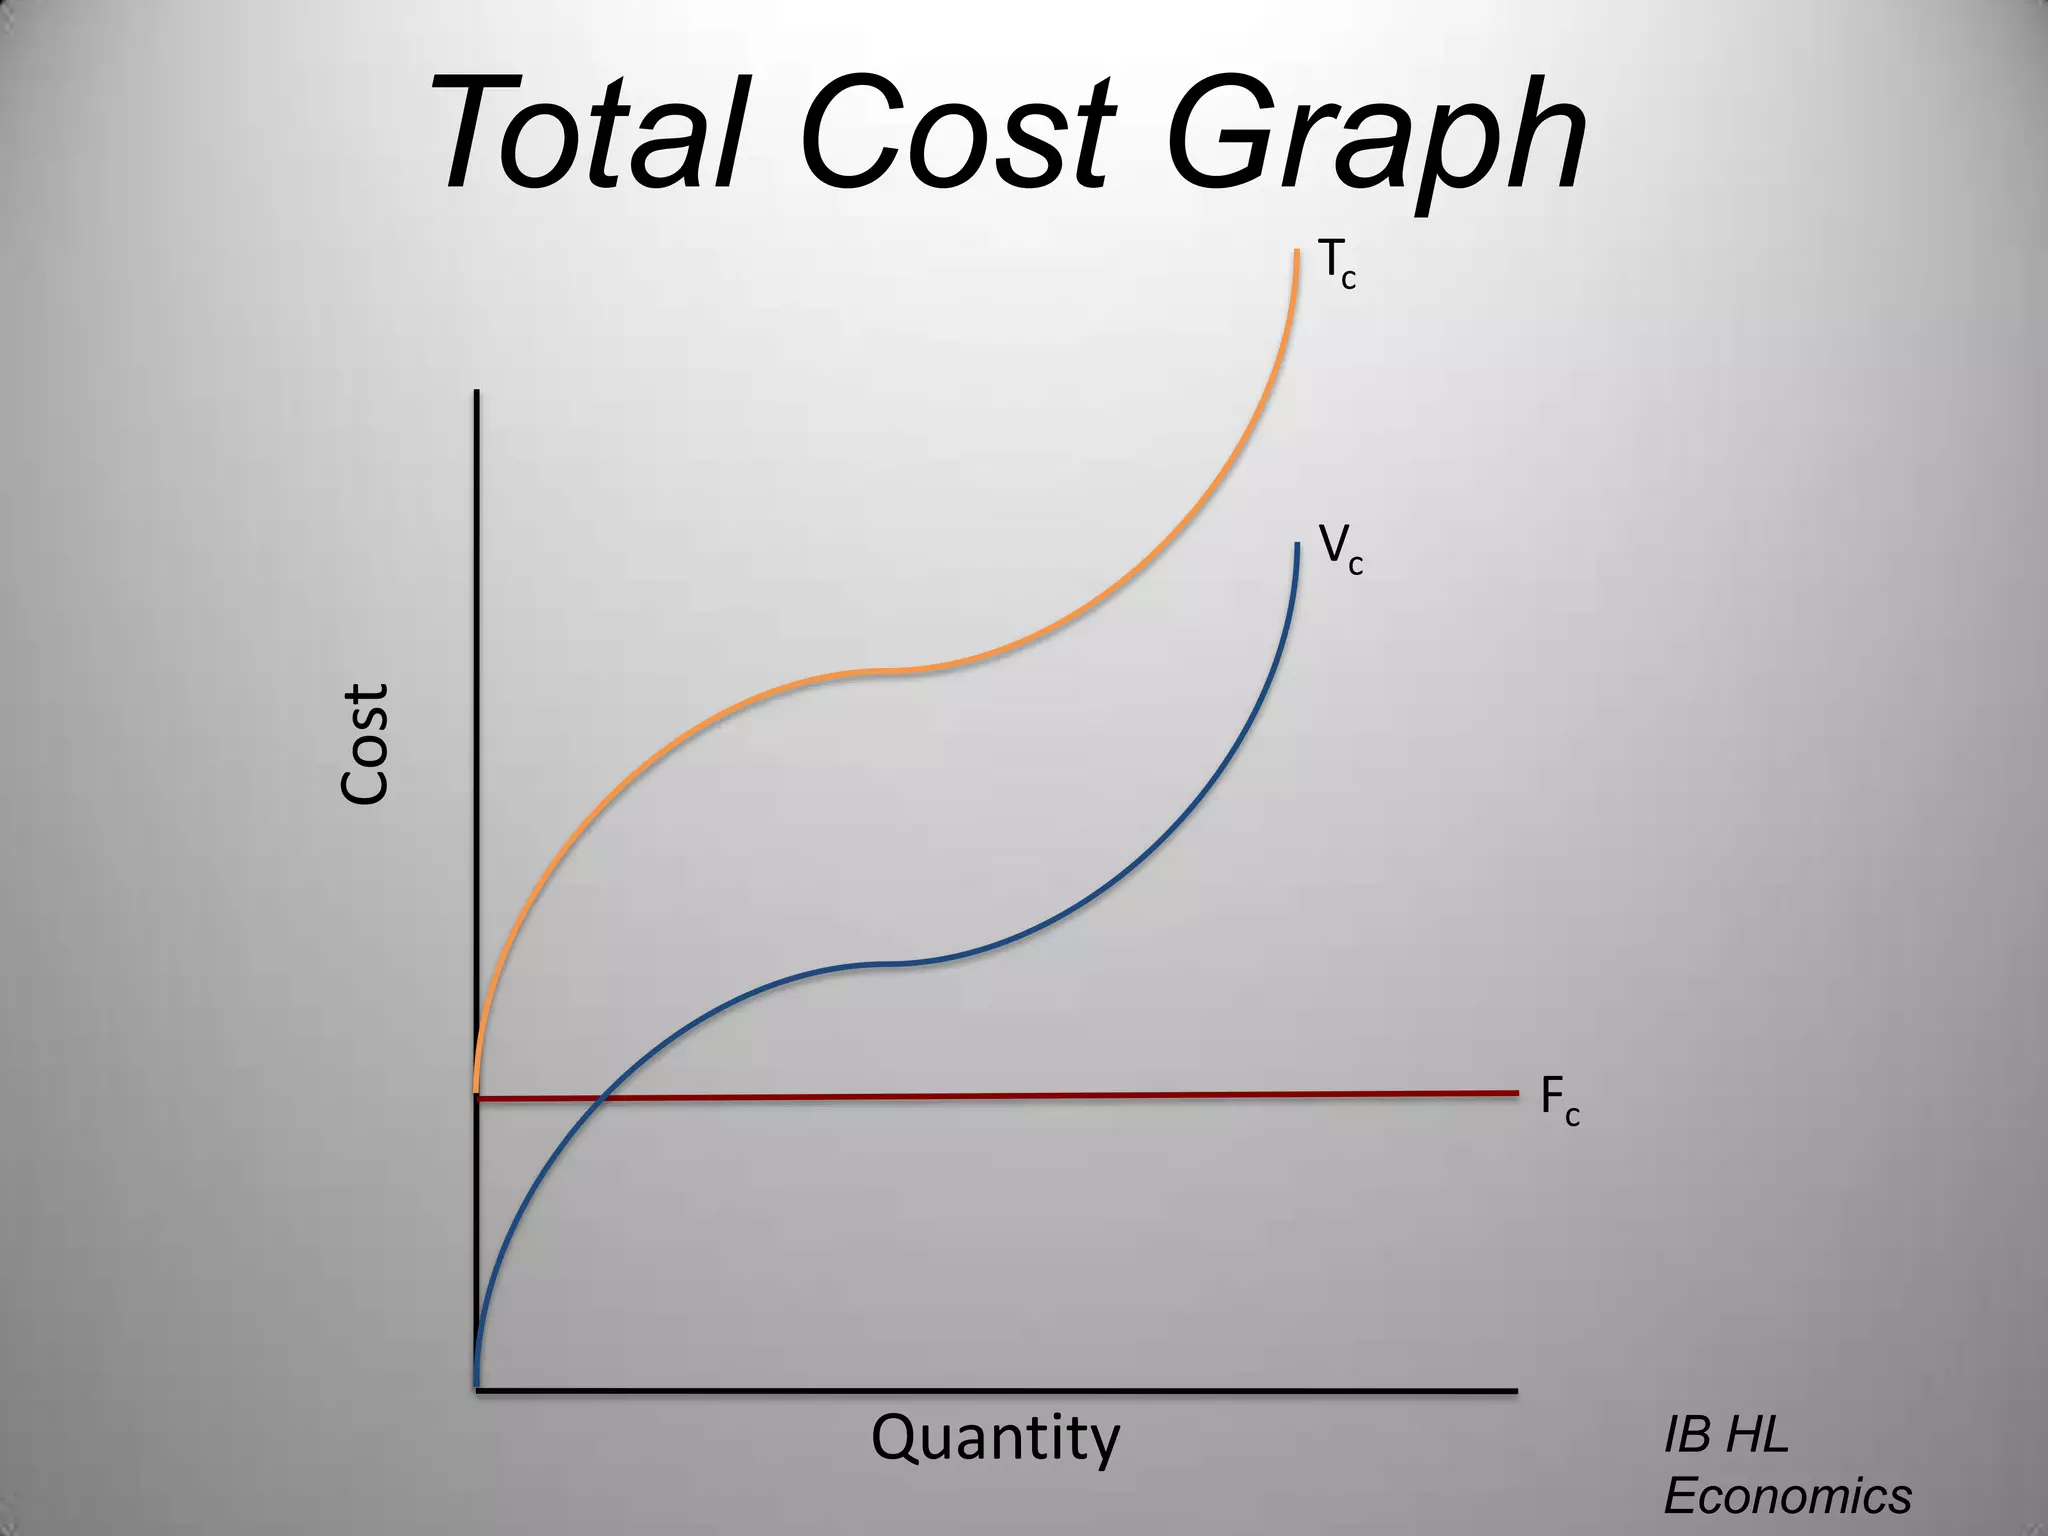
1) Fixed costs remain constant regardless of output while variable costs change with output. Total cost is the sum of fixed and variable costs.
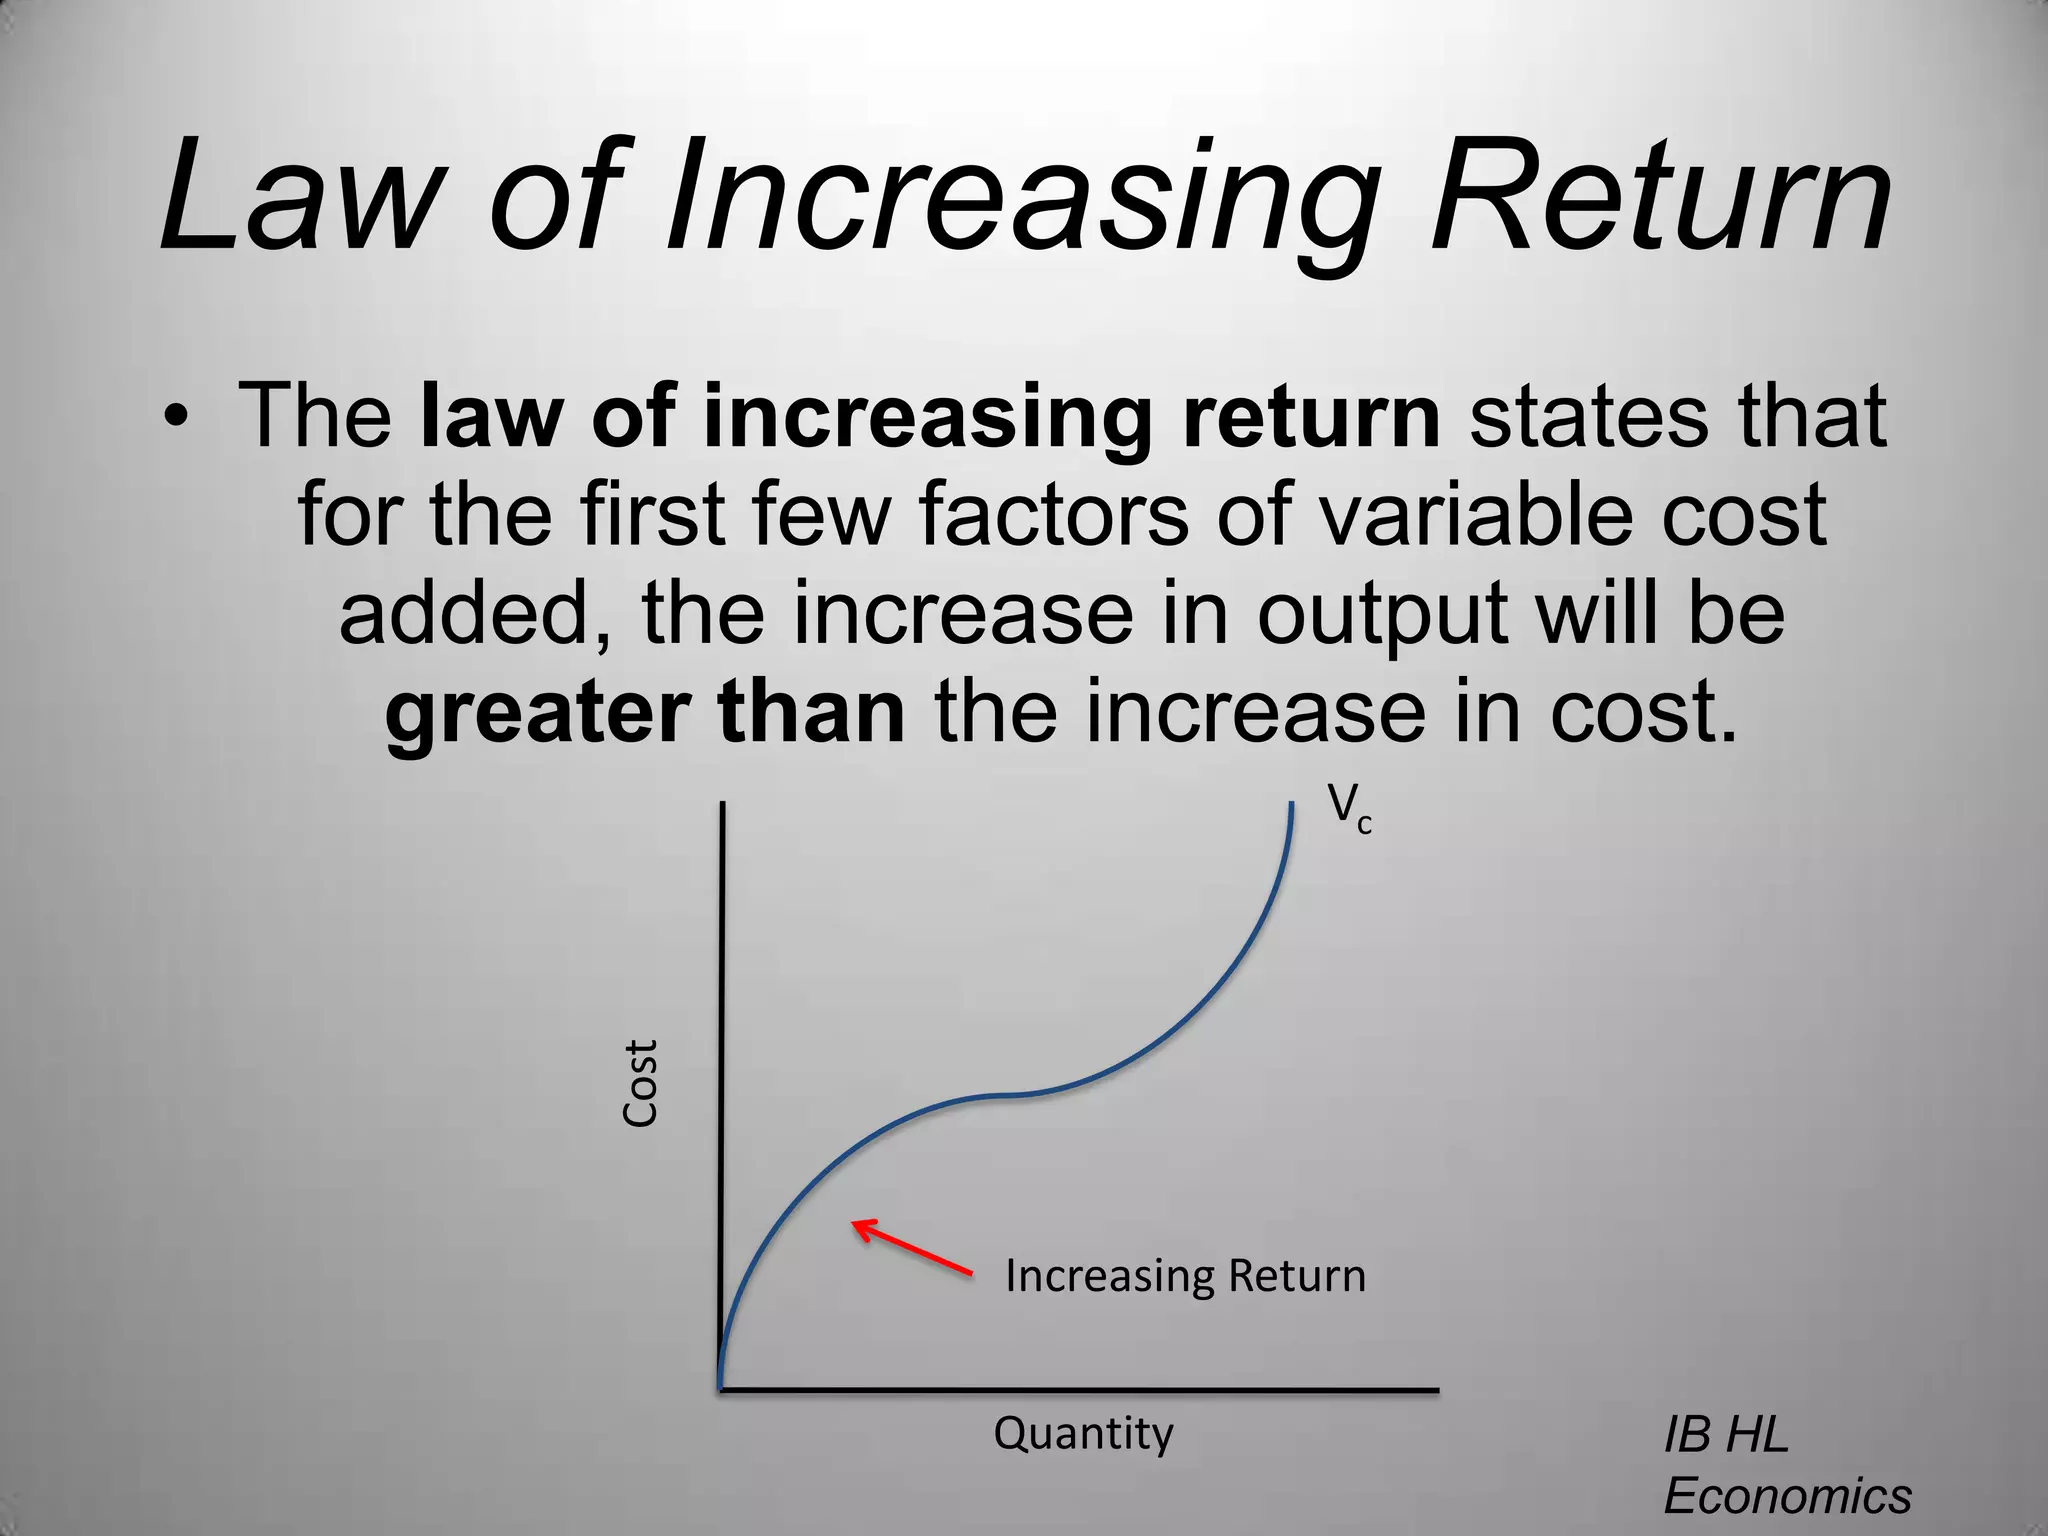
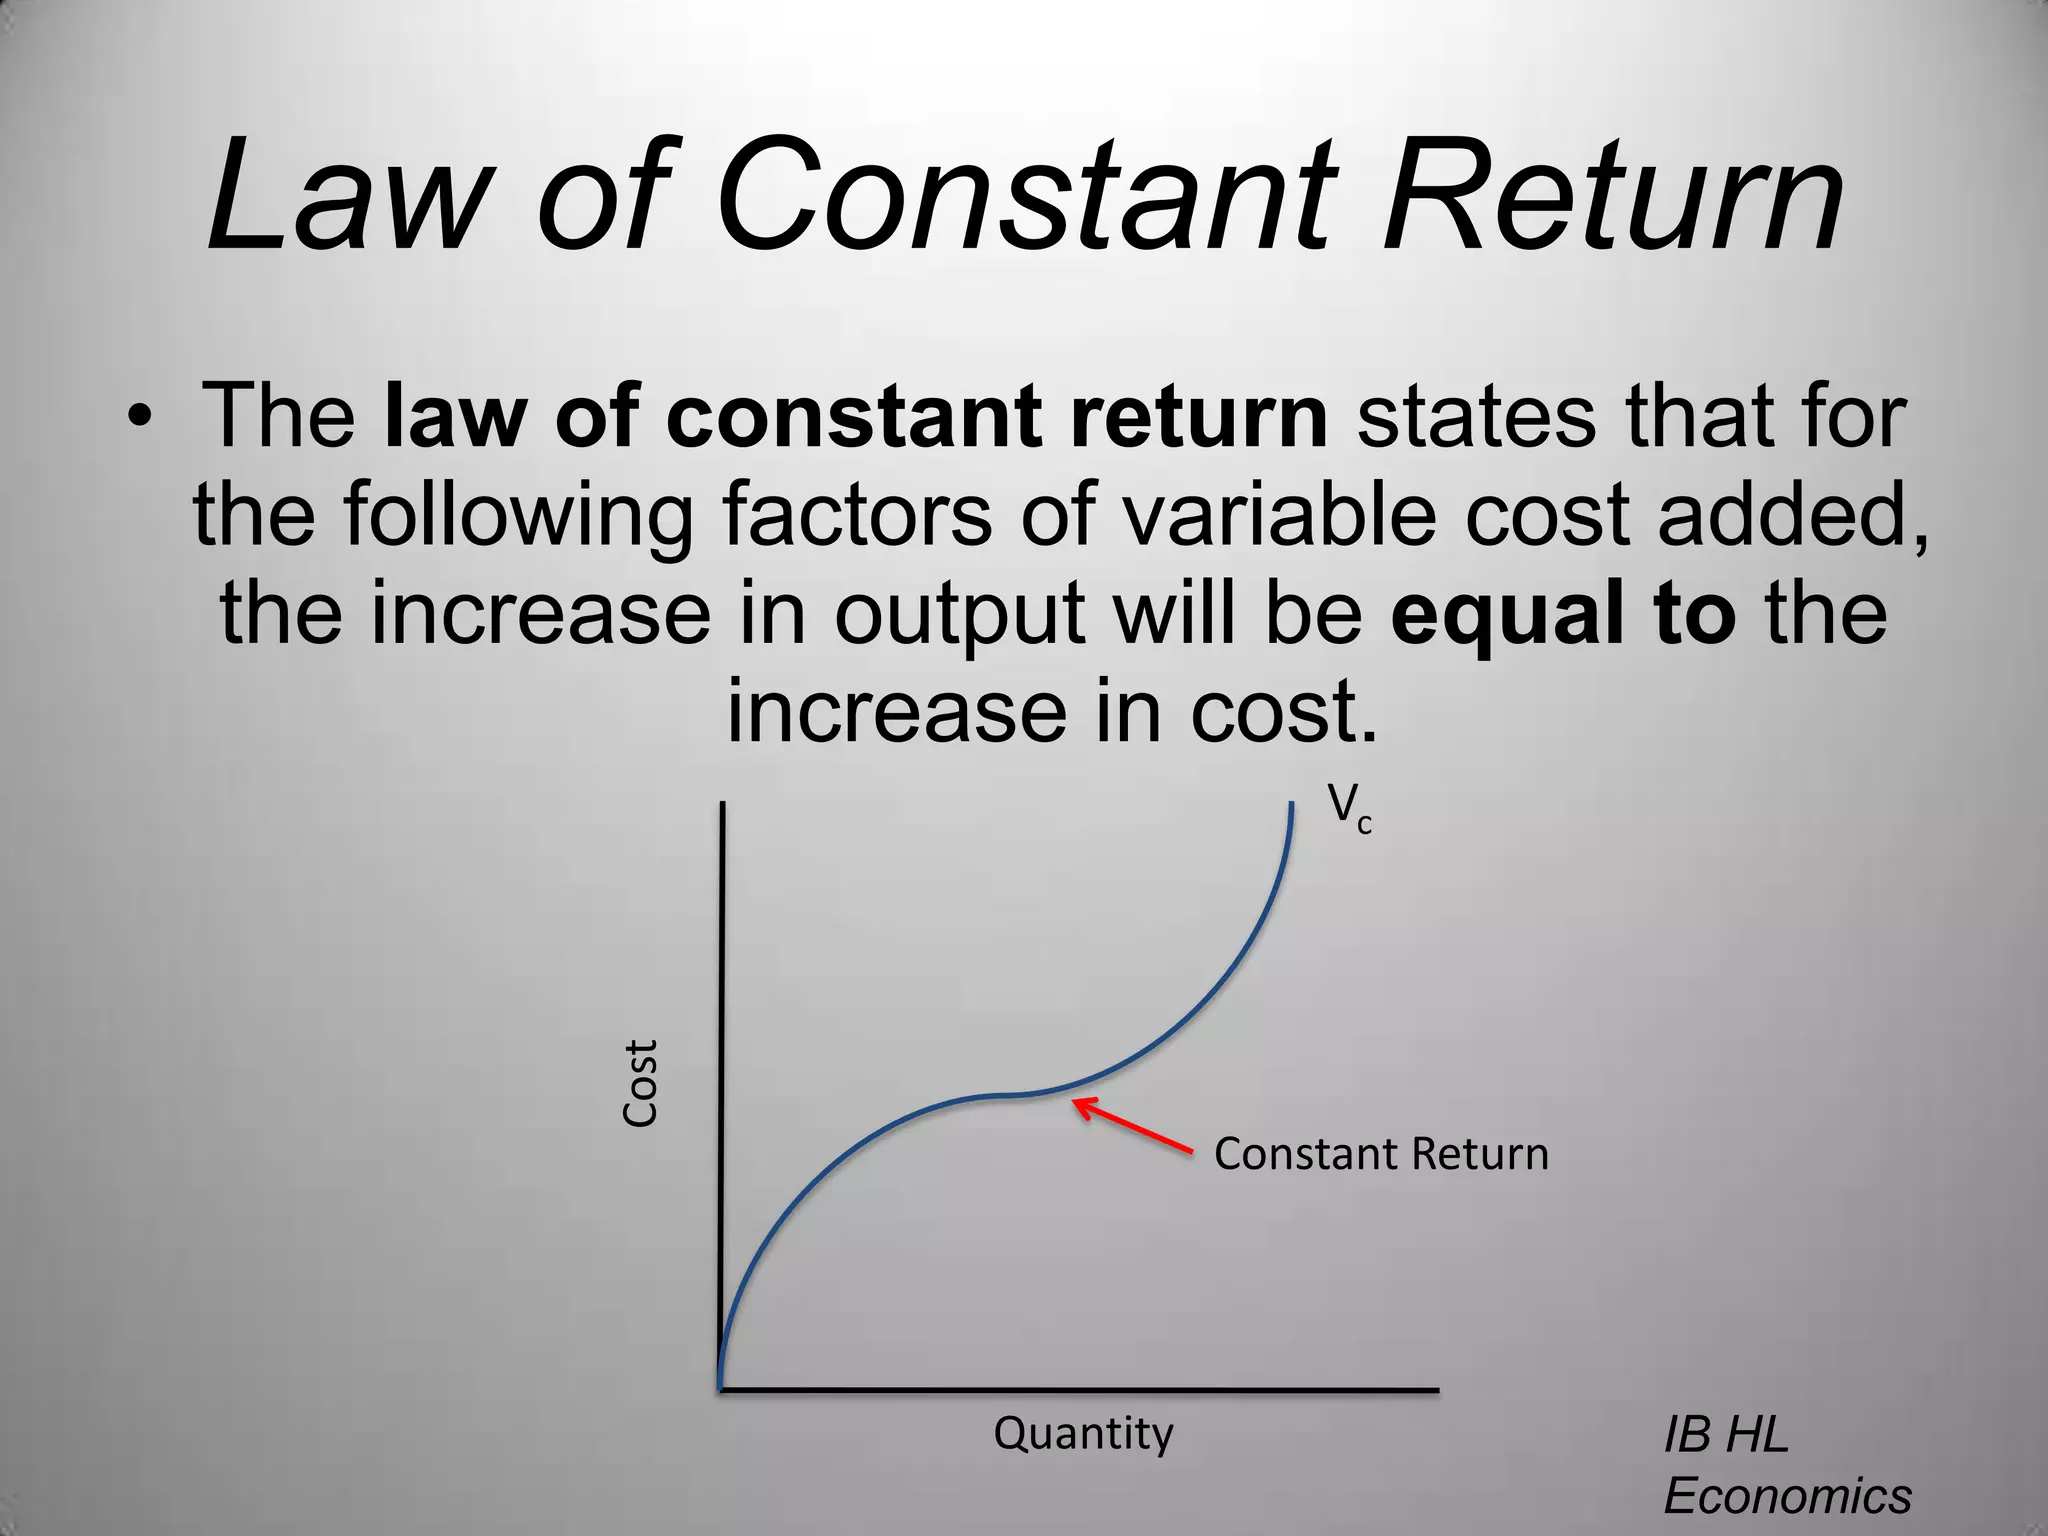
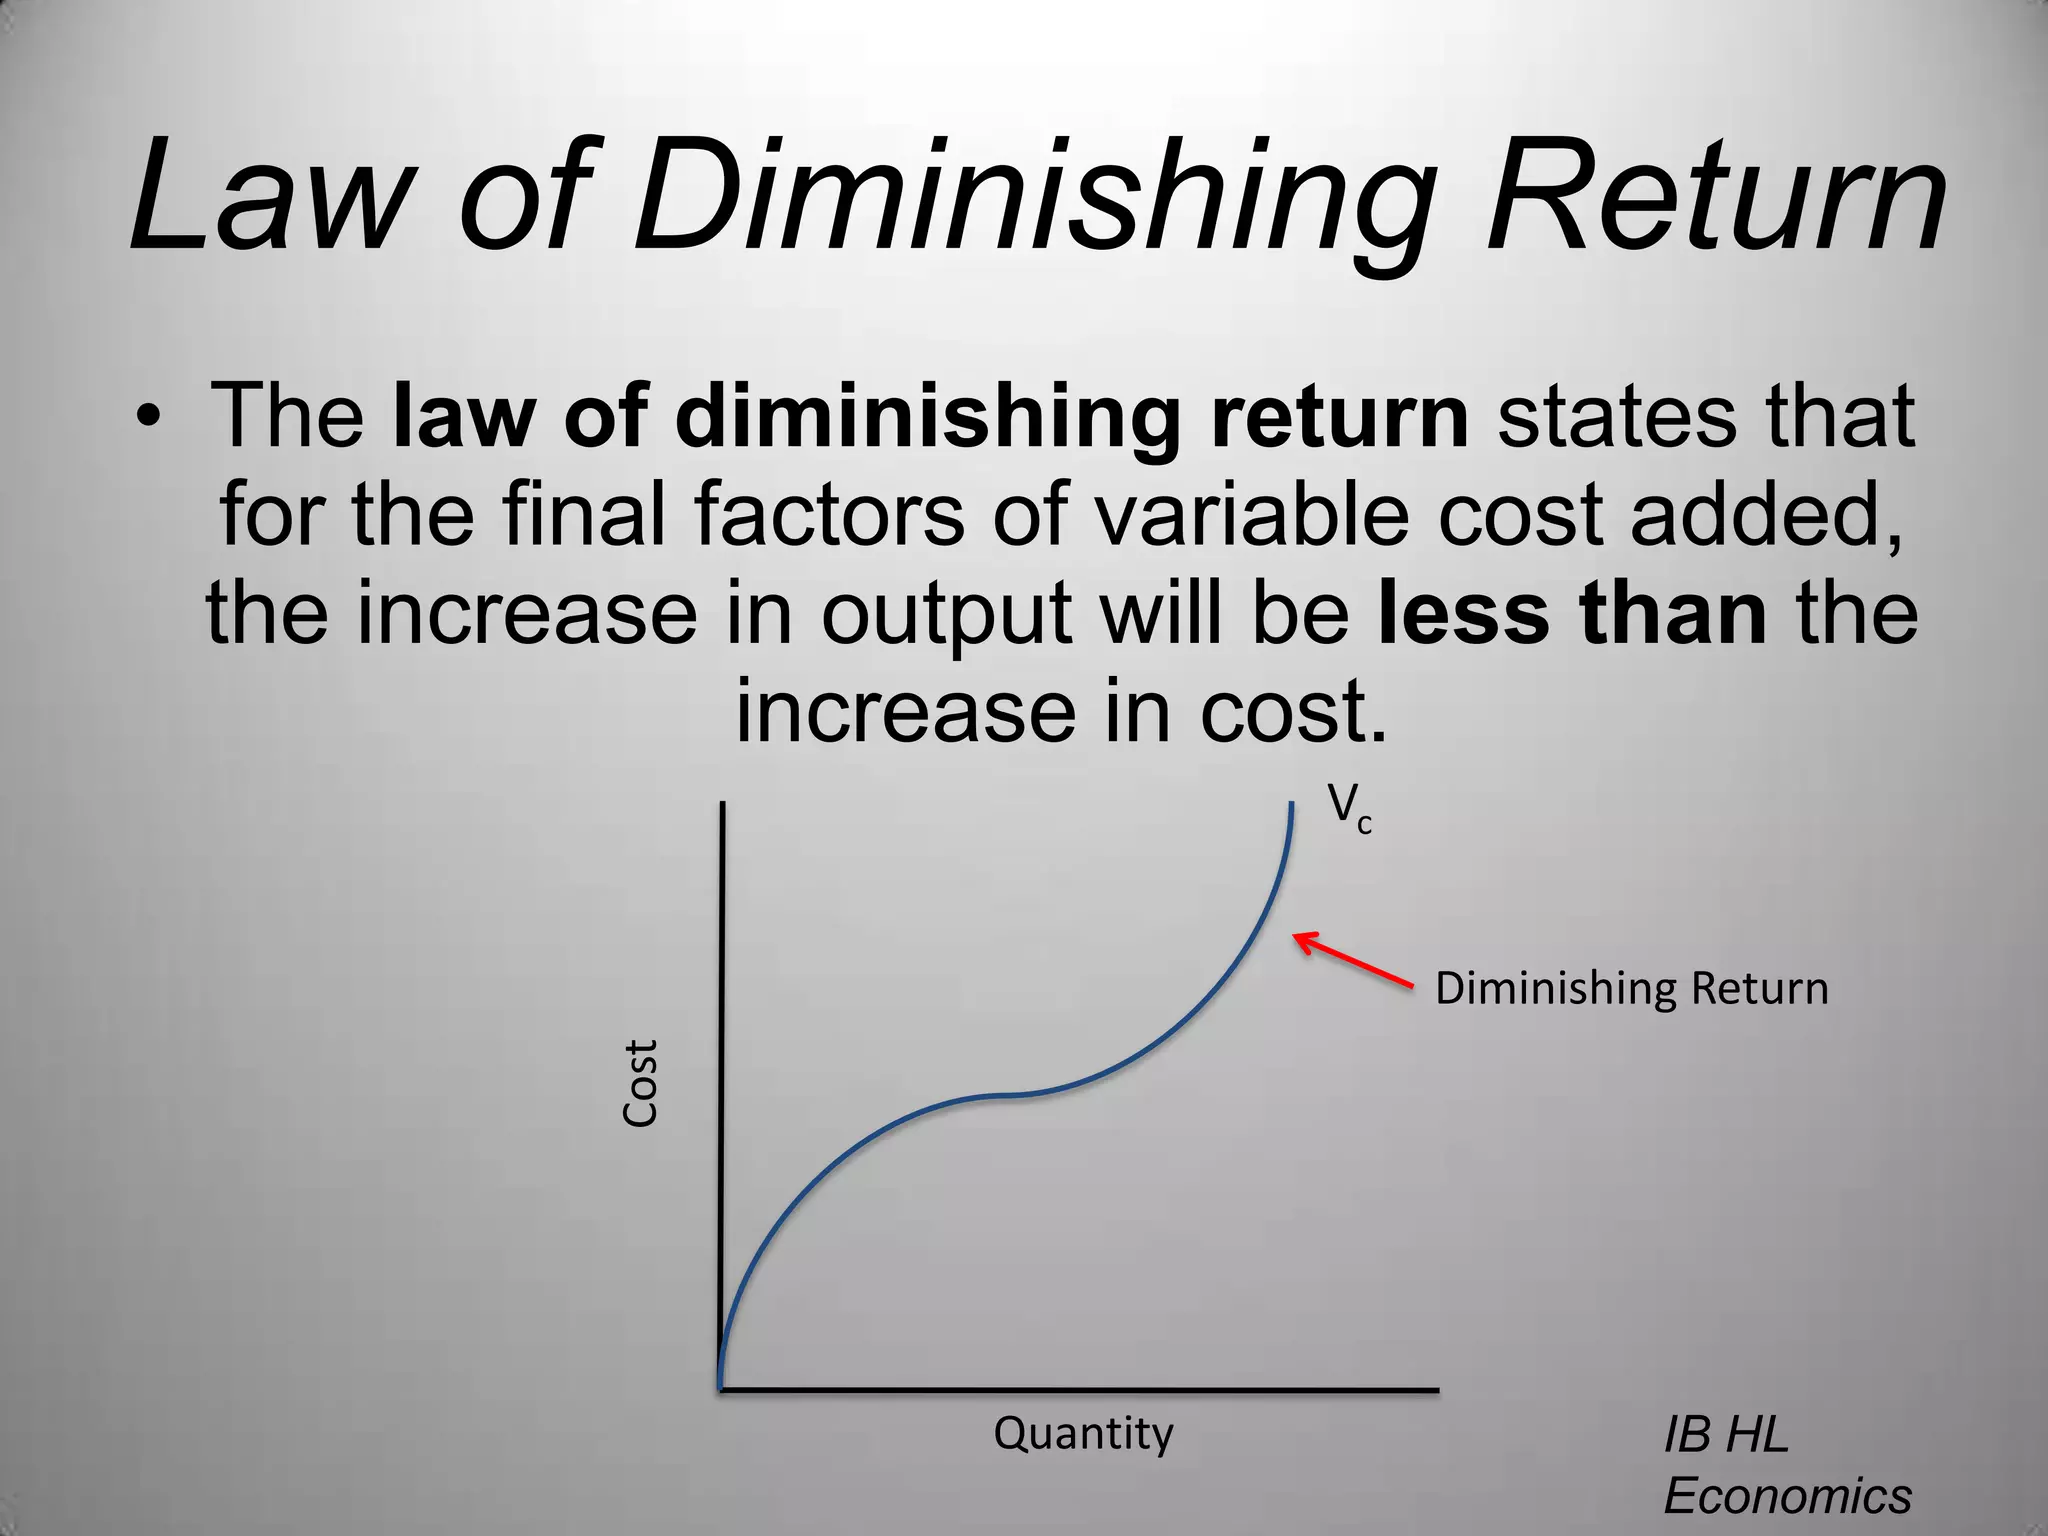
2) There are three laws of returns: increasing, constant, and diminishing which describe how output changes with additional inputs.
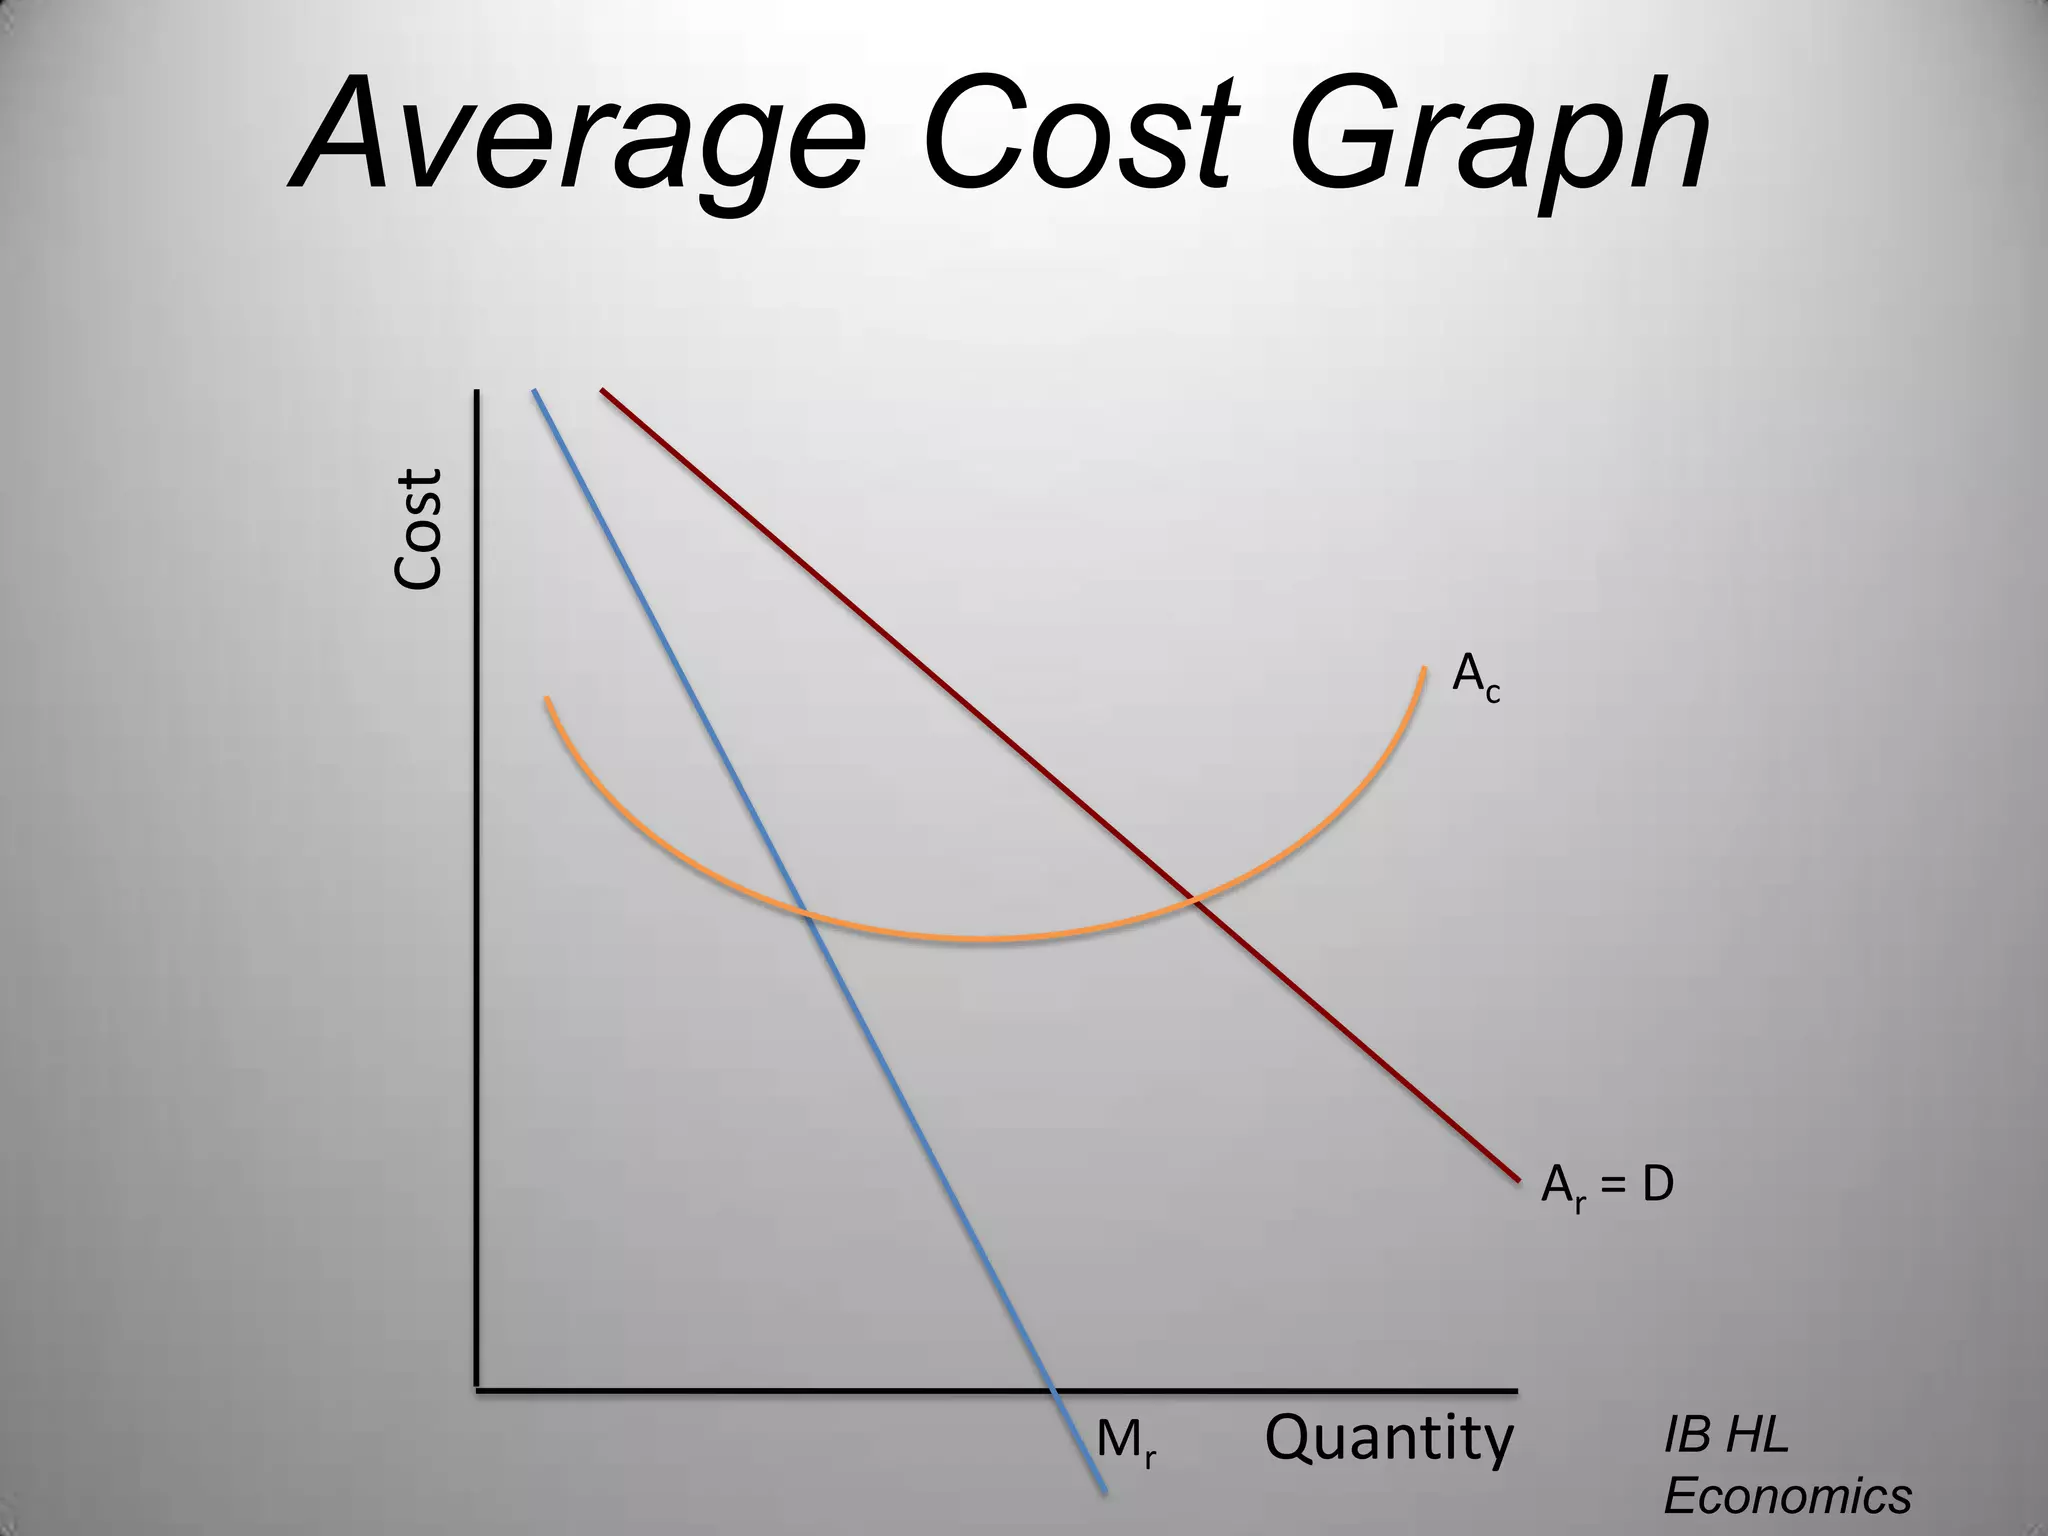
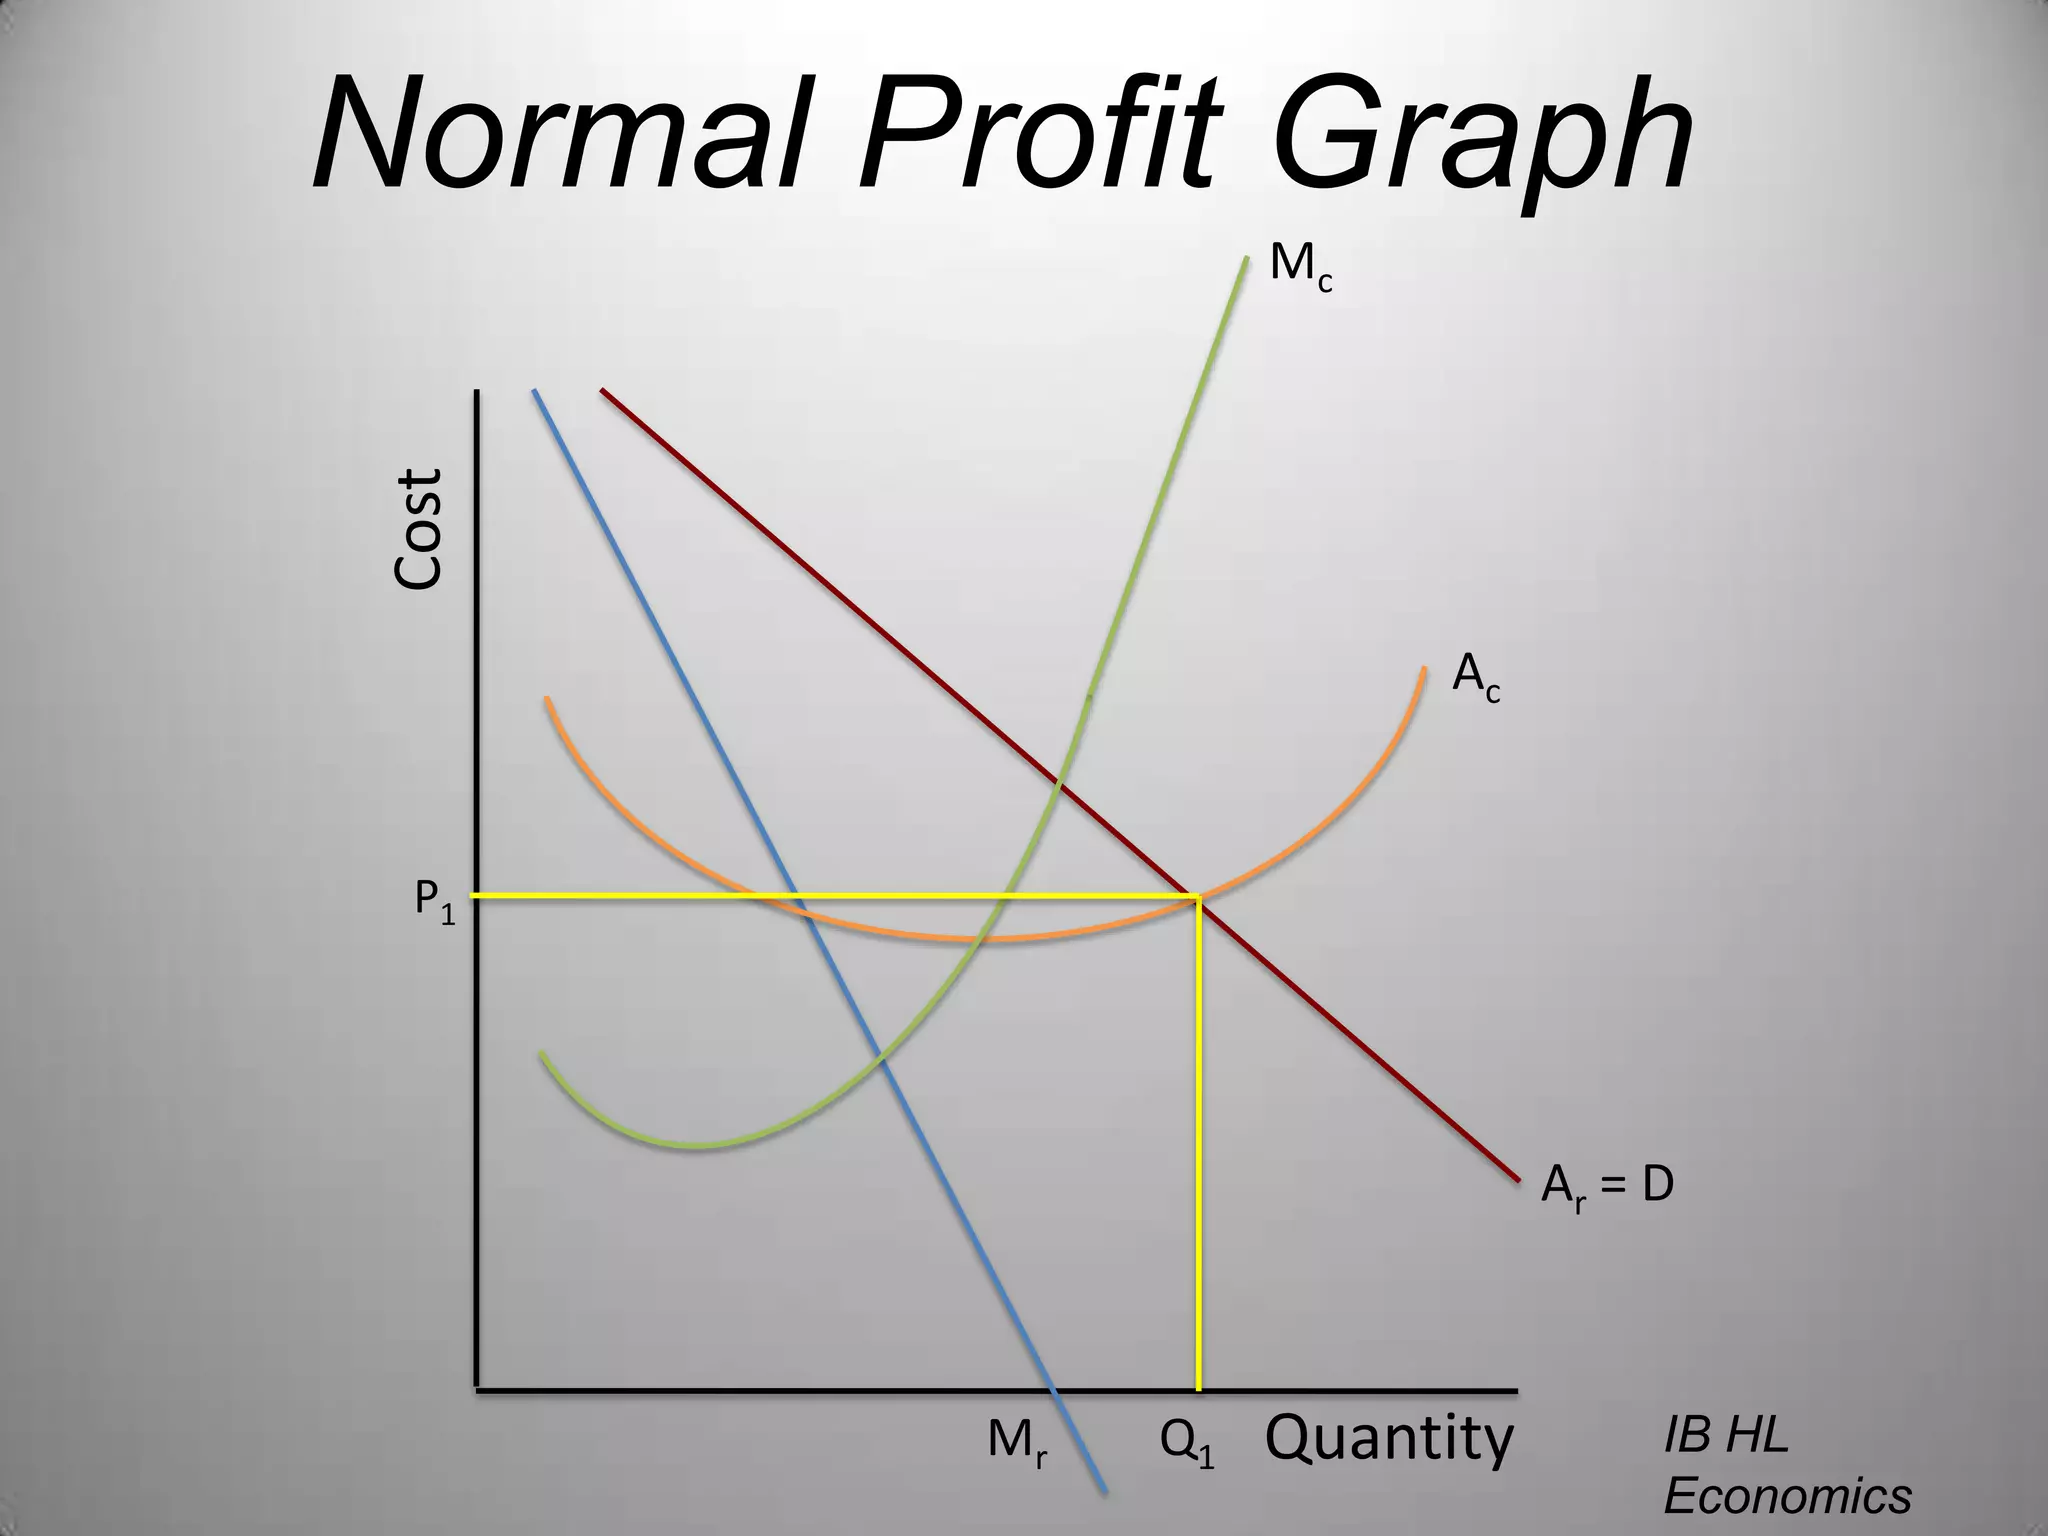
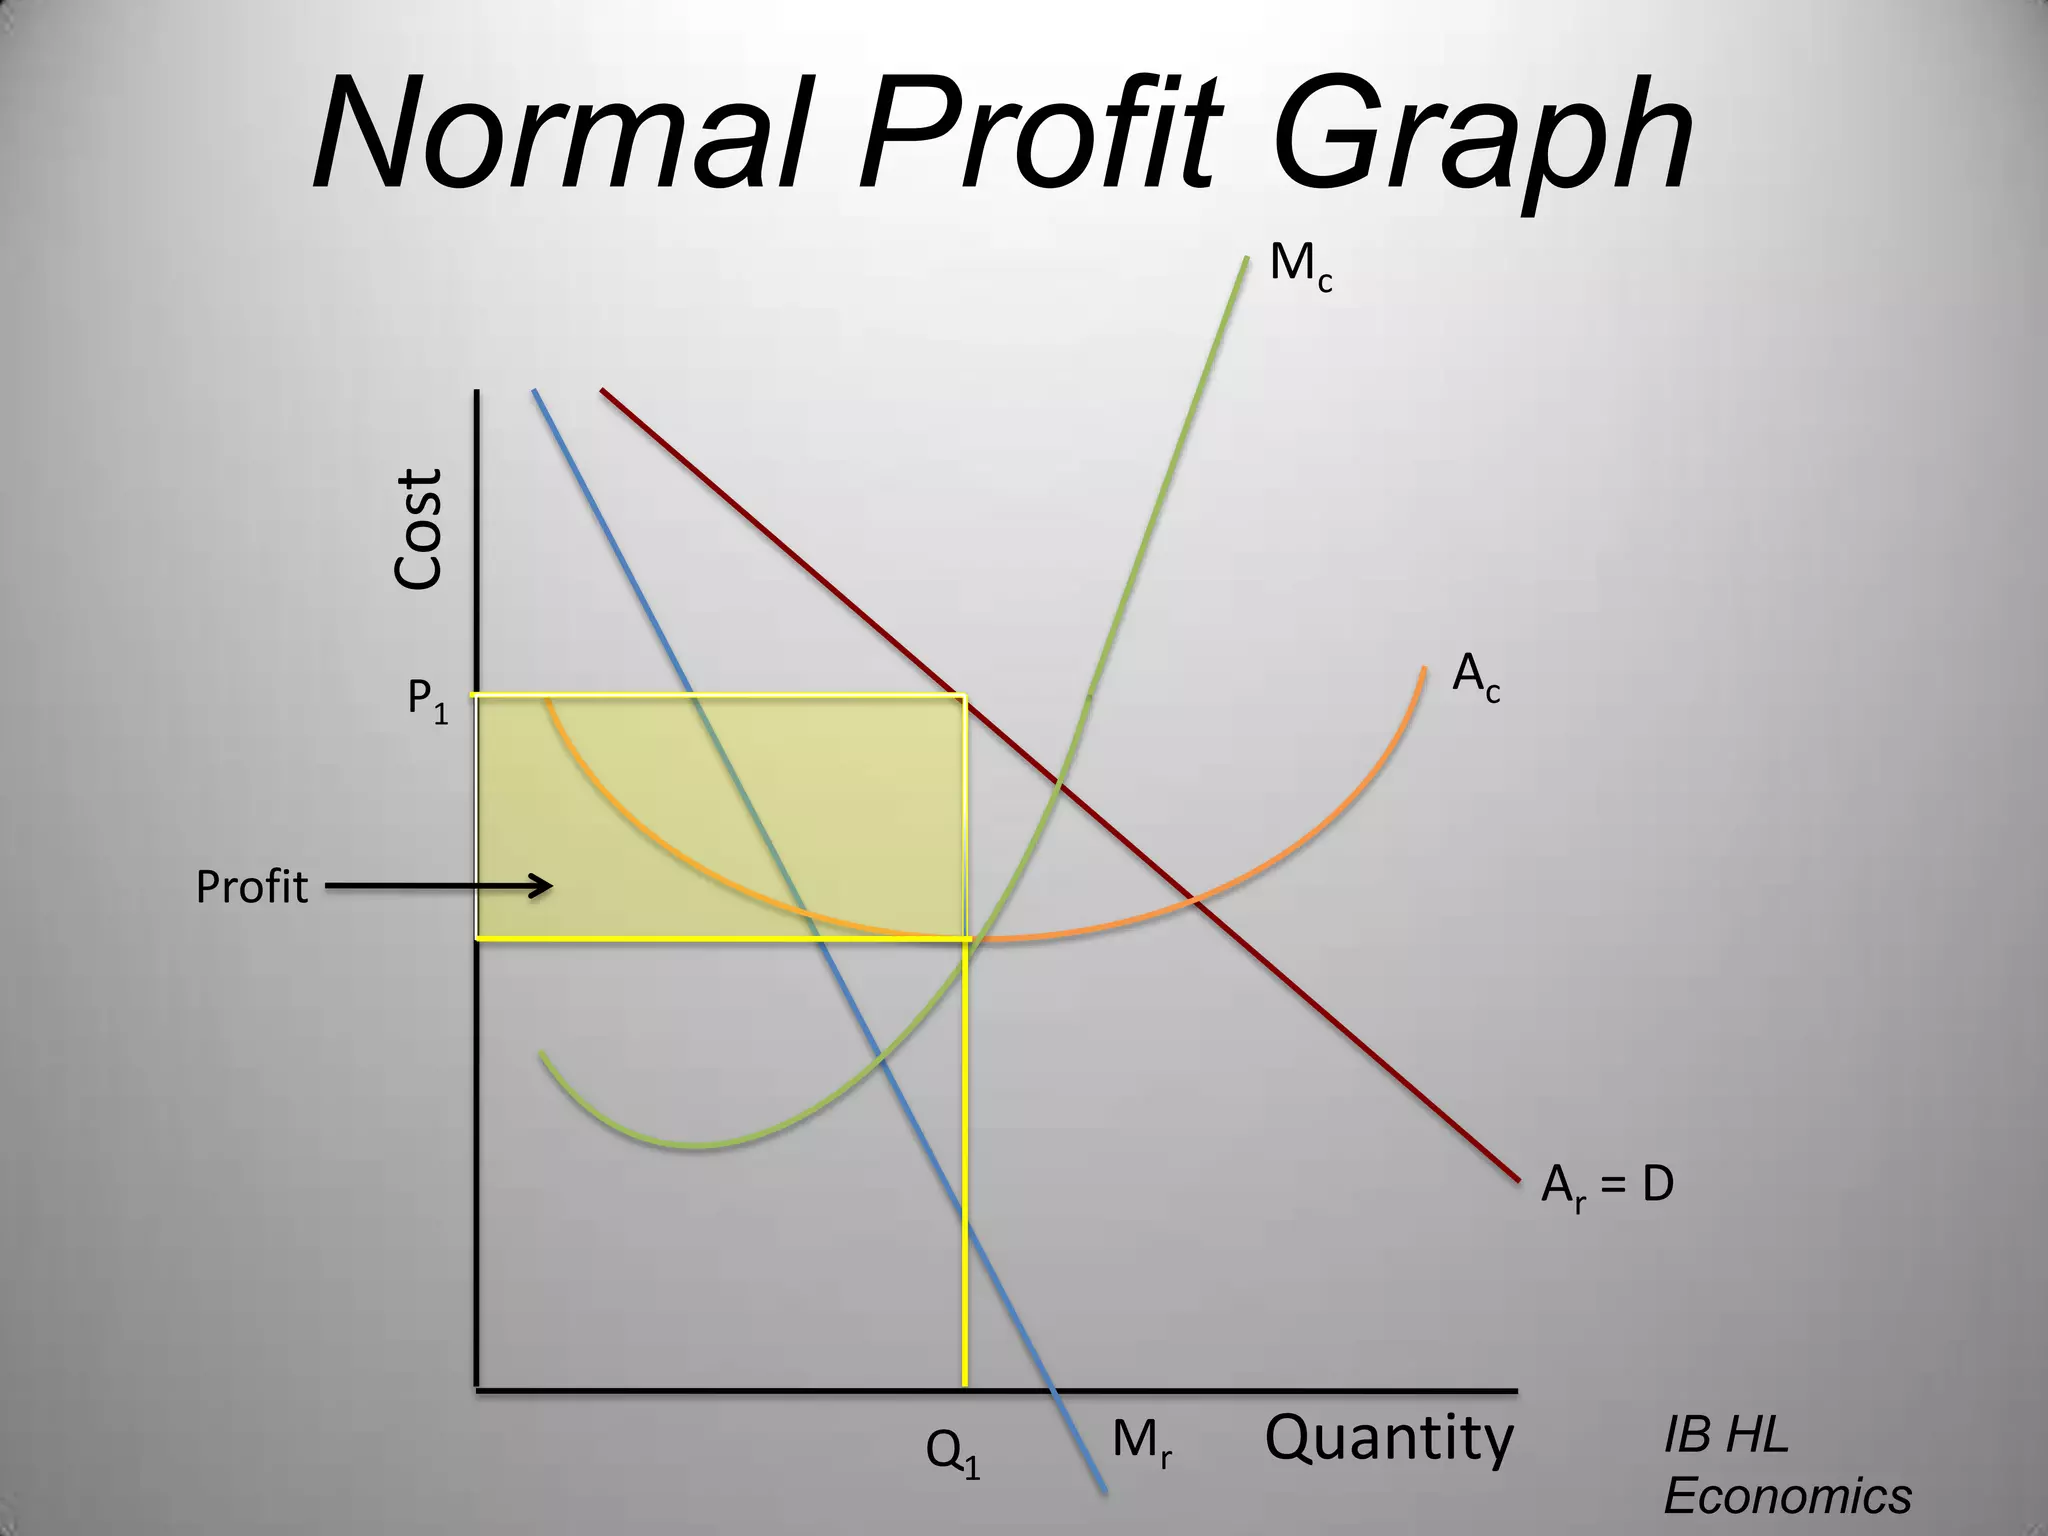
3) Normal profit occurs when total revenue equals total cost while abnormal profit exists when revenue exceeds costs.