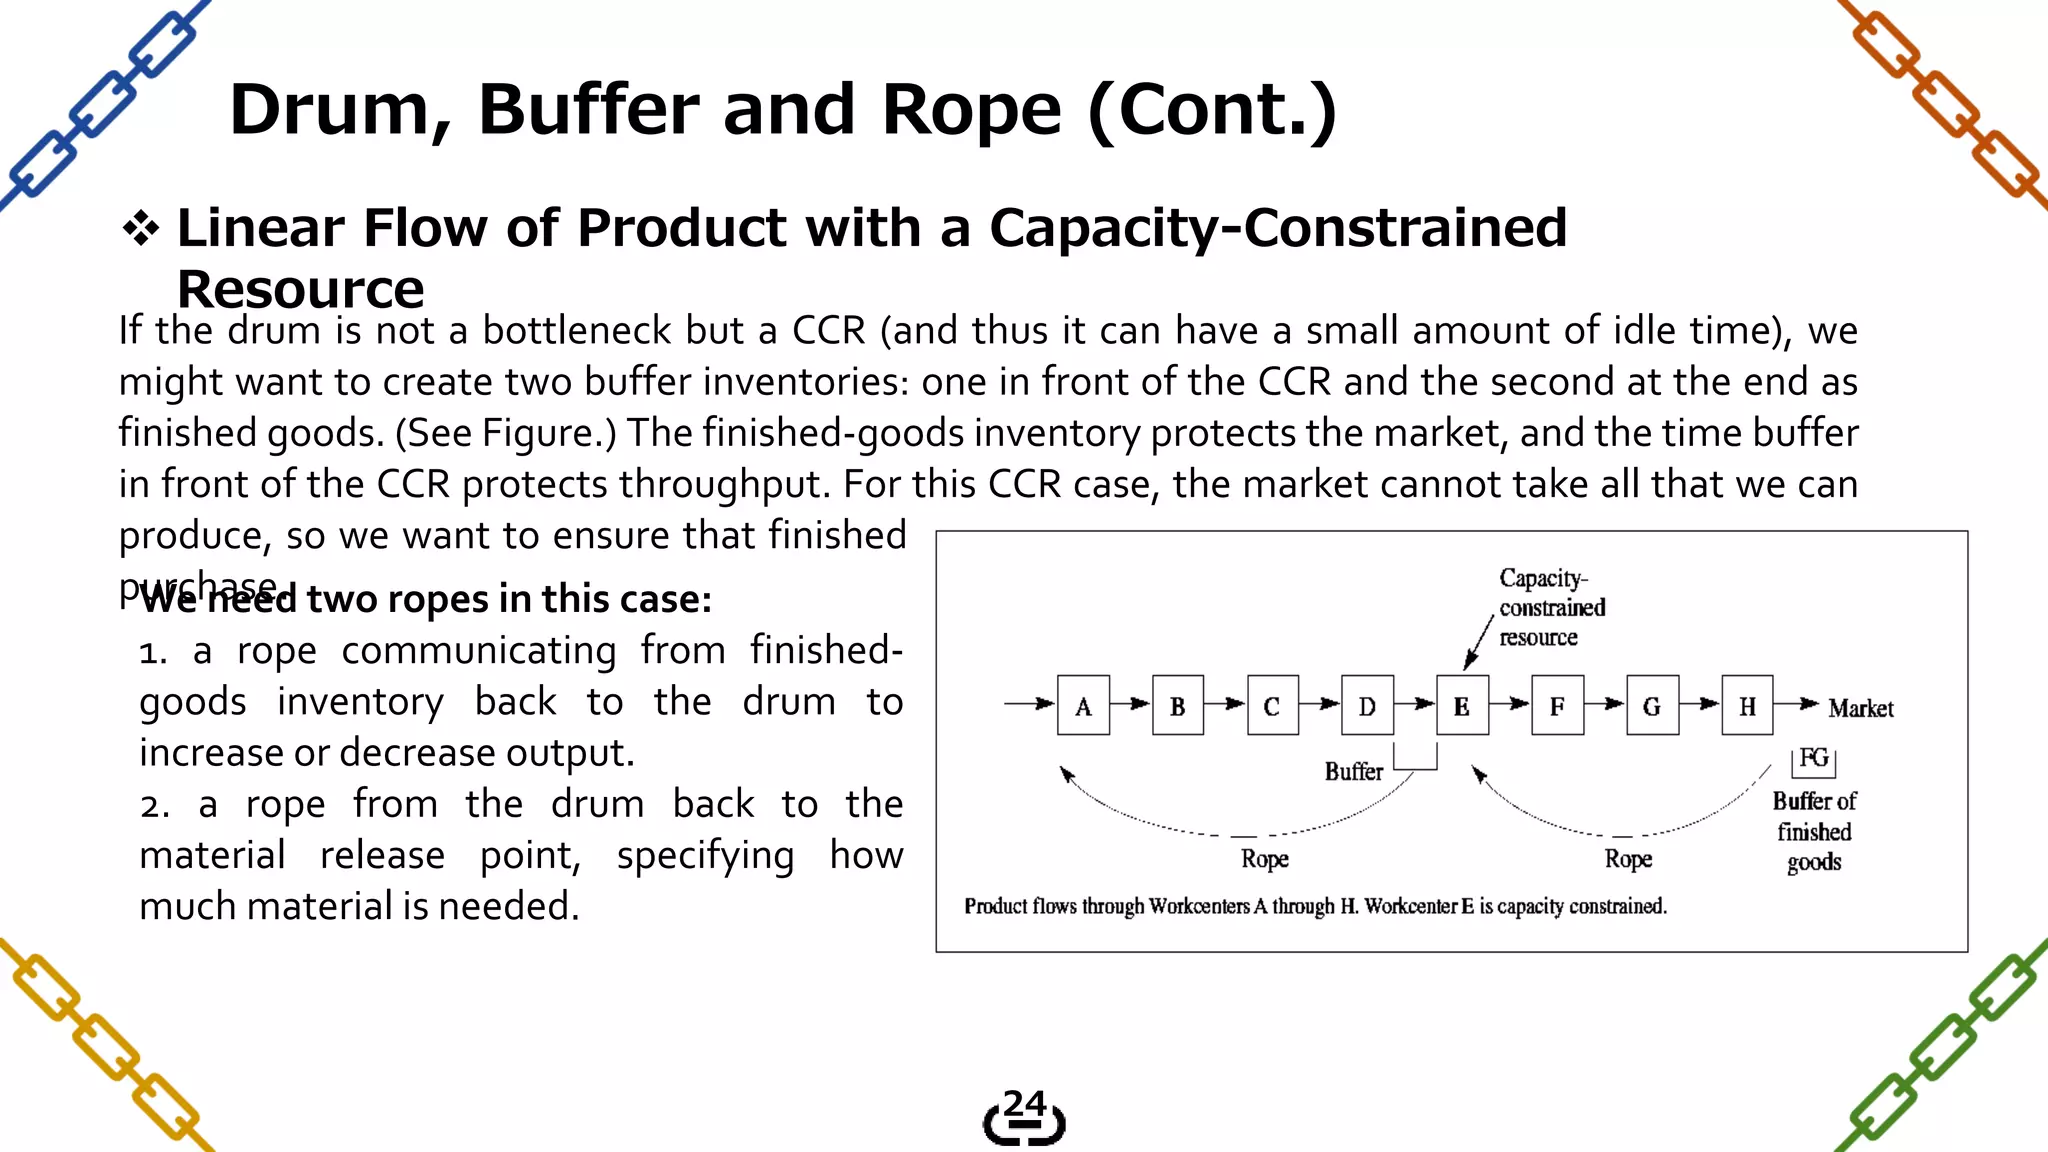
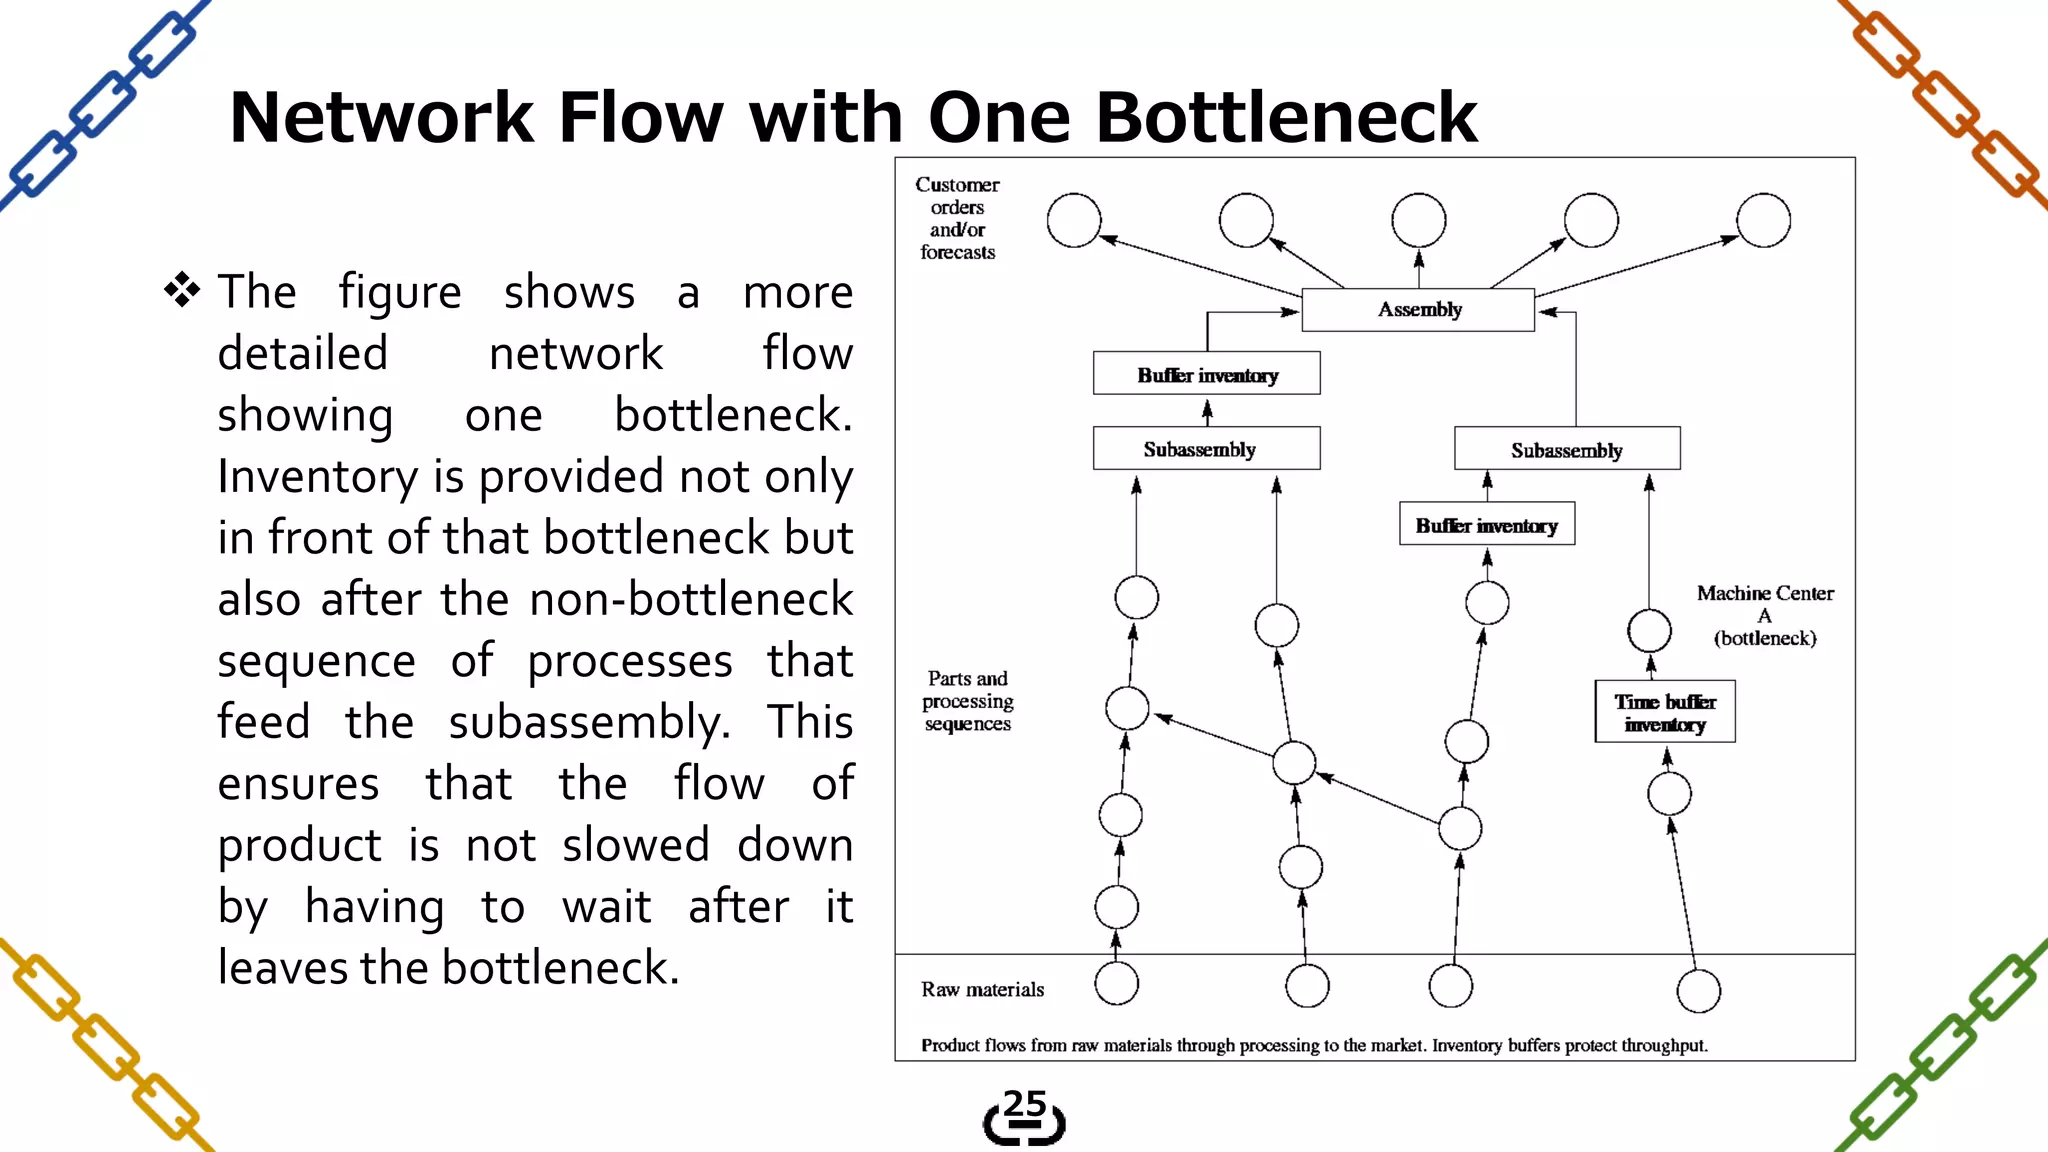
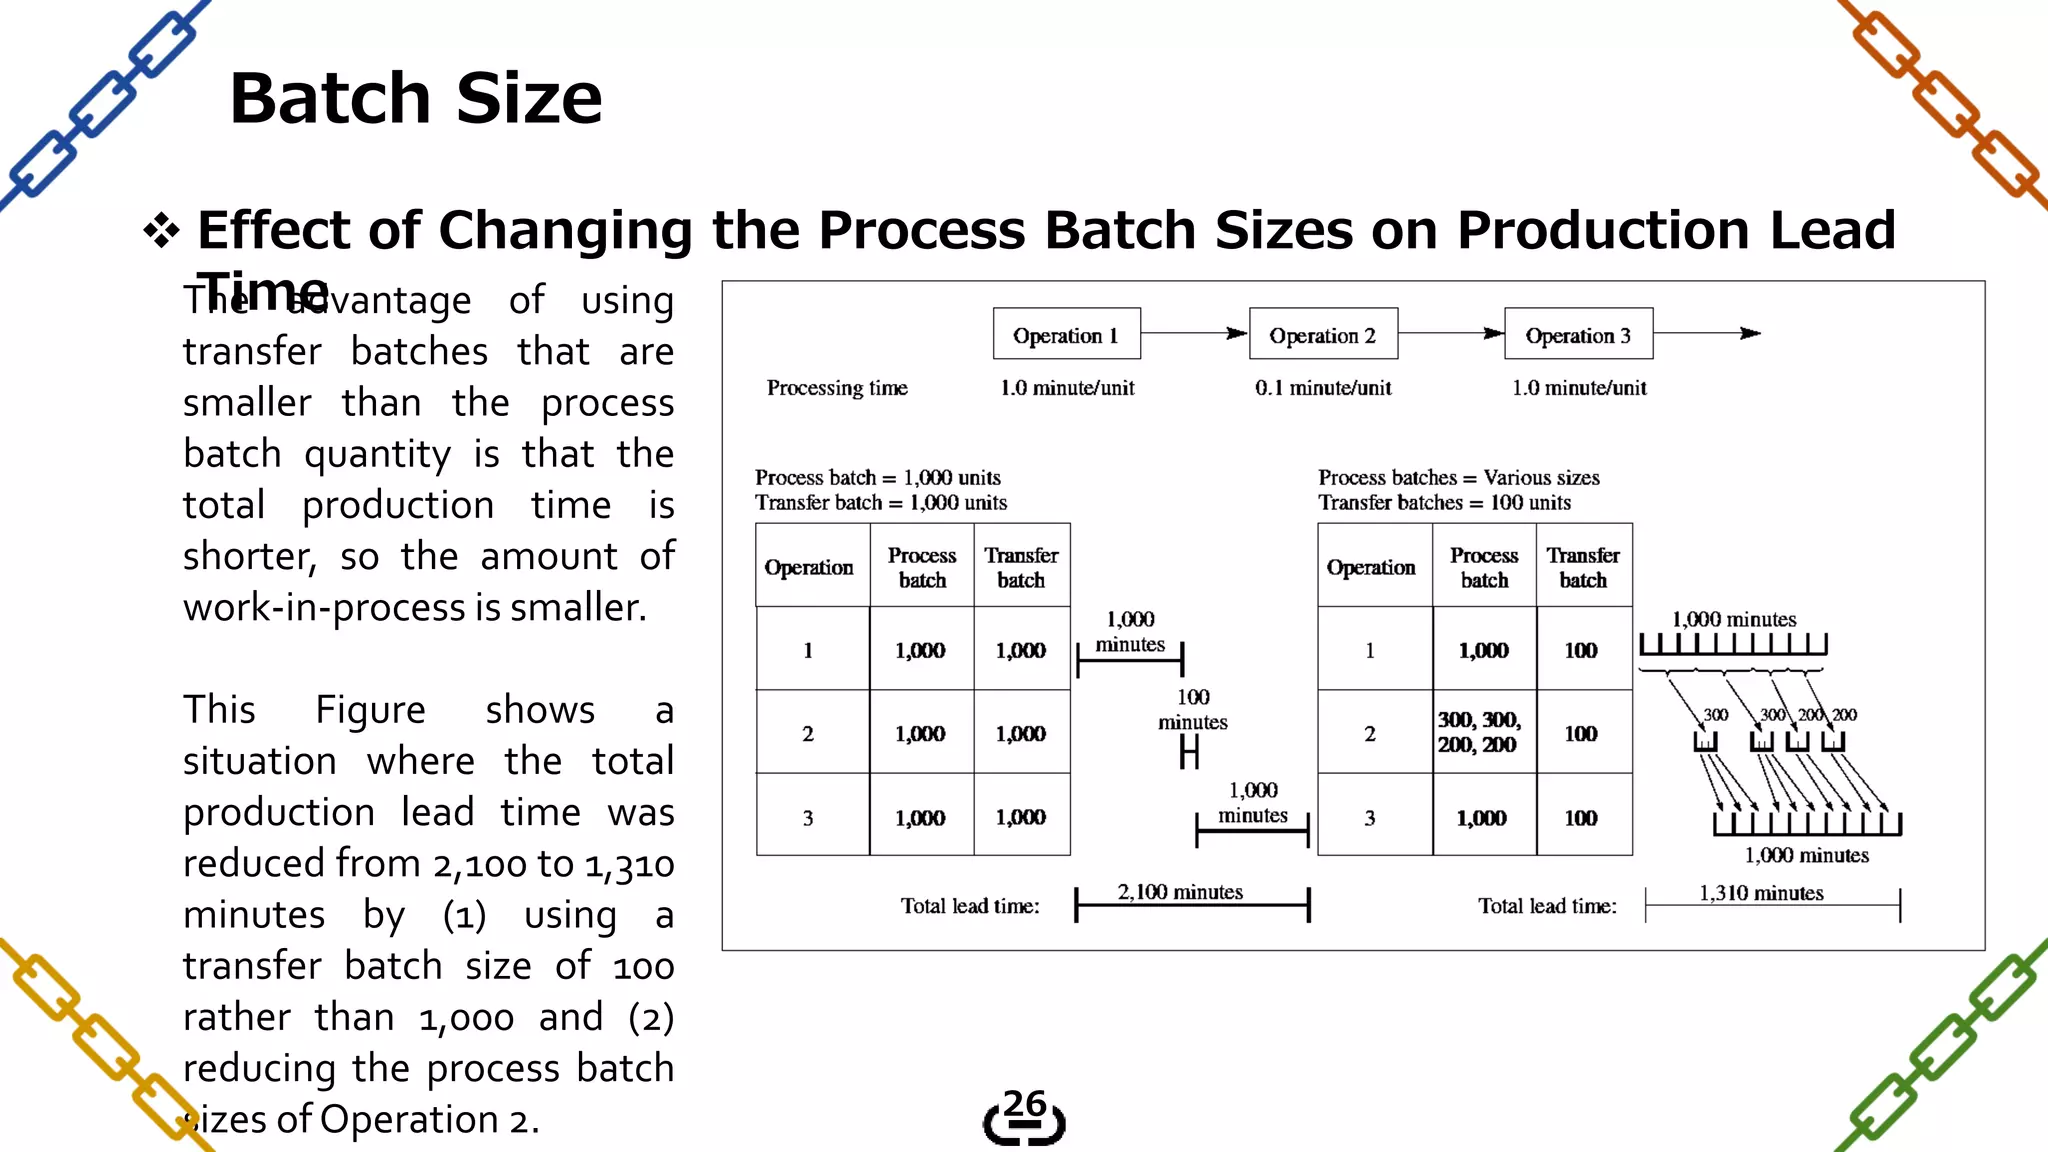
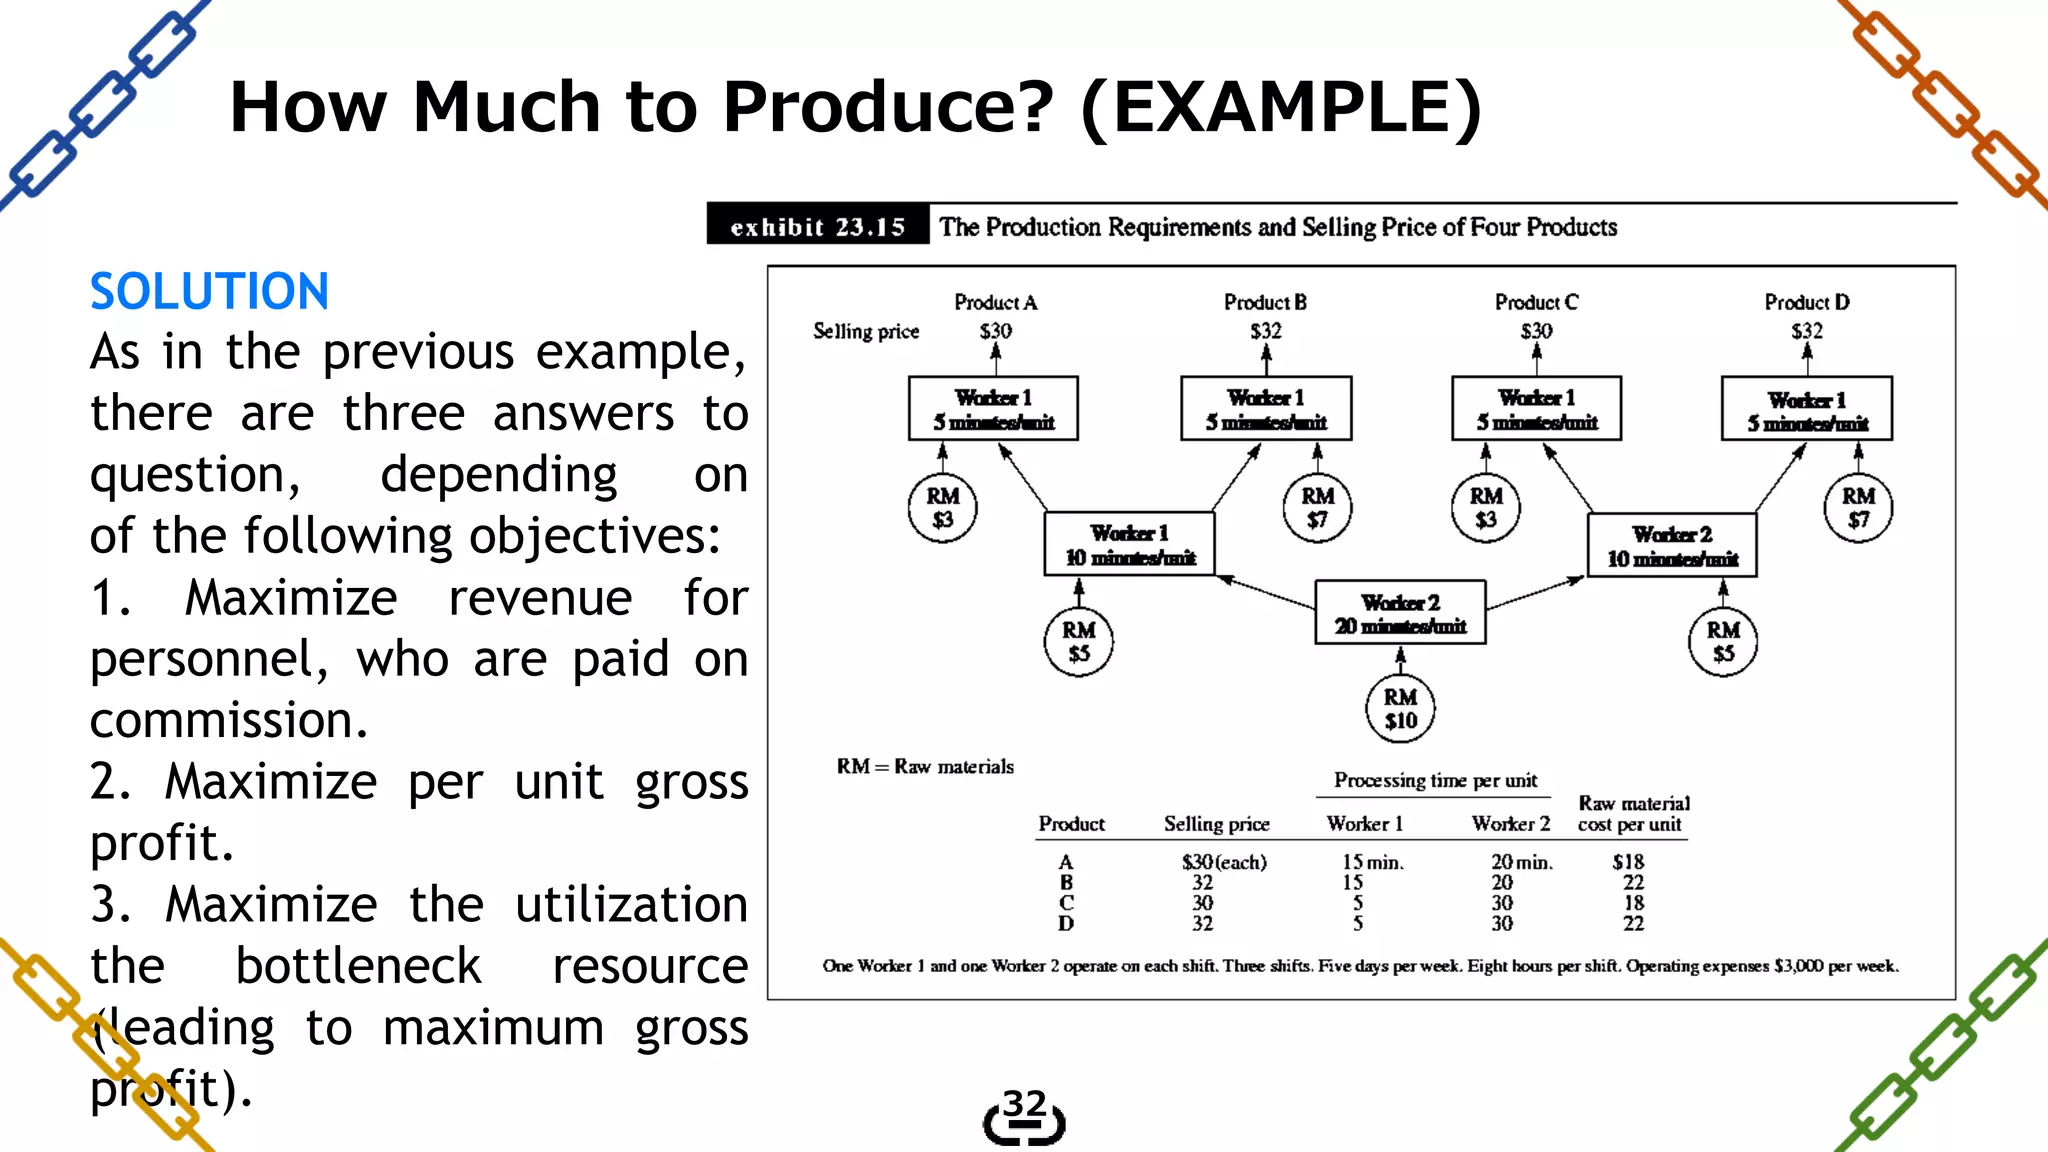
The document provides an overview of a presentation on the Theory of Constraints (TOC). It includes:
1. An outline of the presentation contents which discusses key TOC concepts like bottlenecks, non-bottlenecks, drum-buffer-rope, and how to determine batch sizes.
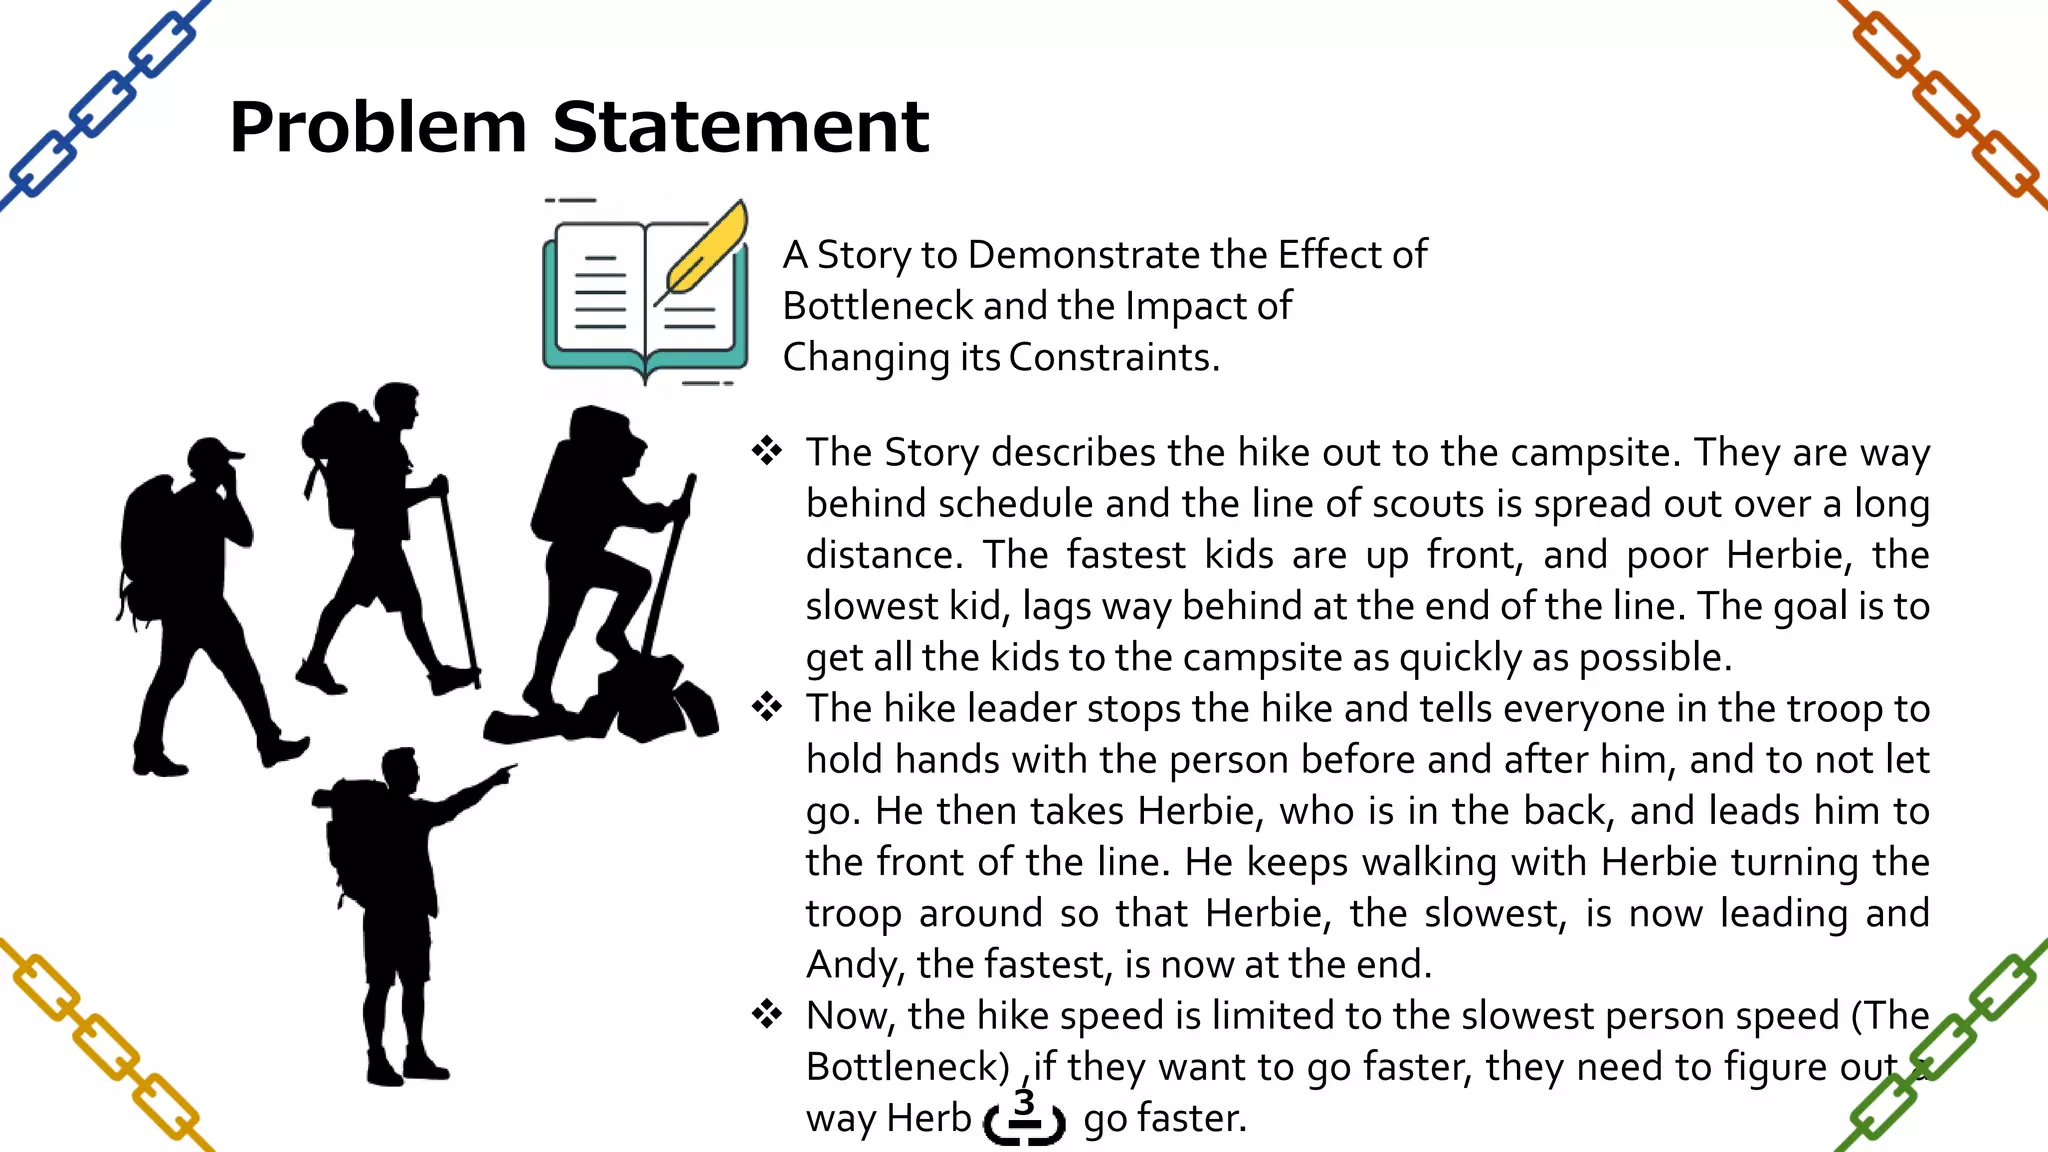
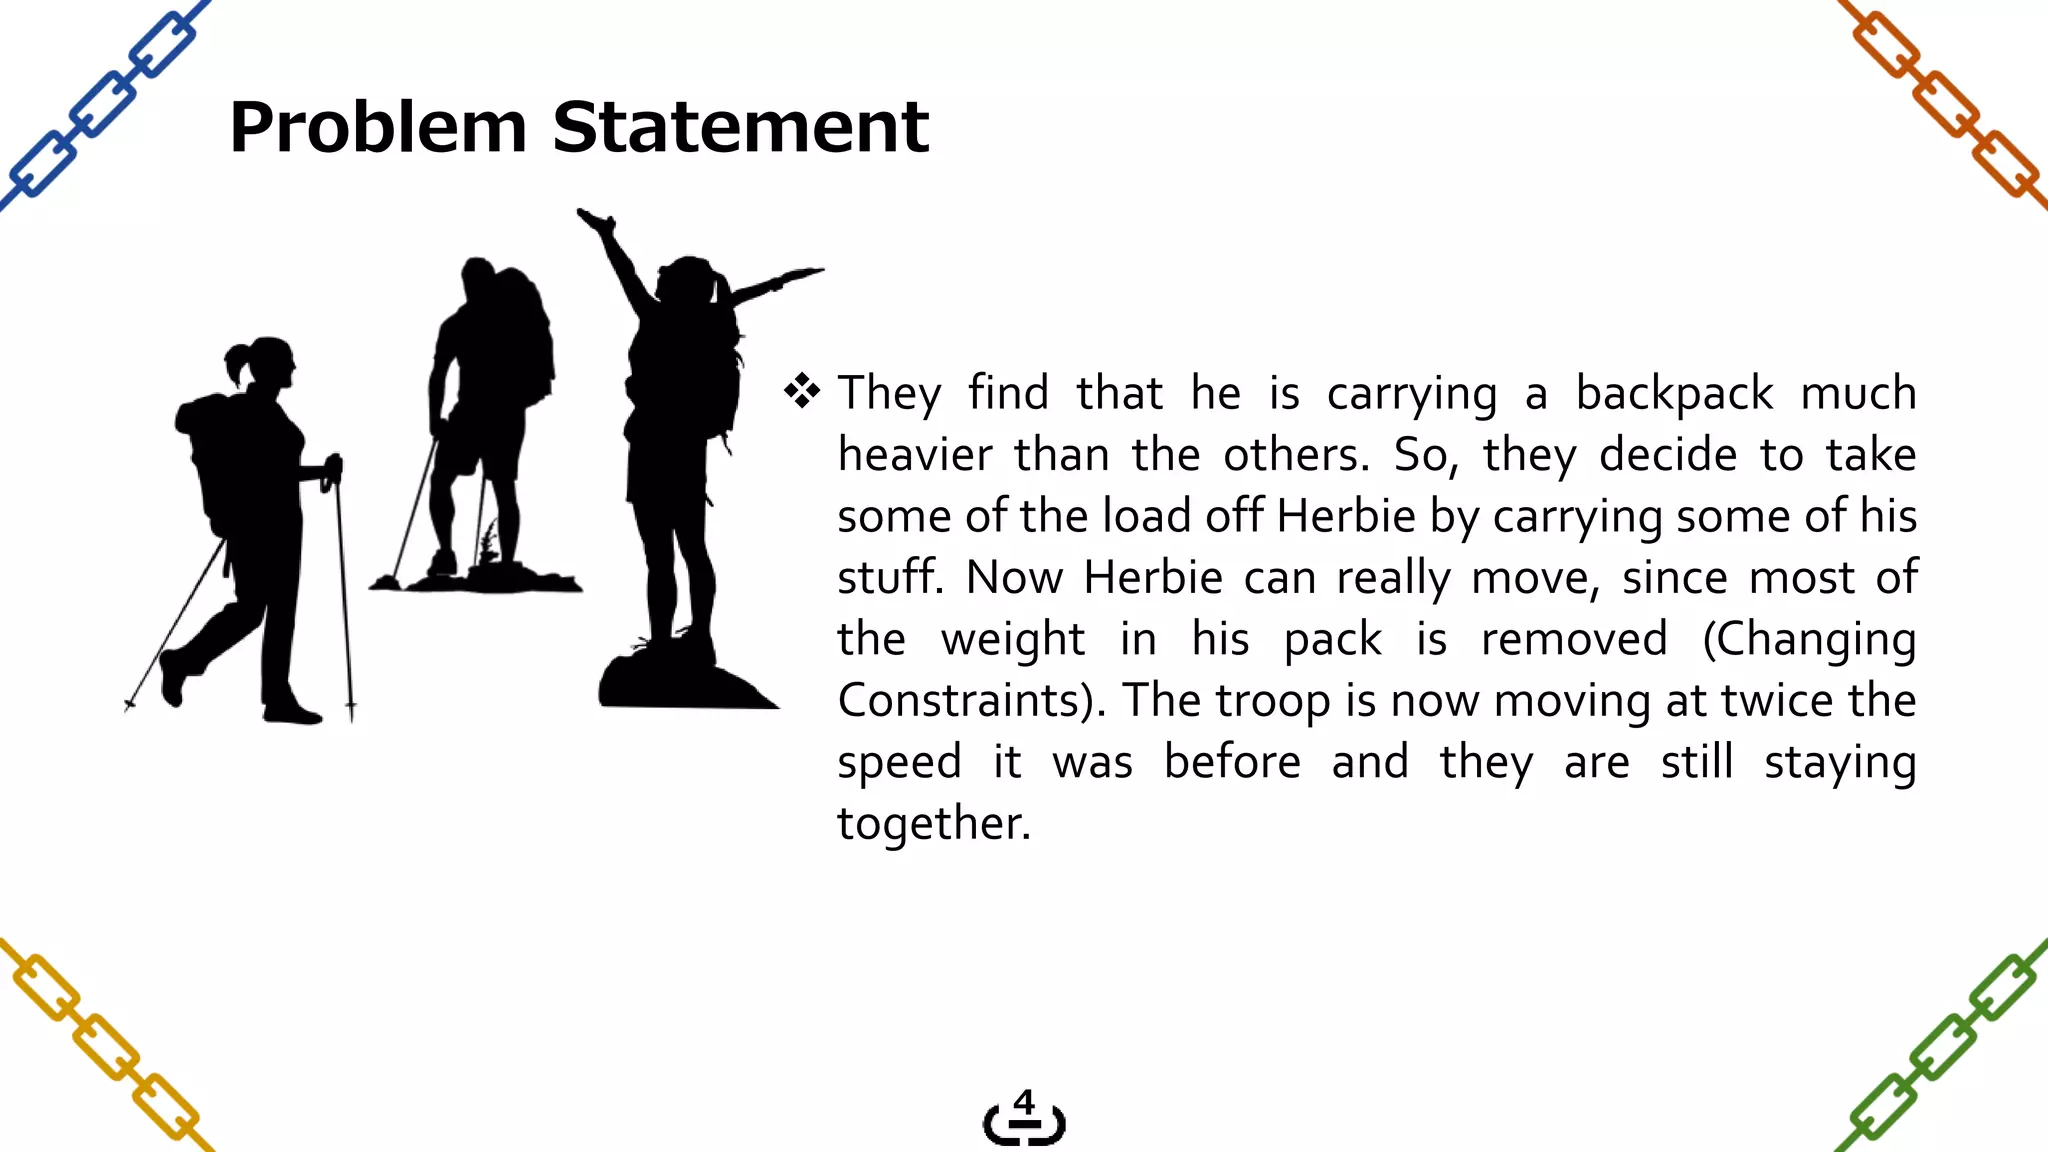
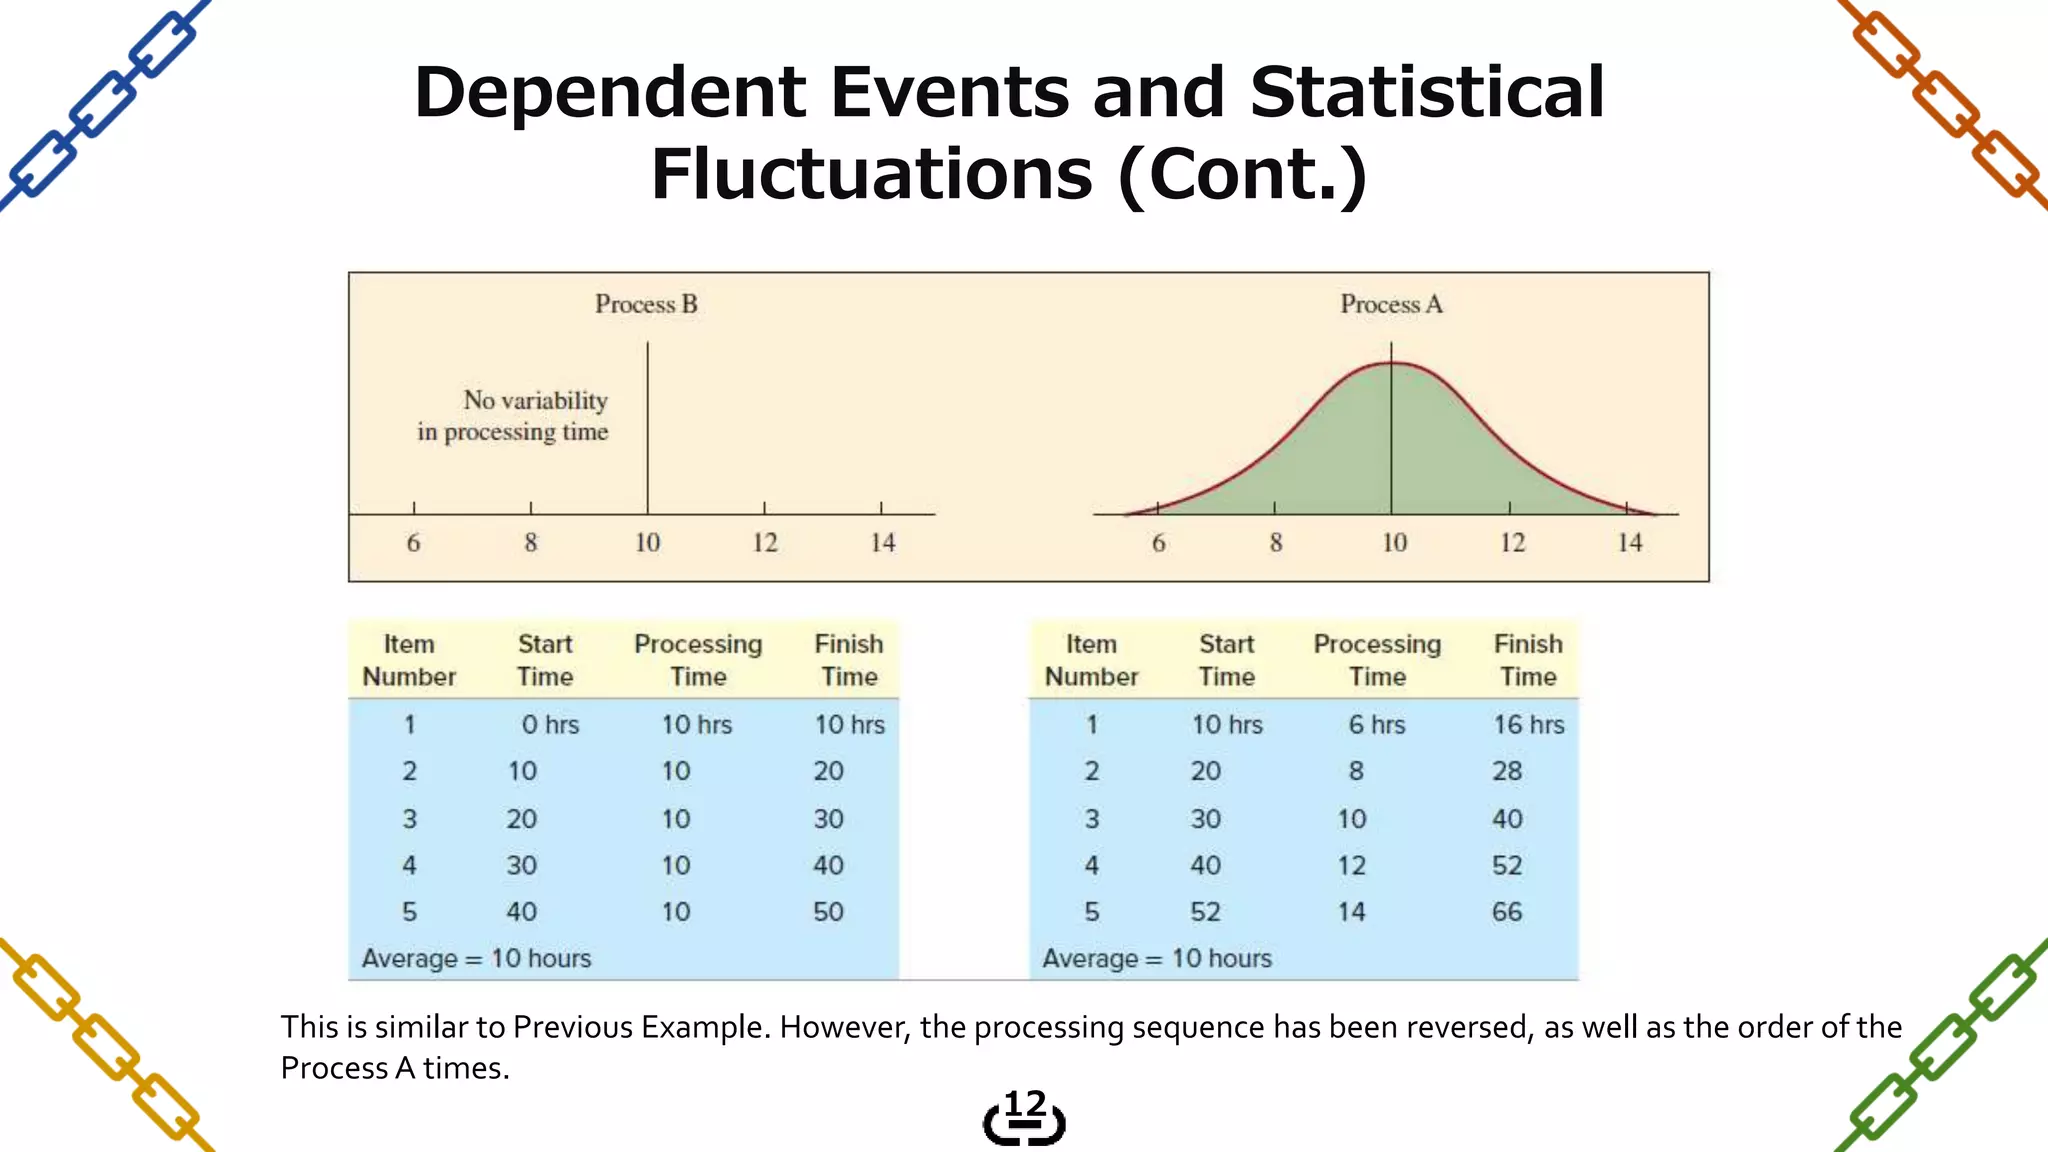
2. A story example that demonstrates how changing the constraints of the slowest person in a hiking line (the bottleneck) allows the whole group to move faster.
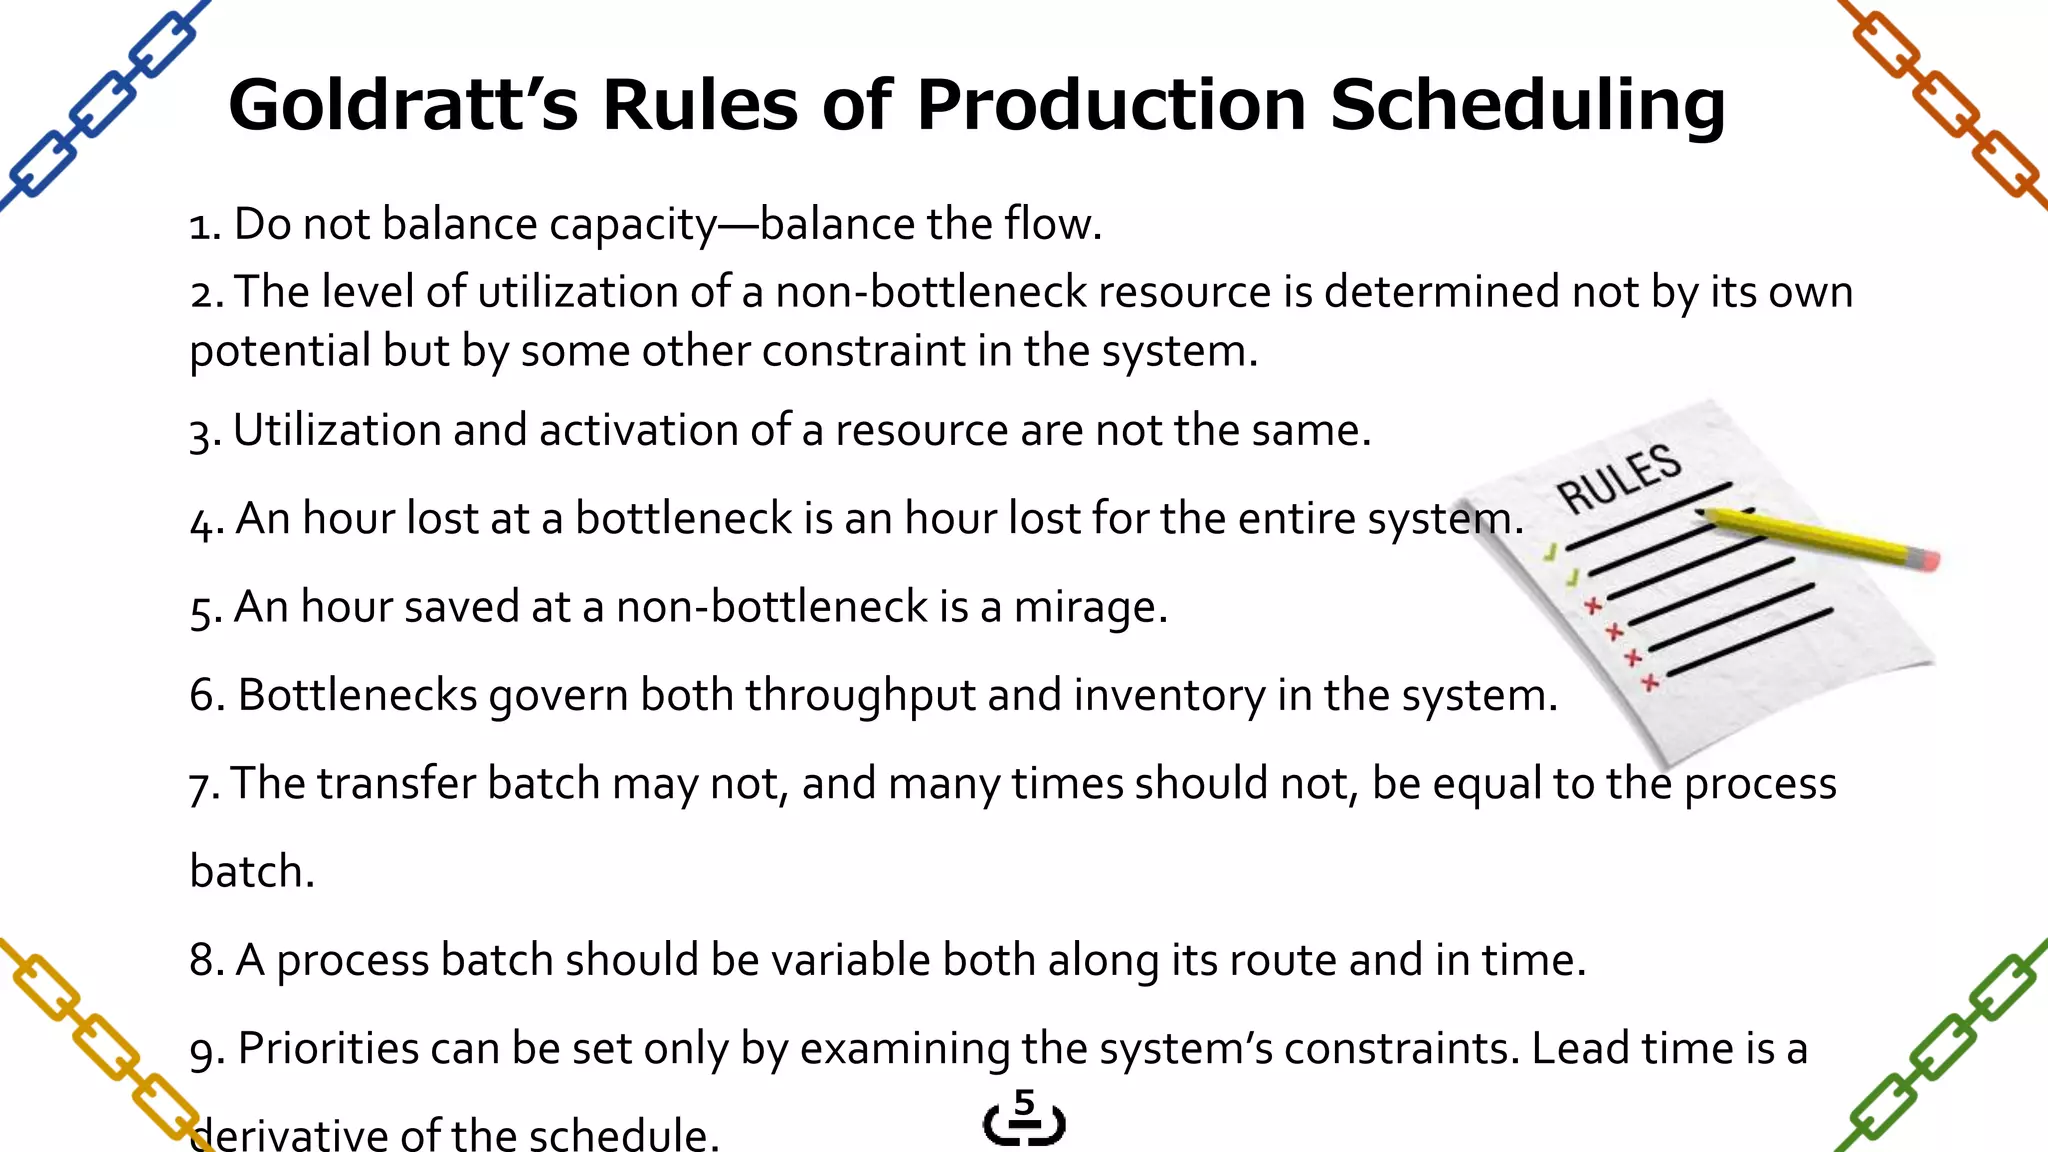
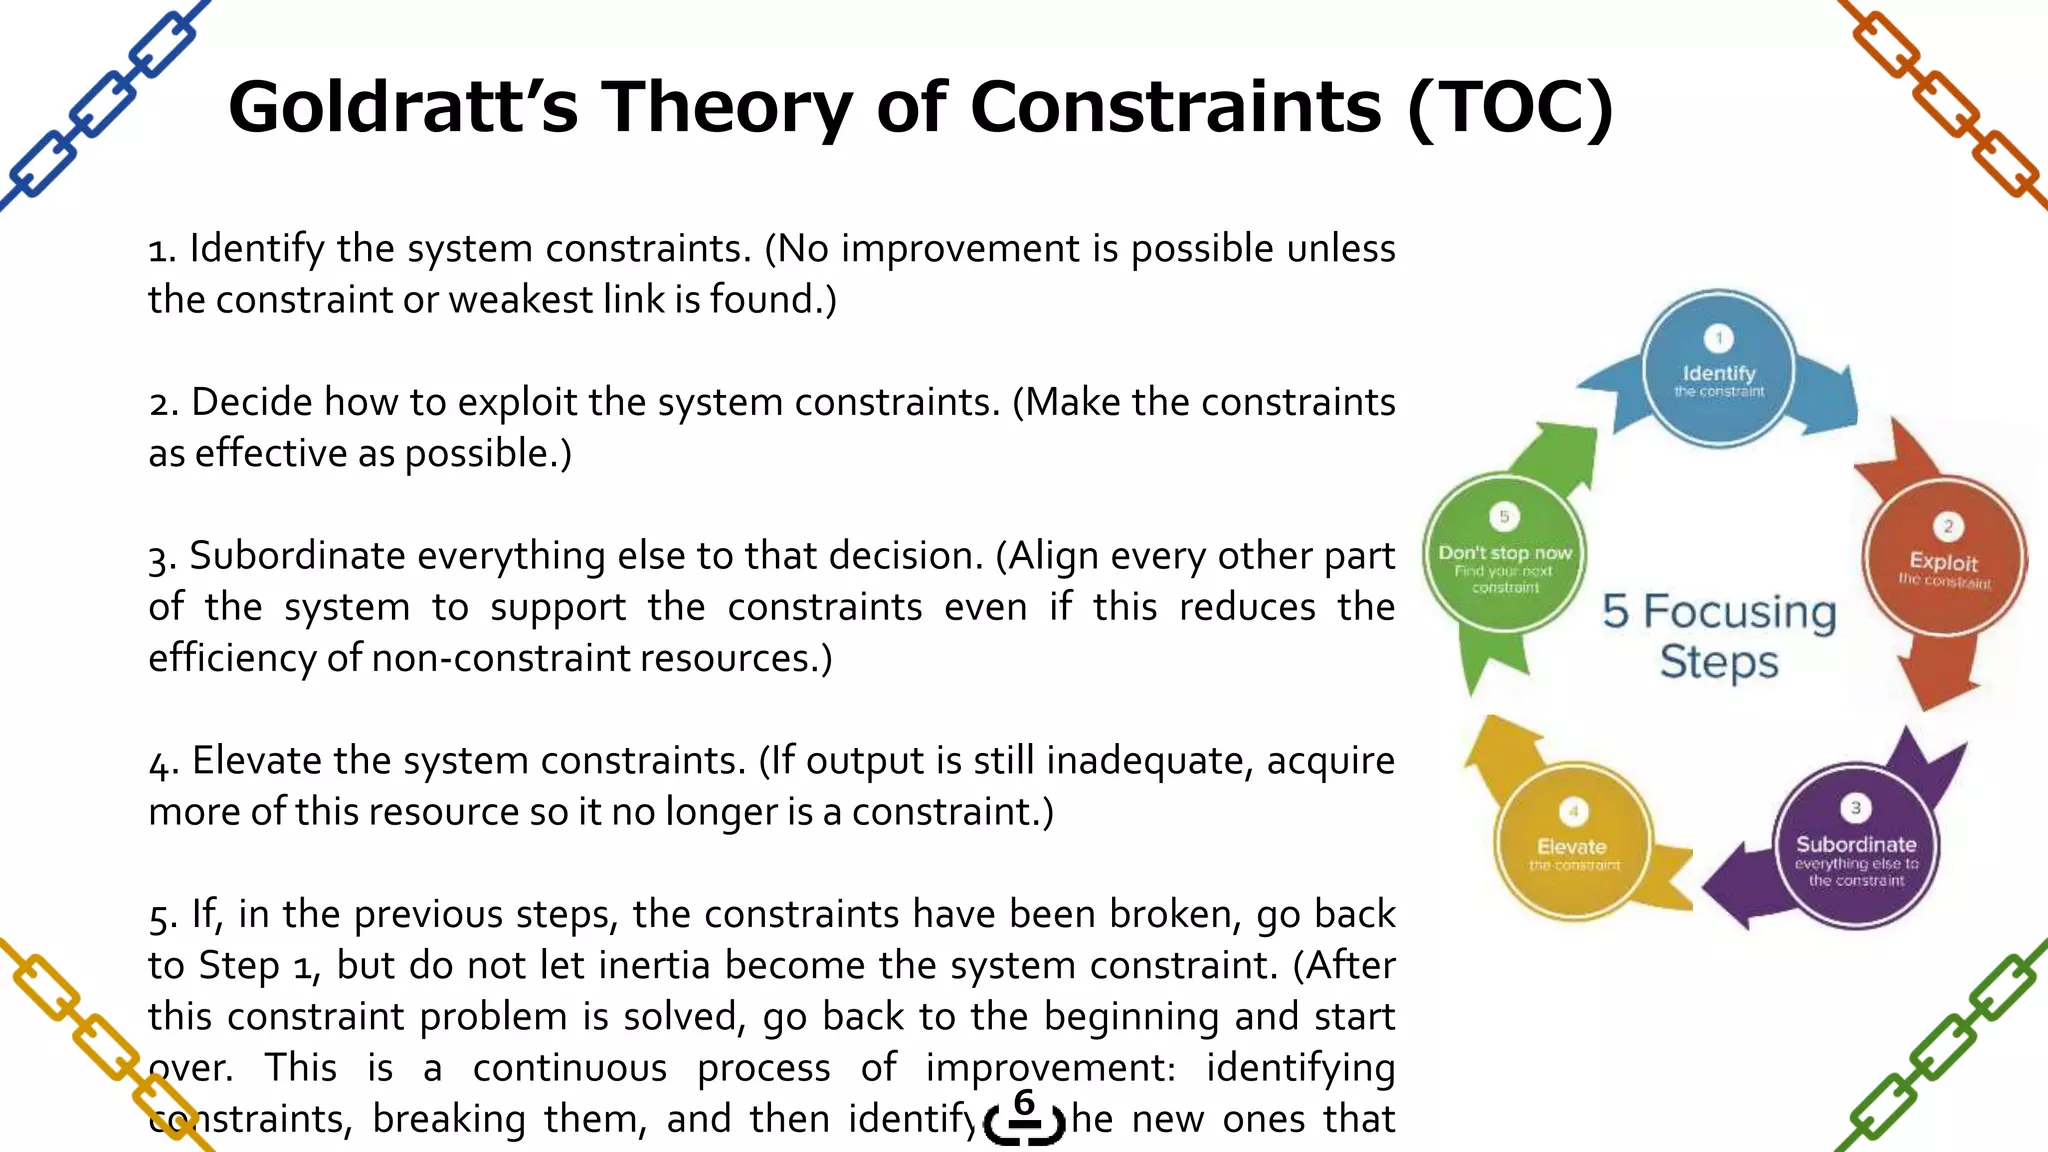
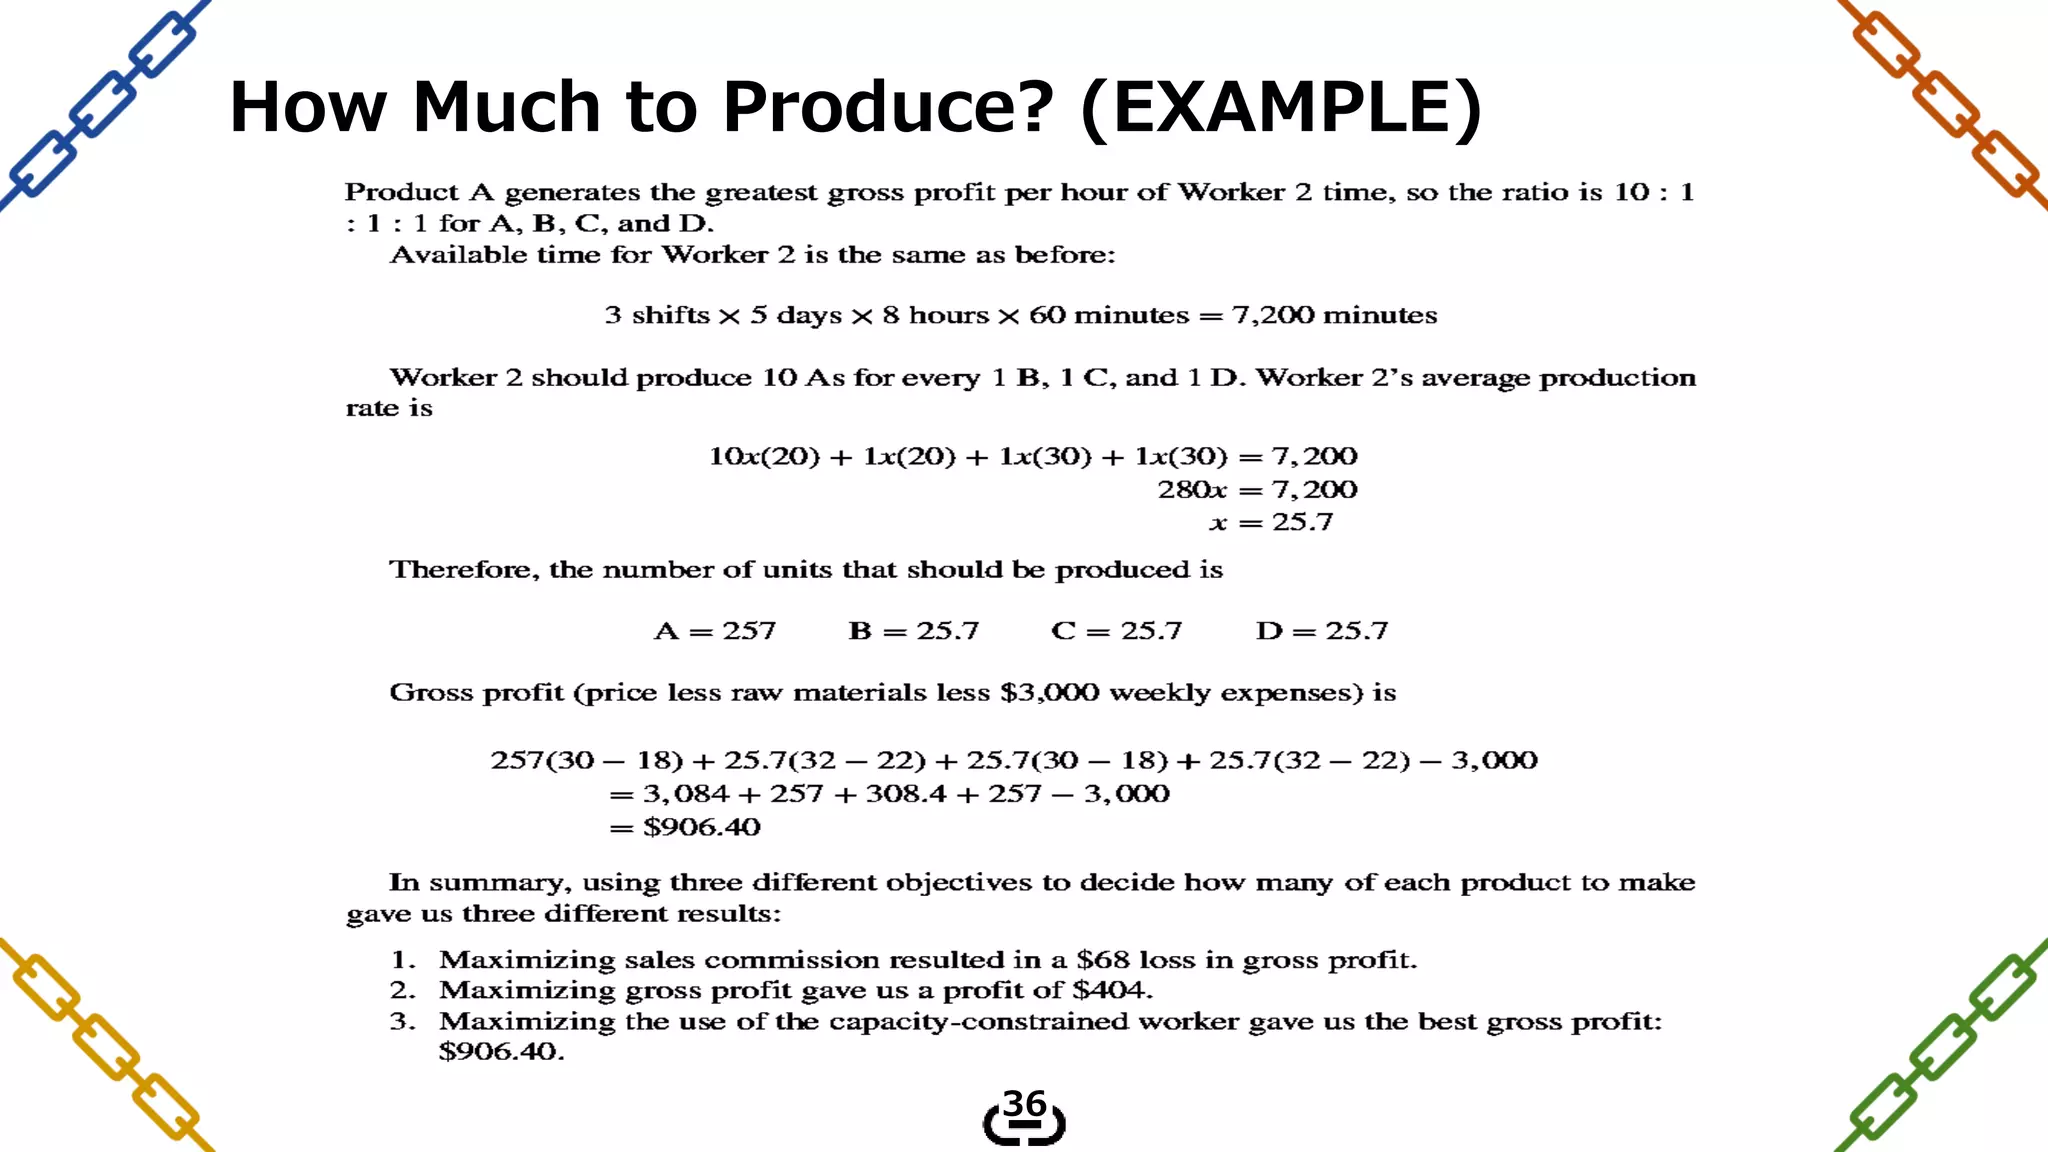
3. Goldratt's rules of production scheduling and the five focusing steps of TOC for improving throughput in a constrained system.


![THE GOAL book review (Arnold Labares) [view only]](https://cdn.slidesharecdn.com/ss_thumbnails/thegoalbookreviewarnoldlabares-190306000905-thumbnail.jpg?width=640&height=640&fit=bounds)


