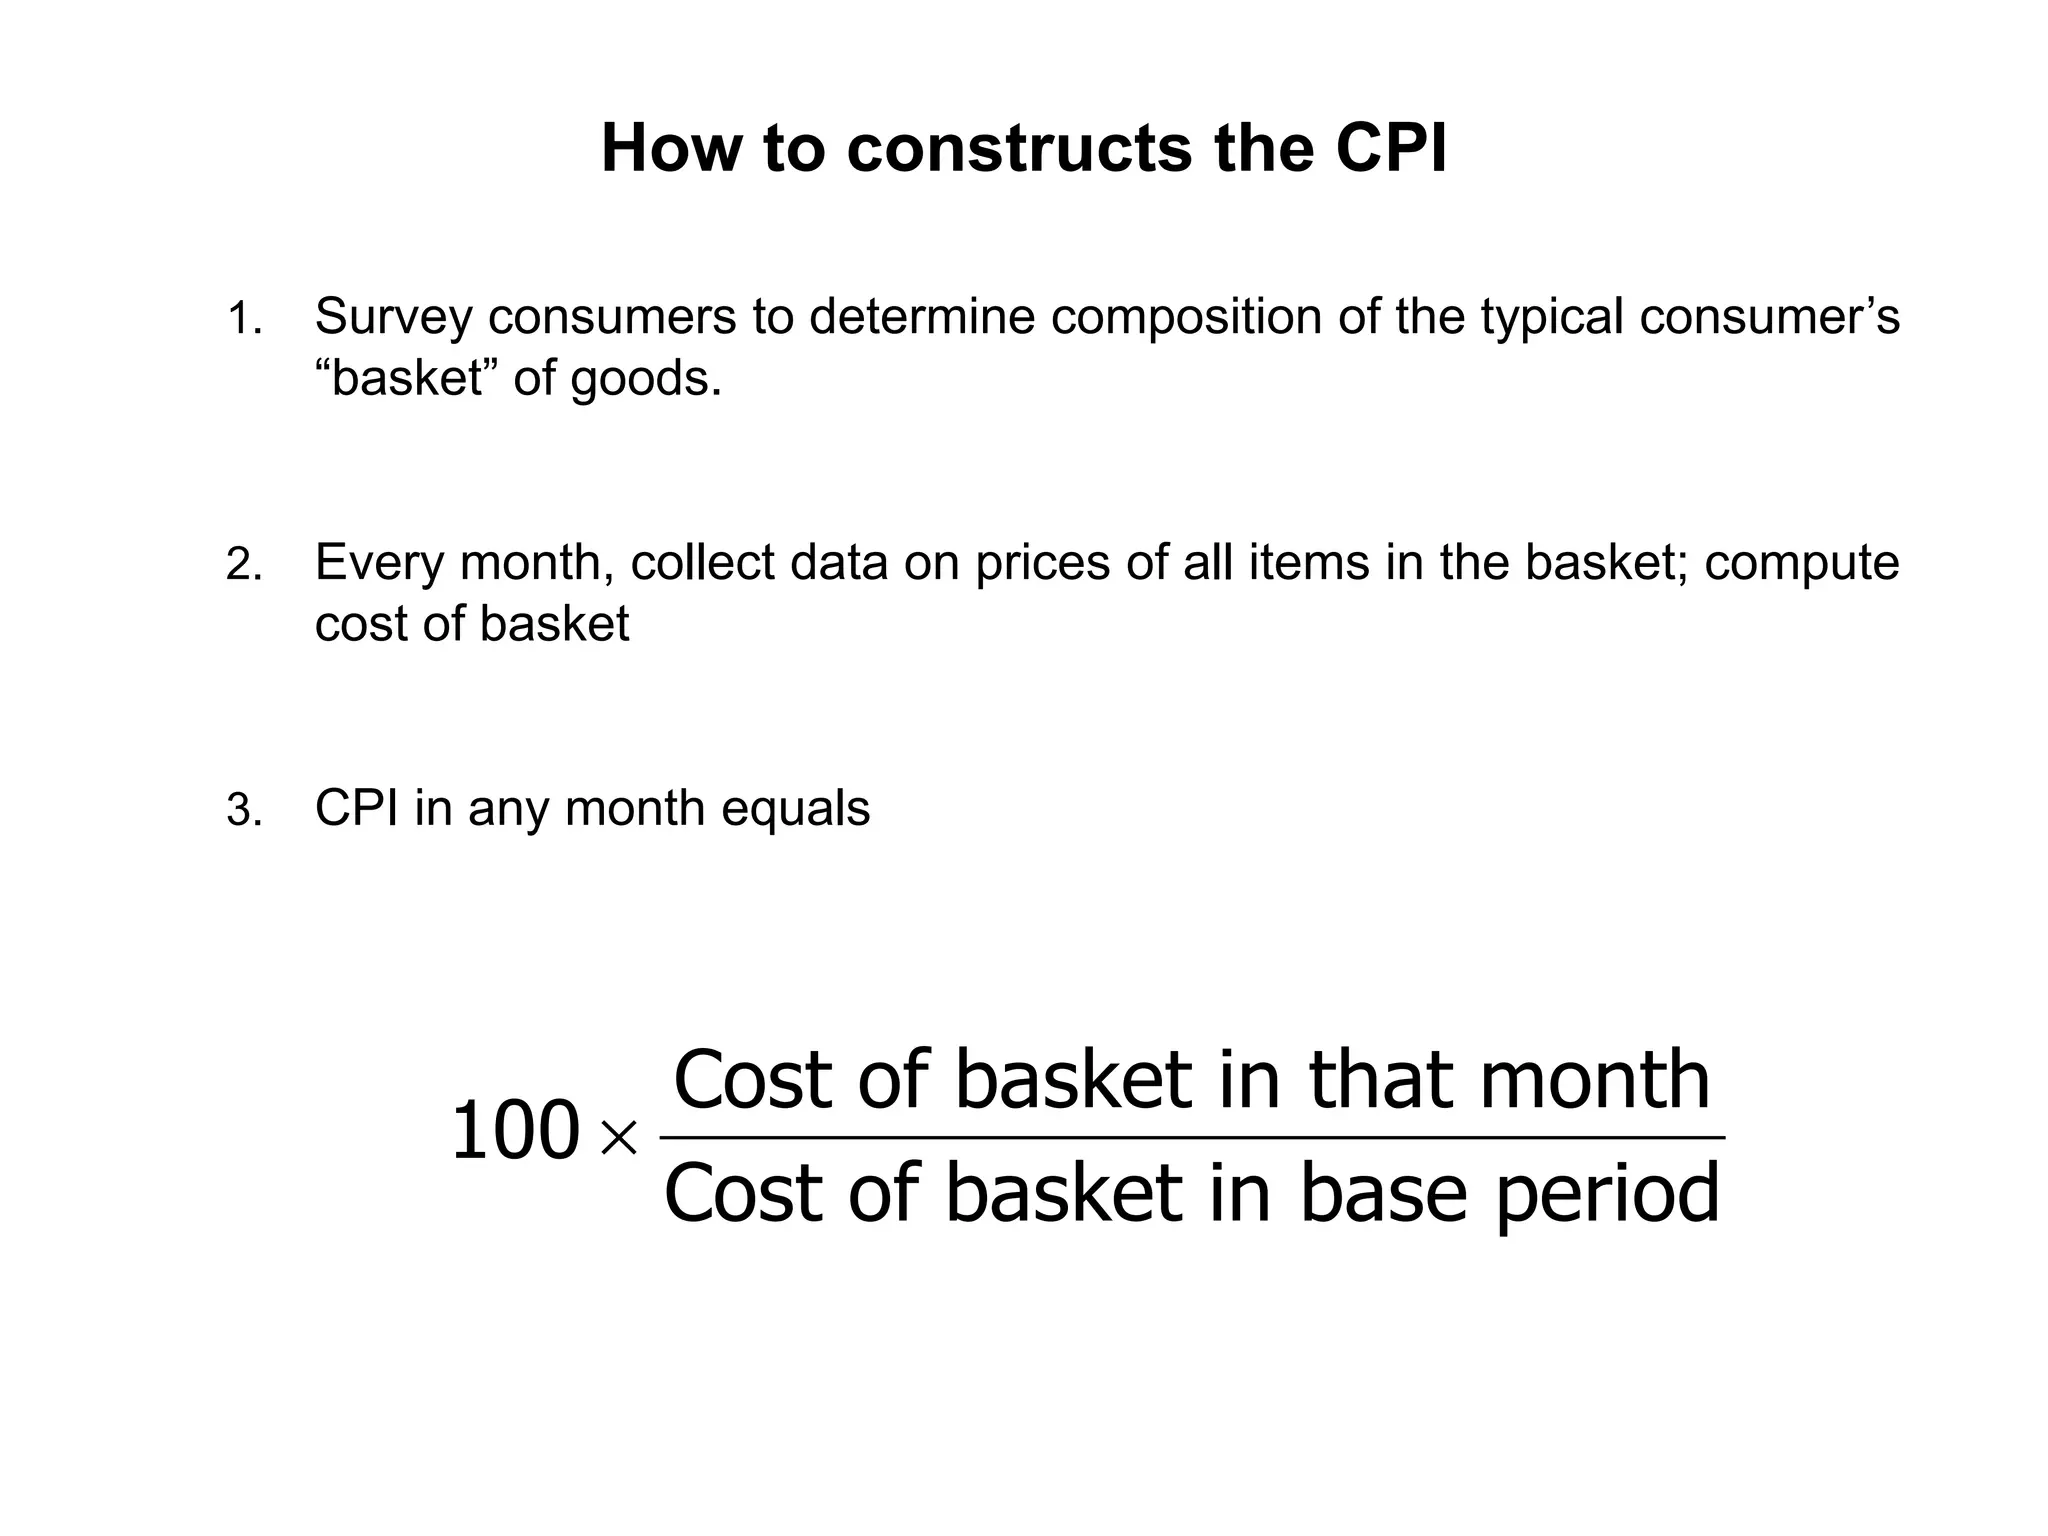
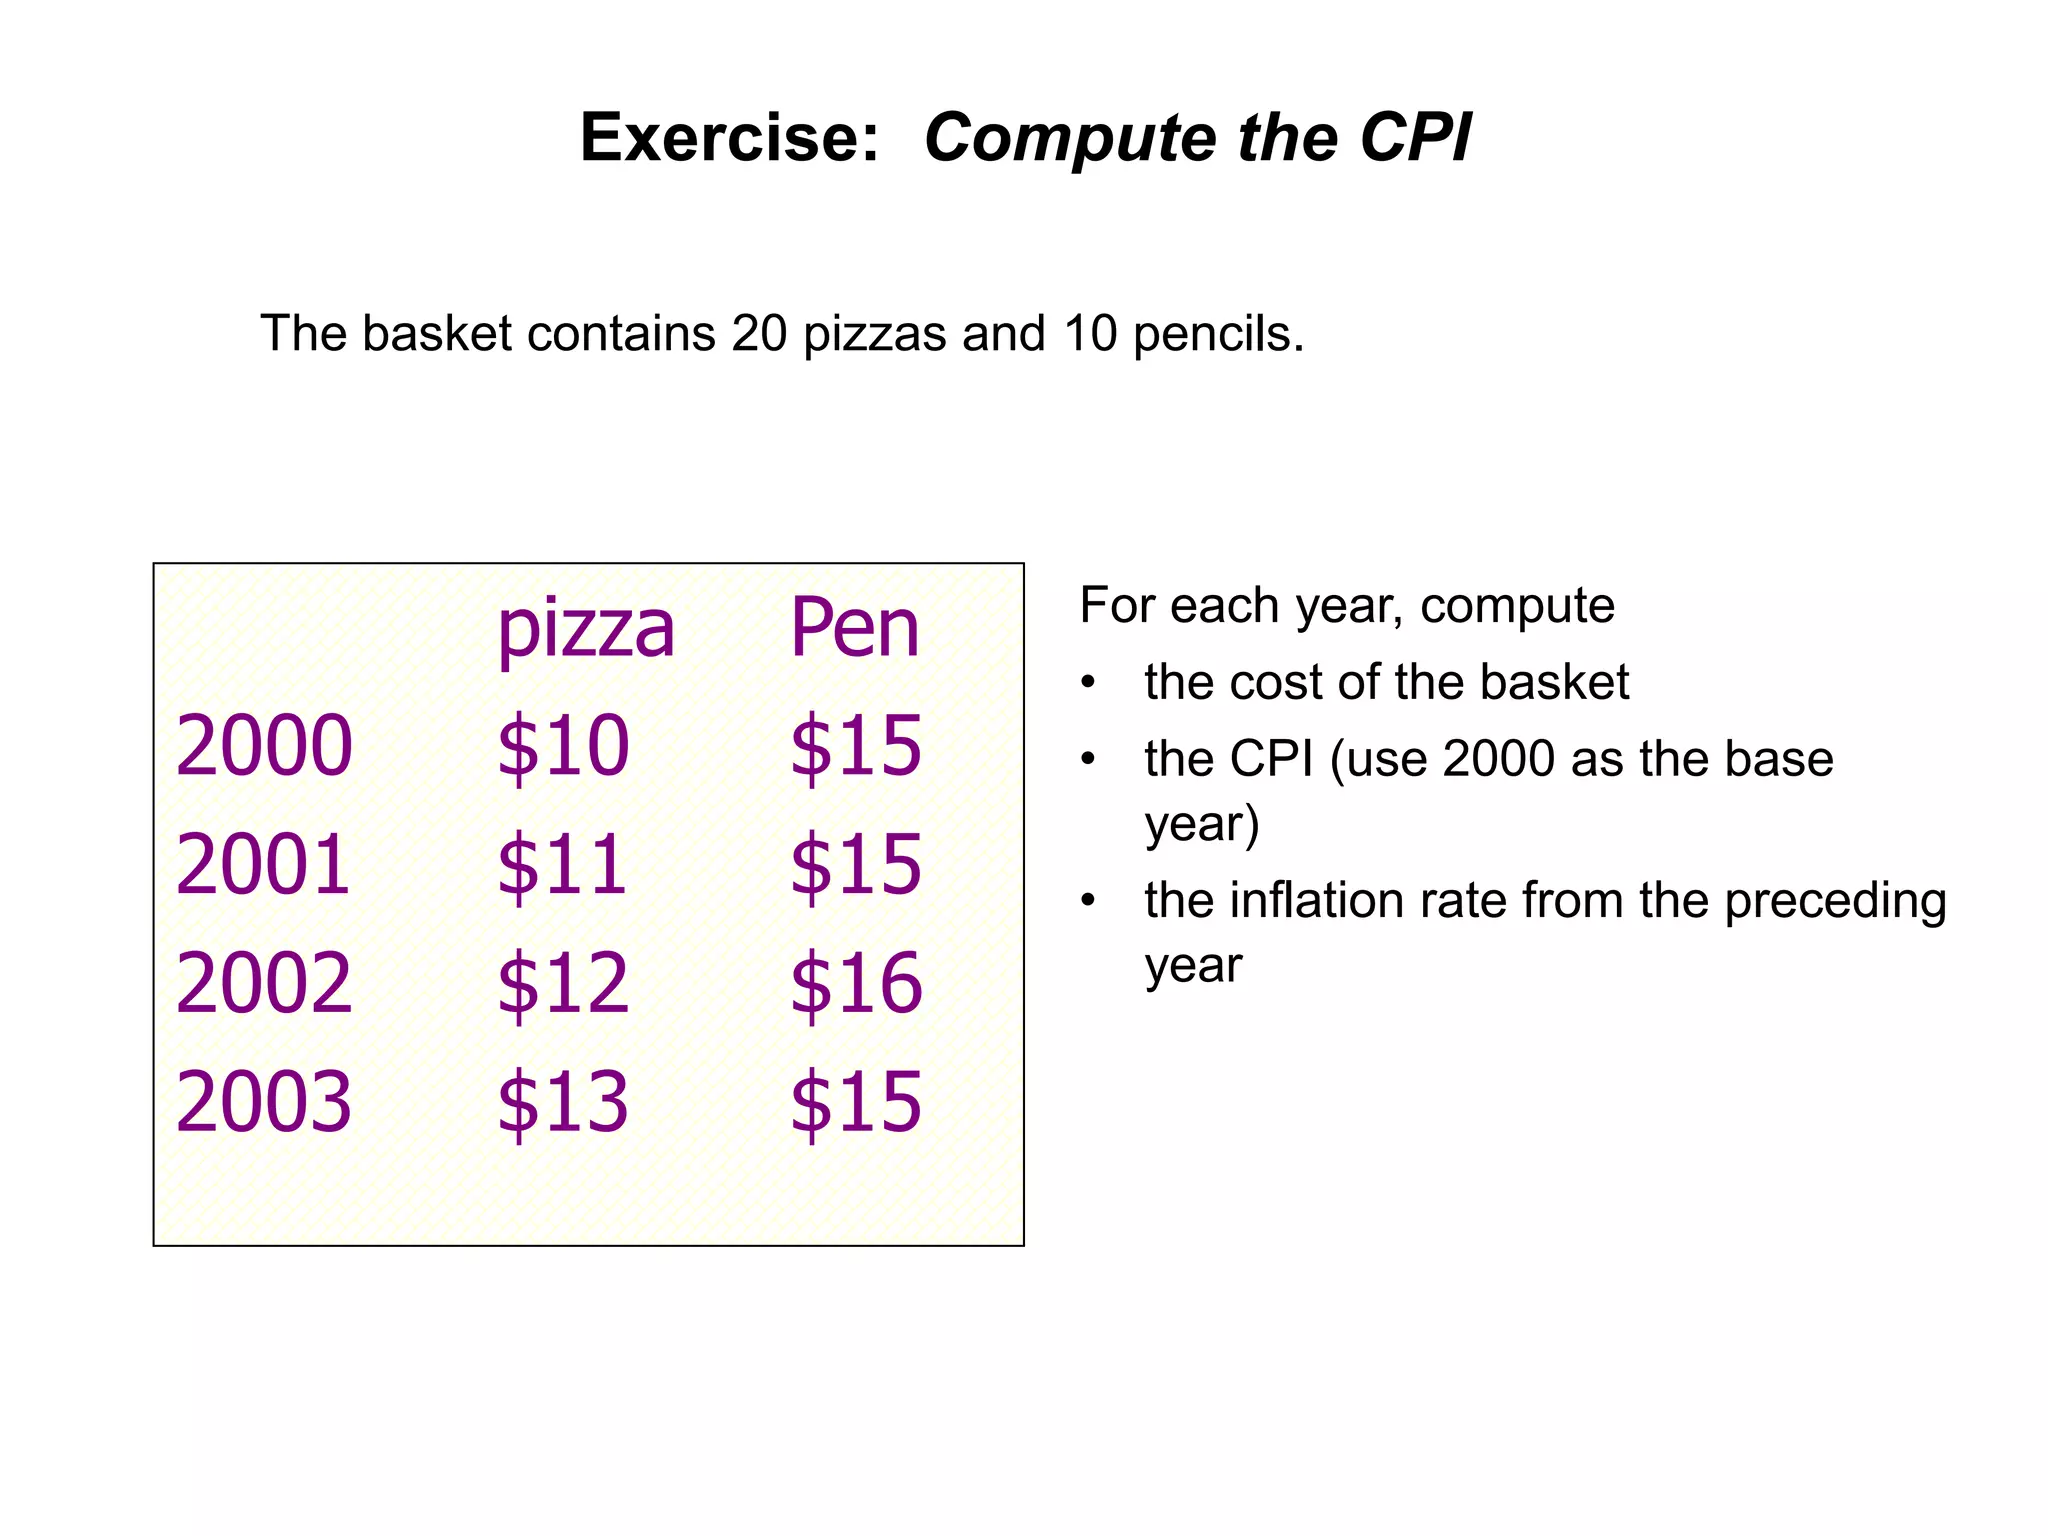
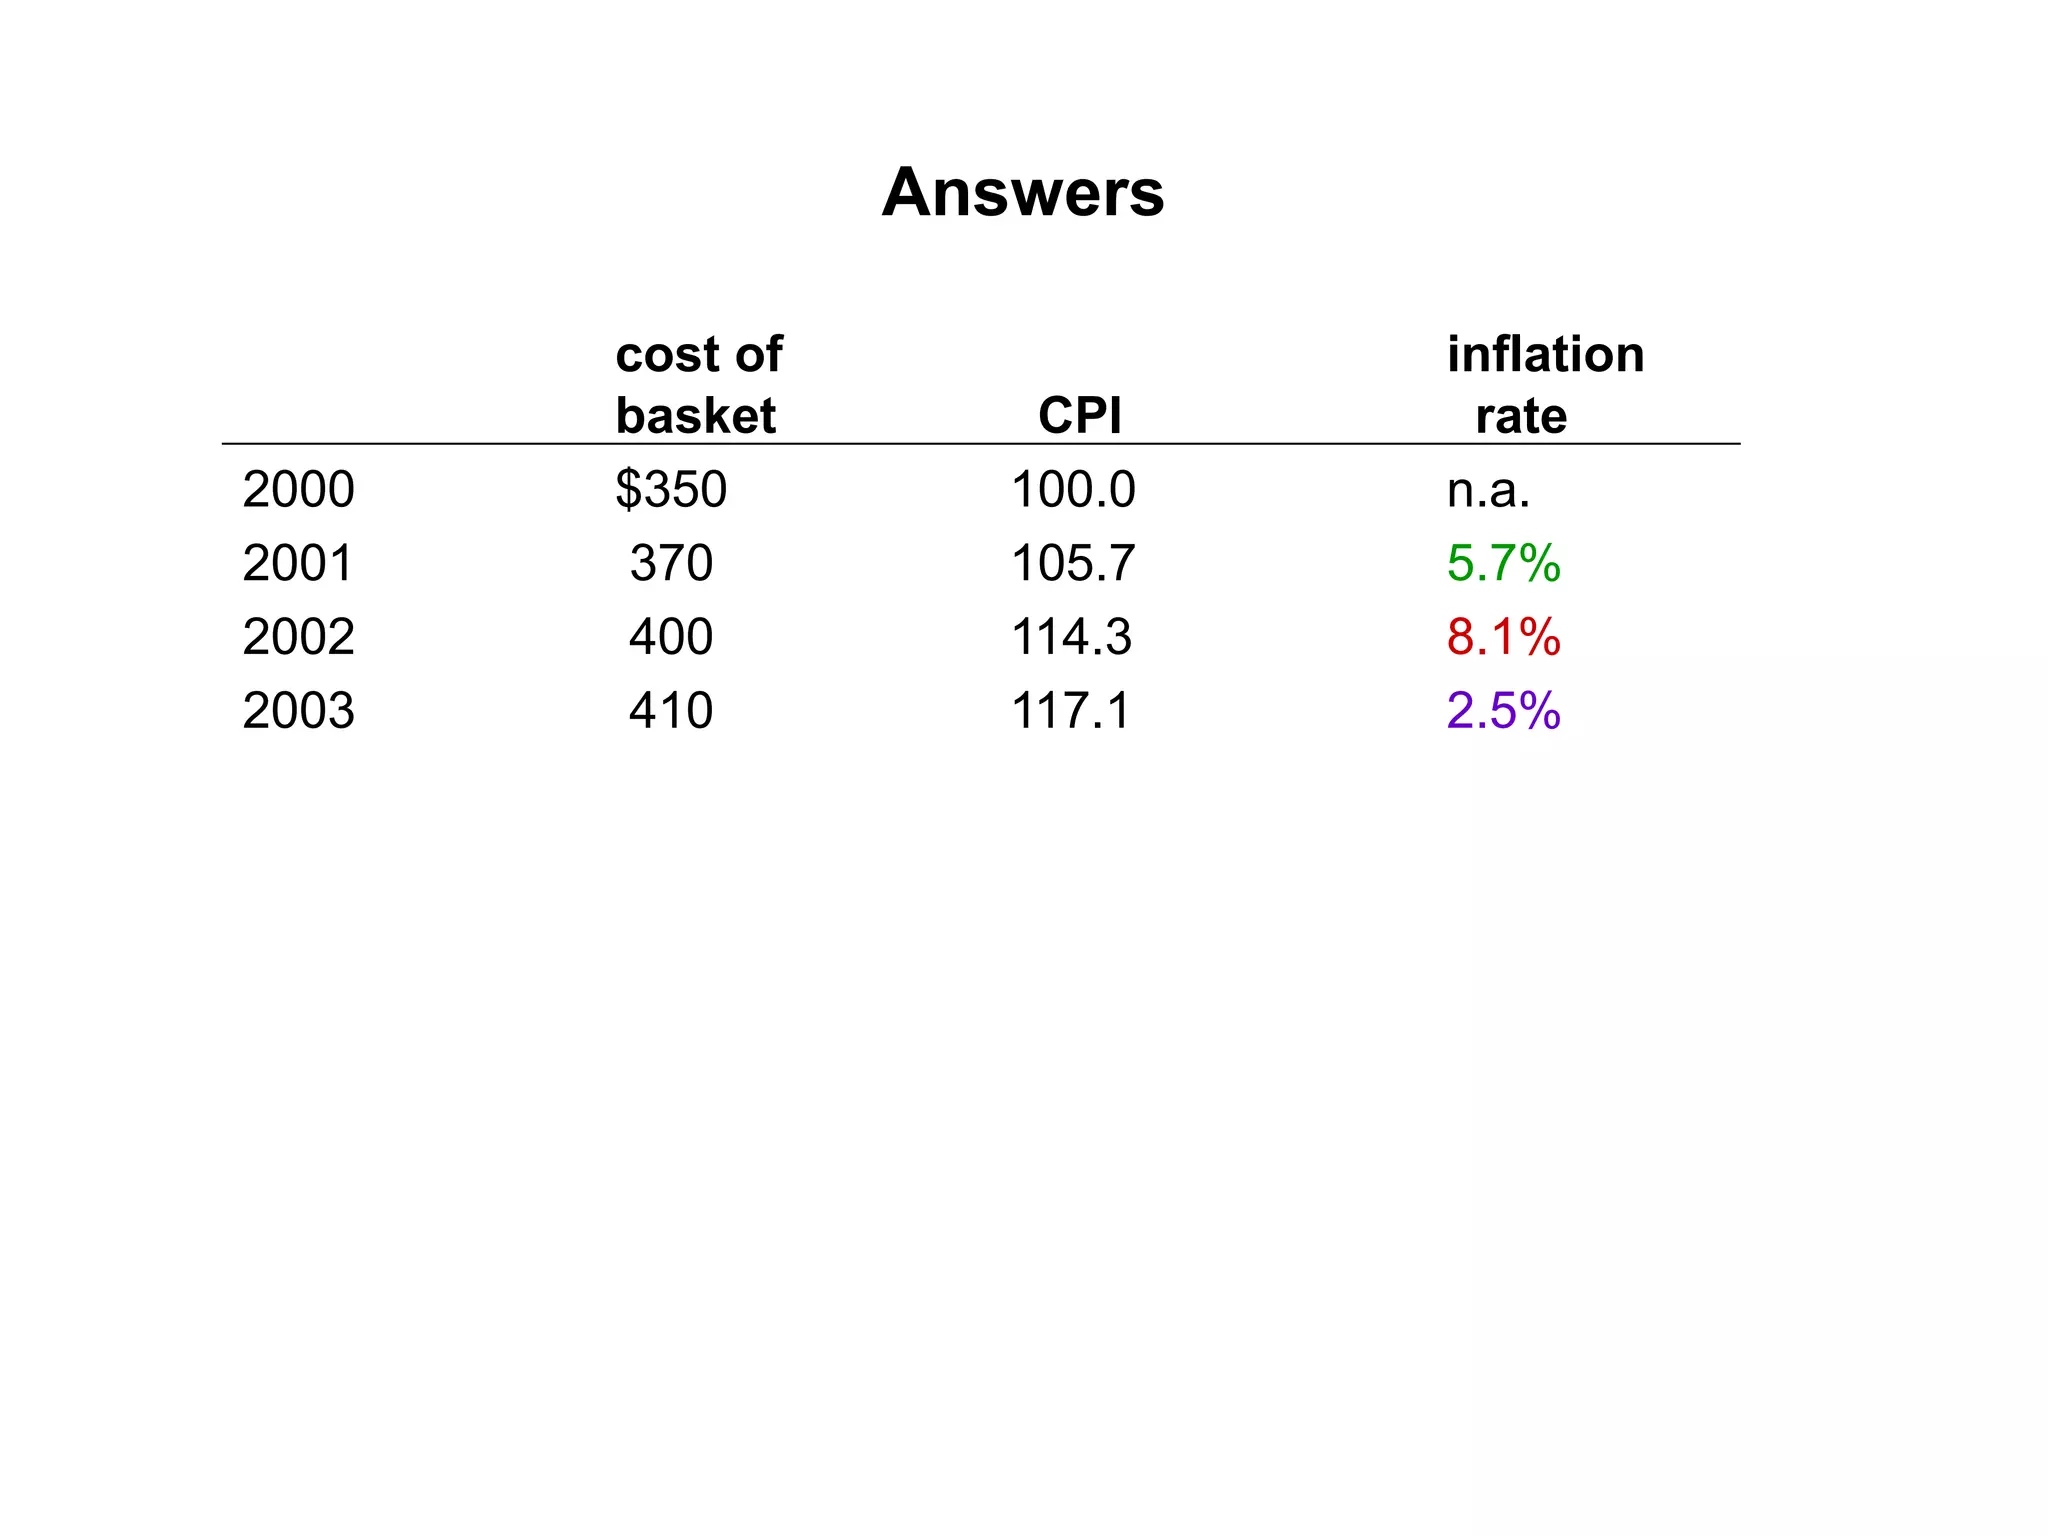
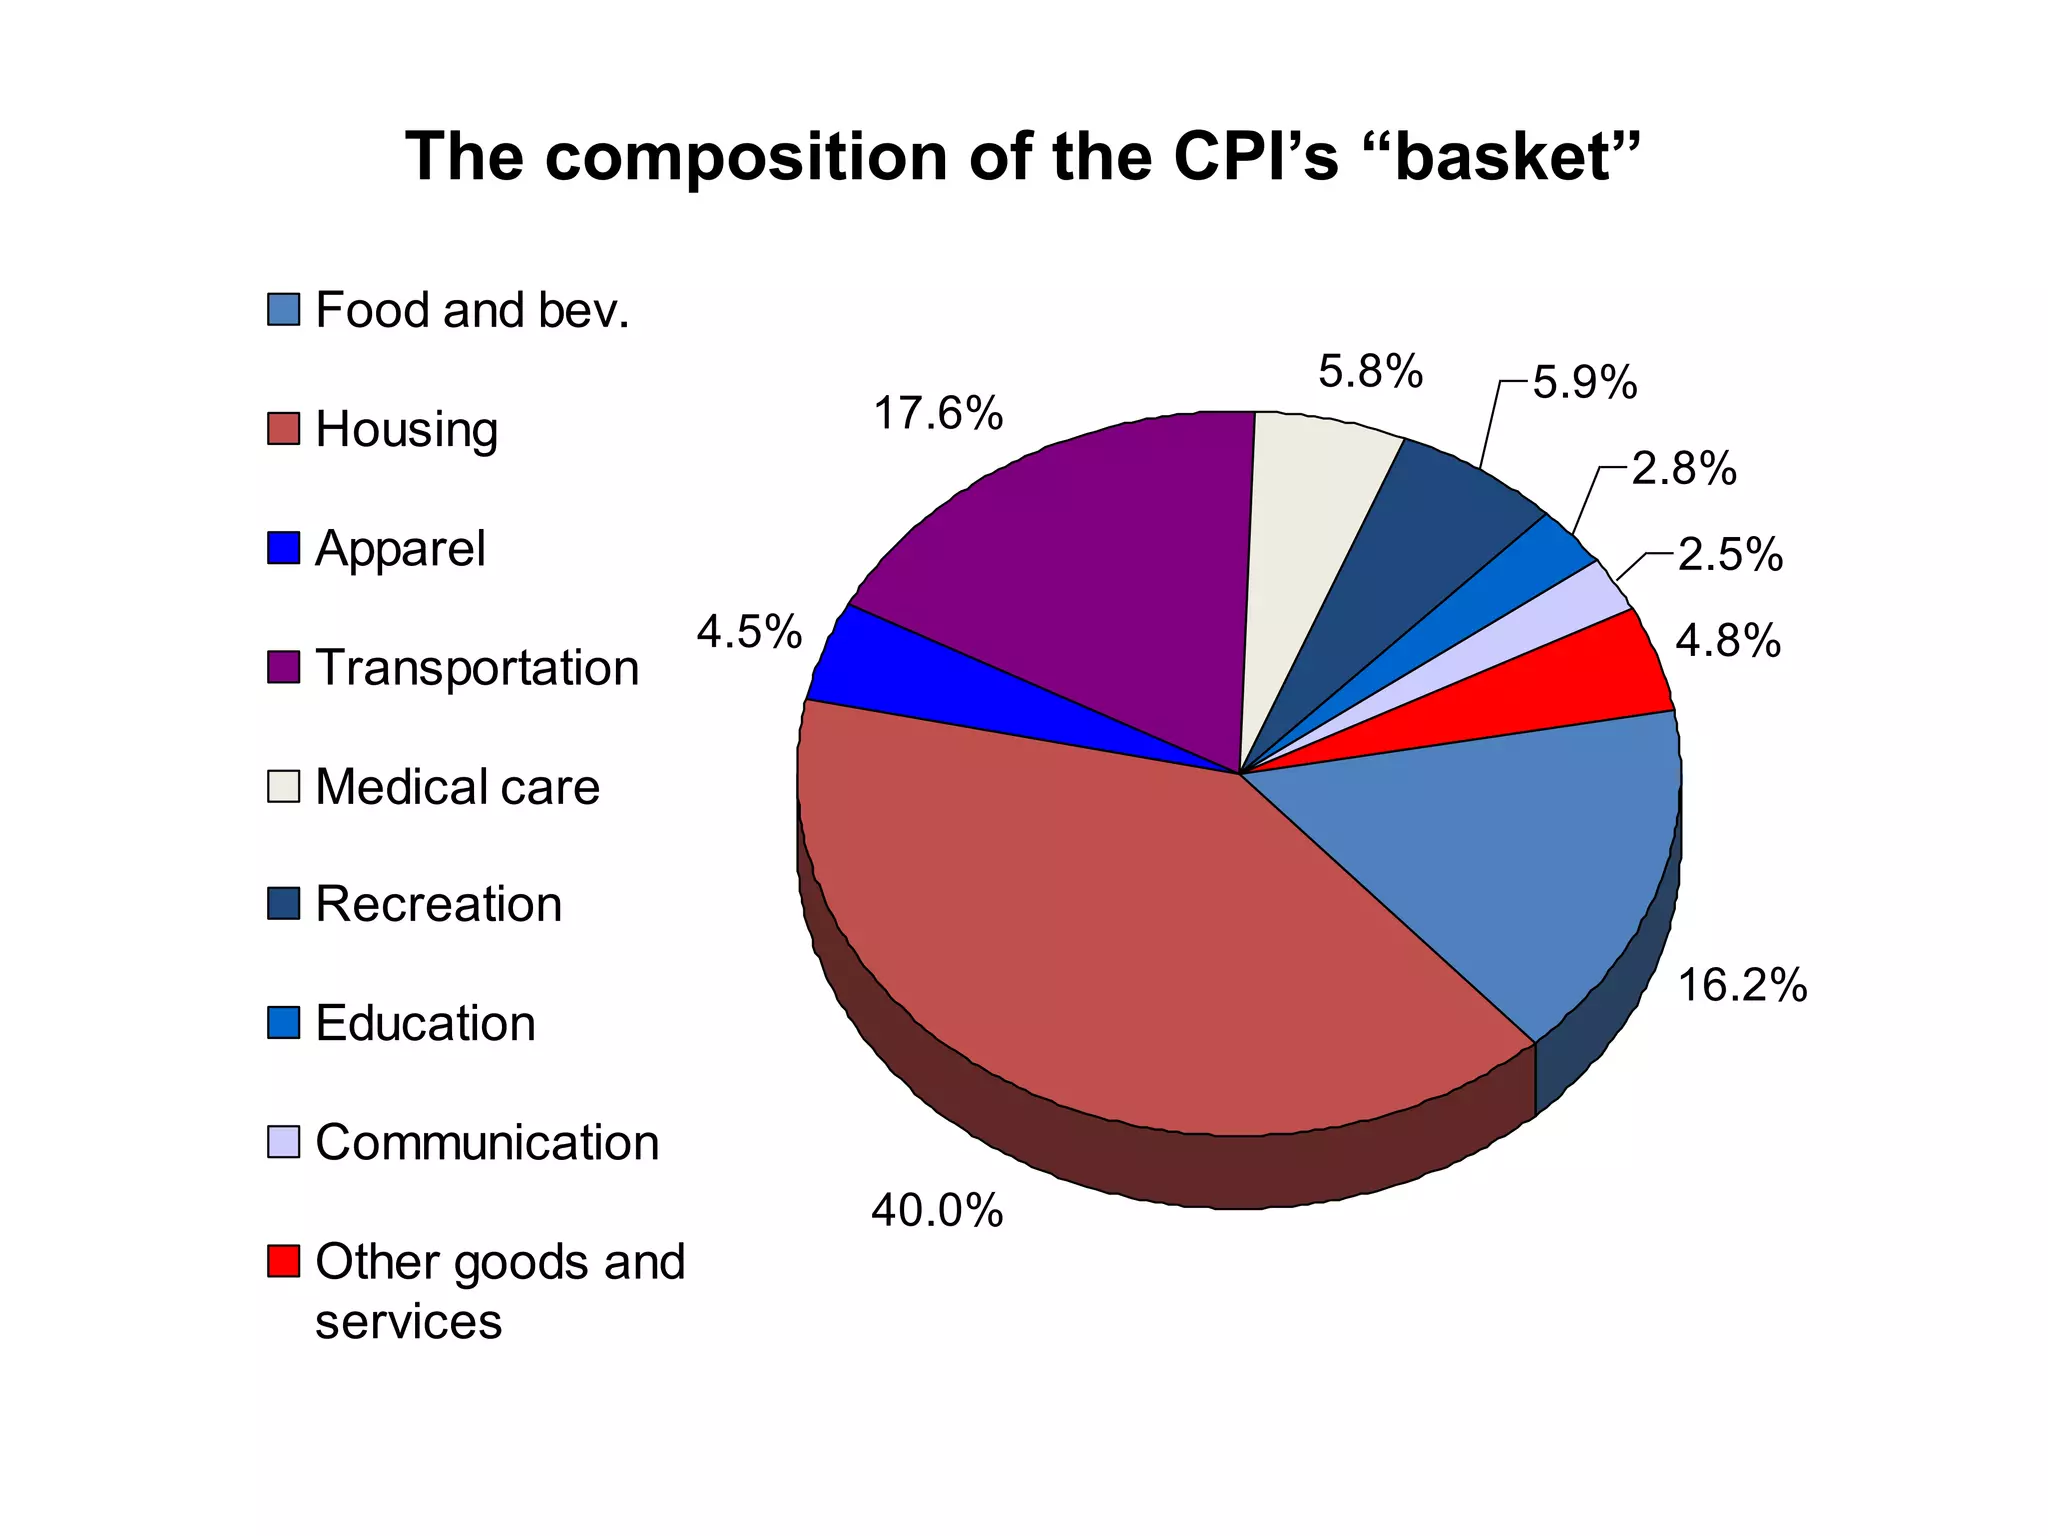
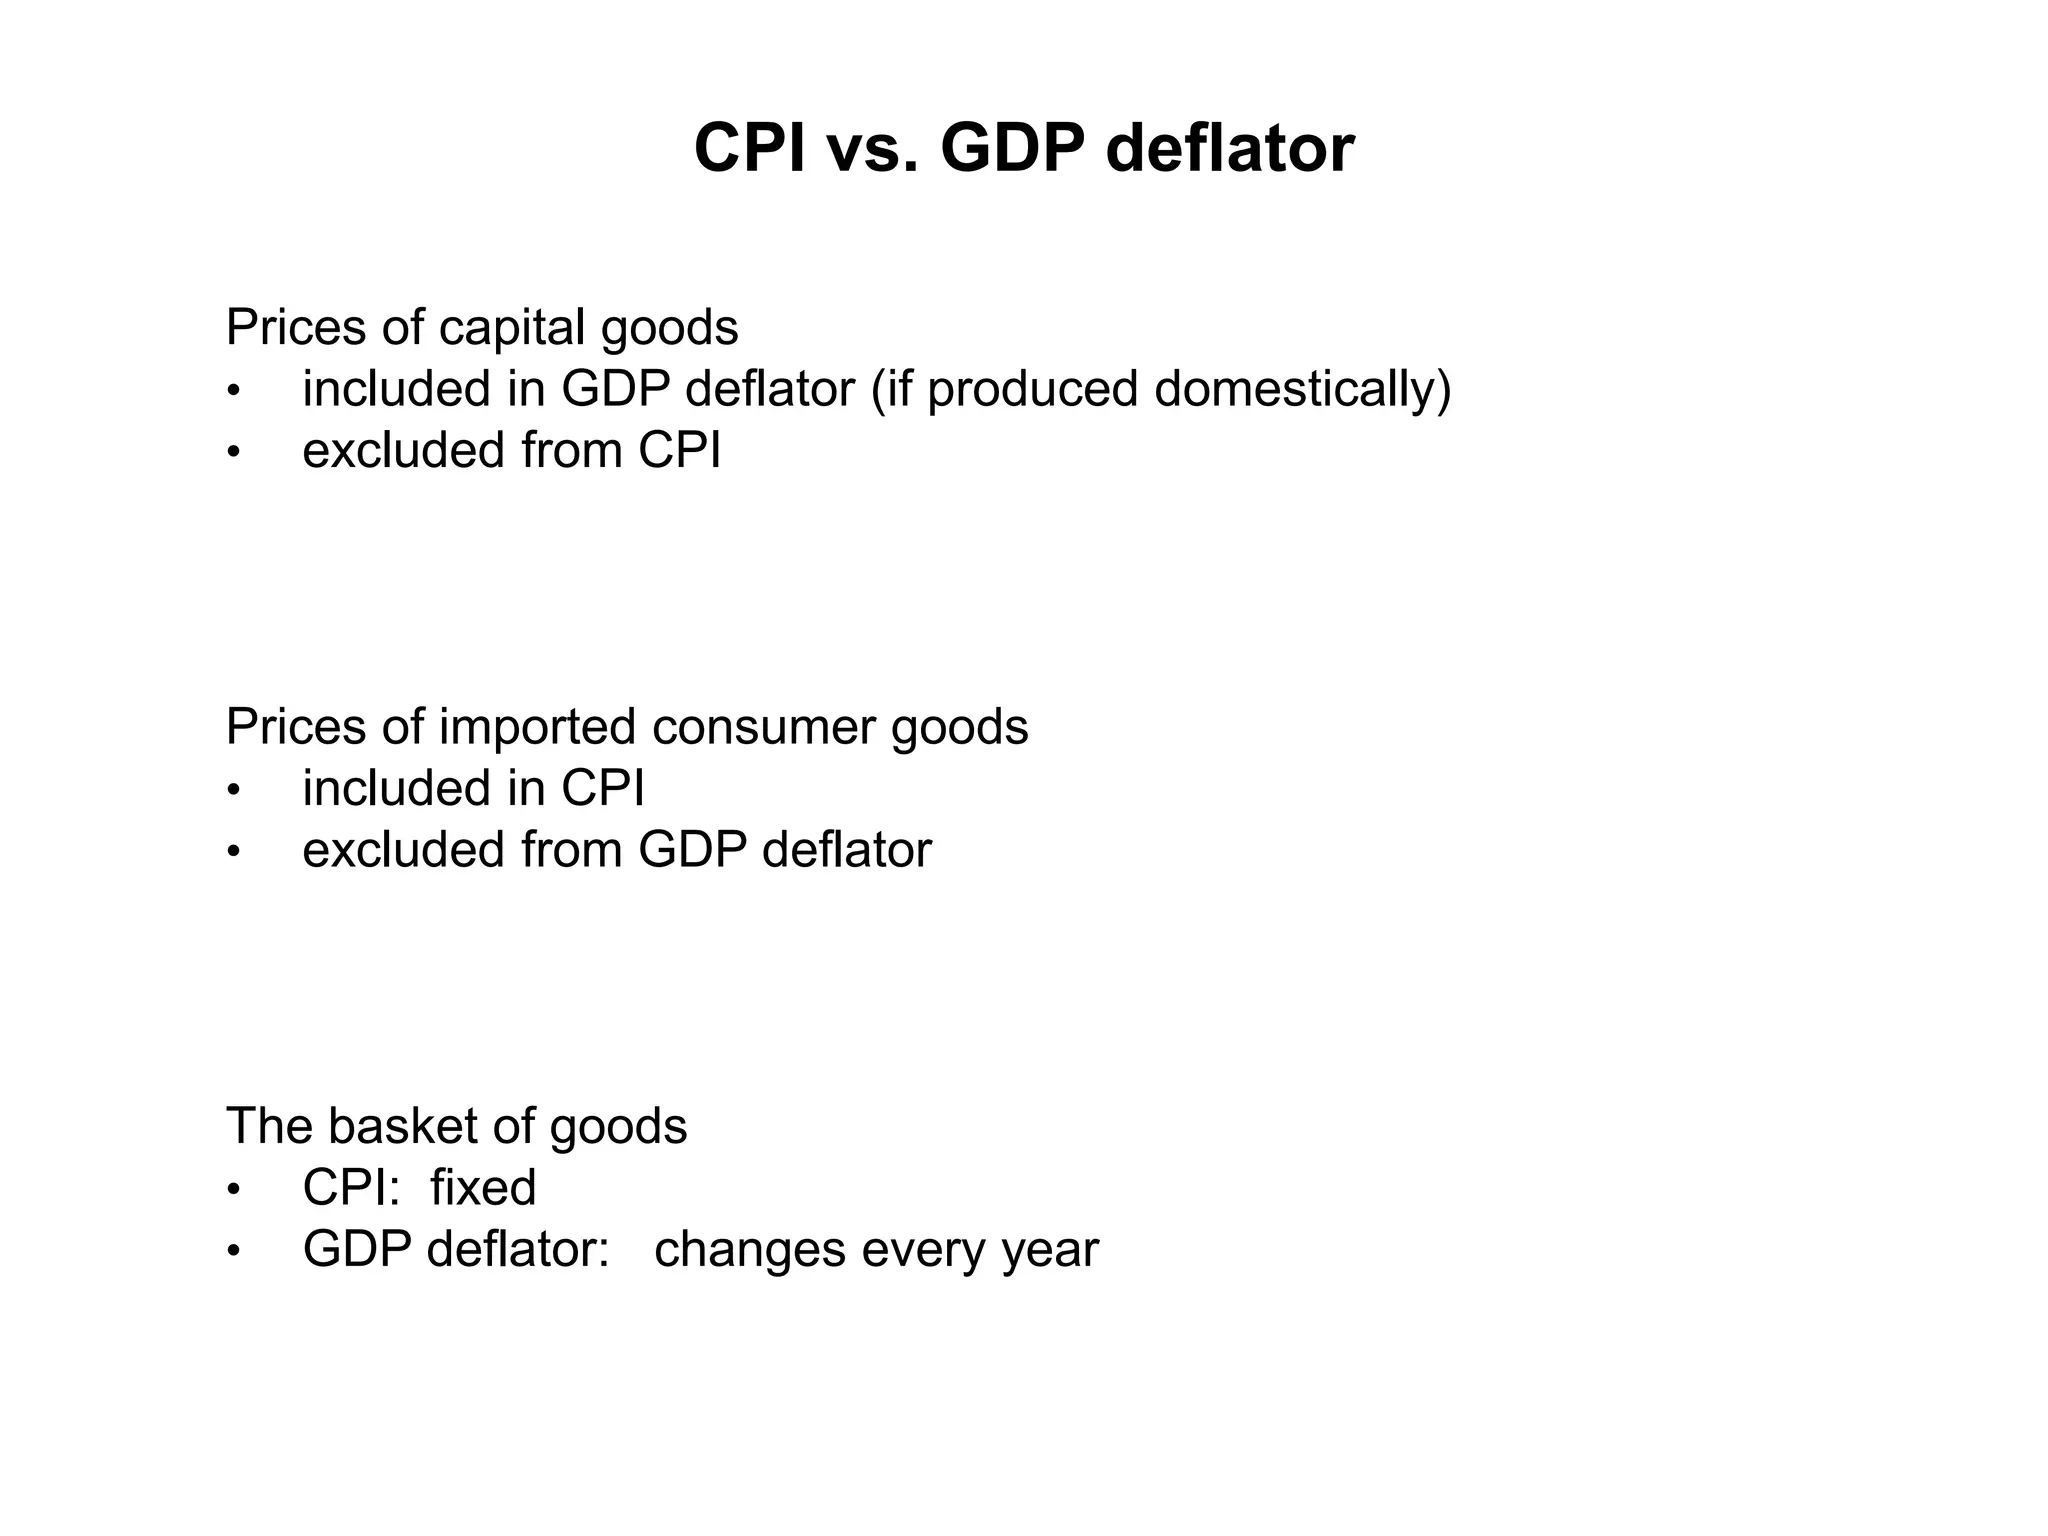
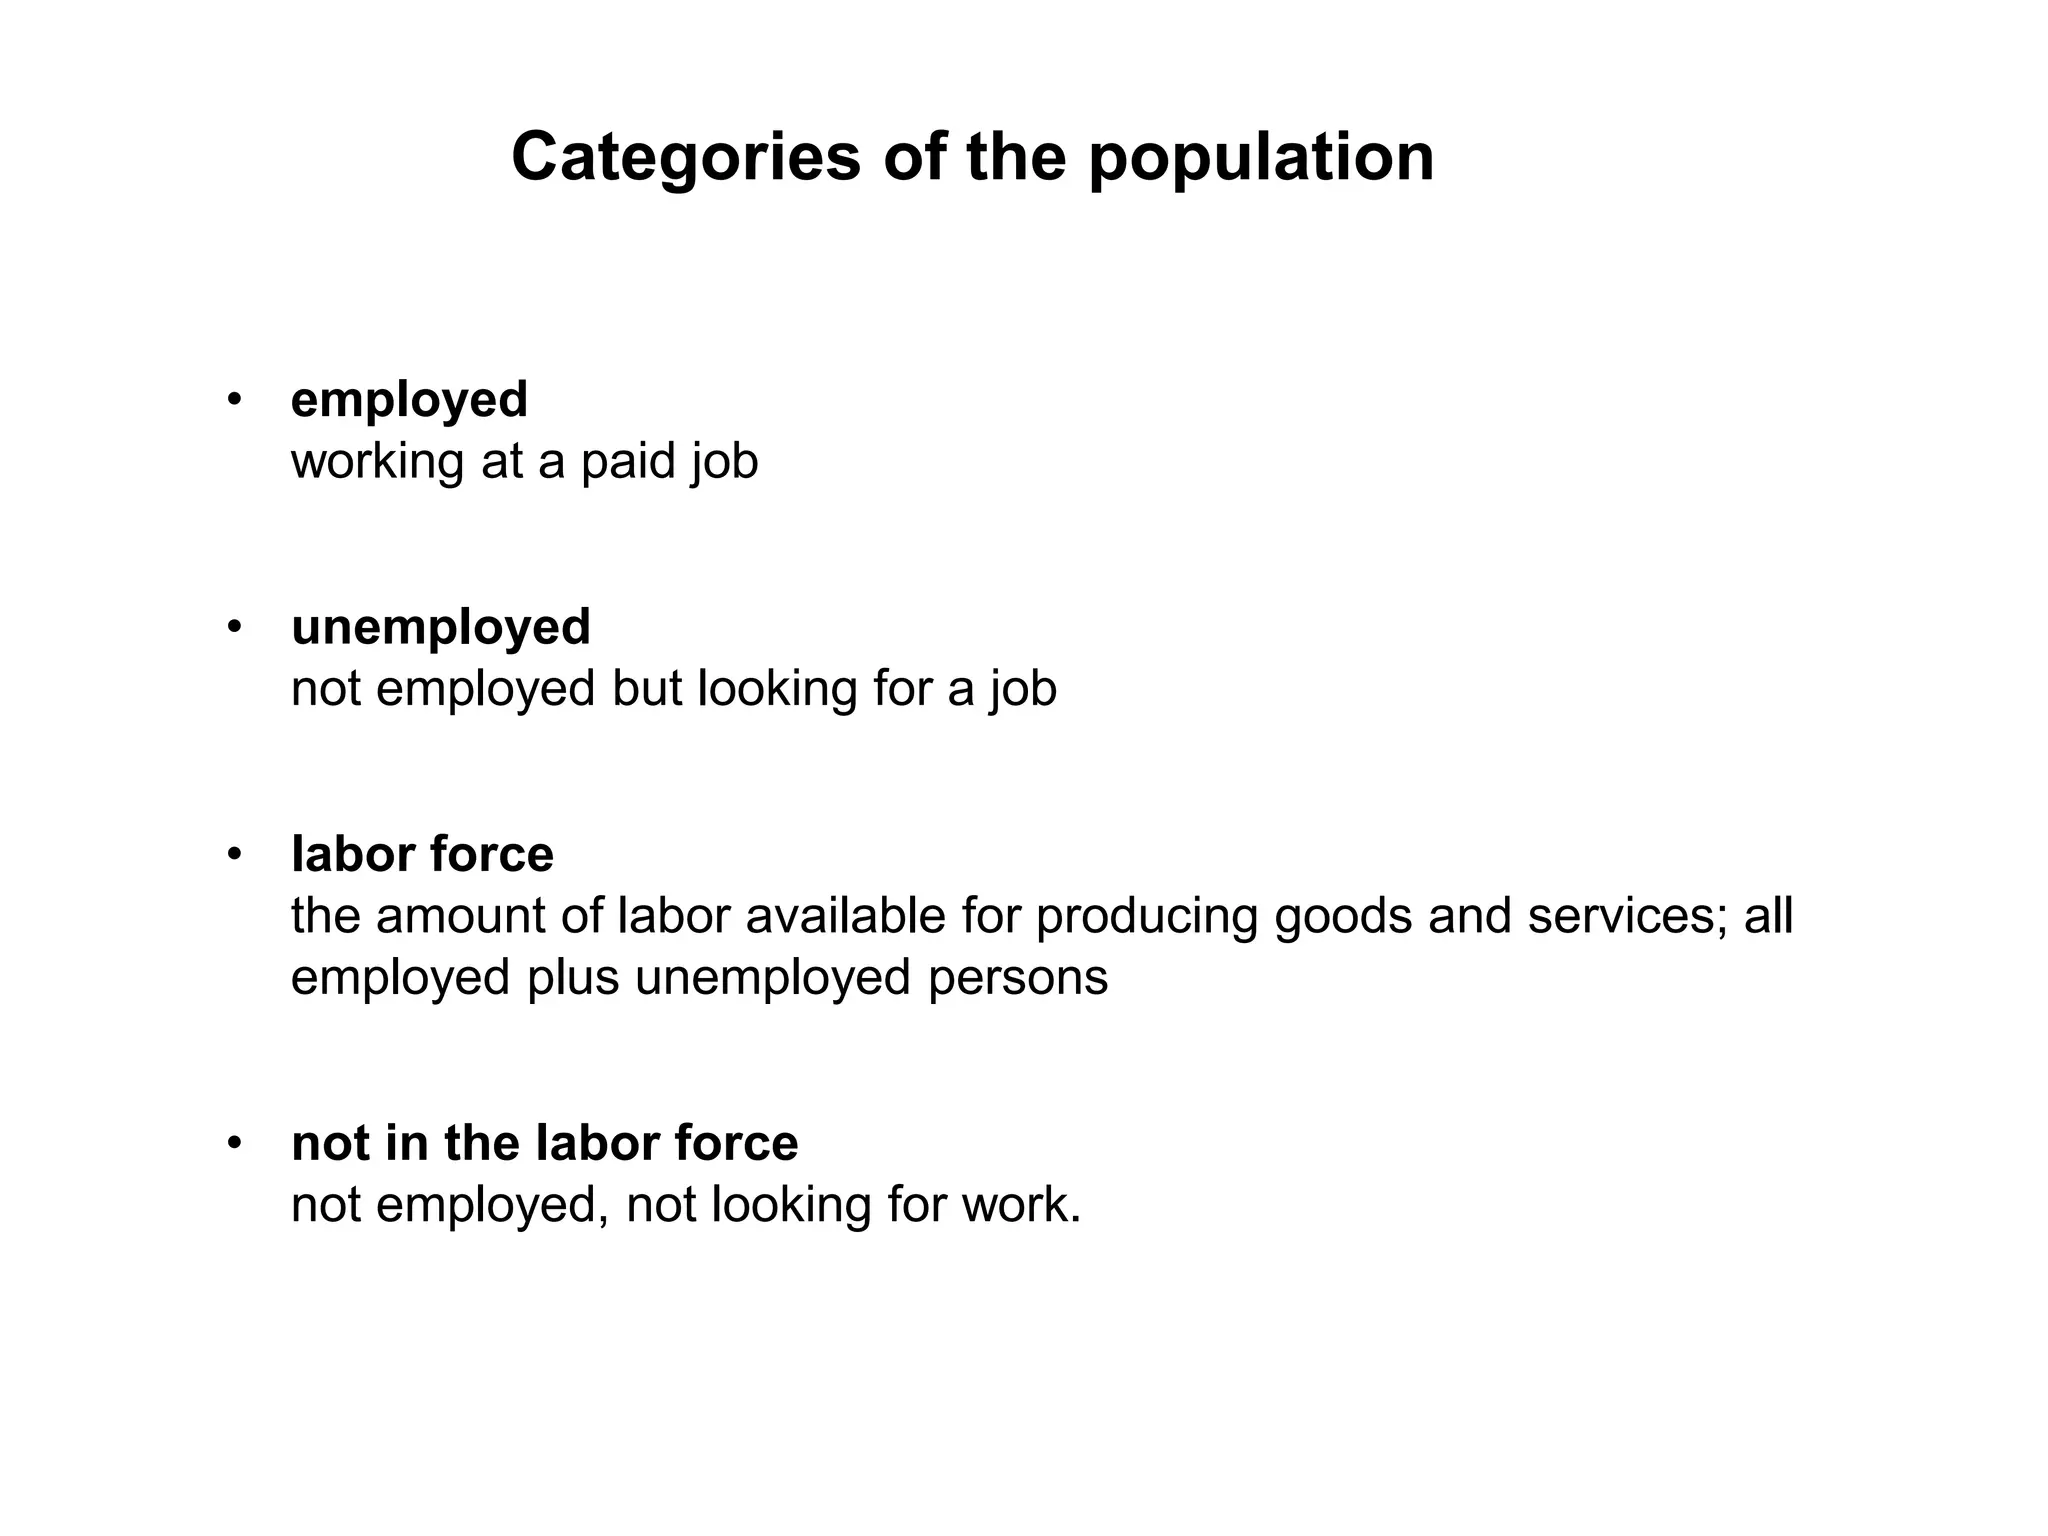
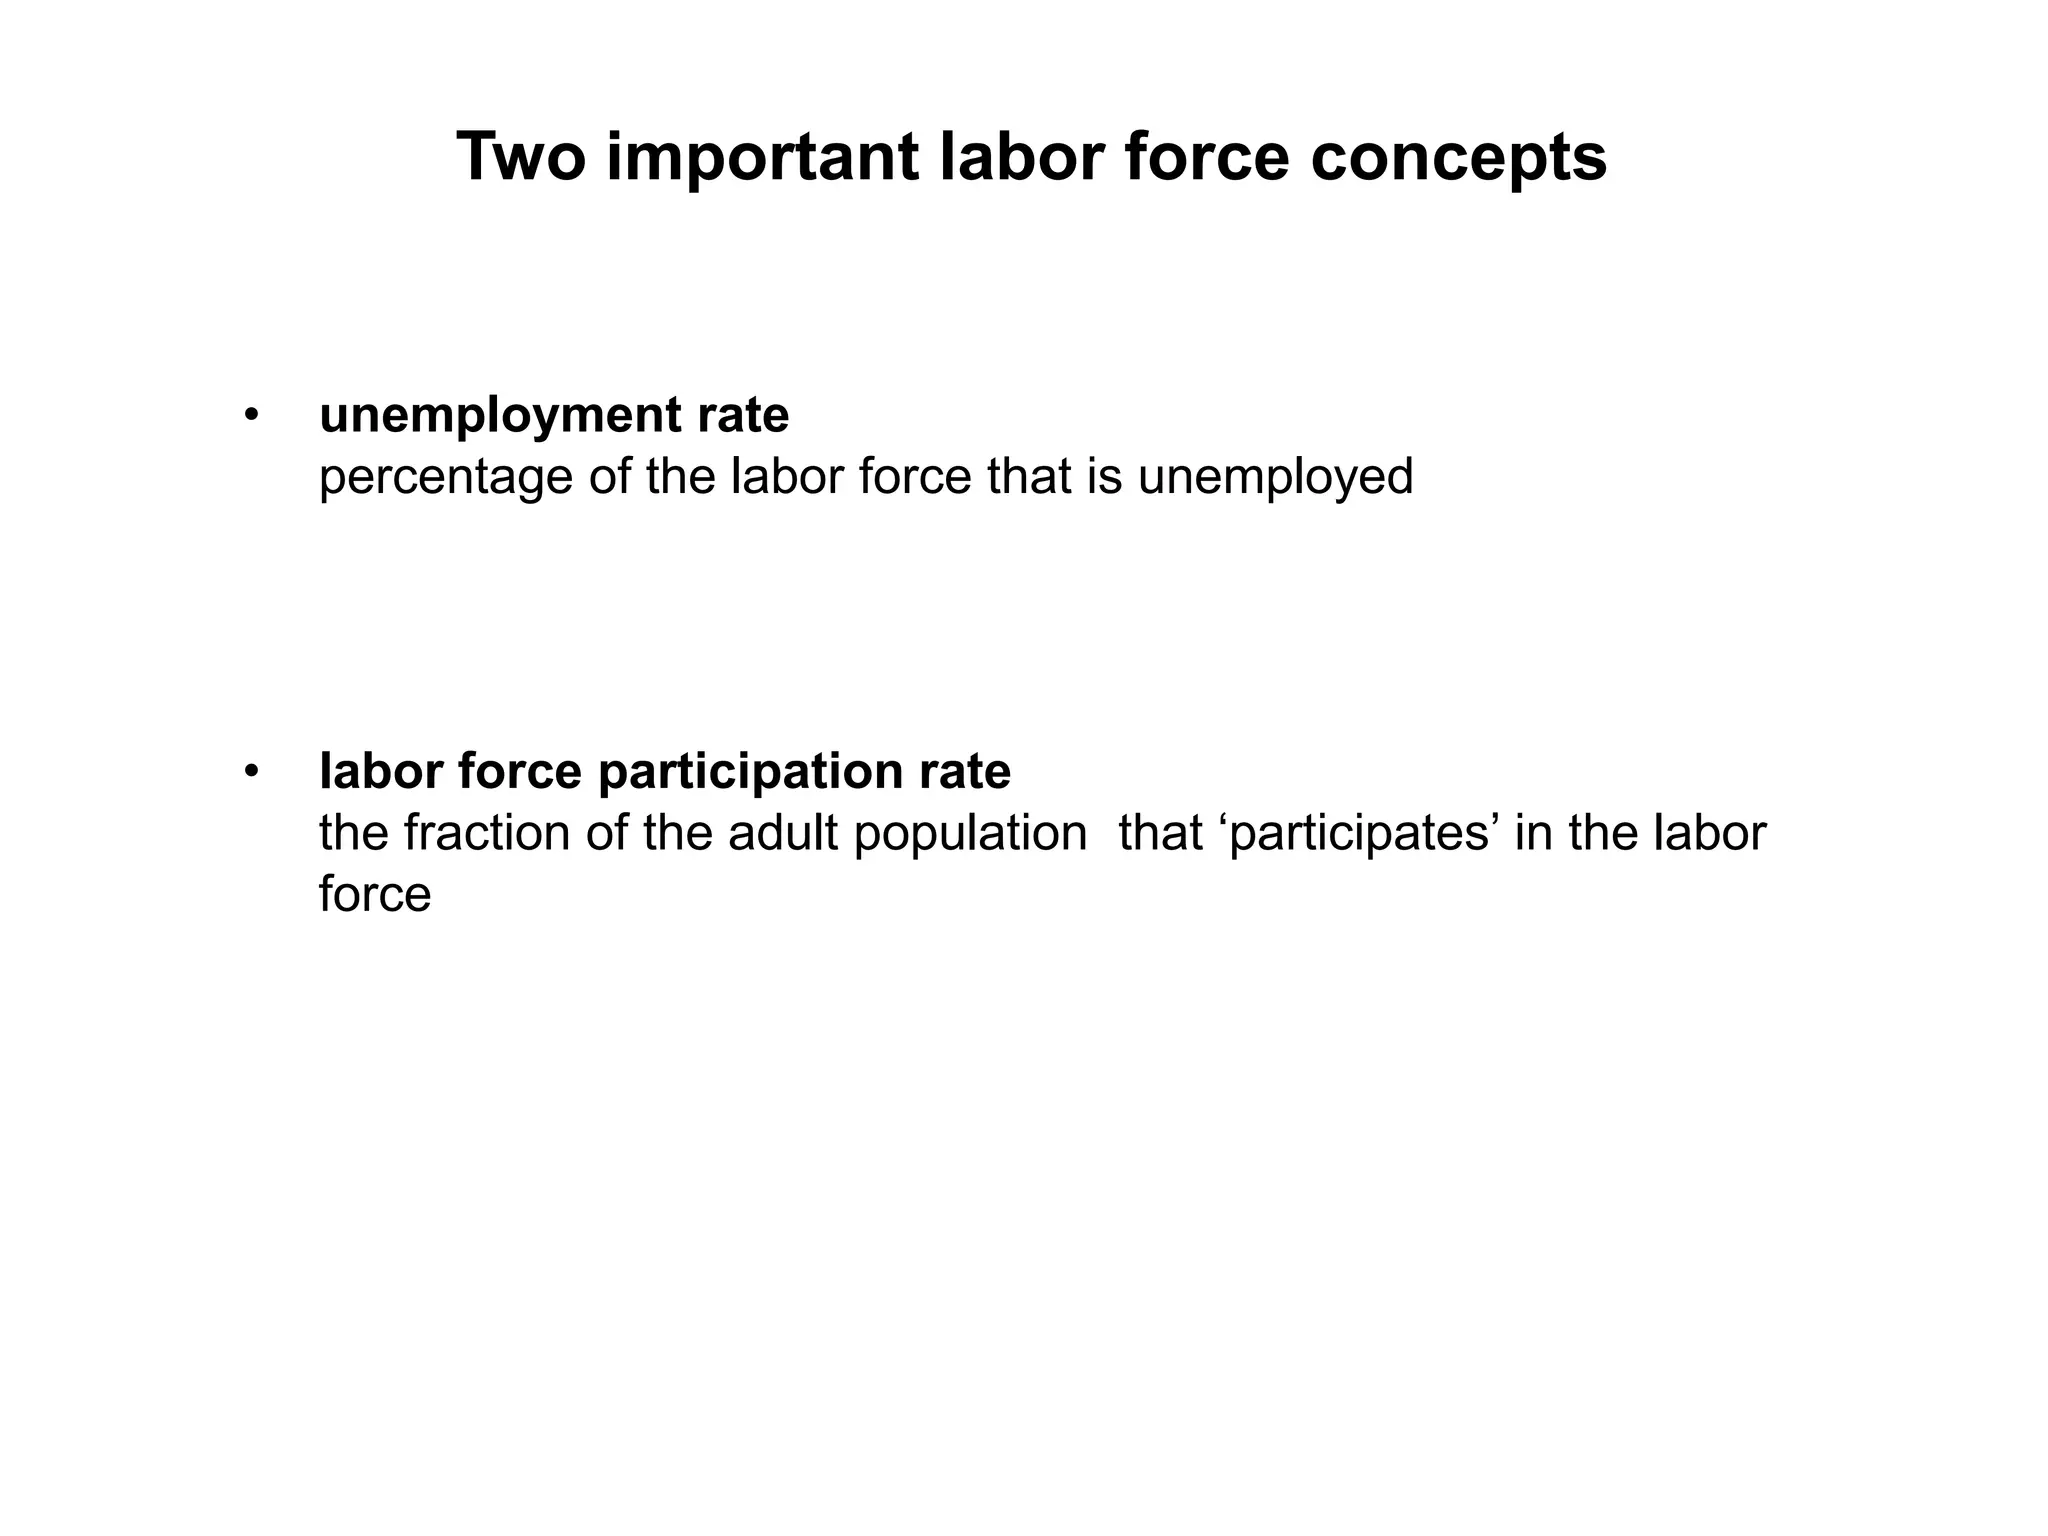
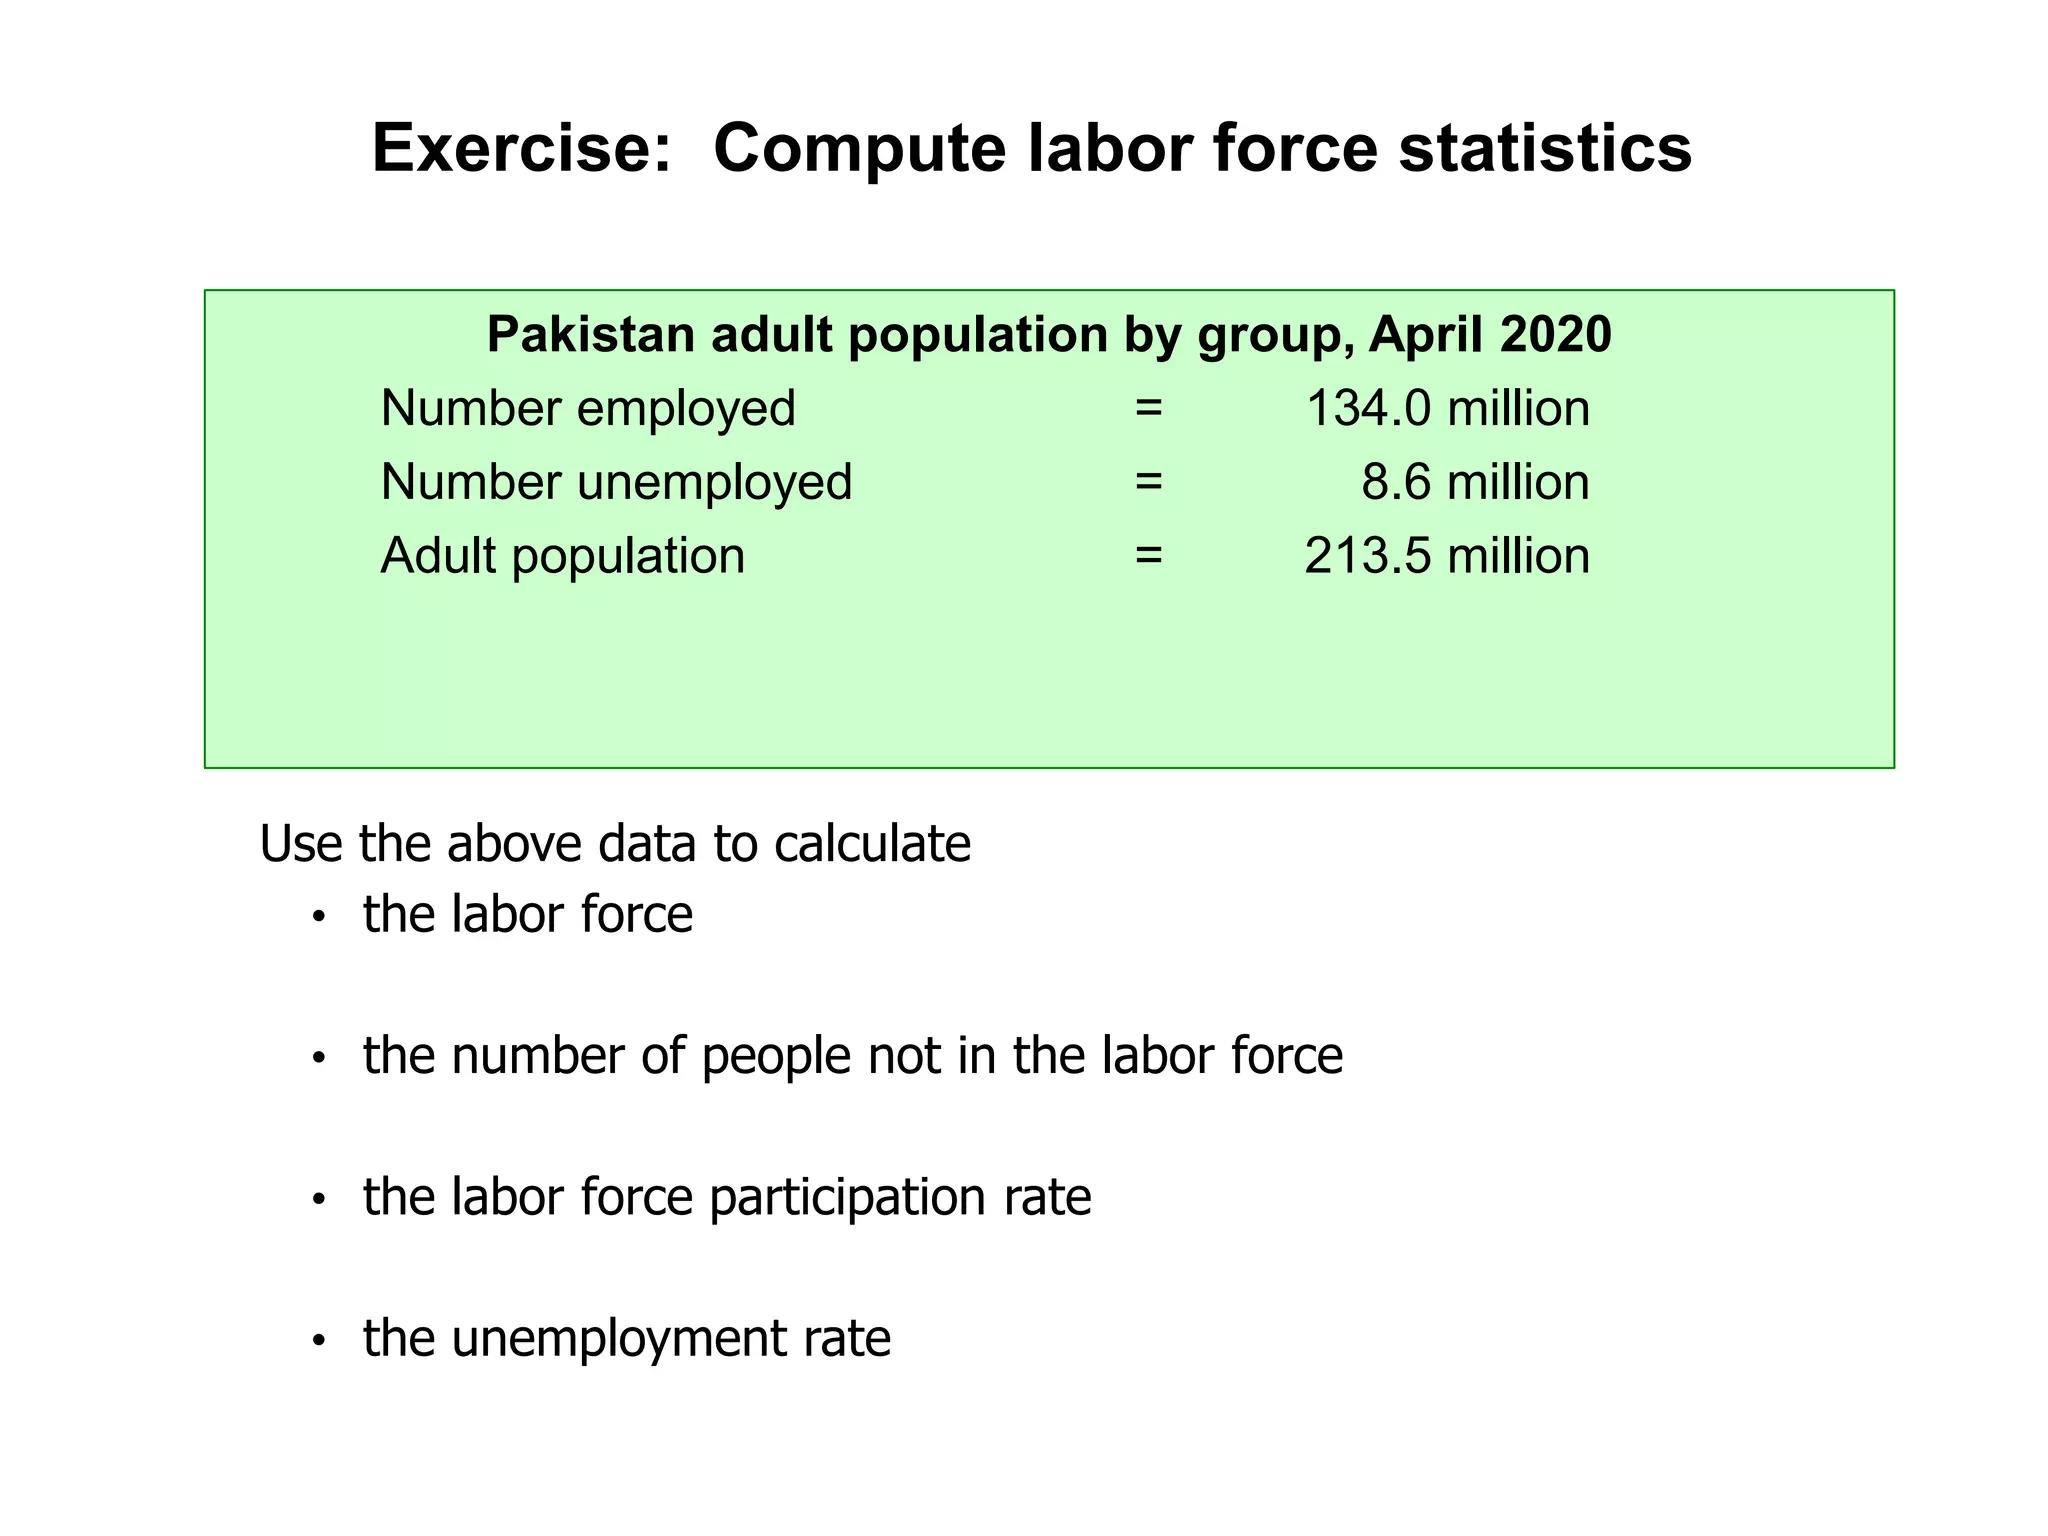
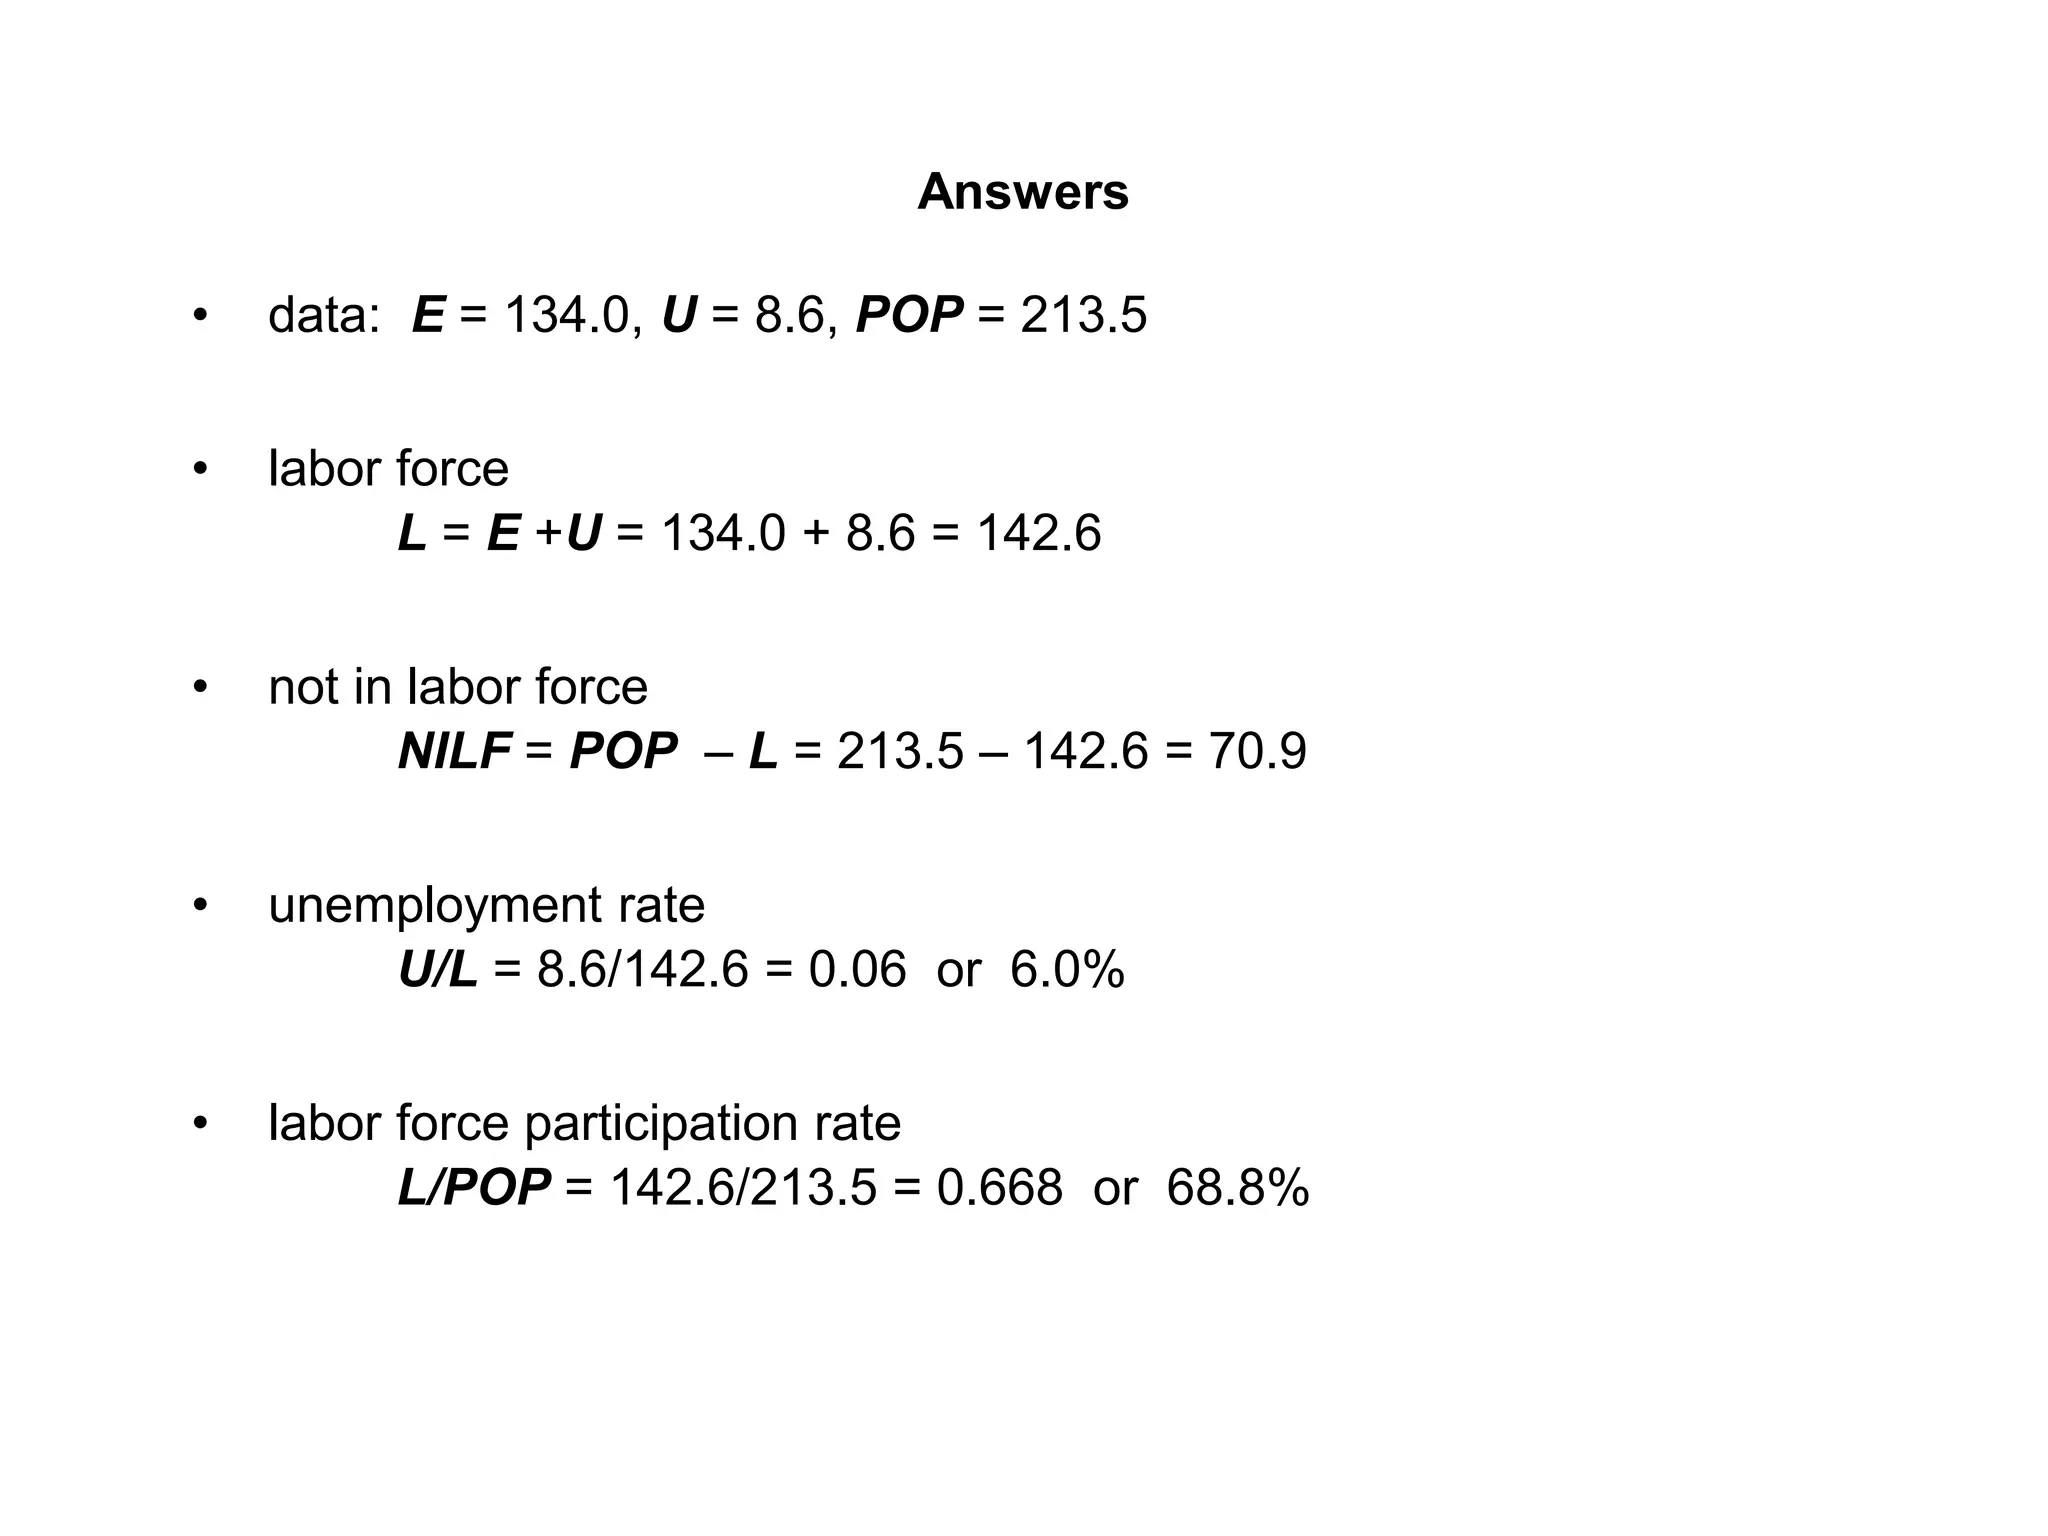
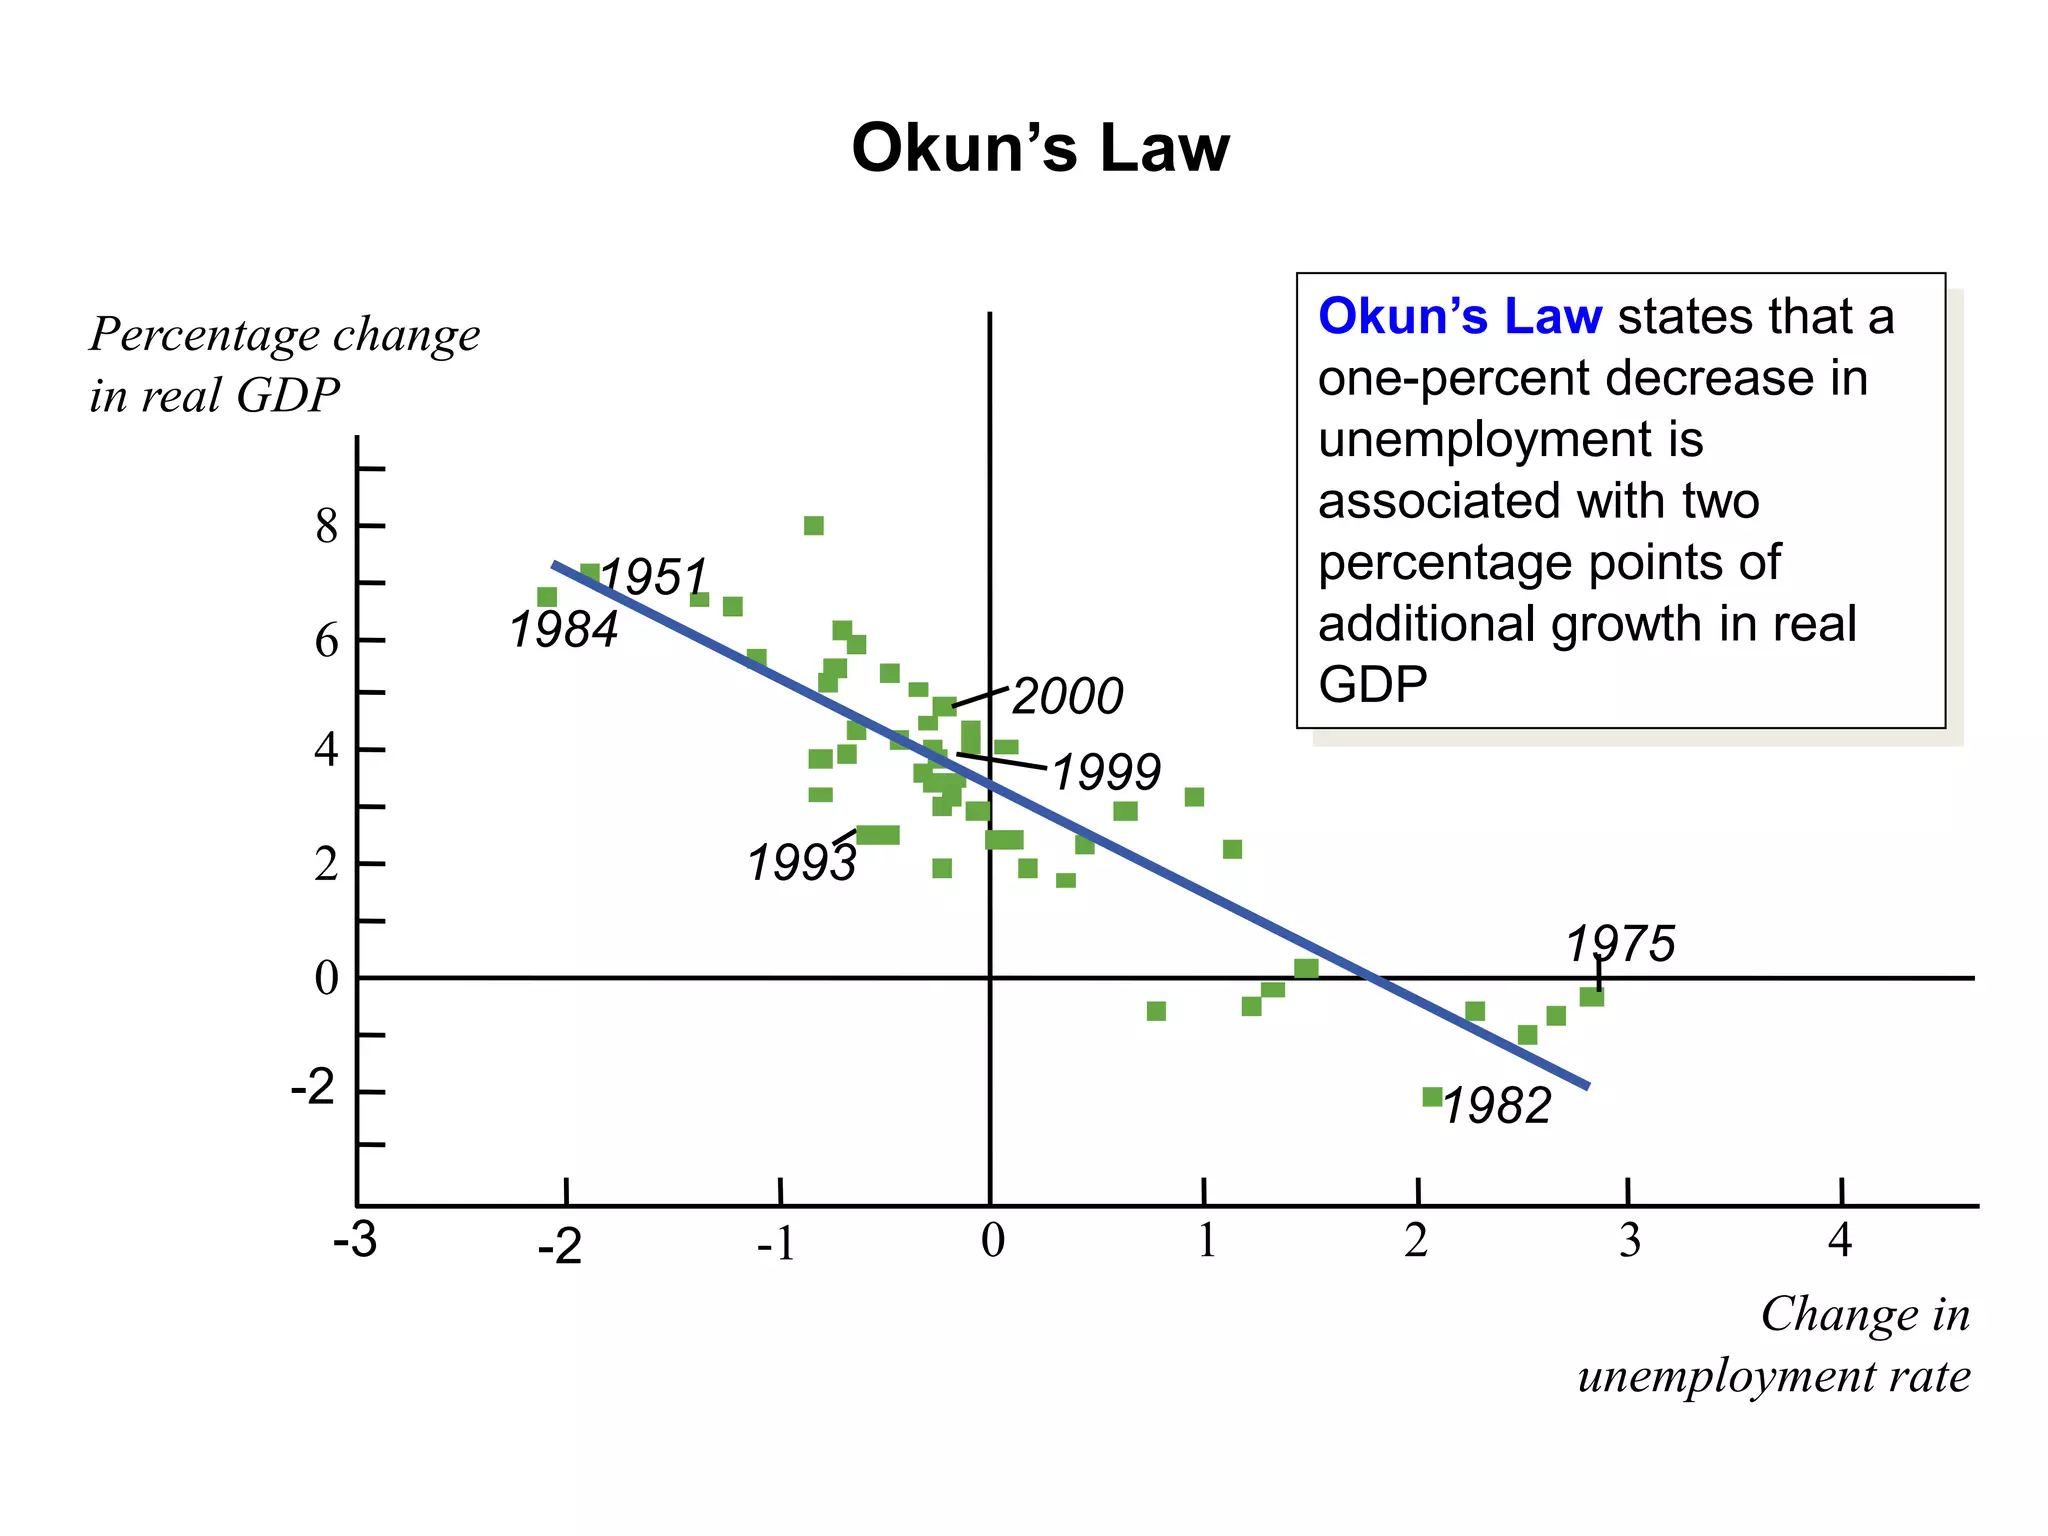
Review of the previous Lecture
1. Gross Domestic Product (GDP) measures both total income and
total expenditure on the economy’s output of goods & services.
2. Nominal GDP values output at current prices; real GDP values
output at constant prices. Changes in output affect both measures,
but changes in prices only affect nominal GDP.
3. GDP is the sum of consumption, investment, government
purchases, and net exports.
Learning objectives
• Shortcomings of GDP
• the Consumer Price Index (CPI)
• the Unemployment Rate
Shortcomings of GDP
Non market transactions
•Some productive activities don't take place in the market, and as the GDP
only measures the market value of output, these activities don't show up in
the GDP.
•Thus, GDP understates a nation's total output
•Example of such activities are labor of carpenters who repair own homes,
black markets
Leisure
•GDP only takes the market value of output, therefore, LEISURE (paid
vacation, holidays, leave time), which shows increase of well-being,
satisfaction, and 'psychic income' is excluded in the GDP.
Shortcomings of GDP
Improved product quality:
•GDP is a quantitative measure, and thus does not capture the value of
improvements in product quality
•Example. a $200 dollar phone costs the same as a $200 dollar phone 10
years ago technological improvements such as greater memory capacities,
viewing screens, and enhanced capabilities is not included in GDP
The Underground Economy ("black market"):
•Embedded in the economy is a flourishing and productive underground
sector include gamblers, smugglers, drug dealers, etc.
•However most participants engage in perfectly legal activities, but choose
illegally not to report their full incomes and therefore is not counted in the
GDP
Shortcomings of GDP
• Example: A woman who tutors a student in math is earning money
legally, but she doesn't report it to the government and therefore the
money involved in the transaction is not counted in GDP. On the other
hand, a factory employee, whose economic status is chartered, has an
income counted in GDP
• Value of underground transactions in a country is often very large.
GDP and the environment
• The growth of GDP is inevitably accompanied by "gross
domestic by-products" (i.e. dirty air, polluted water, toxic waste, congestion,
and noise)
• The social cost of the negative by-products reduce our economic well-
being.
.
Shortcomings of GDP
• Costs of environmental harm are not deducted from GDP
• Therefore GDP overstates national well-being in this aspect
• Negative and Positive Externalities are misrepresented or ignored.
Composition and Distribution of output
•GDP does not tell us what mix of goods and services benefit or harm society
because it assigns equal weight to products of the same price some goods/
services are enriching, or potentially detrimental to society
•Ex. As long as they are of the same price.. Assault Rifle = Book
Shortcomings of GDP
• GDP does not reveal anything about how output is distributed
(therefore, GDP does not tell us the well-being of a society
because distribution makes a big difference).
Per capita output
• Society better off if there is less gap between wealthy and
poor, but GDP does not represent this aspect of well-being.
• GDP itself does not reflect the well being of people in the
nation, it is the GDP per capita that is important.
• E.g. China's GDP in 2004 was $1938 billion and Denmark's
$220 billion, but Denmark's GDP per capita was $40,750 while
China's was $1500. The living standards in Denmark are
superior to those in China, since the average income for each
person in Denmark is much higher.
• An increase in GDP could actually be accompanied by a
decrease in GDP per capita, and vice versa, depending on
population growth.
Shortcomings of GDP
Non economic sources of well-being
• Just as a household's income does not measure its total
happiness, a nation's GDP does not measure its total well-
being.
• There are many things that could make a society better off
without necessarily raising GDP, e.g. crime reduction,
peaceful international relations, greater civility among the
people, less drug & alcohol abuse, etc.
• GDP merely reflects the trade going on in the country's
markets
Consumer Price Index (CPI)
• A measure of the overall level of prices
• Used to
– track changes in the typical household’s cost of living
– allow comparisons of dollar figures from different years
How to constructs the CPI
1. Survey consumers to determine composition of the typical consumer’s
“basket” of goods.
2. Every month, collect data on prices of all items in the basket; compute
cost of basket
3. CPI in any month equals
Cost of basket in that month
100
Cost of basket in base period

Exercise: Compute the CPI
The basket contains 20 pizzas and 10 pencils.
pizza Pen
2000 $10 $15
2001 $11 $15
2002 $12 $16
2003 $13 $15
For each year, compute
• the cost of the basket
• the CPI (use 2000 as the base
year)
• the inflation rate from the preceding
year
Answers
cost of inflation
basket CPI rate
2000 $350 100.0 n.a.
2001 370 105.7 5.7%
2002 400 114.3 8.1%
2003 410 117.1 2.5%
The composition of the CPI’s “basket”
16.2%
40.0%
4.5%
17.6%
5.8% 5.9%
2.8%
2.5%
4.8%
Food and bev.
Housing
Apparel
Transportation
Medical care
Recreation
Education
Communication
Other goods and
services
Types of CPIs
• Laspeyres index: a fixed basket of goods
• When prices of different goods are changing by different
amounts, a Laspeyres (fixed basket) index tends to overstate
the increase in the cost of living because it does not take into
account the fact that consumers have the opportunity to
substitute less expensive goods for more expensive one.
• Paasche index: a price index with a changing basket
• a Paasche (changing basket) index tends to understate the
increase in the cost of living. Although it accounts for the
substitution of alternative goods, it does not reflect the
reduction in consumers’ welfare that may result from such
substitutions.
CPI vs. GDP deflator
Prices of capital goods
• included in GDP deflator (if produced domestically)
• excluded from CPI
Prices of imported consumer goods
• included in CPI
• excluded from GDP deflator
The basket of goods
• CPI: fixed
• GDP deflator: changes every year
Categories of the population
• employed
working at a paid job
• unemployed
not employed but looking for a job
• labor force
the amount of labor available for producing goods and services; all
employed plus unemployed persons
• not in the labor force
not employed, not looking for work.
Two important labor force concepts
• unemployment rate
percentage of the labor force that is unemployed
• labor force participation rate
the fraction of the adult population that ‘participates’ in the labor
force
Exercise: Compute labor force statistics
Pakistan adult population by group, April 2020
Number employed = 134.0 million
Number unemployed = 8.6 million
Adult population = 213.5 million
Use the above data to calculate
• the labor force
• the number of people not in the labor force
• the labor force participation rate
• the unemployment rate
Answers
• data: E = 134.0, U = 8.6, POP = 213.5
• labor force
L = E +U = 134.0 + 8.6 = 142.6
• not in labor force
NILF = POP – L = 213.5 – 142.6 = 70.9
• unemployment rate
U/L = 8.6/142.6 = 0.06 or 6.0%
• labor force participation rate
L/POP = 142.6/213.5 = 0.668 or 68.8%
• Employed workers help produce GDP, while unemployed workers
do not.
• So one would expect a negative relationship between
unemployment and real GDP.
• This relationship is clear in the data…
Okun’s Law
Okun’s Law
1951
1984
1999
2000
1993
1982
1975
Change in
unemployment rate
10
-3 -2 -1 0 1 2 4
3
8
6
4
2
0
-2
Percentage change
in real GDP
Okun’s Law states that a
one-percent decrease in
unemployment is
associated with two
percentage points of
additional growth in real
GDP
Summary
• The overall level of prices can be measured by either
1. the Consumer Price Index (CPI), the price of a fixed basket of
goods purchased by the typical consumer
2. the GDP deflator, the ratio of nominal to real GDP
• The unemployment rate is the fraction of the labor force that is not
employed.
• When unemployment rises, the growth rate of real GDP falls.

Gdp shortcommings and cpi

  • 1.
    Review of theprevious Lecture 1. Gross Domestic Product (GDP) measures both total income and total expenditure on the economy’s output of goods & services. 2. Nominal GDP values output at current prices; real GDP values output at constant prices. Changes in output affect both measures, but changes in prices only affect nominal GDP. 3. GDP is the sum of consumption, investment, government purchases, and net exports.
  • 2.
    Learning objectives • Shortcomingsof GDP • the Consumer Price Index (CPI) • the Unemployment Rate
  • 3.
    Shortcomings of GDP Nonmarket transactions •Some productive activities don't take place in the market, and as the GDP only measures the market value of output, these activities don't show up in the GDP. •Thus, GDP understates a nation's total output •Example of such activities are labor of carpenters who repair own homes, black markets Leisure •GDP only takes the market value of output, therefore, LEISURE (paid vacation, holidays, leave time), which shows increase of well-being, satisfaction, and 'psychic income' is excluded in the GDP.
  • 4.
    Shortcomings of GDP Improvedproduct quality: •GDP is a quantitative measure, and thus does not capture the value of improvements in product quality •Example. a $200 dollar phone costs the same as a $200 dollar phone 10 years ago technological improvements such as greater memory capacities, viewing screens, and enhanced capabilities is not included in GDP The Underground Economy ("black market"): •Embedded in the economy is a flourishing and productive underground sector include gamblers, smugglers, drug dealers, etc. •However most participants engage in perfectly legal activities, but choose illegally not to report their full incomes and therefore is not counted in the GDP
  • 5.
    Shortcomings of GDP •Example: A woman who tutors a student in math is earning money legally, but she doesn't report it to the government and therefore the money involved in the transaction is not counted in GDP. On the other hand, a factory employee, whose economic status is chartered, has an income counted in GDP • Value of underground transactions in a country is often very large. GDP and the environment • The growth of GDP is inevitably accompanied by "gross domestic by-products" (i.e. dirty air, polluted water, toxic waste, congestion, and noise) • The social cost of the negative by-products reduce our economic well- being. .
  • 6.
    Shortcomings of GDP •Costs of environmental harm are not deducted from GDP • Therefore GDP overstates national well-being in this aspect • Negative and Positive Externalities are misrepresented or ignored. Composition and Distribution of output •GDP does not tell us what mix of goods and services benefit or harm society because it assigns equal weight to products of the same price some goods/ services are enriching, or potentially detrimental to society •Ex. As long as they are of the same price.. Assault Rifle = Book
  • 7.
    Shortcomings of GDP •GDP does not reveal anything about how output is distributed (therefore, GDP does not tell us the well-being of a society because distribution makes a big difference). Per capita output • Society better off if there is less gap between wealthy and poor, but GDP does not represent this aspect of well-being. • GDP itself does not reflect the well being of people in the nation, it is the GDP per capita that is important. • E.g. China's GDP in 2004 was $1938 billion and Denmark's $220 billion, but Denmark's GDP per capita was $40,750 while China's was $1500. The living standards in Denmark are superior to those in China, since the average income for each person in Denmark is much higher. • An increase in GDP could actually be accompanied by a decrease in GDP per capita, and vice versa, depending on population growth.
  • 8.
    Shortcomings of GDP Noneconomic sources of well-being • Just as a household's income does not measure its total happiness, a nation's GDP does not measure its total well- being. • There are many things that could make a society better off without necessarily raising GDP, e.g. crime reduction, peaceful international relations, greater civility among the people, less drug & alcohol abuse, etc. • GDP merely reflects the trade going on in the country's markets
  • 9.
    Consumer Price Index(CPI) • A measure of the overall level of prices • Used to – track changes in the typical household’s cost of living – allow comparisons of dollar figures from different years
  • 10.
    How to constructsthe CPI 1. Survey consumers to determine composition of the typical consumer’s “basket” of goods. 2. Every month, collect data on prices of all items in the basket; compute cost of basket 3. CPI in any month equals Cost of basket in that month 100 Cost of basket in base period 
  • 11.
    Exercise: Compute theCPI The basket contains 20 pizzas and 10 pencils. pizza Pen 2000 $10 $15 2001 $11 $15 2002 $12 $16 2003 $13 $15 For each year, compute • the cost of the basket • the CPI (use 2000 as the base year) • the inflation rate from the preceding year
  • 12.
    Answers cost of inflation basketCPI rate 2000 $350 100.0 n.a. 2001 370 105.7 5.7% 2002 400 114.3 8.1% 2003 410 117.1 2.5%
  • 13.
    The composition ofthe CPI’s “basket” 16.2% 40.0% 4.5% 17.6% 5.8% 5.9% 2.8% 2.5% 4.8% Food and bev. Housing Apparel Transportation Medical care Recreation Education Communication Other goods and services
  • 14.
    Types of CPIs •Laspeyres index: a fixed basket of goods • When prices of different goods are changing by different amounts, a Laspeyres (fixed basket) index tends to overstate the increase in the cost of living because it does not take into account the fact that consumers have the opportunity to substitute less expensive goods for more expensive one. • Paasche index: a price index with a changing basket • a Paasche (changing basket) index tends to understate the increase in the cost of living. Although it accounts for the substitution of alternative goods, it does not reflect the reduction in consumers’ welfare that may result from such substitutions.
  • 15.
    CPI vs. GDPdeflator Prices of capital goods • included in GDP deflator (if produced domestically) • excluded from CPI Prices of imported consumer goods • included in CPI • excluded from GDP deflator The basket of goods • CPI: fixed • GDP deflator: changes every year
  • 16.
    Categories of thepopulation • employed working at a paid job • unemployed not employed but looking for a job • labor force the amount of labor available for producing goods and services; all employed plus unemployed persons • not in the labor force not employed, not looking for work.
  • 17.
    Two important laborforce concepts • unemployment rate percentage of the labor force that is unemployed • labor force participation rate the fraction of the adult population that ‘participates’ in the labor force
  • 18.
    Exercise: Compute laborforce statistics Pakistan adult population by group, April 2020 Number employed = 134.0 million Number unemployed = 8.6 million Adult population = 213.5 million Use the above data to calculate • the labor force • the number of people not in the labor force • the labor force participation rate • the unemployment rate
  • 19.
    Answers • data: E= 134.0, U = 8.6, POP = 213.5 • labor force L = E +U = 134.0 + 8.6 = 142.6 • not in labor force NILF = POP – L = 213.5 – 142.6 = 70.9 • unemployment rate U/L = 8.6/142.6 = 0.06 or 6.0% • labor force participation rate L/POP = 142.6/213.5 = 0.668 or 68.8%
  • 20.
    • Employed workershelp produce GDP, while unemployed workers do not. • So one would expect a negative relationship between unemployment and real GDP. • This relationship is clear in the data… Okun’s Law
  • 21.
    Okun’s Law 1951 1984 1999 2000 1993 1982 1975 Change in unemploymentrate 10 -3 -2 -1 0 1 2 4 3 8 6 4 2 0 -2 Percentage change in real GDP Okun’s Law states that a one-percent decrease in unemployment is associated with two percentage points of additional growth in real GDP
  • 22.
    Summary • The overalllevel of prices can be measured by either 1. the Consumer Price Index (CPI), the price of a fixed basket of goods purchased by the typical consumer 2. the GDP deflator, the ratio of nominal to real GDP • The unemployment rate is the fraction of the labor force that is not employed. • When unemployment rises, the growth rate of real GDP falls.