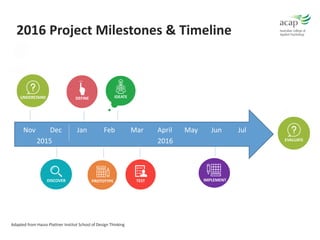
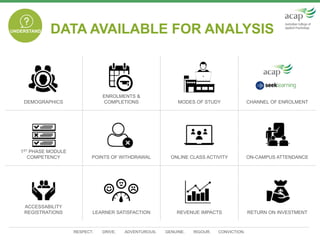
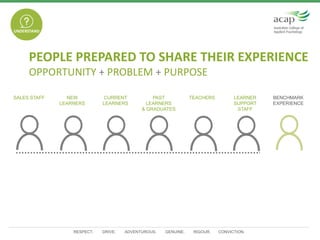
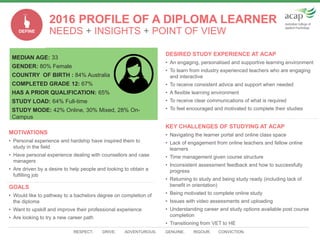
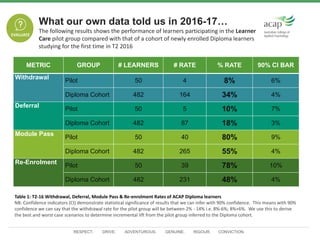
RESPECT. DRIVE. ADVENTUROUS. GENUINE. RIGOUR. CONVICTION.
The Truth About Data…
Discovering What Learners Really Want
Veronica Keating, Director of Quality, Compliance, Risk and Regulation
Kristen Clarke, Head of Curriculum and Operations (VET)
The Australian College of Applied Psychology
RESPECT. DRIVE. ADVENTUROUS. GENUINE. RIGOUR. CONVICTION.
LEARNER SUCCESS…
Ogres are like onions…
RESPECT. DRIVE. ADVENTUROUS. GENUINE. RIGOUR. CONVICTION.
LEARNER SUCCESS…
Today we will “peel the
onion” and reveal what we
have learned about
Learner Success:
• What our learner
data revealed and
what it didn’t reveal
• What learner
success initiatives
worked and what
didn’t work
• What we intend to do
about learner success
in the future
The Australian College of Applied
Psychology (ACAP) operates in a
niche, dual sector market providing
education and training within the caring
professions.
We are committed to delivering a high
quality learning experience.
We want know that we are meeting our
commitments and delivering real value
through:
• Positive, life-long learning
experiences
• Successful outcomes and meaningful
careers
• Successful industry partnerships
RESPECT. DRIVE. ADVENTUROUS. GENUINE. RIGOUR. CONVICTION.
LEARNER SUCCESS…
Key internal measures:
• Module pass rate
• Withdrawal rate
• Deferral rate
• Re-enrolment rate
Correlated against:
• Learner satisfaction
• Industry feedback
• Employment & further
study outcomes
Data analysis drives our
continuous improvement cycle
We are able to access
increasingly sophisticated data
sources that tell us almost
everything we need to know
about our learners
– Their demographic profile
– How they learn and where
in a course they are most
likely to succeed and fail
– Their prospects for
positive employment
and/or career outcomes
RESPECT. DRIVE. ADVENTUROUS. GENUINE. RIGOUR. CONVICTION.
LEARNER SUCCESS…
We thought we
understood our learners
• AVETMISS data told us
about their demographic
profile
• Analysis of sales and
marketing data told us
about their motivation to
enrol in our courses
• Analysis of data in our LMS
and SMS told us about
their progression and
success
DIPLOMA LEARNER
PROFILE
• MEDIAN AGE: 33
• GENDER: 80% Female
• COUNTRY OF BIRTH : 84% Australia
• COMPLETED GRADE 12: 67%
• HAS A PRIOR QUALIFICATION: 65%
• STUDY LOAD: 64% Full-time
• STUDY MODE: 42% Online, 30%
Mixed, 28% On-Campus
Great Teachers Great Learner Support Work integrated learning
RESPECT. DRIVE. ADVENTUROUS. GENUINE. RIGOUR. CONVICTION.
LEARNER SUCCESS… A CONVENTIONAL WISDOM
• Qualified teacher-practitioners
• Ongoing Professional Development
• Small class sizes
• High quality learning resources
Great Teachers
• Learning Support (academic)
• Access support (disability)
• Personal Support (counselling)
Great Learner
Support
• Great relationships with employers
• Relevant work experience for learners
• Monitoring and support throughout placement
• Work integrated assessment activities
Work Integrated
Learning
RESPECT. DRIVE. ADVENTUROUS. GENUINE. RIGOUR. CONVICTION.
WHAT OUR OWN DATA TOLD US IN 2014
The data told us that:
• Learner success measures had
plateaued and/or declined slightly.
• Still high levels of satisfaction with the
quality of our teachers, our delivery
methods and our teaching resources
• Very high levels of satisfaction and
very positive outcomes for users of
Learner Support services – including
learning / academic support, disability
support and personal support
Our analysis suggested that:
• Online learners were lagging behind
f2f learners; and
• The placement experience could be
improved
Great Teachers Great Learner Support Work integrated learning
Sources of data:
• Completion rates,
withdrawal and deferral
rates, re-enrolment
(retention) rates
• Internal Unit & Teacher
Evaluations (UTEs)
• Annual Learner
Feedback survey
RESPECT. DRIVE. ADVENTUROUS. GENUINE. RIGOUR. CONVICTION.
WHAT THE NATIONAL DATA TOLD US
IN 2014…
We used NCVER data and research papers from across the
sector to inform our 2015 improvement activities
NCVER Snapshot of publically funded VET
activity for 2013 (published in Dec 2014):
• 1.88 million learners were enrolled in VET courses
in 2013
• 63.4% of learners enrolled in TAFE – the public
sector continued to be our main competitor in our
target sector – Community Services
VocStats provided benchmark data for
specific programs
NCVER research papers published in 2013-
14, eg:
• The needs of a workforce facing the next wave of
technological change (CEDA)
• A proposed taxonomy for provider level
performance indicators (T. Karmel et al)
• Learner pathways from VET to HE (A Mills et al)
RESPECT. DRIVE. ADVENTUROUS. GENUINE. RIGOUR. CONVICTION.
2015 IMPROVEMENT ACTIONS…
• Restructured the
curriculum delivery
to facilitate early
success in “Phase
1” modules
• PD workshops for
online teaching
staff from our
Learning &
Teaching
Technology unit
• Updated our work
placement
program to put it
at the heart of the
learning
experience.
• Implemented
compulsory
attendance at f2f
workshops for
online learners
• Revamped learner
support services for
online learners
• Developed a range
of video-content for
easy online access
• Scheduled
academic coaching
clinics to support
particular programs
of study
We also administered a telephone exit survey to ask unsuccessful learners why they had
withdrawn or failed their course – it seemed to confirm what we thought we already knew…
“family crisis”, “work commitments” and/or “health issues”.
Great Teachers Great Learner Support Work integrated learning
RESPECT. DRIVE. ADVENTUROUS. GENUINE. RIGOUR. CONVICTION.
WHAT OUR OWN DATA TOLD US IN 2015
We anticipated a positive response to our 2015 initiatives
Very disappointing results – no improvement in learner outcomes. Where was the
expected return on investment…?
Great Teachers??? Great Learner Support??? Work integrated learning???
RESPECT. DRIVE. ADVENTUROUS. GENUINE. RIGOUR. CONVICTION.
CONSIDER THE IMPLICATIONS OF THE DATA…
Great Teachers??? Great Learner Support??? Work integrated learning???
“What does a successful learner
look like?”
• Upon admission, they had higher
admission scores, and a higher
level of education, came from
higher socio-economic
backgrounds
• Tended to engage early and
achieve early success in
assessment activities
• More likely to access learning
support services early in their
studies; and likely to be successful
even if they didn’t access learner
support
“What does an unsuccessful
learner look like?”
• Upon admission, they had lower
admission scores, a lower level of
entry level education, and/or came
from lower socio-economic
backgrounds
• More likely to not engage early
and/or encounter early failure in
assessment activities
• Less likely to access learning
support – they were withdrawing or
failing courses despite the
availability of support
RESPECT. DRIVE. ADVENTUROUS. GENUINE. RIGOUR. CONVICTION.
WHAT THE NATIONAL DATA TOLD US
IN 2015 (TOTAL VET ACTIVITY)
NCVER TVA data (Infographic pub.
Nov 2015)
3.9 million learners were enrolled in
VET courses in 2014
• 2.25m were enrolled through
private providers
• 1.06m enrolled through TAFE
NCVER VocStats
• Benchmark data for specific
programs
NCVER and ASQA publications, eg:
• Australian Senate enquiry into the
operation, regulation and funding
of private providers (Oct 2015)
• ASQA Strategic Audit Report -
VET Fee-HELP (Oct 2015)
RESPECT. DRIVE. ADVENTUROUS. GENUINE. RIGOUR. CONVICTION.
2016 IMPROVEMENT ACTIONS…
We looked for a more holistic approach to
the problem of Learner Success
We used an Improvement Framework
based on Design Thinking principles
Our initial goal was to use the available
data to understand the issues and improve
learner success rates by:
• Developing systems to identify
learners “at risk” of failing
• Offering early (just in time) intervention
to “at risk” learners
We didn’t anticipate
how much more we
would achieve…
LEARNER EXPERIENCE RE-DESIGN
PROJECT
• Understand the challenges (data,
surveys, interviews, etc)
• Discover the meaning of the
challenges (field work)
• Define the learner experience
(mapped themes and identified
needs)
• Develop solution prototypes
• Ideate solution processes & hurdles
• Test the solution concepts on a
group of learners
• Implement solution (pilot)
• Measure solution impacts
TESTUNDERSTAND DISCOVER
DEFINE
IDEATE PROTOTYPE
Adapted from Hasso Plattner Institut School of Design Thinking
DEFINE
UNDERSTAND
UNDERSTAND
DISCOVER
IDEATE
PROTOTYPEPROTOTYPE TEST
2016 Project Milestones & Timeline
Nov Dec Jan Feb Mar April May Jun Jul
2015 2016
TEST
IMPLEMENT
UNDERSTAND
EVALUATE
RESPECT. DRIVE. ADVENTUROUS. GENUINE. RIGOUR. CONVICTION.
UNDERSTA
ND
DATA AVAILABLE FOR ANALYSIS
DEMOGRAPHICS
ENROLMENTS &
COMPLETIONS MODES OF STUDY CHANNEL OF ENROLMENT
1ST PHASE MODULE
COMPETENCY POINTS OF WITHDRAWAL ONLINE CLASS ACTIVITY ON-CAMPUS ATTENDANCE
ACCESSABILITY
REGISTRATIONS LEARNER SATISFACTION REVENUE IMPACTS RETURN ON INVESTMENT
UNDERSTAND
RESPECT. DRIVE. ADVENTUROUS. GENUINE. RIGOUR. CONVICTION.
SALES STAFF NEW
LEARNERS
CURRENT
LEARNERS
PAST
LEARNERS
& GRADUATES
TEACHERS LEARNER
SUPPORT
STAFF
BENCHMARK
EXPERIENCE
UNDERSTAND
PEOPLE PREPARED TO SHARE THEIR EXPERIENCE
OPPORTUNITY + PROBLEM + PURPOSE
UNDERSTAND
RESPECT. DRIVE. ADVENTUROUS. GENUINE. RIGOUR. CONVICTION.
UNDERSTAND
FIELD WORK
ENGAGE + OBSERVE + EXPERIENCEDISCOVER
RESPECT. DRIVE. ADVENTUROUS. GENUINE. RIGOUR. CONVICTION.
MEDIAN AGE: 33
GENDER: 80% Female
COUNTRY OF BIRTH : 84% Australia
COMPLETED GRADE 12: 67%
HAS A PRIOR QUALIFICATION: 65%
STUDY LOAD: 64% Full-time
STUDY MODE: 42% Online, 30% Mixed, 28% On-
Campus
DESIRED STUDY EXPERIENCE AT ACAP
• An engaging, personalised and supportive learning environment
• To learn from industry experienced teachers who are engaging
and interactive
• To receive consistent advice and support when needed
• A flexible learning environment
• To receive clear communications of what is required
• To feel encouraged and motivated to complete their studies
KEY CHALLENGES OF STUDYING AT ACAP
• Navigating the learner portal and online class space
• Lack of engagement from online teachers and fellow online
learners
• Time management given course structure
• Inconsistent assessment feedback and how to successfully
progress
• Returning to study and being study ready (including lack of
benefit in orientation)
• Being motivated to complete online study
• Issues with video assessments and uploading
• Understanding career and study options available post course
completion
• Transitioning from VET to HE
MOTIVATIONS
• Personal experience and hardship have inspired them to
study in the field
• Have personal experience dealing with counsellors and case
managers
• Are driven by a desire to help people and looking to obtain a
fulfilling job
GOALS
• Would like to pathway to a bachelors degree on completion of
the diploma
• Want to upskill and improve their professional experience
• Are looking to try a new career path
2016 PROFILE OF A DIPLOMA LEARNER
NEEDS + INSIGHTS + POINT OF VIEWDEFINE
RESPECT. DRIVE. ADVENTUROUS. GENUINE. RIGOUR. CONVICTION.
LEARNER EXPERIENCE ONLINE LEARNERS & STUDY LEARNER PORTAL
LEARNER SUPPORT & CONNECTEDNESS PREPAREDNESS TO STUDY GRADUATE CAPABILITIES
TECHNOLOGY EDUCATIONAL DESIGN TEACHING & ASSESSMENT PRACTICES
THEMES IDENTIFIED
NEEDS + INSIGHTS + POINT OF VIEWDEFINE
RESPECT. DRIVE. ADVENTUROUS. GENUINE. RIGOUR. CONVICTION.
NEED # 1 Learners find benefit from orientation
NEED # 2 Consistency in learner communications & transitioning
relationships from marketing (pre-enrolment) to the teachers
and support staff (post-enrolment)
NEED # 3 Improvement to the design of the learner portal
NEED # 4 Online learners feel connected, supported & engaged
NEED # 5 Learners understand how they’re performing throughout their
studies to successfully progress
NEED # 6 Learners experience an easier transition from VET to HE
NEED # 7 Learners can seek advice & support on career & future study
options
DEFINING LEARNER NEEDS
NEEDS + INSIGHTS + POINT OF VIEWDEFINE
RESPECT. DRIVE. ADVENTUROUS. GENUINE. RIGOUR. CONVICTION.
INSIGHT #1 Improve end-to-end communications (what, by whom &
mediums)
INSIGHT #2 Improve upfront assessment of learners’ suitability for online
study
INSIGHT #3 Proactive withdrawal & deferral processes (incl. retention
program)
INSIGHT #4 Monitor & follow-up learner risk flags (eg attendance,
engagement, on-time assessment submissions)
DEFINING THE LEARNER EXPERIENCE OF
PROCESSES
NEEDS + INSIGHTS + POINT OF VIEW
DEFINE
RESPECT. DRIVE. ADVENTUROUS. GENUINE. RIGOUR. CONVICTION.
UNDERSTA
ND
DISCOVER
DEFINE
IDEATE PROTOTY
PE
Adapted from: Hasso Plattner Institut School of Design Thinking, Hasso Plattner Institute of Design at Stanford & 2nd Road.
TEST
IMPLEMENT
2016 PRIORITY ACTIONS
We had identified 7x Learner Needs
and 4x Process Insights requiring
improvement actions of varying
complexity.
With limited resources, which should
we choose to pilot in 2016?
Considering current budgets, control
of resources, existing systems and
processes…
Coaching Clinic from
T3 2016
Online Refresh from
T2 2016
Learner Care Program
from T2 2016
RESPECT. DRIVE. ADVENTUROUS. GENUINE. RIGOUR. CONVICTION.
Coaching Clinic
TEST
IMPLEMENT
The pilot program offered ‘case management’ of students in the Diploma of
Youth Work through
• One on one support
• Regular contact
• Follow up before and after due dates
Students were selected if they had:
• failed a resubmission in their second attempt of an assessment
• demonstrated issues with understanding content
• Submitted only partial assessments at the end of trimester or
• failed to submit without explanation
RESPECT. DRIVE. ADVENTUROUS. GENUINE. RIGOUR. CONVICTION.
Coaching Clinic
TEST
IMPLEMENT
What did success look like?
• increase in completions and
• the transformational experience ...
“The best kind of people are the ones that come into your life and make you
see the sun where you once saw the clouds. The people that believe in you
so much so that you start to believe in you too. The once in a lifetime kind of
people. Thank you for coming into my life.”
(quote from a student to Elisa McLeod, Head Coach)
RESPECT. DRIVE. ADVENTUROUS. GENUINE. RIGOUR. CONVICTION.
Online Refresh – out with the old
• Poor learning portal design (Need #3)
• Not engaging or supportive (Need #4)
• No understanding of progression (Need #5)
TEST
IMPLEMENT
RESPECT. DRIVE. ADVENTUROUS. GENUINE. RIGOUR. CONVICTION.
Online Refresh – out with the OLD
• Poor learning portal design (Need #3)
• Not engaging or supportive (Need #4)
• No understanding of progression (Need #5)
TEST
IMPLEMENT
RESPECT. DRIVE. ADVENTUROUS. GENUINE. RIGOUR. CONVICTION.
n Online Refresh – in with the NEW
• Refreshed space
• Regular synchronous sessions
• Refreshed learning designTEST
IMPLEMENT
RESPECT. DRIVE. ADVENTUROUS. GENUINE. RIGOUR. CONVICTION.
n Online Refresh – in with the NEW
• Refreshed space
• Regular synchronous sessions
• Refreshed learning designTEST
IMPLEMENT
RESPECT. DRIVE. ADVENTUROUS. GENUINE. RIGOUR. CONVICTION.
WEEKS 1 & 2
First contact by phone to make
introduction & offer support
WEEK 3 (CENSUS)
Check in re: study load & offer
further support
WEEKS 4 & 5
Preparation & support for 1st
assessment
WEEKS 6 & 7
Check-in re: results &
submissions
WEEKS 8, 9 & 10
Further assessment follow up &
resubmission support incl. SLS
WEEKS 11 & 12
Check-in re: results & re-
enrolment (incl. deferrals)
Learner Care
Program
TEST
IMPLEMENT
RESPECT. DRIVE. ADVENTUROUS. GENUINE. RIGOUR. CONVICTION.
METRIC GROUP # LEARNERS # RATE % RATE 90% CI BAR
Withdrawal
Pilot 50 4 8% 6%
Diploma Cohort 482 164 34% 4%
Deferral
Pilot 50 5 10% 7%
Diploma Cohort 482 87 18% 3%
Module Pass
Pilot 50 40 80% 9%
Diploma Cohort 482 265 55% 4%
Re-Enrolment
Pilot 50 39 78% 10%
Diploma Cohort 482 231 48% 4%
What our own data told us in 2016-17…
The following results shows the performance of learners participating in the Learner
Care pilot group compared with that of a cohort of newly enrolled Diploma learners
studying for the first time in T2 2016
Table 1: T2-16 Withdrawal, Deferral, Module Pass & Re-enrolment Rates of ACAP Diploma learners
NB: Confidence indicators (CI) demonstrate statistical significance of results that we can infer with 90% confidence. This means with 90%
confidence we can say that the withdrawal rate for the pilot group will be between 2% - 14% i.e. 8%-6%; 8%+6%. We use this to derive
the best and worst case scenarios to determine incremental lift from the pilot group inferred to the Diploma cohort.
UNDERSTA
ND
EVALUATE
RESPECT. DRIVE. ADVENTUROUS. GENUINE. RIGOUR. CONVICTION.
2017 IMPROVEMENT ACTIONS…
Broad implementation across
VET programs of:
• Learner Care Program
• Coaching Clinic
• Online Refresh Program
Scope out systems and process
improvements required to
implement of the remaining 8 x
improvement projects
RESPECT. DRIVE. ADVENTUROUS. GENUINE. RIGOUR. CONVICTION.
LESSONS LEARNED…
2. Discovery is hard
work
But we already had the
tools we needed
• NCVER
benchmarking data
and sector research
• Individual & group
interviews
• Observation in
context
• Self-documentation
(participants recording
their own experience)
1. The power of a well-designed
Improvement Framework
A tremendously rewarding process, utilising
a range of tools and techniques to:
• Create meaning and find insights
• Clearly identify the real problem
• Generate ideas and consider options
• Validate through prototyping and testing
• Trial through pilot programs
• Evaluate the impact before full-scale
implementation
3. Engaging with the process
Helped us to make sense of the Discovery
stage – to pull all the information together
into an organised pattern that could be
mapped to the student experience
RESPECT. DRIVE. ADVENTUROUS. GENUINE. RIGOUR. CONVICTION.
THE TRUTH ABOUT DATA…
It’s very important, but it’s not enough!!!
• Data – even the increasingly sophisticated
big-data now available – can only reveal
part of the truth
• Data that is unchallenged by lived
experience tends to reinforce the
“conventional wisdoms”
Discovering what Learners really want
requires:
• Empathy for the lived experience of
learners, teachers, employers and support
staff – everyone involved in the learning
experience
• Creative people willing to fully engage
and work hard throughout the process
• Rational analysis of quantitative and
qualitative information
Empathy
Creativity
Rationality
RESPECT. DRIVE. ADVENTUROUS. GENUINE. RIGOUR. CONVICTION.
TESTIDEATE PROTOTY
PE
Questions or comments?

The truth about data: discovering what learners really want

  • 1.
    RESPECT. DRIVE. ADVENTUROUS.GENUINE. RIGOUR. CONVICTION. The Truth About Data… Discovering What Learners Really Want Veronica Keating, Director of Quality, Compliance, Risk and Regulation Kristen Clarke, Head of Curriculum and Operations (VET) The Australian College of Applied Psychology
  • 2.
    RESPECT. DRIVE. ADVENTUROUS.GENUINE. RIGOUR. CONVICTION. LEARNER SUCCESS… Ogres are like onions…
  • 3.
    RESPECT. DRIVE. ADVENTUROUS.GENUINE. RIGOUR. CONVICTION. LEARNER SUCCESS… Today we will “peel the onion” and reveal what we have learned about Learner Success: • What our learner data revealed and what it didn’t reveal • What learner success initiatives worked and what didn’t work • What we intend to do about learner success in the future The Australian College of Applied Psychology (ACAP) operates in a niche, dual sector market providing education and training within the caring professions. We are committed to delivering a high quality learning experience. We want know that we are meeting our commitments and delivering real value through: • Positive, life-long learning experiences • Successful outcomes and meaningful careers • Successful industry partnerships
  • 4.
    RESPECT. DRIVE. ADVENTUROUS.GENUINE. RIGOUR. CONVICTION. LEARNER SUCCESS… Key internal measures: • Module pass rate • Withdrawal rate • Deferral rate • Re-enrolment rate Correlated against: • Learner satisfaction • Industry feedback • Employment & further study outcomes Data analysis drives our continuous improvement cycle We are able to access increasingly sophisticated data sources that tell us almost everything we need to know about our learners – Their demographic profile – How they learn and where in a course they are most likely to succeed and fail – Their prospects for positive employment and/or career outcomes
  • 5.
    RESPECT. DRIVE. ADVENTUROUS.GENUINE. RIGOUR. CONVICTION. LEARNER SUCCESS… We thought we understood our learners • AVETMISS data told us about their demographic profile • Analysis of sales and marketing data told us about their motivation to enrol in our courses • Analysis of data in our LMS and SMS told us about their progression and success DIPLOMA LEARNER PROFILE • MEDIAN AGE: 33 • GENDER: 80% Female • COUNTRY OF BIRTH : 84% Australia • COMPLETED GRADE 12: 67% • HAS A PRIOR QUALIFICATION: 65% • STUDY LOAD: 64% Full-time • STUDY MODE: 42% Online, 30% Mixed, 28% On-Campus Great Teachers Great Learner Support Work integrated learning
  • 6.
    RESPECT. DRIVE. ADVENTUROUS.GENUINE. RIGOUR. CONVICTION. LEARNER SUCCESS… A CONVENTIONAL WISDOM • Qualified teacher-practitioners • Ongoing Professional Development • Small class sizes • High quality learning resources Great Teachers • Learning Support (academic) • Access support (disability) • Personal Support (counselling) Great Learner Support • Great relationships with employers • Relevant work experience for learners • Monitoring and support throughout placement • Work integrated assessment activities Work Integrated Learning
  • 7.
    RESPECT. DRIVE. ADVENTUROUS.GENUINE. RIGOUR. CONVICTION. WHAT OUR OWN DATA TOLD US IN 2014 The data told us that: • Learner success measures had plateaued and/or declined slightly. • Still high levels of satisfaction with the quality of our teachers, our delivery methods and our teaching resources • Very high levels of satisfaction and very positive outcomes for users of Learner Support services – including learning / academic support, disability support and personal support Our analysis suggested that: • Online learners were lagging behind f2f learners; and • The placement experience could be improved Great Teachers Great Learner Support Work integrated learning Sources of data: • Completion rates, withdrawal and deferral rates, re-enrolment (retention) rates • Internal Unit & Teacher Evaluations (UTEs) • Annual Learner Feedback survey
  • 8.
    RESPECT. DRIVE. ADVENTUROUS.GENUINE. RIGOUR. CONVICTION. WHAT THE NATIONAL DATA TOLD US IN 2014… We used NCVER data and research papers from across the sector to inform our 2015 improvement activities NCVER Snapshot of publically funded VET activity for 2013 (published in Dec 2014): • 1.88 million learners were enrolled in VET courses in 2013 • 63.4% of learners enrolled in TAFE – the public sector continued to be our main competitor in our target sector – Community Services VocStats provided benchmark data for specific programs NCVER research papers published in 2013- 14, eg: • The needs of a workforce facing the next wave of technological change (CEDA) • A proposed taxonomy for provider level performance indicators (T. Karmel et al) • Learner pathways from VET to HE (A Mills et al)
  • 9.
    RESPECT. DRIVE. ADVENTUROUS.GENUINE. RIGOUR. CONVICTION. 2015 IMPROVEMENT ACTIONS… • Restructured the curriculum delivery to facilitate early success in “Phase 1” modules • PD workshops for online teaching staff from our Learning & Teaching Technology unit • Updated our work placement program to put it at the heart of the learning experience. • Implemented compulsory attendance at f2f workshops for online learners • Revamped learner support services for online learners • Developed a range of video-content for easy online access • Scheduled academic coaching clinics to support particular programs of study We also administered a telephone exit survey to ask unsuccessful learners why they had withdrawn or failed their course – it seemed to confirm what we thought we already knew… “family crisis”, “work commitments” and/or “health issues”. Great Teachers Great Learner Support Work integrated learning
  • 10.
    RESPECT. DRIVE. ADVENTUROUS.GENUINE. RIGOUR. CONVICTION. WHAT OUR OWN DATA TOLD US IN 2015 We anticipated a positive response to our 2015 initiatives Very disappointing results – no improvement in learner outcomes. Where was the expected return on investment…? Great Teachers??? Great Learner Support??? Work integrated learning???
  • 11.
    RESPECT. DRIVE. ADVENTUROUS.GENUINE. RIGOUR. CONVICTION. CONSIDER THE IMPLICATIONS OF THE DATA… Great Teachers??? Great Learner Support??? Work integrated learning??? “What does a successful learner look like?” • Upon admission, they had higher admission scores, and a higher level of education, came from higher socio-economic backgrounds • Tended to engage early and achieve early success in assessment activities • More likely to access learning support services early in their studies; and likely to be successful even if they didn’t access learner support “What does an unsuccessful learner look like?” • Upon admission, they had lower admission scores, a lower level of entry level education, and/or came from lower socio-economic backgrounds • More likely to not engage early and/or encounter early failure in assessment activities • Less likely to access learning support – they were withdrawing or failing courses despite the availability of support
  • 12.
    RESPECT. DRIVE. ADVENTUROUS.GENUINE. RIGOUR. CONVICTION. WHAT THE NATIONAL DATA TOLD US IN 2015 (TOTAL VET ACTIVITY) NCVER TVA data (Infographic pub. Nov 2015) 3.9 million learners were enrolled in VET courses in 2014 • 2.25m were enrolled through private providers • 1.06m enrolled through TAFE NCVER VocStats • Benchmark data for specific programs NCVER and ASQA publications, eg: • Australian Senate enquiry into the operation, regulation and funding of private providers (Oct 2015) • ASQA Strategic Audit Report - VET Fee-HELP (Oct 2015)
  • 13.
    RESPECT. DRIVE. ADVENTUROUS.GENUINE. RIGOUR. CONVICTION. 2016 IMPROVEMENT ACTIONS… We looked for a more holistic approach to the problem of Learner Success We used an Improvement Framework based on Design Thinking principles Our initial goal was to use the available data to understand the issues and improve learner success rates by: • Developing systems to identify learners “at risk” of failing • Offering early (just in time) intervention to “at risk” learners We didn’t anticipate how much more we would achieve… LEARNER EXPERIENCE RE-DESIGN PROJECT • Understand the challenges (data, surveys, interviews, etc) • Discover the meaning of the challenges (field work) • Define the learner experience (mapped themes and identified needs) • Develop solution prototypes • Ideate solution processes & hurdles • Test the solution concepts on a group of learners • Implement solution (pilot) • Measure solution impacts
  • 14.
    TESTUNDERSTAND DISCOVER DEFINE IDEATE PROTOTYPE Adaptedfrom Hasso Plattner Institut School of Design Thinking DEFINE UNDERSTAND UNDERSTAND DISCOVER IDEATE PROTOTYPEPROTOTYPE TEST 2016 Project Milestones & Timeline Nov Dec Jan Feb Mar April May Jun Jul 2015 2016 TEST IMPLEMENT UNDERSTAND EVALUATE
  • 15.
    RESPECT. DRIVE. ADVENTUROUS.GENUINE. RIGOUR. CONVICTION. UNDERSTA ND DATA AVAILABLE FOR ANALYSIS DEMOGRAPHICS ENROLMENTS & COMPLETIONS MODES OF STUDY CHANNEL OF ENROLMENT 1ST PHASE MODULE COMPETENCY POINTS OF WITHDRAWAL ONLINE CLASS ACTIVITY ON-CAMPUS ATTENDANCE ACCESSABILITY REGISTRATIONS LEARNER SATISFACTION REVENUE IMPACTS RETURN ON INVESTMENT UNDERSTAND
  • 16.
    RESPECT. DRIVE. ADVENTUROUS.GENUINE. RIGOUR. CONVICTION. SALES STAFF NEW LEARNERS CURRENT LEARNERS PAST LEARNERS & GRADUATES TEACHERS LEARNER SUPPORT STAFF BENCHMARK EXPERIENCE UNDERSTAND PEOPLE PREPARED TO SHARE THEIR EXPERIENCE OPPORTUNITY + PROBLEM + PURPOSE UNDERSTAND
  • 17.
    RESPECT. DRIVE. ADVENTUROUS.GENUINE. RIGOUR. CONVICTION. UNDERSTAND FIELD WORK ENGAGE + OBSERVE + EXPERIENCEDISCOVER
  • 18.
    RESPECT. DRIVE. ADVENTUROUS.GENUINE. RIGOUR. CONVICTION. MEDIAN AGE: 33 GENDER: 80% Female COUNTRY OF BIRTH : 84% Australia COMPLETED GRADE 12: 67% HAS A PRIOR QUALIFICATION: 65% STUDY LOAD: 64% Full-time STUDY MODE: 42% Online, 30% Mixed, 28% On- Campus DESIRED STUDY EXPERIENCE AT ACAP • An engaging, personalised and supportive learning environment • To learn from industry experienced teachers who are engaging and interactive • To receive consistent advice and support when needed • A flexible learning environment • To receive clear communications of what is required • To feel encouraged and motivated to complete their studies KEY CHALLENGES OF STUDYING AT ACAP • Navigating the learner portal and online class space • Lack of engagement from online teachers and fellow online learners • Time management given course structure • Inconsistent assessment feedback and how to successfully progress • Returning to study and being study ready (including lack of benefit in orientation) • Being motivated to complete online study • Issues with video assessments and uploading • Understanding career and study options available post course completion • Transitioning from VET to HE MOTIVATIONS • Personal experience and hardship have inspired them to study in the field • Have personal experience dealing with counsellors and case managers • Are driven by a desire to help people and looking to obtain a fulfilling job GOALS • Would like to pathway to a bachelors degree on completion of the diploma • Want to upskill and improve their professional experience • Are looking to try a new career path 2016 PROFILE OF A DIPLOMA LEARNER NEEDS + INSIGHTS + POINT OF VIEWDEFINE
  • 19.
    RESPECT. DRIVE. ADVENTUROUS.GENUINE. RIGOUR. CONVICTION. LEARNER EXPERIENCE ONLINE LEARNERS & STUDY LEARNER PORTAL LEARNER SUPPORT & CONNECTEDNESS PREPAREDNESS TO STUDY GRADUATE CAPABILITIES TECHNOLOGY EDUCATIONAL DESIGN TEACHING & ASSESSMENT PRACTICES THEMES IDENTIFIED NEEDS + INSIGHTS + POINT OF VIEWDEFINE
  • 20.
    RESPECT. DRIVE. ADVENTUROUS.GENUINE. RIGOUR. CONVICTION. NEED # 1 Learners find benefit from orientation NEED # 2 Consistency in learner communications & transitioning relationships from marketing (pre-enrolment) to the teachers and support staff (post-enrolment) NEED # 3 Improvement to the design of the learner portal NEED # 4 Online learners feel connected, supported & engaged NEED # 5 Learners understand how they’re performing throughout their studies to successfully progress NEED # 6 Learners experience an easier transition from VET to HE NEED # 7 Learners can seek advice & support on career & future study options DEFINING LEARNER NEEDS NEEDS + INSIGHTS + POINT OF VIEWDEFINE
  • 21.
    RESPECT. DRIVE. ADVENTUROUS.GENUINE. RIGOUR. CONVICTION. INSIGHT #1 Improve end-to-end communications (what, by whom & mediums) INSIGHT #2 Improve upfront assessment of learners’ suitability for online study INSIGHT #3 Proactive withdrawal & deferral processes (incl. retention program) INSIGHT #4 Monitor & follow-up learner risk flags (eg attendance, engagement, on-time assessment submissions) DEFINING THE LEARNER EXPERIENCE OF PROCESSES NEEDS + INSIGHTS + POINT OF VIEW DEFINE
  • 22.
    RESPECT. DRIVE. ADVENTUROUS.GENUINE. RIGOUR. CONVICTION. UNDERSTA ND DISCOVER DEFINE IDEATE PROTOTY PE Adapted from: Hasso Plattner Institut School of Design Thinking, Hasso Plattner Institute of Design at Stanford & 2nd Road. TEST IMPLEMENT 2016 PRIORITY ACTIONS We had identified 7x Learner Needs and 4x Process Insights requiring improvement actions of varying complexity. With limited resources, which should we choose to pilot in 2016? Considering current budgets, control of resources, existing systems and processes… Coaching Clinic from T3 2016 Online Refresh from T2 2016 Learner Care Program from T2 2016
  • 23.
    RESPECT. DRIVE. ADVENTUROUS.GENUINE. RIGOUR. CONVICTION. Coaching Clinic TEST IMPLEMENT The pilot program offered ‘case management’ of students in the Diploma of Youth Work through • One on one support • Regular contact • Follow up before and after due dates Students were selected if they had: • failed a resubmission in their second attempt of an assessment • demonstrated issues with understanding content • Submitted only partial assessments at the end of trimester or • failed to submit without explanation
  • 24.
    RESPECT. DRIVE. ADVENTUROUS.GENUINE. RIGOUR. CONVICTION. Coaching Clinic TEST IMPLEMENT What did success look like? • increase in completions and • the transformational experience ... “The best kind of people are the ones that come into your life and make you see the sun where you once saw the clouds. The people that believe in you so much so that you start to believe in you too. The once in a lifetime kind of people. Thank you for coming into my life.” (quote from a student to Elisa McLeod, Head Coach)
  • 25.
    RESPECT. DRIVE. ADVENTUROUS.GENUINE. RIGOUR. CONVICTION. Online Refresh – out with the old • Poor learning portal design (Need #3) • Not engaging or supportive (Need #4) • No understanding of progression (Need #5) TEST IMPLEMENT
  • 26.
    RESPECT. DRIVE. ADVENTUROUS.GENUINE. RIGOUR. CONVICTION. Online Refresh – out with the OLD • Poor learning portal design (Need #3) • Not engaging or supportive (Need #4) • No understanding of progression (Need #5) TEST IMPLEMENT
  • 27.
    RESPECT. DRIVE. ADVENTUROUS.GENUINE. RIGOUR. CONVICTION. n Online Refresh – in with the NEW • Refreshed space • Regular synchronous sessions • Refreshed learning designTEST IMPLEMENT
  • 28.
    RESPECT. DRIVE. ADVENTUROUS.GENUINE. RIGOUR. CONVICTION. n Online Refresh – in with the NEW • Refreshed space • Regular synchronous sessions • Refreshed learning designTEST IMPLEMENT
  • 29.
    RESPECT. DRIVE. ADVENTUROUS.GENUINE. RIGOUR. CONVICTION. WEEKS 1 & 2 First contact by phone to make introduction & offer support WEEK 3 (CENSUS) Check in re: study load & offer further support WEEKS 4 & 5 Preparation & support for 1st assessment WEEKS 6 & 7 Check-in re: results & submissions WEEKS 8, 9 & 10 Further assessment follow up & resubmission support incl. SLS WEEKS 11 & 12 Check-in re: results & re- enrolment (incl. deferrals) Learner Care Program TEST IMPLEMENT
  • 30.
    RESPECT. DRIVE. ADVENTUROUS.GENUINE. RIGOUR. CONVICTION. METRIC GROUP # LEARNERS # RATE % RATE 90% CI BAR Withdrawal Pilot 50 4 8% 6% Diploma Cohort 482 164 34% 4% Deferral Pilot 50 5 10% 7% Diploma Cohort 482 87 18% 3% Module Pass Pilot 50 40 80% 9% Diploma Cohort 482 265 55% 4% Re-Enrolment Pilot 50 39 78% 10% Diploma Cohort 482 231 48% 4% What our own data told us in 2016-17… The following results shows the performance of learners participating in the Learner Care pilot group compared with that of a cohort of newly enrolled Diploma learners studying for the first time in T2 2016 Table 1: T2-16 Withdrawal, Deferral, Module Pass & Re-enrolment Rates of ACAP Diploma learners NB: Confidence indicators (CI) demonstrate statistical significance of results that we can infer with 90% confidence. This means with 90% confidence we can say that the withdrawal rate for the pilot group will be between 2% - 14% i.e. 8%-6%; 8%+6%. We use this to derive the best and worst case scenarios to determine incremental lift from the pilot group inferred to the Diploma cohort. UNDERSTA ND EVALUATE
  • 31.
    RESPECT. DRIVE. ADVENTUROUS.GENUINE. RIGOUR. CONVICTION. 2017 IMPROVEMENT ACTIONS… Broad implementation across VET programs of: • Learner Care Program • Coaching Clinic • Online Refresh Program Scope out systems and process improvements required to implement of the remaining 8 x improvement projects
  • 32.
    RESPECT. DRIVE. ADVENTUROUS.GENUINE. RIGOUR. CONVICTION. LESSONS LEARNED… 2. Discovery is hard work But we already had the tools we needed • NCVER benchmarking data and sector research • Individual & group interviews • Observation in context • Self-documentation (participants recording their own experience) 1. The power of a well-designed Improvement Framework A tremendously rewarding process, utilising a range of tools and techniques to: • Create meaning and find insights • Clearly identify the real problem • Generate ideas and consider options • Validate through prototyping and testing • Trial through pilot programs • Evaluate the impact before full-scale implementation 3. Engaging with the process Helped us to make sense of the Discovery stage – to pull all the information together into an organised pattern that could be mapped to the student experience
  • 33.
    RESPECT. DRIVE. ADVENTUROUS.GENUINE. RIGOUR. CONVICTION. THE TRUTH ABOUT DATA… It’s very important, but it’s not enough!!! • Data – even the increasingly sophisticated big-data now available – can only reveal part of the truth • Data that is unchallenged by lived experience tends to reinforce the “conventional wisdoms” Discovering what Learners really want requires: • Empathy for the lived experience of learners, teachers, employers and support staff – everyone involved in the learning experience • Creative people willing to fully engage and work hard throughout the process • Rational analysis of quantitative and qualitative information Empathy Creativity Rationality
  • 34.
    RESPECT. DRIVE. ADVENTUROUS.GENUINE. RIGOUR. CONVICTION. TESTIDEATE PROTOTY PE Questions or comments?

Editor's Notes

  • #5 There is a revenue impact attached to each of these measures
  • #6 AVETMISS Data used to compile this profile - freely available through NCVER.
  • #7 This is what “everyone knows” will drive student success. If we don’t achieve expected performance outcomes, there must be something wrong with these.
  • #15 It is an iterative process utilising a range of tools and techniques to create meaning, find insights, generate ideas, and consider options to validate through prototyping and testing. The framework challenges us to combine empathy, rationale and creativity to enhance customer interactions and deliver better outcomes. It helps us find the right problem, in order to develop the right solution. It helps provide clarity. It helps us solve a real problem & solve it well. Discovery Tools & Techniques: Observation in context Camera Studies Analogous Inspiration Individual interviews Group Interviews Peer Observation Self-documentation (users recording their own experience)
  • #19 A much richer profile of our students
  • #21 NEEDS based on learner EXPERIENCE Many things behind the scenes that need to change to support these – links back to our themes of teaching & assessment practices; preparedness to study etc
  • #33 Engaging with the process
  • #34 Empathy for the lived experience Creativity Rational analysis