Download as PDF, PPTX


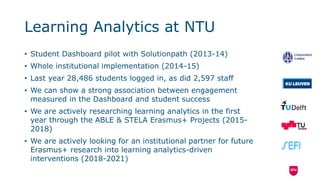


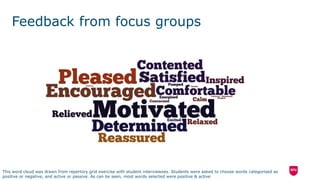

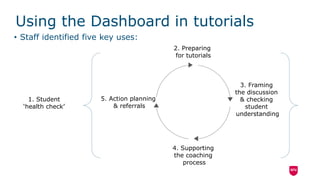
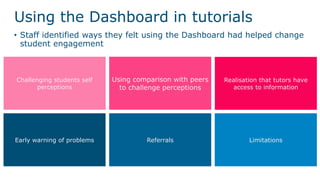
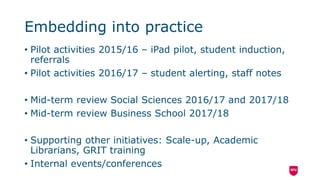


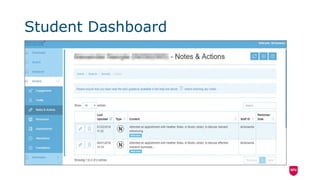
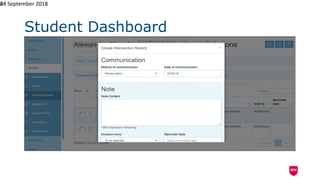
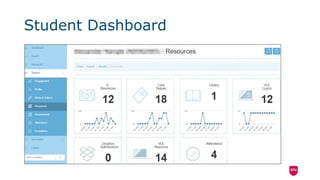


This document provides information about Nottingham Trent University's use of learning analytics and their student dashboard. It discusses: - An overview of the student dashboard which was first piloted in 2013-2014 and fully implemented in 2014-2015. It tracks student engagement using data from various systems. - Research that has shown a strong association between engagement measured in the dashboard and student success. The university is also researching learning analytics through various EU projects. - How both students and staff utilize the dashboard. Students check their engagement and attendance, while staff use it to prepare for tutorials and identify students who may need additional support. - Feedback from students which found the dashboard useful, especially when discussed during tutorials. The university


