SlideShare a Scribd company logo
Slow growth for years to come
   Even though there are signs of a recovery, the recession is likely to result in years with slow growth
   Look at the US: Capacity utilization is way below the long-term average; the population is ageing,
payroll employment is stagnating (see table); productivity gains at 2% since 2006 not enough to offset this
    The Fed in its latest statement noted that „low rates of resource utilization“ were the main justification
for staying at exceptionally low rates

       Percent                                                                                             U.S. Payroll          Millions
  88                                                                                                       employment            of
                                                                                       Recession
                                                                                                           Total                 Persons
  84                                                                                                       nonfarm
                                             Historic average - 1948 to present
                                                                                                           Oct 2002              130.3
  80
                                                                                                           Oct 2003              130.1
  76
                                                                                                           Oct 2004              132.1
  72                                            Manufacturing                                              Oct 2005              134.3

  68                                            Capacity                                           67.5    Oct 2006              136.5
                                                Utilization Rate                                           Oct 2007              137.8
  64
           98     99      00     01     02       03      04     05      06        07    08     09          Oct 2008              136.3
                                                                                                           Oct 2009              130.8
                                                                      Source: www.dallasfed.org
                                                                                                          Source: Bureau of Labor Statistics

                                                                                                                            Nov. 14, 2009
                                                                                                                         GAPA NEWS

More Related Content

More from Gapa News

Eurozone Wachstum der Kreditmenge
Eurozone Wachstum der KreditmengeEurozone Wachstum der Kreditmenge
Eurozone Wachstum der KreditmengeGapa News
 
Gold
GoldGold
Gold
Gapa News
 
Grafik 23.10.2012
Grafik 23.10.2012Grafik 23.10.2012
Grafik 23.10.2012Gapa News
 
Anleger steigen aus Aktien aus
Anleger steigen aus Aktien ausAnleger steigen aus Aktien aus
Anleger steigen aus Aktien ausGapa News
 
Grafik 26.09.2012
Grafik 26.09.2012Grafik 26.09.2012
Grafik 26.09.2012Gapa News
 
QE3 und der US Dollar am 13.9.2012
QE3 und der US Dollar am 13.9.2012QE3 und der US Dollar am 13.9.2012
QE3 und der US Dollar am 13.9.2012Gapa News
 
QE3 und Gold am 13.9.2012
QE3 und Gold am 13.9.2012QE3 und Gold am 13.9.2012
QE3 und Gold am 13.9.2012Gapa News
 
Die Nebenwirkungen von QE 13.9.2012
Die Nebenwirkungen von QE 13.9.2012Die Nebenwirkungen von QE 13.9.2012
Die Nebenwirkungen von QE 13.9.2012Gapa News
 
APPLE - Kurswende mit iPhone 5 ?
APPLE - Kurswende mit iPhone 5 ?APPLE - Kurswende mit iPhone 5 ?
APPLE - Kurswende mit iPhone 5 ?Gapa News
 
Facebook ist nicht Google
Facebook ist nicht GoogleFacebook ist nicht Google
Facebook ist nicht GoogleGapa News
 
Der Rendite-Kollaps (26.07.2012)
Der Rendite-Kollaps (26.07.2012)Der Rendite-Kollaps (26.07.2012)
Der Rendite-Kollaps (26.07.2012)Gapa News
 
USA Exporte verlieren Dampf
USA Exporte verlieren DampfUSA Exporte verlieren Dampf
USA Exporte verlieren DampfGapa News
 
US-Industrie im Rückwärtsgang
US-Industrie im RückwärtsgangUS-Industrie im Rückwärtsgang
US-Industrie im RückwärtsgangGapa News
 
Eurozone Arbeitslosigkeit
Eurozone ArbeitslosigkeitEurozone Arbeitslosigkeit
Eurozone ArbeitslosigkeitGapa News
 
DOW JONES Wiederholung von 2012 ?
DOW JONES   Wiederholung von 2012 ?DOW JONES   Wiederholung von 2012 ?
DOW JONES Wiederholung von 2012 ?Gapa News
 
WALL STREET - Halbzeitbilanz 2012
WALL STREET - Halbzeitbilanz 2012WALL STREET - Halbzeitbilanz 2012
WALL STREET - Halbzeitbilanz 2012Gapa News
 
Zew Konjunkturerwartungen Deutschland
Zew Konjunkturerwartungen DeutschlandZew Konjunkturerwartungen Deutschland
Zew Konjunkturerwartungen DeutschlandGapa News
 
Spanische Freudensprünge
Spanische FreudensprüngeSpanische Freudensprünge
Spanische FreudensprüngeGapa News
 
Apple teurer als Europas Banken
Apple teurer als Europas BankenApple teurer als Europas Banken
Apple teurer als Europas BankenGapa News
 
Rendite-Tief für US Treasuries
Rendite-Tief für US TreasuriesRendite-Tief für US Treasuries
Rendite-Tief für US TreasuriesGapa News
 

More from Gapa News (20)

Eurozone Wachstum der Kreditmenge
Eurozone Wachstum der KreditmengeEurozone Wachstum der Kreditmenge
Eurozone Wachstum der Kreditmenge
 
Gold
GoldGold
Gold
 
Grafik 23.10.2012
Grafik 23.10.2012Grafik 23.10.2012
Grafik 23.10.2012
 
Anleger steigen aus Aktien aus
Anleger steigen aus Aktien ausAnleger steigen aus Aktien aus
Anleger steigen aus Aktien aus
 
Grafik 26.09.2012
Grafik 26.09.2012Grafik 26.09.2012
Grafik 26.09.2012
 
QE3 und der US Dollar am 13.9.2012
QE3 und der US Dollar am 13.9.2012QE3 und der US Dollar am 13.9.2012
QE3 und der US Dollar am 13.9.2012
 
QE3 und Gold am 13.9.2012
QE3 und Gold am 13.9.2012QE3 und Gold am 13.9.2012
QE3 und Gold am 13.9.2012
 
Die Nebenwirkungen von QE 13.9.2012
Die Nebenwirkungen von QE 13.9.2012Die Nebenwirkungen von QE 13.9.2012
Die Nebenwirkungen von QE 13.9.2012
 
APPLE - Kurswende mit iPhone 5 ?
APPLE - Kurswende mit iPhone 5 ?APPLE - Kurswende mit iPhone 5 ?
APPLE - Kurswende mit iPhone 5 ?
 
Facebook ist nicht Google
Facebook ist nicht GoogleFacebook ist nicht Google
Facebook ist nicht Google
 
Der Rendite-Kollaps (26.07.2012)
Der Rendite-Kollaps (26.07.2012)Der Rendite-Kollaps (26.07.2012)
Der Rendite-Kollaps (26.07.2012)
 
USA Exporte verlieren Dampf
USA Exporte verlieren DampfUSA Exporte verlieren Dampf
USA Exporte verlieren Dampf
 
US-Industrie im Rückwärtsgang
US-Industrie im RückwärtsgangUS-Industrie im Rückwärtsgang
US-Industrie im Rückwärtsgang
 
Eurozone Arbeitslosigkeit
Eurozone ArbeitslosigkeitEurozone Arbeitslosigkeit
Eurozone Arbeitslosigkeit
 
DOW JONES Wiederholung von 2012 ?
DOW JONES   Wiederholung von 2012 ?DOW JONES   Wiederholung von 2012 ?
DOW JONES Wiederholung von 2012 ?
 
WALL STREET - Halbzeitbilanz 2012
WALL STREET - Halbzeitbilanz 2012WALL STREET - Halbzeitbilanz 2012
WALL STREET - Halbzeitbilanz 2012
 
Zew Konjunkturerwartungen Deutschland
Zew Konjunkturerwartungen DeutschlandZew Konjunkturerwartungen Deutschland
Zew Konjunkturerwartungen Deutschland
 
Spanische Freudensprünge
Spanische FreudensprüngeSpanische Freudensprünge
Spanische Freudensprünge
 
Apple teurer als Europas Banken
Apple teurer als Europas BankenApple teurer als Europas Banken
Apple teurer als Europas Banken
 
Rendite-Tief für US Treasuries
Rendite-Tief für US TreasuriesRendite-Tief für US Treasuries
Rendite-Tief für US Treasuries
 

Econchar Tslowgrowth112009
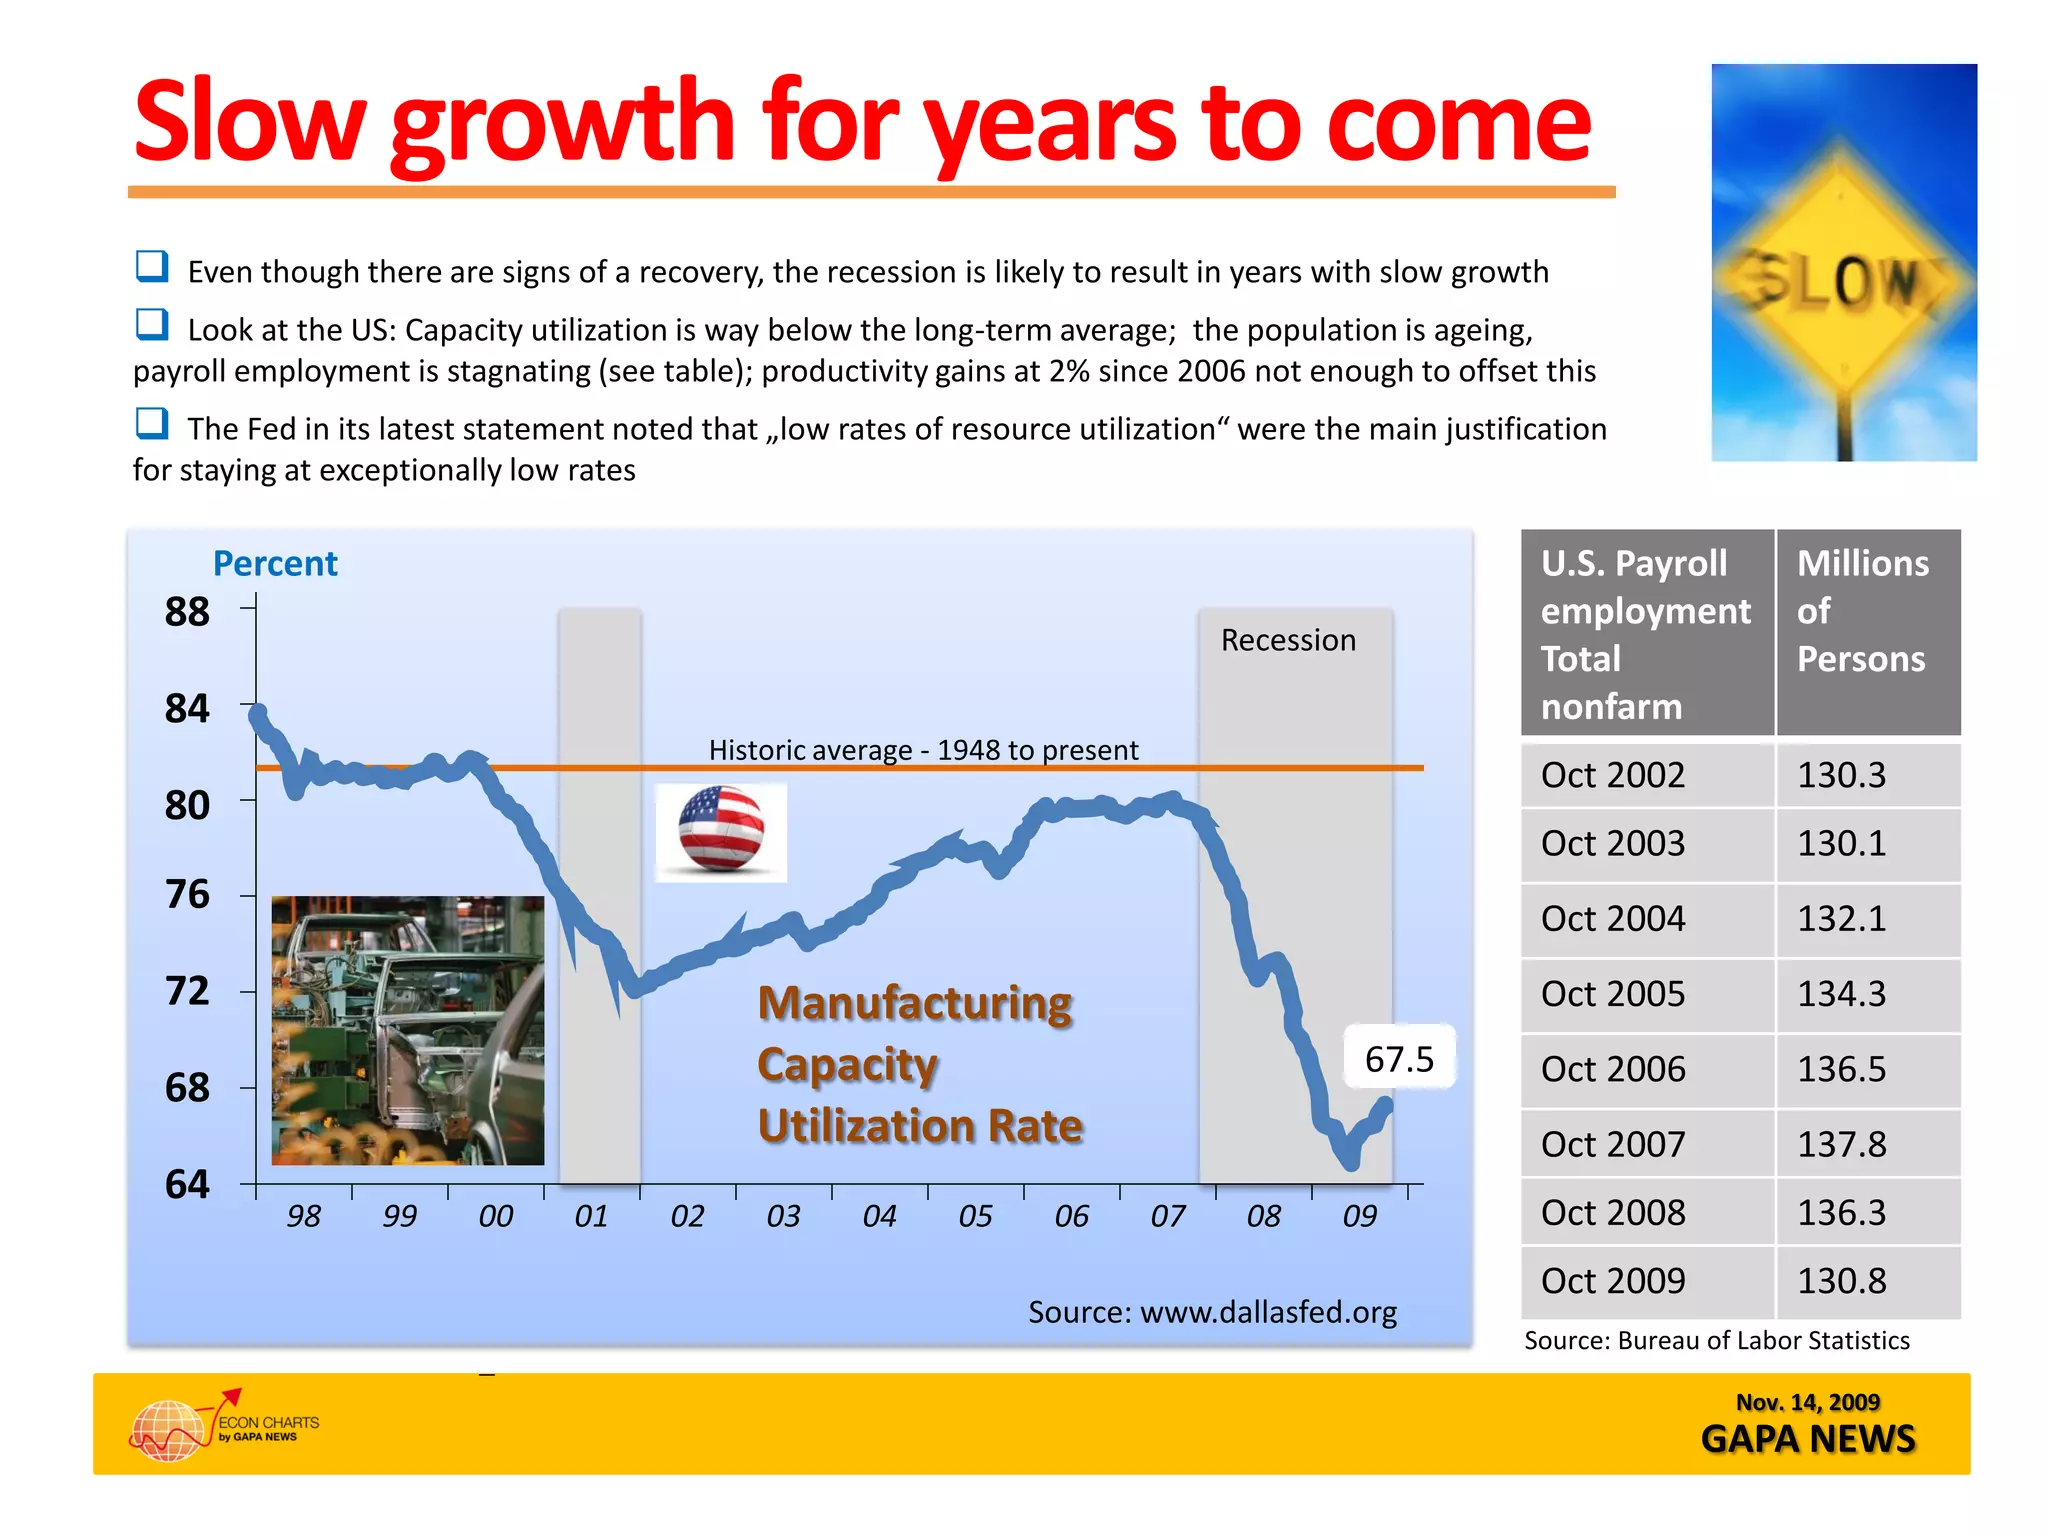
  • 1. Slow growth for years to come  Even though there are signs of a recovery, the recession is likely to result in years with slow growth  Look at the US: Capacity utilization is way below the long-term average; the population is ageing, payroll employment is stagnating (see table); productivity gains at 2% since 2006 not enough to offset this  The Fed in its latest statement noted that „low rates of resource utilization“ were the main justification for staying at exceptionally low rates Percent U.S. Payroll Millions 88 employment of Recession Total Persons 84 nonfarm Historic average - 1948 to present Oct 2002 130.3 80 Oct 2003 130.1 76 Oct 2004 132.1 72 Manufacturing Oct 2005 134.3 68 Capacity 67.5 Oct 2006 136.5 Utilization Rate Oct 2007 137.8 64 98 99 00 01 02 03 04 05 06 07 08 09 Oct 2008 136.3 Oct 2009 130.8 Source: www.dallasfed.org Source: Bureau of Labor Statistics Nov. 14, 2009 GAPA NEWS