More Related Content Similar to Myanmar and Asia Economies Similar to Myanmar and Asia Economies (20) More from KaungHtetZawSMU More from KaungHtetZawSMU (11) 1. Key Indicators for Asia and the Pacific 2011
Myanmar
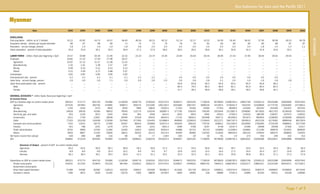
Item 1993 1994 1995 1996 1997 1998 1999 2000 2001 2002 2003 2004 2005 2006 2007 2008 2009 2010
POPULATION
MYANMAR
Total population million; as of 1 October 43.12 43.92 44.74 45.57 46.40 48.16 49.13 50.13 51.14 52.17 53.22 54.30 55.40 56.52 57.50 58.38 59.13 59.78
Population density persons per square kilometer 66 67 68 69 71 73 75 76 78 79 81 83 84 84 85 86 87 87
Population annual change, percent 1.8 1.9 1.9 1.9 1.8 3.8 2.0 2.0 2.0 2.0 2.0 2.0 2.0 2.0 1.8 1.5 1.3 1.1
Urban population percent of total population 25.6 25.9 26.1 26.5 26.9 27.2 27.6 28.0 28.5 29.0 29.6 30.1 30.6 31.3 31.9 32.6 33.2 ...
LABOR FORCE million; fiscal year beginning 1 April 19.47 19.98 20.49 21.95 22.52 23.10 23.70 24.30 24.93 25.63 26.35 26.90 27.43 27.95 28.50 29.02 29.54 ...
Employed 16.82 17.23 17.59 17.96 18.37 ... ... ... ... ... ... ... ... ... ... ... ... ...
Agriculture 10.97 11.12 11.27 11.38 11.51 ... ... ... ... ... ... ... ... ... ... ... ... ...
Manufacturing 1.25 1.41 1.48 1.57 1.67 ... ... ... ... ... ... ... ... ... ... ... ... ...
Mining 0.09 0.10 0.12 0.13 0.12 ... ... ... ... ... ... ... ... ... ... ... ... ...
Others 4.51 4.59 4.72 4.88 5.07 ... ... ... ... ... ... ... ... ... ... ... ... ...
Unemployed 0.81 0.83 0.85 0.90 0.92 ... ... ... ... ... ... ... ... ... ... ... ... ...
Unemployment rate percent 4.2 4.2 4.2 4.1 4.1 4.1 4.1 ... 4.0 4.0 4.0 4.0 4.0 4.0 4.0 4.0 ... ...
Labor force annual change, percent 2.6 2.6 2.6 7.1 2.6 2.6 2.6 2.5 2.6 2.8 2.8 2.1 2.0 1.9 1.9 1.8 1.8 ...
Labor force participation rate percent ... ... ... ... ... ... ... ... 63.6 63.8 64.3 64.6 65.0 65.4 65.8 66.2 ... ...
Male ... ... ... ... ... ... ... ... 80.3 79.5 80.2 80.6 81.1 81.6 82.0 82.5 ... ...
Female ... ... ... ... ... ... ... ... 47.7 48.3 48.6 48.8 49.1 49.5 49.8 50.1 ... ...
NATIONAL ACCOUNTS a million Kyats; fiscal year beginning 1 April
At Current Prices
GDP by industrial origin at current market prices 360321 472774 604729 791980 1119509 1609776 2190320 2552733 I 3548472 5625255 7716616 9078929 12286765 I 16852758 23336113 29233288 33905666 40507942
Agriculture 227035 297664 362750 475895 659671 950574 1312285 1461150 I 2025084 3067357 3906194 4372874 5736351 I 7401555 10109849 11773735 12916382 14729014
Mining 1704 2416 3170 4833 6450 7895 10842 15032 I 17334 25163 34583 57453 89469 I 121940 205344 254409 331351 367042
Manufacturing 24618 29516 41594 56610 79040 112774 143244 182897 I 277795 516243 756183 1051644 1572907 I 2358092 3473910 4917322 6136416 7905155
Electricity, gas, and water 653 1219 1872 2202 1932 991 2558 3444 I 3202 4654 5992 20023 27652 I 110010 189790 218167 337675 418532
Construction 5211 7739 13057 19058 26494 37034 40425 46044 I 77115 185611 303496 356771 461656 I 651973 893654 1236065 1518309 1839335
Trade 77520 101428 140358 179269 257946 377595 524403 613686 I 858083 1326615 1743643 2021271 2667197 I 3550814 4915159 6175062 6890046 8037819
Transport and communications 7415 13511 18770 27360 53297 80031 105669 153371 I 191810 358124 776704 936611 1412163 I 2019950 2781665 3731536 4586601 5577546
Finance 521 768 1041 1279 1475 1945 2215 2641 I 3299 4799 5297 6748 10237 I 14399 16948 20938 27392 31417
Public administration 8702 9906 10782 11482 13293 14622 16505 39354 I 44686 50724 64742 103890 112599 I 340892 371290 399679 551654 866630
Others 6943 8607 11335 13992 19911 26315 32174 35114 I 50064 85965 119782 151644 196534 I 283133 378504 506375 609840 735452
Net factor income from abroad -429 -396 -689 -116 -69 34 -77 -118 I -205 -20 -16 -91 -4 I 273 453 349 222 314
GNI 359892 472378 604040 791864 1119440 1609810 2190243 2552615 I 3548267 5625235 7716600 9078838 12286761 I 16853031 23336566 29233637 33905888 40508256
Structure of Output percent of GDP at current market prices
Agriculture 63.0 63.0 60.0 60.1 58.9 59.1 59.9 57.2 57.1 54.5 50.6 48.2 46.7 43.9 43.3 40.3 38.1 36.4
Industry 8.9 8.6 9.9 10.4 10.2 9.9 9.0 9.7 10.6 13.0 14.3 16.4 17.5 19.3 20.4 22.7 24.6 26.0
Services 28.1 28.4 30.1 29.5 30.9 31.1 31.1 33.1 32.4 32.5 35.1 35.5 35.8 36.8 36.3 37.1 37.3 37.6
Expenditure on GDP at current market prices 360321 472774 604729 791980 1119509 1609776 2190320 2552733 I 3548472 5625255 7716616 9078929 12286765 I 16852758 23336113 29233288 33905666 40507942
Private consumption 319191 417230 523876 701220 987465 1420612 1905275 2237476 I 3139927 5049922 6865742 7965511 10682305 I 14291377 19861427 24141260 28542971 31731871
Government consumption
Gross fixed capital formation 37466 54596 82582 118313 150240 206912 255408 300981 I 413182 551749 850124 1069021 1563754 I 2282421 3390475 4599845 6436829 9073444
Increase in stocks 7360 3875 3540 -21262 -10276 -7605 38859 16709 I -2609 19095 418 39689 57041 I 23996 65194 -29231 -43199 106080
Page 1 of 9
2. ASIAN DEVELOPMENT BANK
Myanmar
Item 1993 1994 1995 1996 1997 1998 1999 2000 2001 2002 2003 2004 2005 2006 2007 2008 2009 2010
Exports of goods and services 4228 5405 5033 5488 6447 6728 7043 12639 I 16350 19399 13730 16046 19803 I 29295 33995 32214 38673 46150
Less: Imports of goods and services 7923 8332 10302 11779 14366 16871 16265 15073 I 18378 14910 13398 11339 11514 I 16835 18419 24874 22837 35508
Statistical discrepancy – – – – – – – –I – – – – -24623 I 242504 3441 514074 -1046771 -414095
Structure of Demand percent of GDP at current market prices
Private consumption 88.6 88.3 86.6 88.5 88.2 88.2 87.0 87.7 88.5 89.8 89.0 87.7 86.9 84.8 85.1 82.6 84.2 78.3
Government consumption
Gross domestic capital formation 12.4 12.4 14.2 12.3 12.5 12.4 13.4 12.4 11.6 10.1 11.0 12.2 13.2 13.7 14.8 15.6 18.9 22.7
Exports of goods and services 1.2 1.1 0.8 0.7 0.6 0.4 0.3 0.5 0.5 0.3 0.2 0.2 0.2 0.2 0.2 0.1 0.1 0.1
Imports of goods and services 2.2 1.8 1.7 1.5 1.3 1.0 0.7 0.6 0.5 0.3 0.2 0.1 0.1 0.1 0.1 0.1 0.1 0.1
Statistical discrepancy – – – – – – – – – – – – -0.2 1.4 0.0 1.8 -3.1 -1.0
At Constant Prices
GDP by industrial origin at 1985/1986 I 2000/2001
I 2005/2006 market prices 58064 62406 66742 71042 75123 79460 88157 100275 I 2842314 3184117 3624926 4116635 4675220 I 13893395 15559413 17155078 18970327 20946337
Agriculture 27095 28693 30072 31562 32729 34203 38124 42336 I 1588268 1684056 1881224 2087812 2339957 I 6290347 6789895 7170165 7569840 7926569
Mining 655 752 878 964 1209 1365 1860 2380 I 15771 20499 22278 25202 33171 I 98795 104782 119596 133257 151128
Manufacturing 5306 5757 6192 6477 6800 7222 8272 10171 I 222834 286802 350021 436429 532179 I 1919889 2326026 2750743 3273243 3937126
Electricity, gas, and water 592 620 660 745 878 830 948 1093 I 3177 3878 4461 4788 5707 I 30464 31935 35525 41771 52432
Construction 1804 2087 2654 3307 3631 3861 4031 4690 I 59603 95641 114527 129968 144271 I 531903 623381 736261 837560 942655
Trade 12649 13541 14307 15015 15760 16755 18354 20945 I 678933 750294 849925 958669 1074297 I 3009842 3357631 3680176 4044668 4460061
Transport and communications 2977 3364 3704 4062 4553 4891 5462 6799 I 184099 237445 283979 337215 392355 I 1652824 1922874 2211669 2569932 2915393
Finance 503 740 998 1216 1392 1628 1833 2131 I 3299 4799 5297 6748 10237 I 12048 14205 17550 22955 26340
Public administration 3944 4211 4471 4721 5018 5345 5719 5968 I 44685 50724 56175 64528 69937 I 122715 133660 143885 154320 173140
Others 2539 2641 2806 2973 3153 3360 3554 3762 I 41645 49979 57039 65276 73109 I 224568 255024 289508 322781 361493
Net factor income from abroad -88 -502 ... ... ... ... ... -4 I -164 -12 -7 -41 -2 I 225 302 205 124 163
GNI 57976 61904 ... ... ... ... ... 100271 I 2842150 3184105 3624919 4116594 4675218 I 13893620 15559715 17155283 18970451 20946500
Growth of Output annual change, percent
GDP 6.0 7.5 6.9 6.4 5.7 5.8 10.9 13.7 11.3 12.0 13.8 13.6 13.6 13.1 12.0 10.3 10.6 10.4
Agriculture 4.6 5.9 4.8 5.0 3.7 4.5 11.5 11.0 8.7 6.0 11.7 11.0 12.1 9.7 7.9 5.6 5.6 4.7
Industry 11.0 10.3 12.7 10.7 8.9 6.1 13.8 21.3 21.8 35.0 20.8 21.4 19.9 20.0 19.6 18.0 17.7 18.6
Services 6.1 8.3 7.3 6.5 6.7 7.0 9.2 13.4 12.9 14.8 14.6 14.4 13.1 14.2 13.2 11.6 12.2 11.6
Expenditure on GDP at 1985/1986 I 2000/2001 I
2005/2006 market prices 58064 62406 66742 71042 75123 79460 88157 100275 I 2842314 3184117 3624926 4116635 4675220 I 13893395 15559413 17155078 18970327 20946337
Private consumption 46795 47955 51027 52185 53131 54485 59218 61762 I 2518350 2821093 3174995 3546663 4064649 I 11781844 13242717 14169069 15969882 16408227
Government consumption
Gross fixed capital formation 10234 12640 16201 19887 21484 25037 27786 30898 I 328703 348871 449018 546450 708537 I 1947818 2478438 2965155 3997782 5266657
Increase in stocks 236 389 541 -975 -595 -129 566 648 I -2050 10693 -410 18267 24255 I 20292 45048 -16147 -23997 54797
Exports of goods and services 6229 6528 5090 5608 6959 6898 7364 13203 I 14035 17258 12940 14954 15495 I 24805 24025 20299 19883 23075
Less: Imports of goods and services 5431 5106 6117 5663 5857 6831 6777 6236 I 16724 13798 11617 9699 9917 I 16392 17609 23117 18750 29443
Statistical discrepancy – – – – – – – –I – – – – -127799 I 135028 -213206 39819 -974473 -776976
Page 2 of 9
3. Key Indicators for Asia and the Pacific 2011
Myanmar
Item 1993 1994 1995 1996 1997 1998 1999 2000 2001 2002 2003 2004 2005 2006 2007 2008 2009 2010
Growth of Demand annual change, percent
MYANMAR
Private consumption 7.5 2.5 6.4 2.3 1.8 2.5 8.7 4.3 12.5 12.0 12.5 11.7 14.6 11.6 12.4 7.0 12.7 2.7
Government consumption
Gross domestic capital formation 8.4 24.4 28.5 13.0 10.5 19.2 13.8 11.3 2.8 10.1 24.8 25.9 29.8 21.4 28.2 16.9 34.7 33.9
Exports of goods and services 15.8 4.8 -22.0 10.2 24.1 -0.9 6.8 79.3 16.6 23.0 -25.0 12.3 3.6 25.3 -3.1 -15.5 -2.0 16.1
Imports of goods and services 41.8 -6.0 19.8 -7.4 3.4 16.6 -0.8 -8.0 11.0 -17.5 -15.8 -16.5 2.2 42.4 7.4 31.3 -18.9 57.0
Investment Financing at Current Prices
Gross domestic capital formation 44826 58471 86122 97051 139964 199307 294267 317690 410573 570844 850542 1108711 1620795 2306417 3455669 4570614 6393630 9179524
Gross national saving 42798 57553 83285 93981 136028 193156 287337 317049 409702 576925 851820 1114224 1605465 2316006 3468167 ... ... ...
Gross domestic saving 41130 55544 80853 90759 132044 189164 285045 315257 408545 575889 851264 1113418 1604460 2315025 3466703 ... ... ...
Net factor income from abroad -429 -396 -689 -116 -69 34 -77 -118 -205 -20 -16 -91 -4 273 319 349 222 314
Net current transfers from abroad 2097 2405 3121 3338 4053 3958 2369 1910 1362 1056 572 897 1009 708 1145 ... ... ...
Savings and Investment percent of GDP at current market prices
Gross domestic saving 11.4 11.7 13.4 11.5 11.8 11.8 13.0 12.3 11.5 10.2 11.0 12.3 13.1 13.7 14.9 ... ... ...
Gross national saving 11.9 12.2 13.8 11.9 12.2 12.0 13.1 12.4 11.5 10.3 11.0 12.3 13.1 13.7 14.9 ... ... ...
Gross domestic capital formation 12.4 12.4 14.2 12.3 12.5 12.4 13.4 12.4 11.6 10.1 11.0 12.2 13.2 13.7 14.8 15.6 18.9 22.7
At Current Market Prices Kyats
Per capita GDP 8357 10764 13517 17379 24126 33426 44579 50927 69390 107823 144984 167205 221783 298173 405845 500741 573409 677617
Per capita GNI 8347 10755 13501 17377 24125 33426 44578 50925 69386 107823 144983 167203 221783 298178 405853 500747 573413 677622
PRODUCTION INDEXES period averages
Agriculture 1999–2001 = 100 74.0 78.0 80.0 83.0 83.0 85.0 91.0 100.0 108.0 113.0 122.0 130.0 142.0 156.0 162.0 161.0 160.0 ...
Mining b 1991/1992 = 100 136.1 159.0 181.1 194.2 ... ... ... ... ... ... ... ... ... ... ... ... ... ...
Manufacturing b 1991/1992 = 100 121.7 131.3 141.4 149.6 152.9 161.3 ... ... ... ... ... ... ... ... ... ... ... ...
ENERGY annual values
Crude petroleum thousand metric tons
Production 674 680 473 401 395 382 467 558 653 862 967 1011 1098 1049 1046 ... ... ...
Imports 215 329 480 365 647 685 ... ... 530 463 – – ... ... ... ... ... ...
Consumption 888 996 936 754 1036 1035 ... ... 1181 1449 1023 1060 ... ... ... ... ... ...
Coal thousand metric tons
Production 32 36 35 31 29 31 43 52 44 52 57 234 224 357 315 249 238 ...
Consumption 35 38 37 34 28 37 ... ... 56 57 113 117 ... ... ... ... ... ...
Natural gas c terajoules
Production 40550 50632 I 56717 61801 66998 126582 231466 315854 327391 348482 369087 398351 426597 452627 423929 399417 428271 ...
Consumption 40550 50632 I 56717 61495 66446 64045 ... ... 45225 46774 62146 64382 ... ... ... ... ... ...
Electricity d million kilowatt-hours
Production 3385 3594 I 3762 4130 4550 4139 4639 5522 4689 5068 5426 5608 6064 6164 6398 6622 5850 5456
Consumption e 3385 3594 I 2262 2434 2676 2716 2910 4087 3041 3484 3850 3909 4353 4355 4438 4701 4936 4579
Page 3 of 9
4. ASIAN DEVELOPMENT BANK
Myanmar
Item 1993 1994 1995 1996 1997 1998 1999 2000 2001 2002 2003 2004 2005 2006 2007 2008 2009 2010
Retail prices Kyats/liter
Gasoline, premium 3.52 4.34 5.50 5.50 ... ... ... ... ... ... ... ... ... ... ... ... ... ...
Diesel 2.31 3.18 4.40 4.40 ... ... ... ... ... ... ... ... ... ... ... ... ... ...
PRICE INDEXES period averages
Consumer (national) 1997 I 2006 = 100 … … … … 100.0 125.3 152.0 151.7 183.8 288.6 394.3 412.1 450.8 I 100.0 120.9 142.5 144.6 158.9
Food f … … … … 100.0 126.3 152.3 148.4 177.4 298.6 407.1 411.7 449.9 I 100.0 121.3 143.8 143.3 157.2
Nonfood … … … … 100.0 ... ... ... ... 267.3 366.8 413.6 452.5 I 100.0 120.0 139.5 147.2 173.8
Consumer (Yangon) 1986 I 1997 = 100 460.5 571.5 715.4 831.9 I 100.0 130.1 157.4 157.3 220.4 316.2 398.0 404.6 449.1 ... ... ... ... ...
Food f 547.7 658.4 828.8 985.2 I 100.0 129.2 159.9 155.8 197.0 324.5 416.3 413.5 456.5 ... ... ... ... ...
Nonfood 299.0 410.2 505.3 548.0 I 100.0 131.6 152.8 161.3 214.5 301.1 358.1 388.5 434.6 ... ... ... ... ...
Implicit GDP deflator 1985/1986 I 2000/2001 I
2005/2006 = 100 620.6 757.6 906.1 1114.8 1490.2 2025.9 2484.6 2545.7 I 124.8 176.7 212.9 220.5 262.8 I 121.3 150.0 170.4 178.7 193.4
Price Indexes annual change, percent
Consumer price index … … … … … 25.3 21.3 -0.2 21.2 57.0 36.6 4.5 9.4 20.0 20.9 17.9 1.5 9.9
Food price index … … … … … 26.3 20.6 -2.6 19.5 68.3 36.3 1.1 9.3 20.6 21.3 18.6 -0.4 9.7
Implicit GDP deflator 36.2 22.1 19.6 23.0 33.7 35.9 22.6 2.5 24.8 41.5 20.5 3.6 19.2 21.3 23.6 13.6 4.9 8.2
MONEY AND BANKING million Kyats; as of end of period
Money supply (M1) 74982 98323 131800 175049 231221 302277 370478 499663 760135 1086081 1247498 1595553 2018226 ... ... ... ... ...
Currency in circulation 68663 90659 119207 159608 205509 256605 296471 378000 551343 793275 1163953 1457210 1833796 ... ... ... ... ...
Demand deposits (excluding government deposits) 6319 7664 12593 15441 25712 45672 74007 121663 208792 292806 83545 138343 184430 237178 298500 367053 526310 879448
Quasi-money 23636 33737 53730 82617 101014 151158 216956 335653 449815 538082 380012 594029 698208 903722 1172251 1569955 2226508 3295008
Money supply (M2) 98618 132060 185530 257666 332235 453435 587434 835316 1209950 1624163 1627510 2189582 2716434 ... ... ... ... ...
Foreign assets (net) 1218 1541 1558 1121 1328 1725 1436 1222 1099 1563 1987 2573 3453 ... ... ... ... ...
Domestic credit 113603 143240 186369 254071 325688 414858 505833 686011 1060764 1439584 1576319 2119804 2736995 3416683 4330105 4770512 7235129 10177683
Claims on government sector 90073 114969 140669 181067 212969 279950 329957 445427 673140 890773 1260685 1684482 2159211 2760439 3533040 3878954 6064064 8292180
Claims on private sector 23530 28271 45700 73004 112719 134908 175876 240584 387624 548811 315634 435322 577784 656244 797065 891558 1171065 1885503
Other items -16203 -12721 -2397 2474 5219 36852 80165 148083 148087 183016 49204 67205 -24014 -3940 22841 -282643 374347 150957
Money supply (M2) annual change, percent 26.8 33.9 40.5 38.9 28.9 36.5 29.6 42.2 44.8 34.2 0.2 34.5 24.1 ... ... ... ... ...
M2 percent of GDP at current market prices 27.4 27.9 30.7 32.5 29.7 28.2 26.8 32.7 34.1 28.9 21.1 24.1 22.1 ... ... ... ... ...
Deposit Money Banks
Demand deposits g 6319 7664 12593 15441 25712 45672 74007 121663 208792 292806 83545 138343 184430 237178 298500 367053 526310 880050
Savings deposits 19630 28465 46419 72153 88732 127759 191811 300704 399534 456556 354434 570696 674392 877027 1142249 1527130 2179101 3163527
GOVERNMENT FINANCE million Kyats; fiscal year beginning 1 April
Central Government
Total revenue and grants 27525 32187 39594 54832 86783 116961 107006 107887 ... ... ... ... ... ... ... ... ... ...
Total revenue 27525 32187 39594 54832 86783 116961 107006 107887 ... ... ... ... ... ... ... ... ... ...
Current revenue 26327 31588 38743 54341 85980 116881 106598 107693 ... ... ... ... ... ... ... ... ... ...
Taxes 17036 20101 22644 31357 49429 56653 49920 49944 ... ... ... ... ... ... ... ... ... ...
Nontaxes 9291 11487 16099 22984 36551 60228 56678 57749 ... ... ... ... ... ... ... ... ... ...
Page 4 of 9
5. Key Indicators for Asia and the Pacific 2011
Myanmar
Item 1993 1994 1995 1996 1997 1998 1999 2000 2001 2002 2003 2004 2005 2006 2007 2008 2009 2010
Capital receipts 1198 599 851 491 803 80 408 194 ... ... ... ... ... ... ... ... ... ...
MYANMAR
Grants h ... ... ... ... ... ... ... ... ... ... ... ... ... ... ... ... ... ...
Total expenditure and net lending 32393 44129 59247 72519 87933 104187 112394 89778 ... ... ... ... ... ... ... ... ... ...
Total expenditure i 32393 44129 59247 72519 87933 104187 112394 89778 ... ... ... ... ... ... ... ... ... ...
Current expenditure 20089 23984 27426 29599 37568 43268 51998 51373 ... ... ... ... ... ... ... ... ... ...
Capital expenditure 12304 20145 31821 42920 50365 60919 60396 38405 ... ... ... ... ... ... ... ... ... ...
Net lending ... ... ... ... ... ... ... ... ... ... ... ... ... ... ... ... ... ...
Current surplus/deficit 6238 7604 11317 24742 48412 73613 54600 56320 ... ... ... ... ... ... ... ... ... ...
Capital account surplus/deficit -11106 -19546 -30970 -42429 -49562 -60839 -59988 -38211 ... ... ... ... ... ... ... ... ... ...
Overall budgetary surplus/deficit -4868 -11942 -19653 -17687 -1150 12774 -5388 18109 ... ... ... ... ... ... ... ... ... ...
Financing
Domestic borrowing ... ... ... ... ... ... ... ... ... ... ... ... ... ... ... ... ... ...
Foreign borrowing ... ... ... ... ... ... ... ... ... ... ... ... ... ... ... ... ... ...
Use of cash balances ... ... ... ... ... ... ... ... ... ... ... ... ... ... ... ... ... ...
Government Finance percent of GDP at current market prices
Total revenue 7.6 6.8 6.5 6.9 7.8 7.3 4.9 4.2 ... ... ... ... ... ... ... ... ... ...
Taxes 4.7 4.3 3.7 4.0 4.4 3.5 2.3 2.0 ... ... ... ... ... ... ... ... ... ...
Total expenditure 9.0 9.3 9.8 9.2 7.9 6.5 5.1 3.5 ... ... ... ... ... ... ... ... ... ...
Overall budgetary surplus/deficit -1.4 -2.5 -3.2 -2.2 -0.1 0.8 -0.2 0.7 ... ... ... ... ... ... ... ... ... ...
EXTERNAL TRADE million Kyats; fiscal year beginning 1 April
Exports, fob 4228 5405 5044 5488 6447 6756 8947 12736 17131 19955 14119 16697 20647 30026 35297 37028 41289 49107
Imports, cif 7923 8332 10302 11779 14366 16872 16265 15073 18378 14910 13398 11339 11514 16835 18419 24874 22837 35508
Trade balance -3696 -2927 -5258 -6291 -7919 -10116 -7318 -2337 -1247 5045 722 5358 9133 13191 16878 12154 18452 13598
External Trade annual change, percent
Exports 15.7 27.8 -6.7 8.8 17.5 4.8 32.4 42.3 34.5 16.5 -29.2 18.3 23.7 45.4 17.6 4.9 11.5 18.9
Imports 47.7 5.2 23.6 14.3 22.0 17.4 -3.6 -7.3 21.9 -18.9 -10.1 -15.4 1.5 46.2 9.4 35.0 -8.2 55.5
Direction of Trade million US Dollars; calendar year
Exports, total 864.4 939.8 1197.9 1183.1 1132.1 1138.6 1393.3 1980.3 2625.5 2756.0 2767.1 3157.6 3701.6 4520.0 4838.8 6663.4 5916.2 6413.0
1. Thailand – 28.8 36.5 – – – 102.6 233.0 735.4 831.2 827.0 1230.3 1623.0 2135.7 2104.9 3446.5 2549.0 2590.3
2. India 106.5 109.5 145.9 134.9 168.6 169.4 156.5 162.9 179.8 314.2 355.2 363.7 450.9 653.1 729.8 829.6 1086.6 1198.6
3. China, People’s Rep. of 149.7 129.8 136.0 125.0 66.7 56.0 92.3 113.5 122.0 124.5 154.1 188.0 249.5 229.7 336.9 585.9 586.9 873.6
4. Japan 65.0 68.8 85.5 93.9 90.0 81.3 92.2 108.4 92.8 100.3 126.9 163.5 184.8 225.6 269.2 288.6 309.5 353.4
5. Malaysia 52.4 25.0 37.6 36.3 51.0 52.1 52.2 63.2 71.1 69.8 72.6 97.1 121.5 113.5 126.6 162.5 131.3 134.9
6. Germany 12.9 16.9 24.2 28.2 34.2 45.0 54.4 77.8 100.3 73.1 94.0 118.3 102.2 114.9 110.2 90.5 73.0 71.0
7. Korea, Rep. of 13.1 9.8 12.0 16.4 15.3 12.0 14.2 20.6 46.1 51.1 26.6 27.4 51.1 87.7 73.4 105.7 71.2 73.2
8. Singapore 101.3 127.5 192.0 190.7 157.2 109.1 90.3 99.8 102.1 97.3 76.2 64.5 98.5 63.2 55.6 80.0 106.6 74.8
9. Viet Nam – – – 0.5 1.3 1.3 1.1 3.3 3.6 5.4 16.6 17.5 41.6 58.7 68.5 68.7 59.1 60.7
10. Bangladesh 6.0 6.9 4.2 3.2 2.4 11.1 12.5 20.0 17.9 21.6 30.2 24.8 29.3 24.5 27.0 75.7 62.3 63.8
Page 5 of 9
6. ASIAN DEVELOPMENT BANK
Myanmar
Item 1993 1994 1995 1996 1997 1998 1999 2000 2001 2002 2003 2004 2005 2006 2007 2008 2009 2010
Imports, total 1280.1 1538.2 2341.6 2677.8 2861.5 2358.5 2527.7 3039.9 2663.3 2970.4 3228.5 3459.5 3577.7 3912.6 5596.5 6976.6 7082.8 9589.4
1. China, People’s Rep. of 357.2 406.0 679.6 573.2 626.7 586.2 447.2 546.0 547.3 797.3 998.7 1032.4 1028.4 1328.0 1861.1 2177.1 2507.0 3828.8
2. Thailand – – – – – – 435.3 554.7 390.5 355.9 483.3 665.4 777.3 837.9 1054.6 1448.7 1693.6 2280.2
3. Singapore 368.0 430.3 701.2 794.1 777.3 501.3 460.2 479.7 465.6 576.6 716.0 717.1 656.1 619.6 855.8 1415.0 978.8 1271.9
4. Korea, Rep. of 46.2 62.0 95.0 143.9 150.5 163.7 205.9 318.2 255.3 157.8 202.4 178.2 132.0 133.4 321.2 268.2 446.8 459.1
5. Malaysia 114.3 243.5 252.3 242.8 407.5 322.6 257.7 254.1 216.7 263.1 154.3 164.3 270.3 181.5 231.6 346.3 232.5 239.0
6. Indonesia 43.7 38.7 66.5 85.8 164.7 184.1 81.8 71.2 75.9 59.8 50.2 66.3 85.8 151.5 288.6 275.8 192.2 312.6
7. India 15.9 26.4 23.4 50.5 50.2 38.4 36.4 52.9 58.4 78.7 94.6 115.2 122.5 146.0 191.4 259.6 230.8 234.0
8. Japan 110.0 74.6 173.4 279.4 232.2 205.5 203.5 215.6 205.3 126.9 137.0 115.8 101.0 114.1 194.0 207.2 222.1 290.5
9. Korea, Democratic Rep. of 5.8 6.9 8.4 9.9 10.9 12.4 13.1 15.0 16.6 18.0 22.8 30.0 34.2 42.3 52.5 59.9 52.4 53.9
10. Germany 38.7 29.4 39.0 50.8 57.9 55.8 61.5 44.7 18.4 20.1 15.9 27.9 35.8 44.1 58.3 59.6 58.3 33.8
BALANCE OF PAYMENTS million US Dollars; calendar year
Current account -227.8 -129.9 -258.5 -279.9 -412.1 -494.3 -281.8 -242.9 -169.3 9.2 -20.5 -79.2 589.7 786.9 1853.0 1369.1 729.6 1833.7
Balance on goods -629.9 -609.4 -823.0 -931.2 -1132.1 -1386.1 -878.5 -516.1 58.2 378.9 789.6 464.0 2038.2 2196.3 3252.3 3027.8 2721.7 3497.8
Exports 630.9 857.4 933.2 937.9 974.5 1065.1 1281.1 1618.8 2442.5 2525.6 2687.2 2445.8 3810.3 4531.1 6279.3 6915.6 6673.1 7928.2
Imports -1260.8 -1466.8 -1756.3 -1869.1 -2106.6 -2451.2 -2159.6 -2134.9 -2384.3 -2146.7 -1897.6 -1981.8 -1772.1 -2334.8 -3027.0 -3887.8 -3951.4 -4430.4
Services and income 58.1 74.8 8.3 81.7 64.5 260.9 216.0 -24.0 -431.3 -530.4 -904.2 -699.3 -1623.6 -1531.8 -1605.2 -1946.1 -2254.1 -1902.6
Credit 251.3 277.8 376.3 436.8 528.2 637.0 558.2 556.5 445.2 408.0 276.2 289.9 316.7 412.3 481.8 459.7 399.6 498.2
Debit -193.2 -203.0 -368.0 -355.1 -463.7 -376.1 -342.2 -580.5 -876.5 -938.4 -1180.4 -989.2 -1940.3 -1944.1 -2087.0 -2405.8 -2653.7 -2400.8
Current transfers 344.1 404.6 556.2 569.6 655.4 630.9 380.7 297.2 203.8 160.7 94.1 156.1 175.1 122.4 205.9 287.4 262.0 238.5
Credit 344.6 405.2 564.2 598.4 685.1 631.2 381.0 297.3 218.1 184.5 116.9 181.9 199.1 161.2 233.2 340.6 326.0 347.3
Debit -0.5 -0.6 -8.0 -28.8 -29.7 -0.3 -0.3 -0.1 -14.3 -23.8 -22.8 -25.8 -24.0 -38.8 -27.3 -53.2 -64.0 -108.7
Capital account – – – – – – – – – – – – – – – – – –
Financial account 160.8 185.2 242.8 266.8 469.1 535.2 248.8 160.1 117.3 96.4 136.3 211.2 167.2 194.8 572.2 982.1 ... ...
Direct investment 104.7 126.1 277.2 310.4 387.2 314.5 253.1 254.8 210.9 189.7 249.5 268.9 238.8 277.4 477.1 784.0 ... ...
Portfolio investment – – – – – – – – – – – – – – – – – –
Other investment 56.1 59.1 -34.4 -43.6 81.9 220.7 -4.3 -94.7 -93.6 -93.3 -113.2 -57.7 -71.6 -82.6 95.1 198.1 ... ...
Net errors and omissions -10.0 -10.3 -16.2 -11.7 -26.1 18.7 -12.3 59.6 230.0 -36.6 -40.4 -7.2 -625.2 ... ... ... ... ...
Overall balance -77.0 44.9 -31.9 -24.8 30.9 59.6 -45.4 -23.2 178.0 69.0 75.4 124.8 131.7 ... ... ... ... ...
Reserves and related items 77.0 -45.0 31.8 24.7 -31.0 -59.7 45.4 23.3 -178.0 -69.0 -75.4 -124.8 -131.7 ... ... ... ... ...
Reserve assets 77.0 -45.0 31.8 24.7 -31.0 -59.7 45.4 23.3 -178.0 -69.0 -75.4 -124.8 -131.7 ... ... ... ... ...
Use of Fund credit and loans – – – – – – – – – – – – – – – – – –
Balance of Payments percent of GDP at current market prices
Exports 1.1 1.1 0.9 0.7 0.5 0.4 0.4 0.4 0.5 0.3 0.2 0.2 0.2 0.2 0.1 0.1 0.1 0.1
Imports -2.1 -1.8 -1.6 -1.4 -1.2 -1.0 -0.6 -0.5 -0.4 -0.3 -0.1 -0.1 -0.1 -0.1 -0.1 -0.1 -0.1 -0.1
Balance on goods -1.1 -0.8 -0.8 -0.7 -0.6 -0.5 -0.2 -0.1 0.0 0.0 0.1 0.0 0.1 0.1 0.1 0.1 0.0 0.0
Current account balance -0.4 -0.2 -0.2 -0.2 -0.2 -0.2 -0.1 -0.1 -0.0 0.0 -0.0 -0.0 0.0 0.0 0.0 0.0 0.0 0.0
Overall balance -0.1 0.1 -0.0 -0.0 0.0 0.0 -0.0 -0.0 0.0 0.0 0.0 0.0 0.0 ... ... ... ... ...
INTERNATIONAL RESERVES million US Dollars; as of end of period
Total 315.0 434.9 573.2 240.8 260.7 326.3 276.6 233.5 410.6 481.0 562.3 684.7 782.3 1247.8 ... ... ... ...
Gold, national valuation 12.1 12.8 12.0 11.6 10.9 11.4 11.1 10.6 10.2 11.0 12.0 12.6 11.6 12.2 ... ... ... ...
Foreign exchange 302.6 421.9 561.1 229.1 249.7 314.6 265.3 222.8 399.9 469.9 550.1 672.1 770.5 1235.4 ... ... ... ...
Reserve position in the Fund – – – – – – – – – – – – – – – – – –
SDRs 0.3 0.1 0.1 0.1 0.1 0.3 0.2 0.1 0.6 0.1 0.1 0.0 0.2 0.2 0.4 0.1 113.3 2.6
Page 6 of 9
7. Key Indicators for Asia and the Pacific 2011
Myanmar
Item 1993 1994 1995 1996 1997 1998 1999 2000 2001 2002 2003 2004 2005 2006 2007 2008 2009 2010
EXCHANGE RATES Kyats per US Dollar
MYANMAR
End of period 6.194 5.828 5.724 5.917 6.306 6.043 6.199 6.530 6.770 6.258 5.726 5.479 5.953 5.656 5.384 5.524 5.427 5.525
Average of period 6.094 5.945 5.611 5.861 6.184 6.274 6.223 6.426 6.684 6.573 6.076 5.746 5.761 5.784 5.560 5.388 5.519 5.578
EXTERNAL INDEBTEDNESS million US Dollars; as of end of fiscal year
Total debt outstanding and disbursed 5752.1 6555.4 5770.7 5184.8 5503.9 5647.4 6003.6 5974.9 5763.1 6727.6 7509.4 7483.0 7011.7 7261.9 8237.2 8001.7 8185.9 ...
Long-term debt 5389.8 6153.8 5377.7 4804.0 5069.5 5053.1 5337.1 5287.1 5095.3 5525.1 6061.3 5924.8 5515.4 5608.7 6220.7 6121.0 6320.1 ...
Public and publicly guaranteed 5389.8 6153.8 5377.7 4804.0 5069.5 5053.1 5337.1 5287.1 5095.3 5525.1 6061.3 5924.8 5515.4 5608.7 6220.7 6121.0 6320.1 ...
Private nonguaranteed – – – – – – – – – – – – – – – – – ...
Short-term debt 362.3 401.6 393.0 380.8 434.3 594.2 666.4 687.8 667.8 1202.5 1448.1 1558.2 1496.3 1653.2 2016.5 1880.7 1865.8 ...
Use of IMF credit – – – – – – – – – – – – – – – – – ...
External debt percent of GNI ... ... ... ... ... ... ... ... ... ... ... ... ... ... ... ... ... ...
Total long-term debt percent of total debt 93.7 93.9 93.2 92.7 92.1 89.5 88.9 88.5 88.4 82.1 80.7 79.2 78.7 77.2 75.5 76.5 77.2 ...
Short-term debt percent of total debt 6.3 6.1 6.8 7.3 7.9 10.5 11.1 11.5 11.6 17.9 19.3 20.8 21.3 22.8 24.5 23.5 22.8 ...
Debt service percent of
exports of goods and services 12.5 14.3 18.9 11.4 7.6 5.4 5.2 1.7 1.4 2.2 1.7 2.0 1.7 1.3 ... ... ... ...
Debt service million US Dollars; transactions during the fiscal year
Principal repayments on long-term debt 21.9 42.0 180.2 139.4 100.9 78.9 64.4 21.9 29.6 50.6 32.6 32.3 25.5 9.4 11.4 10.1 9.0 731.3
Interest on long-term debt 88.9 120.2 67.8 17.7 13.3 8.7 23.8 2.0 2.5 2.3 2.8 2.3 1.4 1.1 2.2 2.1 2.0 30.7
Interest on short-term debt 0.5 0.8 1.9 0.7 1.8 5.5 8.2 12.3 8.2 10.9 14.4 30.4 44.3 54.0 40.2 21.1 18.0 ...
Average terms of new commitments
Interest percent per annum 2.3 0.5 1.4 1.4 7.0 3.3 – – – – – – – – – – – ...
Maturity years 6.2 7.5 14.4 11.1 12.5 7.6 – – – – – – – – – – – ...
Grace period years 1.0 2.1 8.7 3.2 1.4 3.0 – – – – – – – – – – – ...
Grant element percent 22.7 25.6 39.1 40.2 12.8 25.8 – – – – – – – – – – – ...
a Estimates of GDP for base year 2000 and 2005 are based on the old series. Further verification are ongoing to improve the estimates of the national accounts.
b For fiscal year beginning 1 April.
c From 1995 onward, data are for fiscal year beginning 1 April. Million cubic feet figures were converted to terajoules using 1.055 as conversion factor.
d From 1995 onward, data are for fiscal year beginning 1 April. From 2001 onward, data refers only to those gathered through the Myanmar Electric Power Enterprise, which is the main distributor of electric power in Myanmar.
e From 2002 onward, data refer to units sold by the Myanmar Electric Power Enterprise.
f Includes beverages.
g Excludes government deposits.
h Grants cannot be disaggregated from foreign borrowings (net) under financing items.
i Current and capital expenditures include special accounts (except foreign loans account) and representative bodies.
Page 7 of 9
8. ASIAN DEVELOPMENT BANK
Myanmar
Sources:
Population For 1993, Review of the Financial, Economic and Social Conditions 1995/96; Ministry of National Planning and Economic Development.
For 1994–2010, official communication, 31 May 2011; past communication. Central Statistical Organization.
Urban Population World Development Indicators & Global Development Finance (databank.worldbank.org/ddp/home.do, downloaded June 2011). World Bank.
Labor Force For 1993–1995, Review of the Financial, Economic and Social Conditions 1995/96; past issues. Ministry of National Planning and Economic Development.
For 1996–2003, official communication, 5 June 2007; past communication. Central Statistical Organization.
For 2004–2009, LABORSTAT (www.data.un.org/Data.aspx?d=ILO&f=srID%3a4230, downloaded June 2010). International Labour Organization.
Labor Force Participation Rate Official communication, 7 May 2009; past communication. Central Statistical Organization.
Unemployment Rate For 2009, ASEAN Stats (www.aseansec.org/181350htm, downloaded May 2010). Association of Southeast Asian Nations Secretariat.
National Accounts For 1993–2010 official communication, 31 May 2011; past communication. Central Statistical Organization.
Production Indexes
Agriculture FAOSTAT (faostat.fao.org/site/612/default.aspx#ancor, downloaded June 2011). Food and Agriculture Organization.
Mining Official communication, 24 August 1999; other publications. Ministry of National Planning and Economic Development.
Manufacturing
Energy
Crude Petroleum
Production Energy Statistics Database (www.data.un.org/Data.aspx?d=ILO&f=srID%3a4230, downloaded June 2011). United Nations.
Consumption Energy Statistics Yearbook 2004; past issues. United Nations.
Imports
Coal For 1993–1994, Energy Statistics Yearbook 1995; past issues. United Nations.
For 1995–2009, official communication, 31 May 2011; past communication. Central Statistical Organization.
Natural Gas
Production For 1993–1994, Energy Statistics Yearbook 2004; past issues. United Nations.
For 1995–2009, official communication, 31 May 2011; past communication; offical website (www.csostat.gov.mm/S08MA0207.asp). Central Statistical Organization.
Consumption Energy Statistics Yearbook 2004; past issues. United Nations.
Electricity For 1993–1994, Energy Statistics Yearbook 1995; past issues. United Nations.
For 1995–2009, official communication, 31 May 2011; past communication; other publications; official website (www.csostat.gov.mm). Central Statistical Organization.
Retail Prices Official communication, 11 April 1997; past communication. Central Statistical Organization.
Price Indexes Official communication, 31 May 2011; past communication; official website (www.csostat.gov.mm). Central Statistical Organization.
Money and Banking Official communication, 9 June 2011; past communication. Ministry of National Planning and Economic Development.
Page 8 of 9
9. Key Indicators for Asia and the Pacific 2011
Myanmar
Government Finance Official communication, 22 June 2001; past communication. Central Statistical Organization.
External Trade Official communication, 31 May 2011; past communication; official website (www.csostat.gov.mm). Central Statistical Organization.
MYANMAR
Direction of Trade Direction of Trade Statistics CD-ROM, May 2011. International Monetary Fund.
Balance of Payments Official communication, 9 June 2011; past communication. Ministry of National Planning and Economic Development.
International Reserves International Financial Statistics CD-ROM, May 2011. International Monetary Fund.
Exchange Rates
External Indebtedness World Development Indicators & Global Development Finance (databank.worldbank.org/ddp/home.do, downloaded May 2011). World Bank.
Page 9 of 9