Download as PDF, PPTX


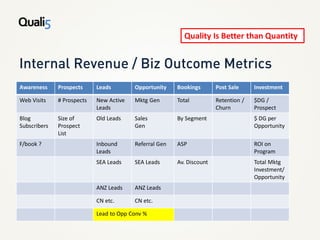
![Area Why Backward / Lagging Current / What's Future / Leading
Working
Revenue/ Impact on • Actual Vs. • Conversion • Marking
Company Target Rate Projections..
[ Topline impact ] Revenue • Prospect DB
Program Financial • Investment • Response • Projected
Performance Contribution of Return Rate Contribution
Programs • Program ROI
[Efficiency /
Effectiveness]
Customer Lifetime Value of • ASP • Cost to • NPS
Profitability a Customer Acquire a • Retention
New Cust
[Intangible]](https://image.slidesharecdn.com/q5-keymarketingmetrics-110815085128-phpapp01/85/Q5-key-marketing-metrics-5-320.jpg)

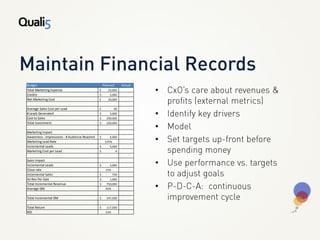
This document outlines key marketing metrics for a company including budgets, leads generated, costs, and returns. The total marketing expense was $25,000 with $5,000 in credits, for a net cost of $20,000. They generated 5,000 leads at a cost of $40 per lead, for a total investment of $220,000. The marketing generated 5,000 incremental leads, 750 incremental sales of $1,000 each, for $750,000 in incremental revenue and $337,500 in incremental gross margin. The total return was $117,500 and the ROI was 53%.


