
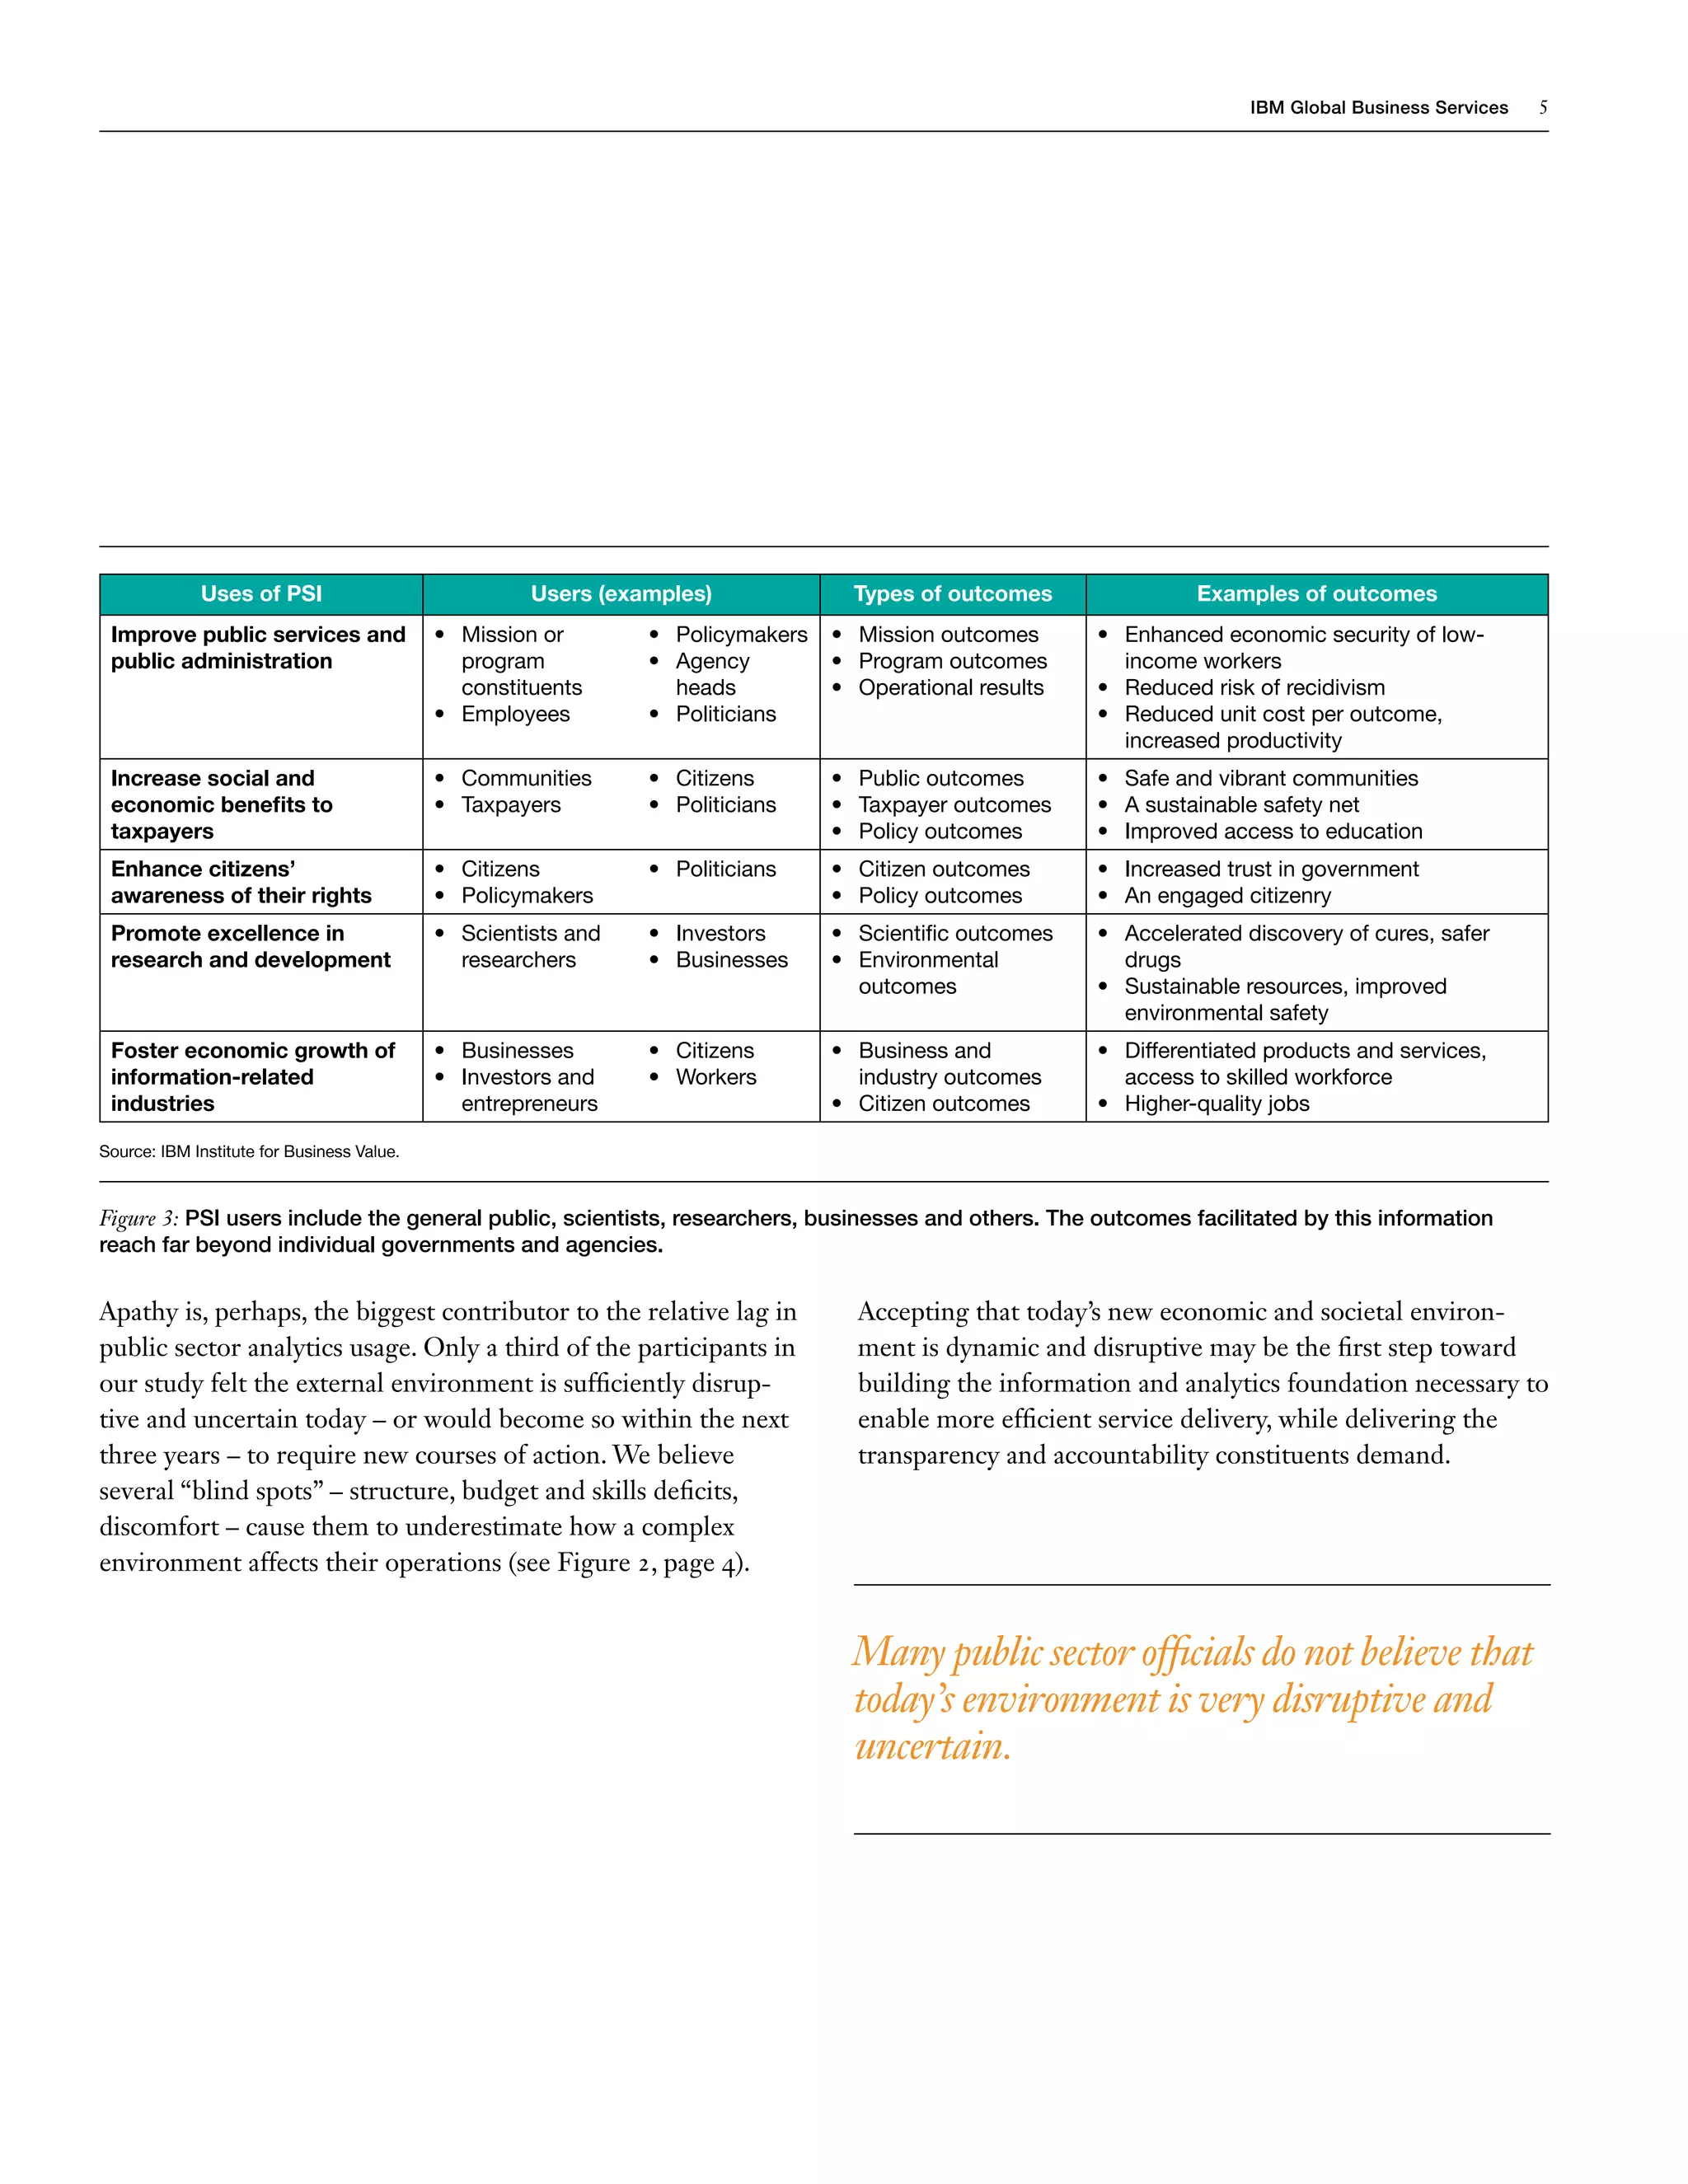
![IBM Global Business Services 3
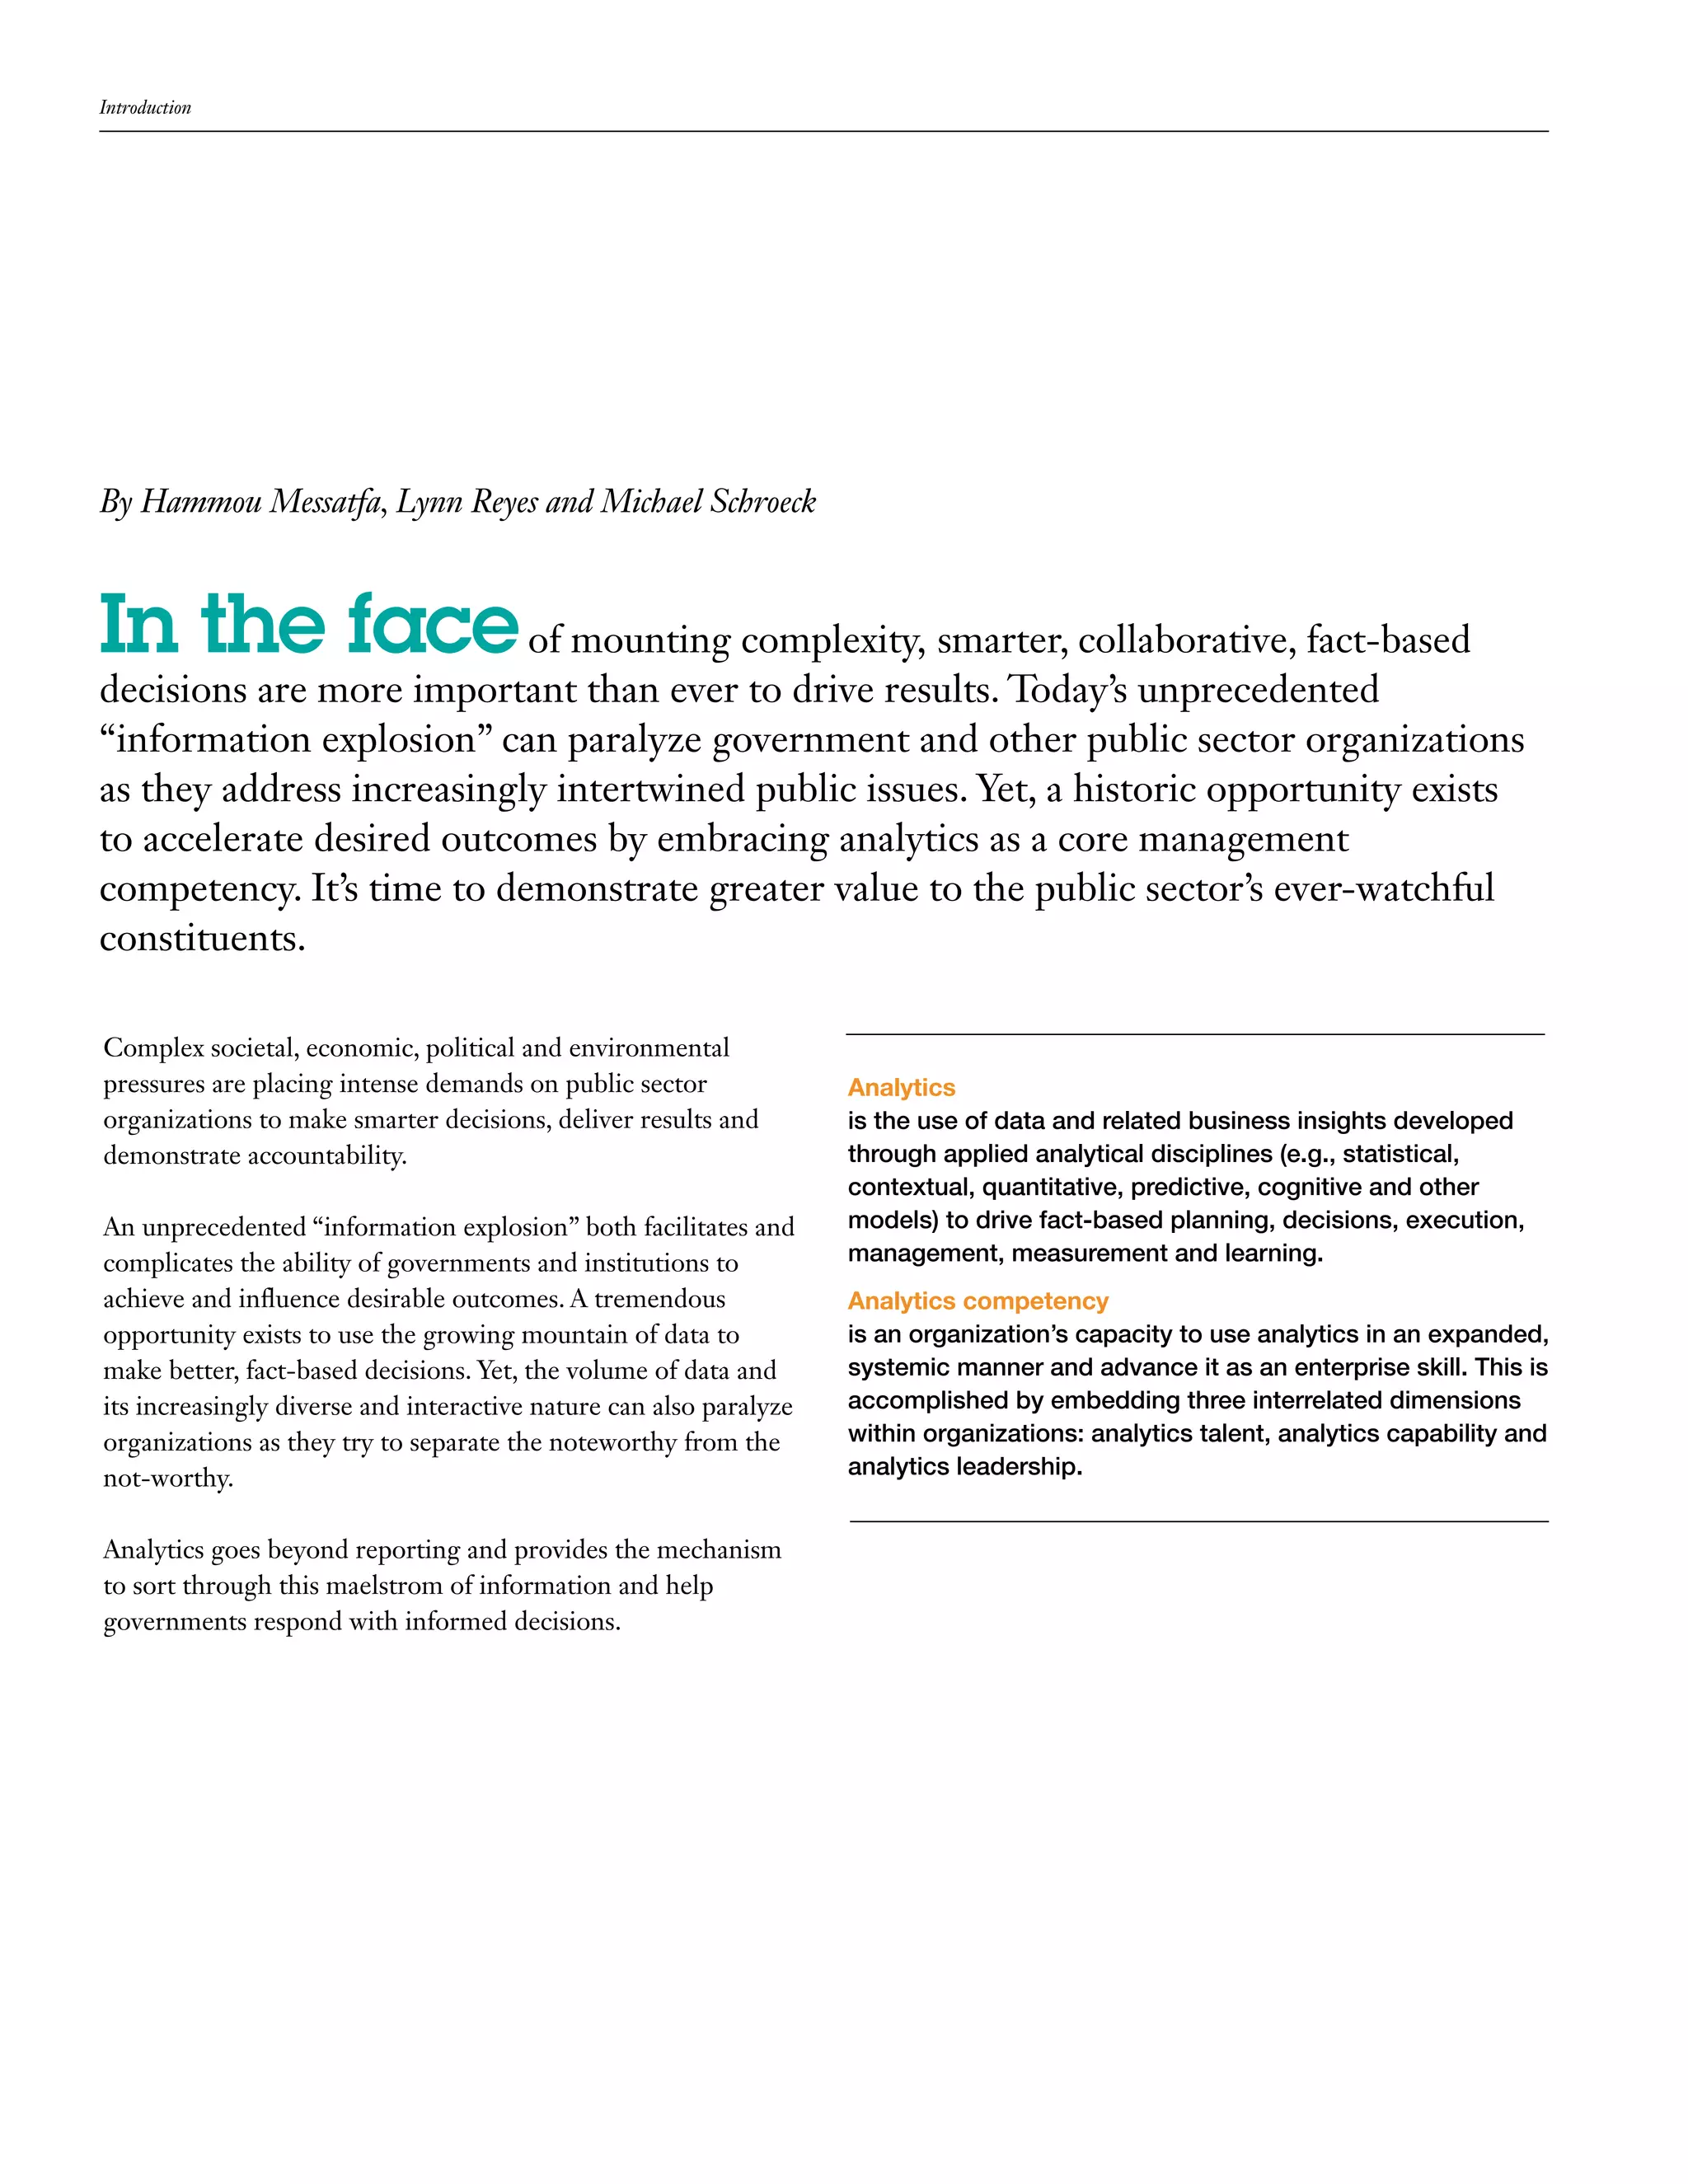
Immense complexity – new challenges
and roles for analytics “Across the country, all are struggling at a
Governments around the world have been affected by
economic fluctuation. Many governments are either burdened minimum level to figure out how to deliver
with deficits or contending with the mounting cost of public services. For those at the leading edge . . . [it’s]...
administration. Increasing complexity, volatility and uncer-
rethinking and finding new models . . . new
tainty compromises their ability to demonstrate fiscal responsi-
bility. ways to deliver services and think of what the
local government of the future would look like.”
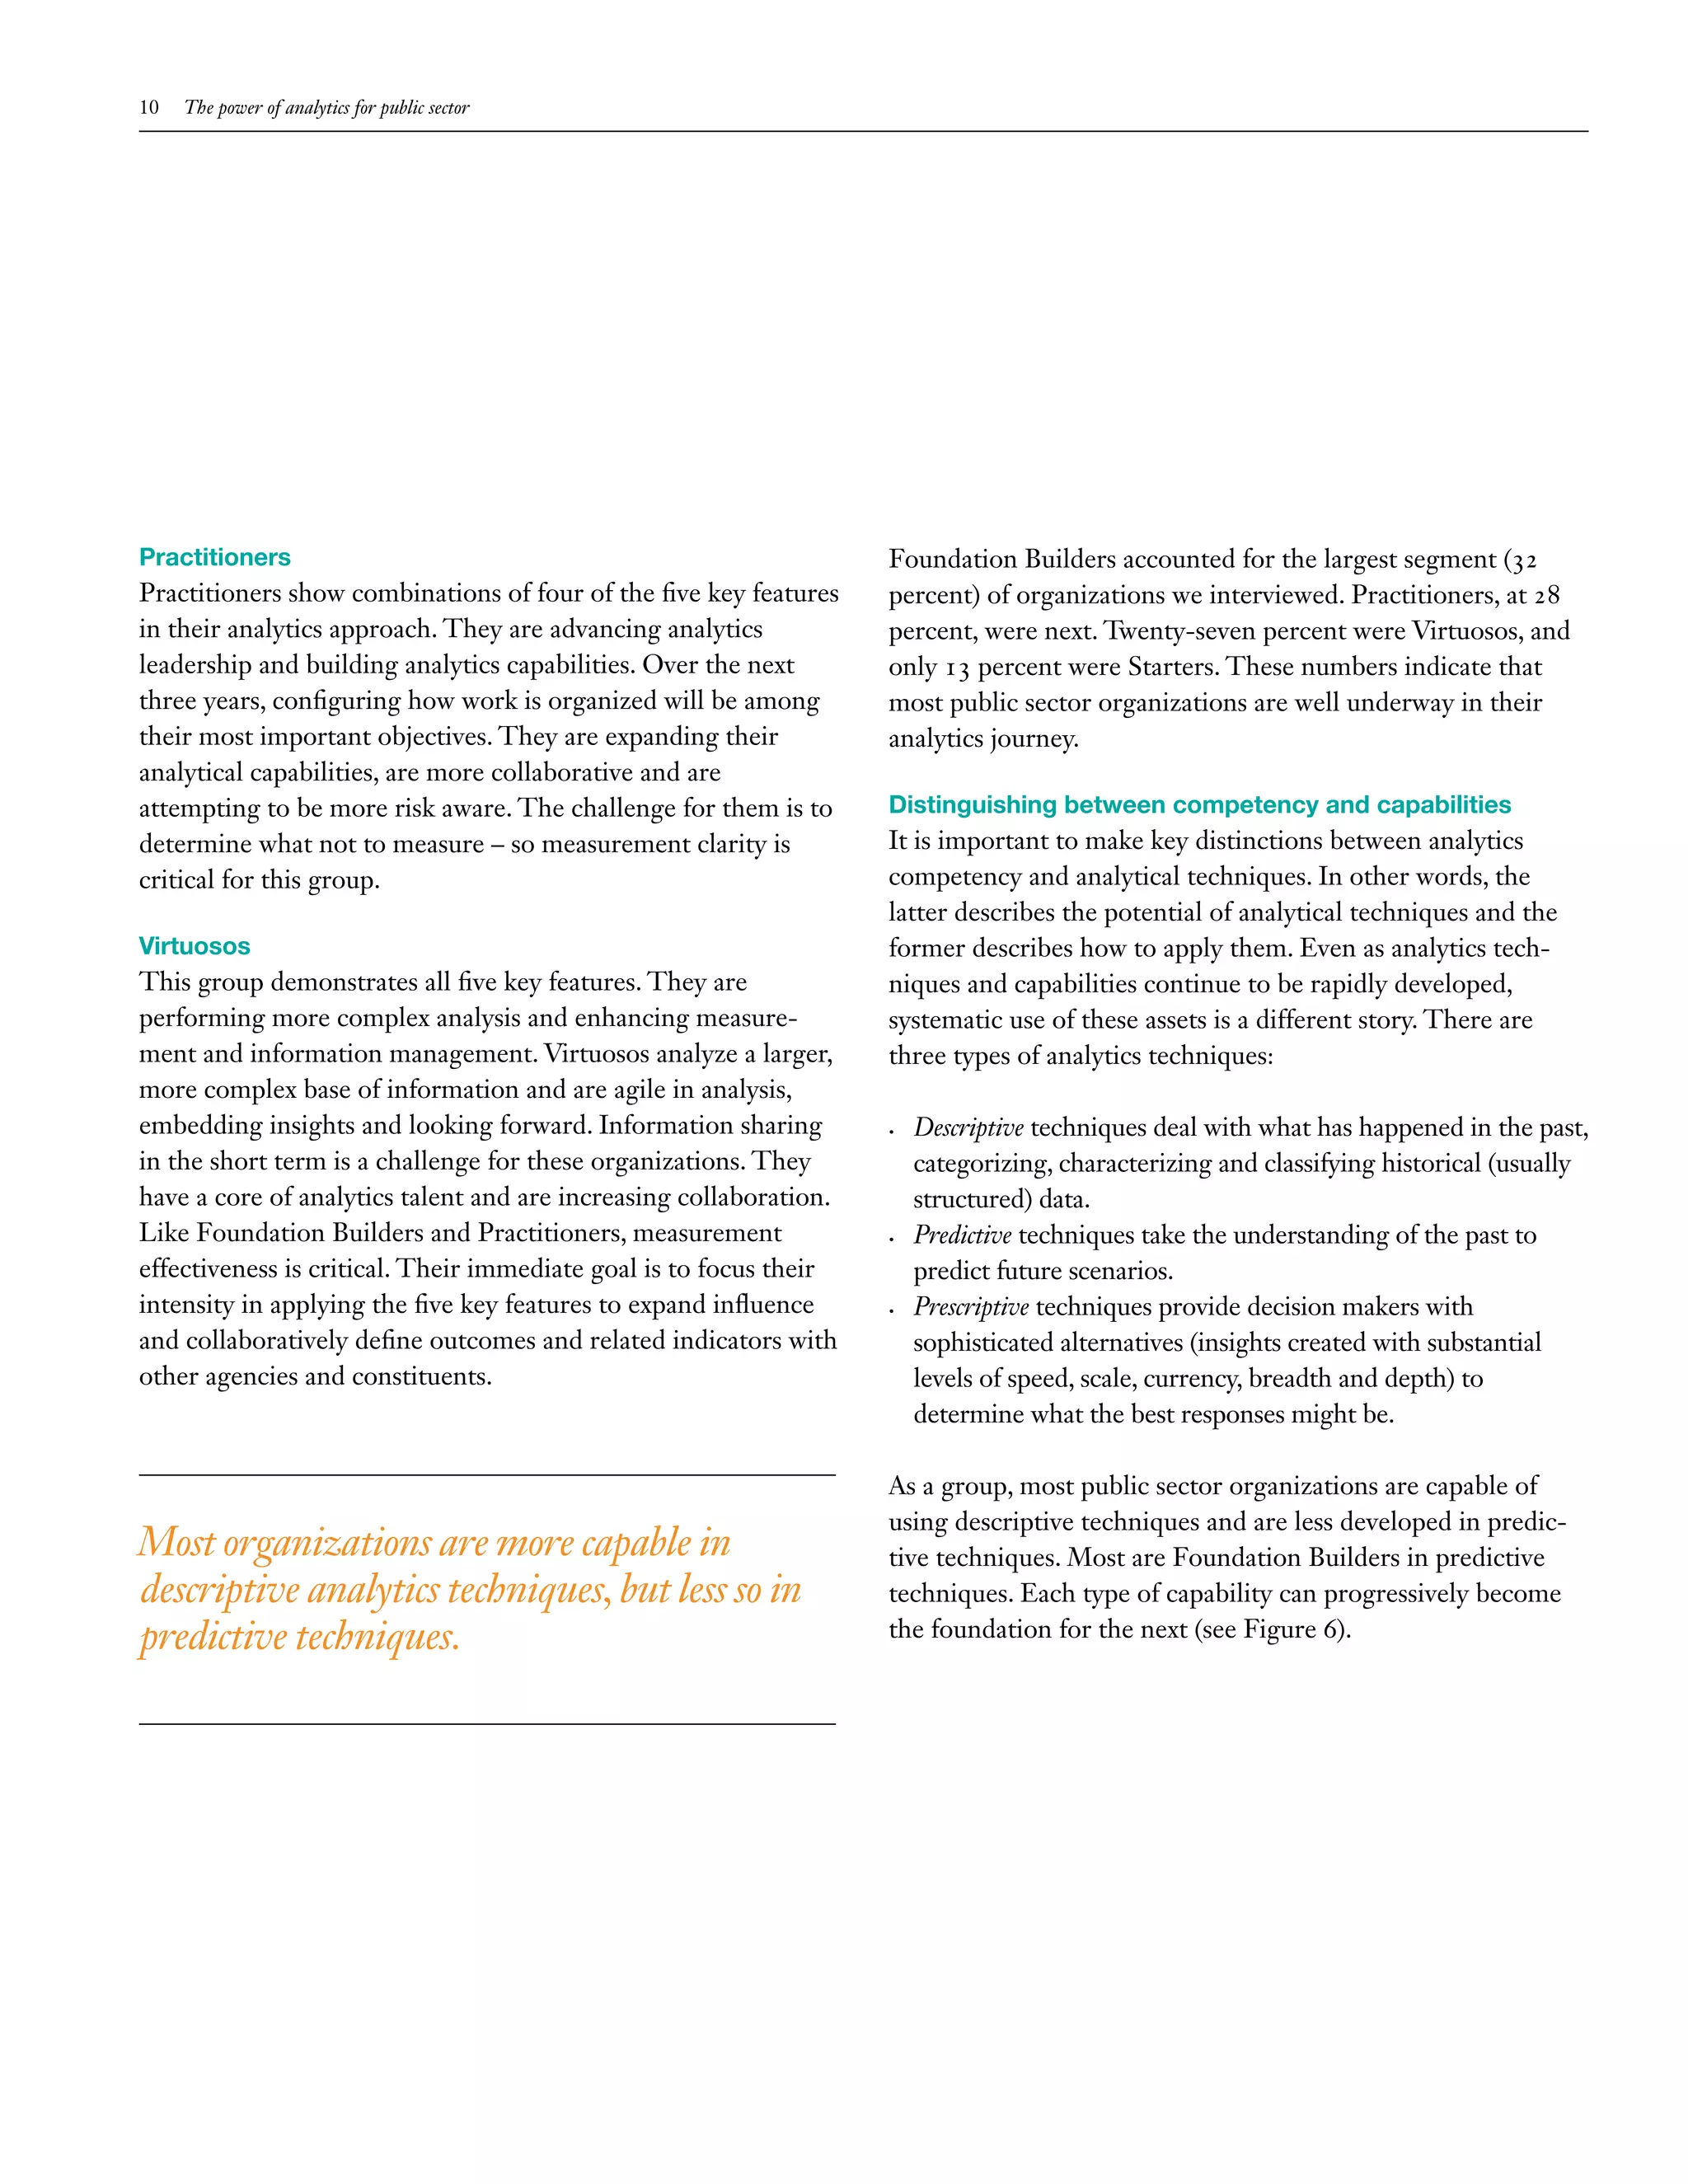
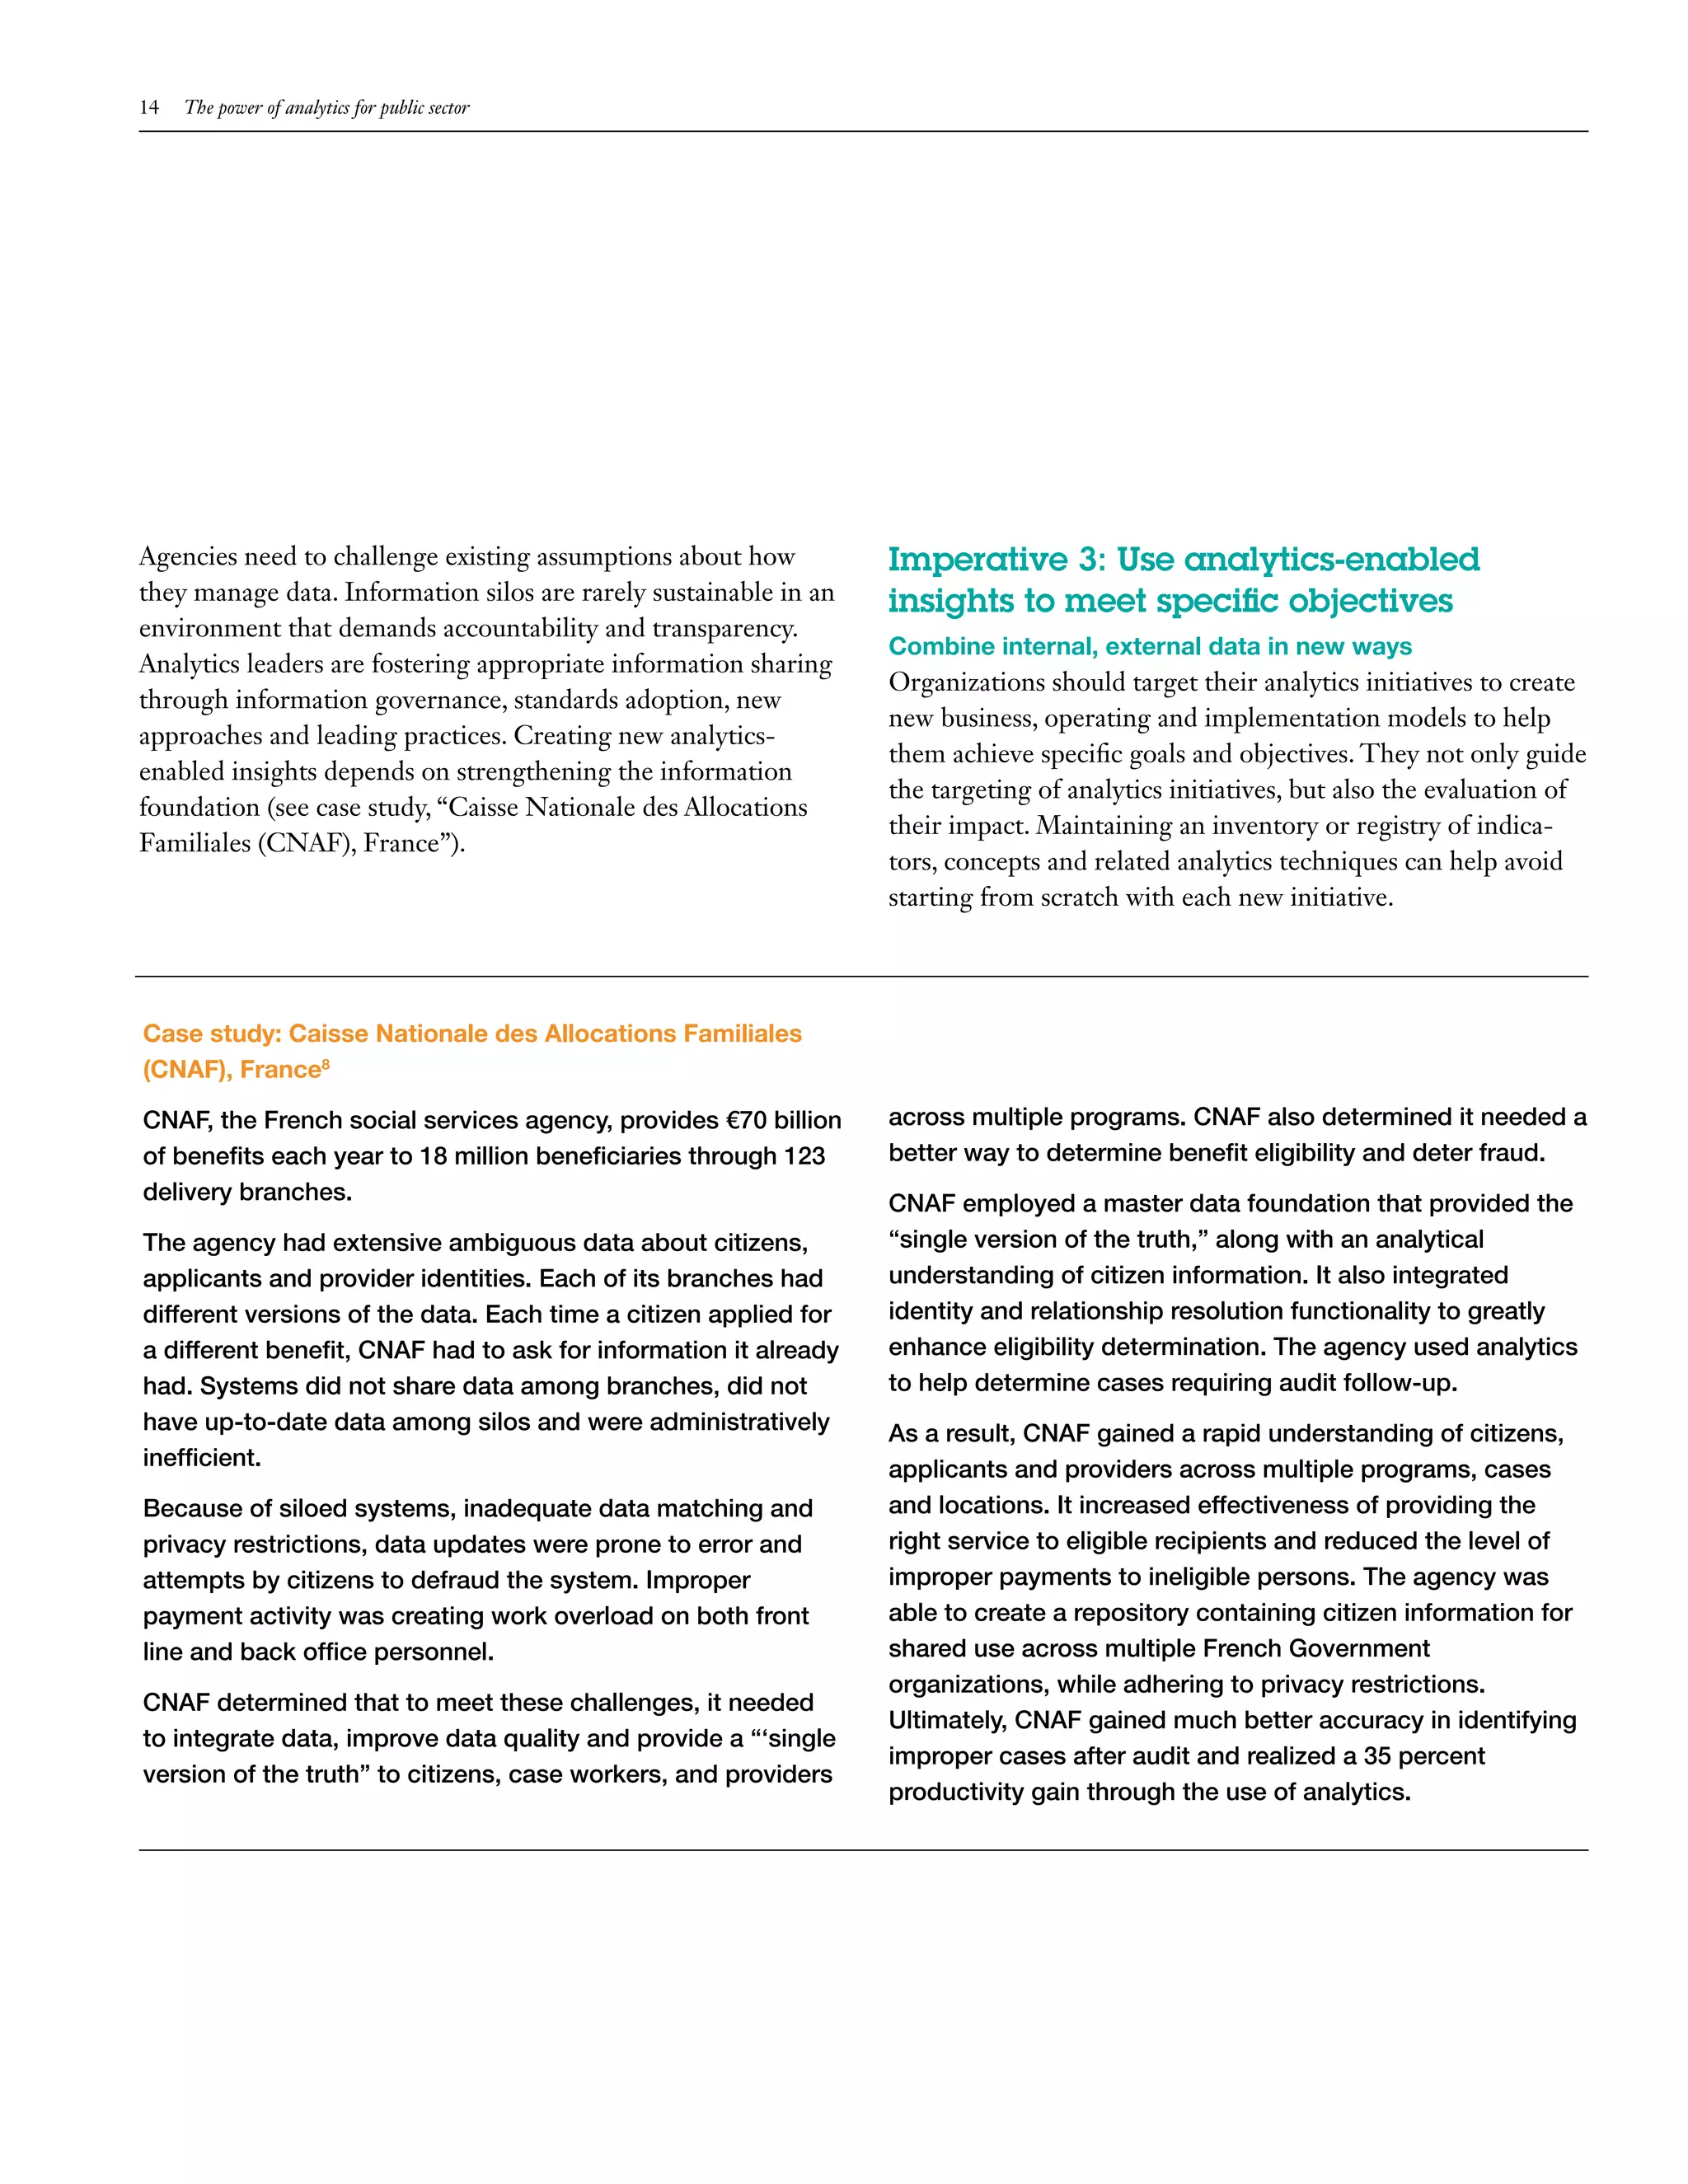
Public sector leaders interviewed for the 2010 IBM Global Christopher Hoene, Director of Research and Innovation, National League of Cities, USA.
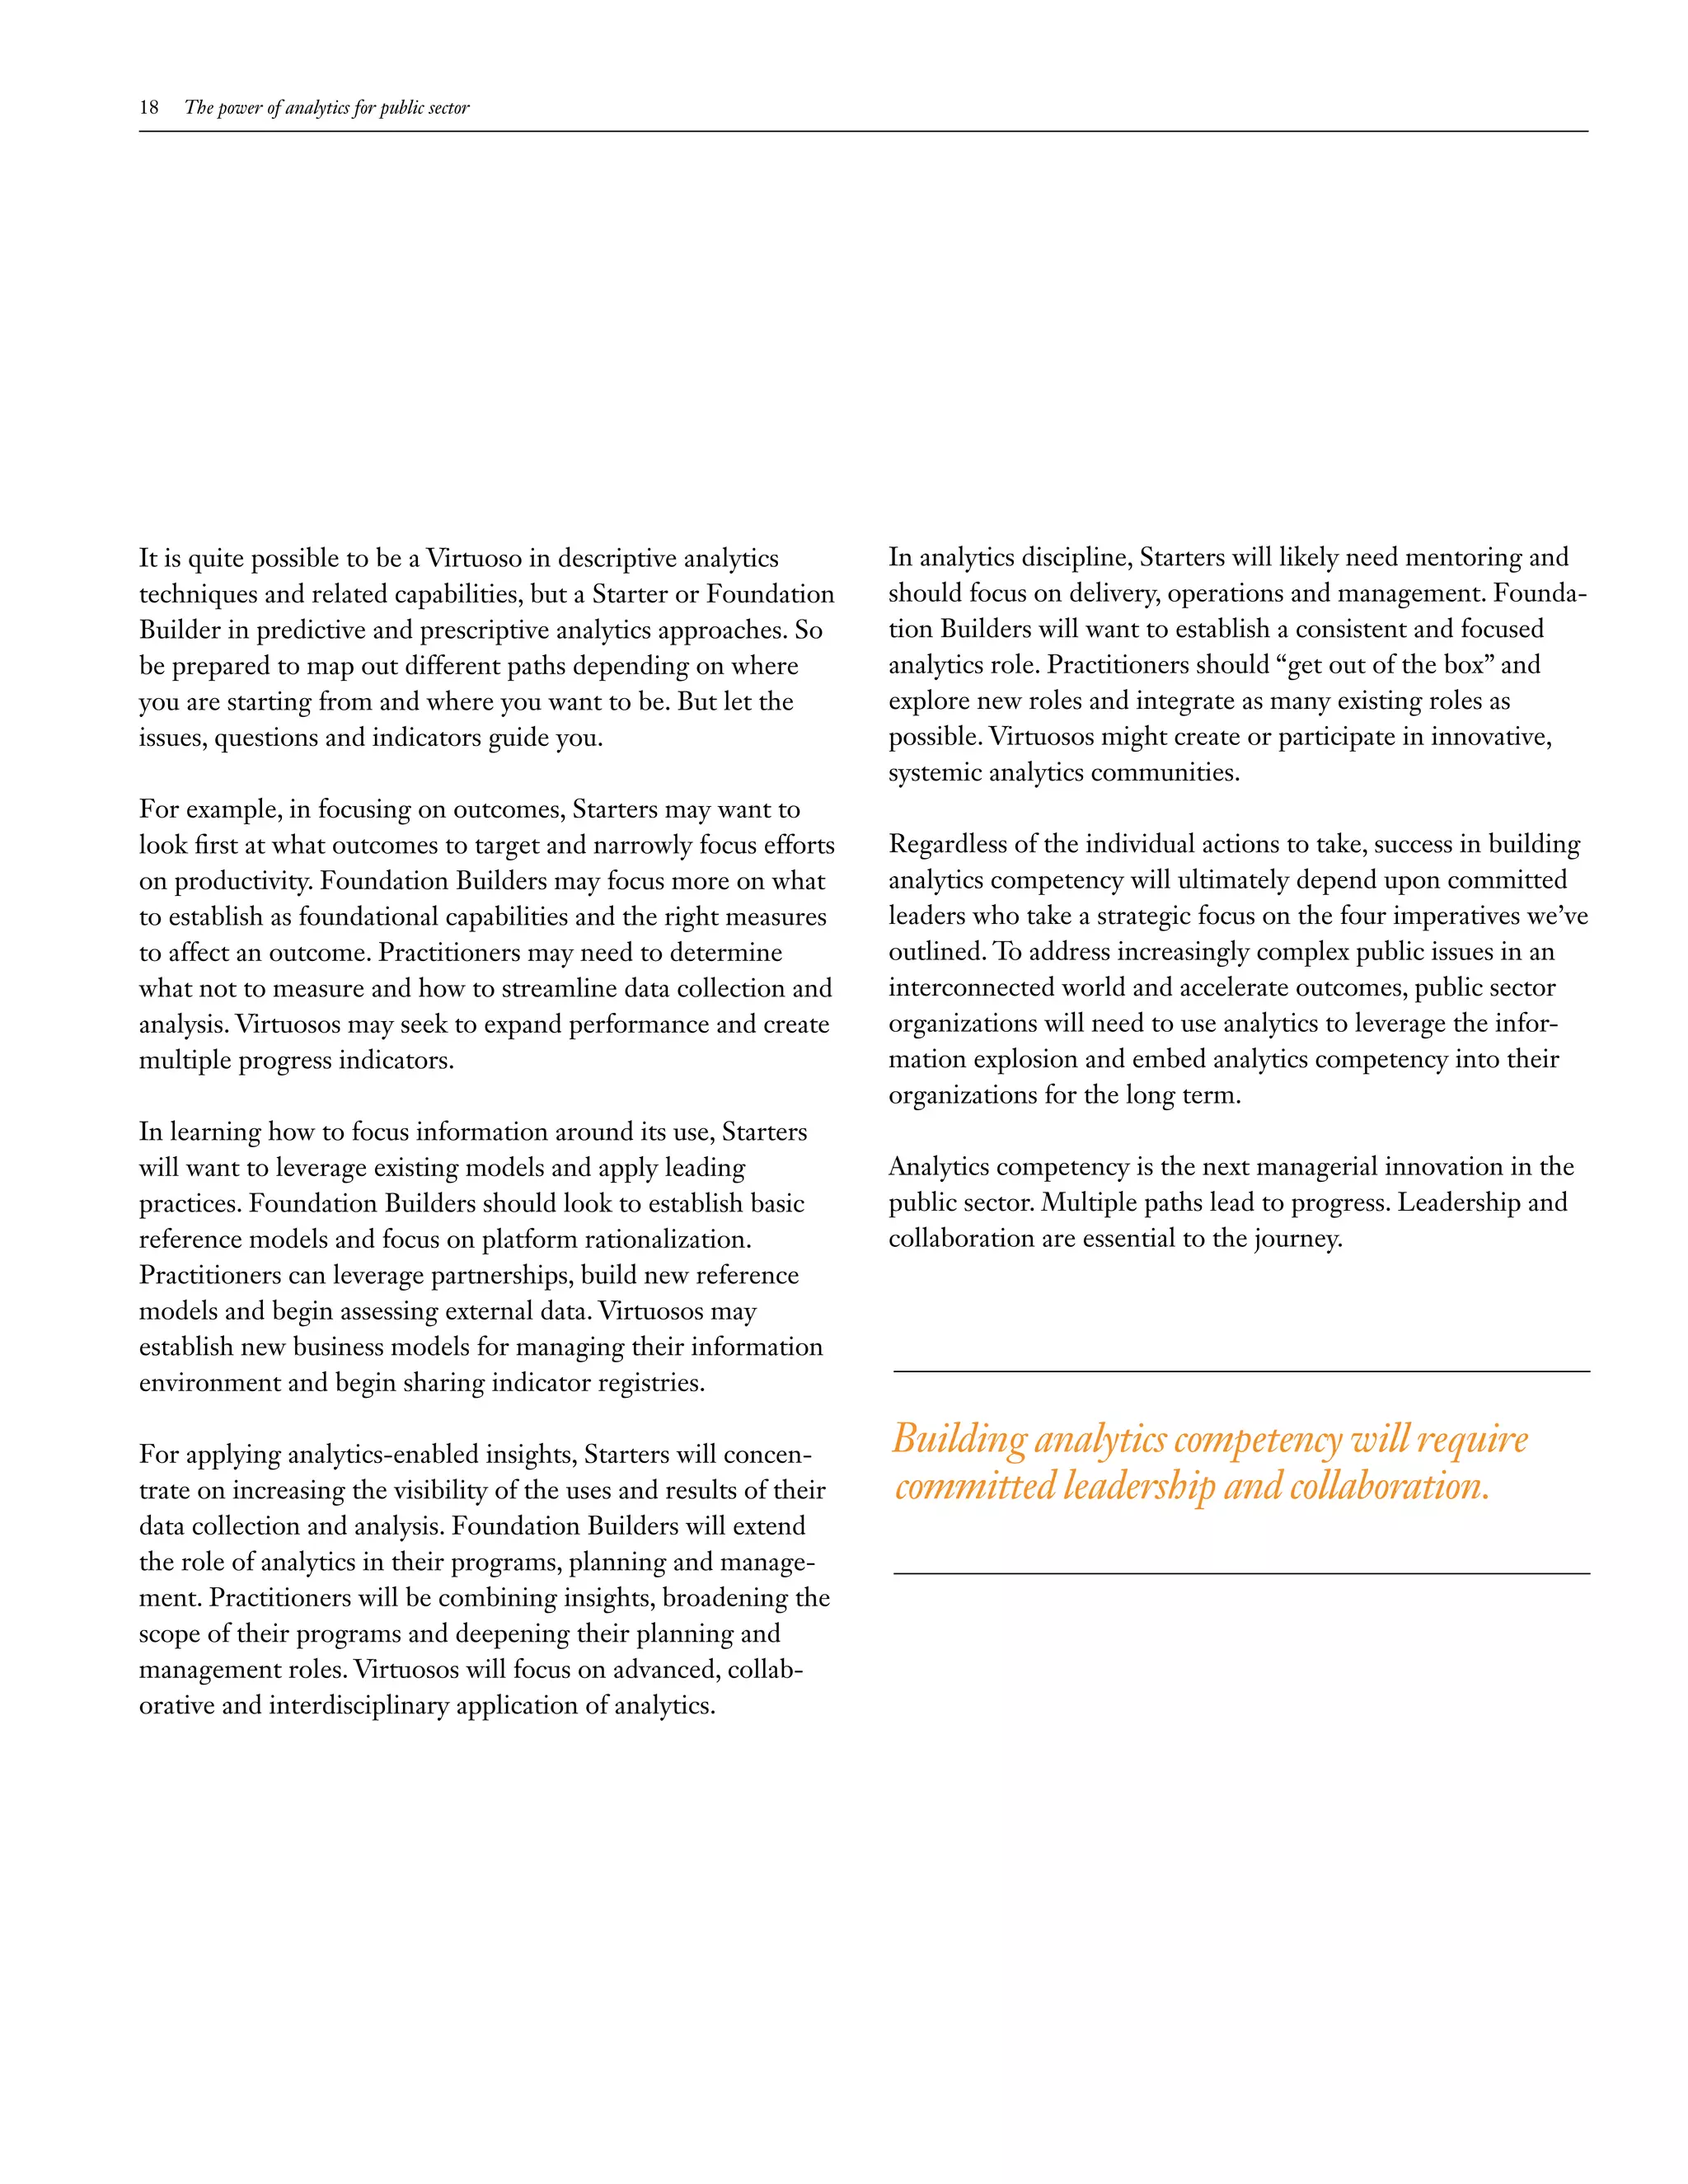
CEO Study said the most significant drivers of complexity were
the information explosion, talent shortages and shorter time
cycles (see Figure 1).1 These drivers are at the heart of effective
Irony and possibility
decision making.
More information is available today than necessary to make
effective decisions. “There is too much information already,”
said one North American public sector official. “We need not
Information 73% just more relevant information, but to eliminate the irrelevant
explosion
57%
information that is reported.”
Talent 62% Public sector leaders told us the biggest barrier to more
shortages
54% systematic analytics adoption and use is the “data paradox.”
Shorter cycle The combination of this paradox and the information
61%
times explosion can exacerbate information management tensions
57%
and stymie effective action (see Figure 2).
Shift between 60%
public and private
boundaries 32%
Public sector
Private sector
Source: IBM Institute for Business Value.
Figure 1: The information explosion was cited by executives
interviewed for the IBM Global CEO Study as the most significant
driver of increased complexity.](https://image.slidesharecdn.com/thepowerofanalyticsforpublicsectorgbe03392usen02-13005669549934-phpapp01/75/The-Power-Of-Analytics-For-Public-Sector-www-ibm-com-gbs-psanalytics-5-2048.jpg)
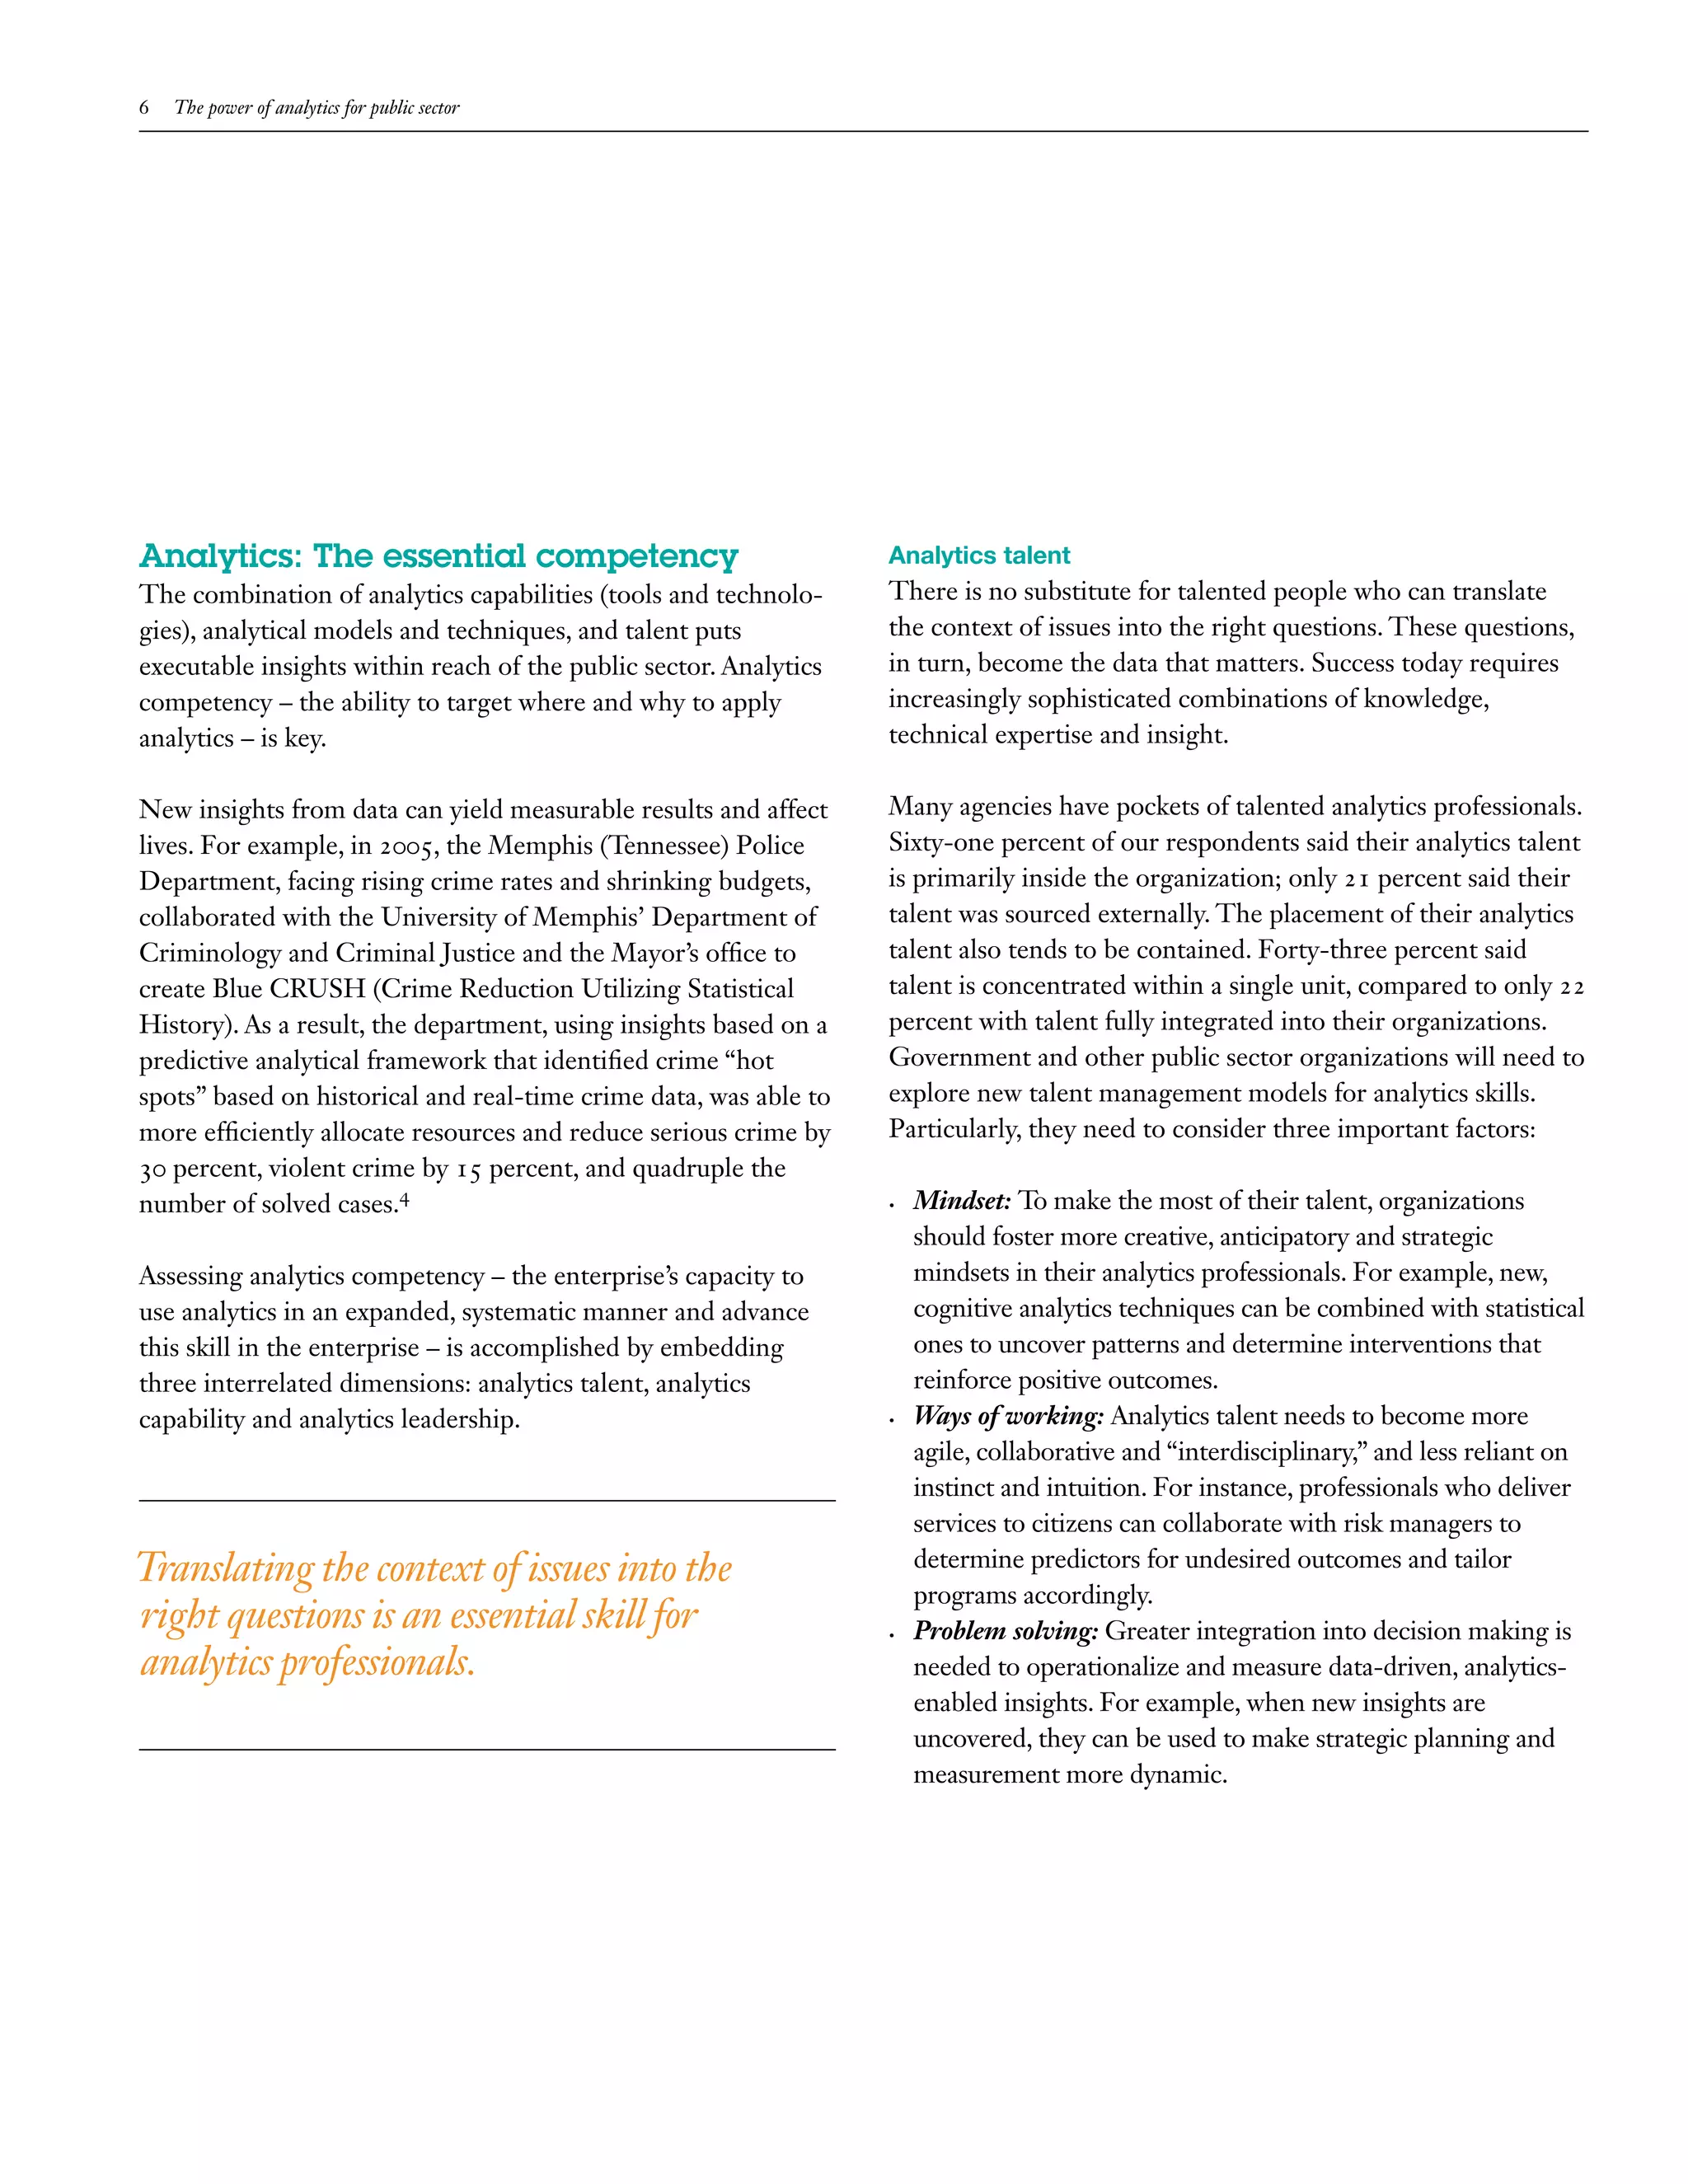
![IBM Global Business Services 7
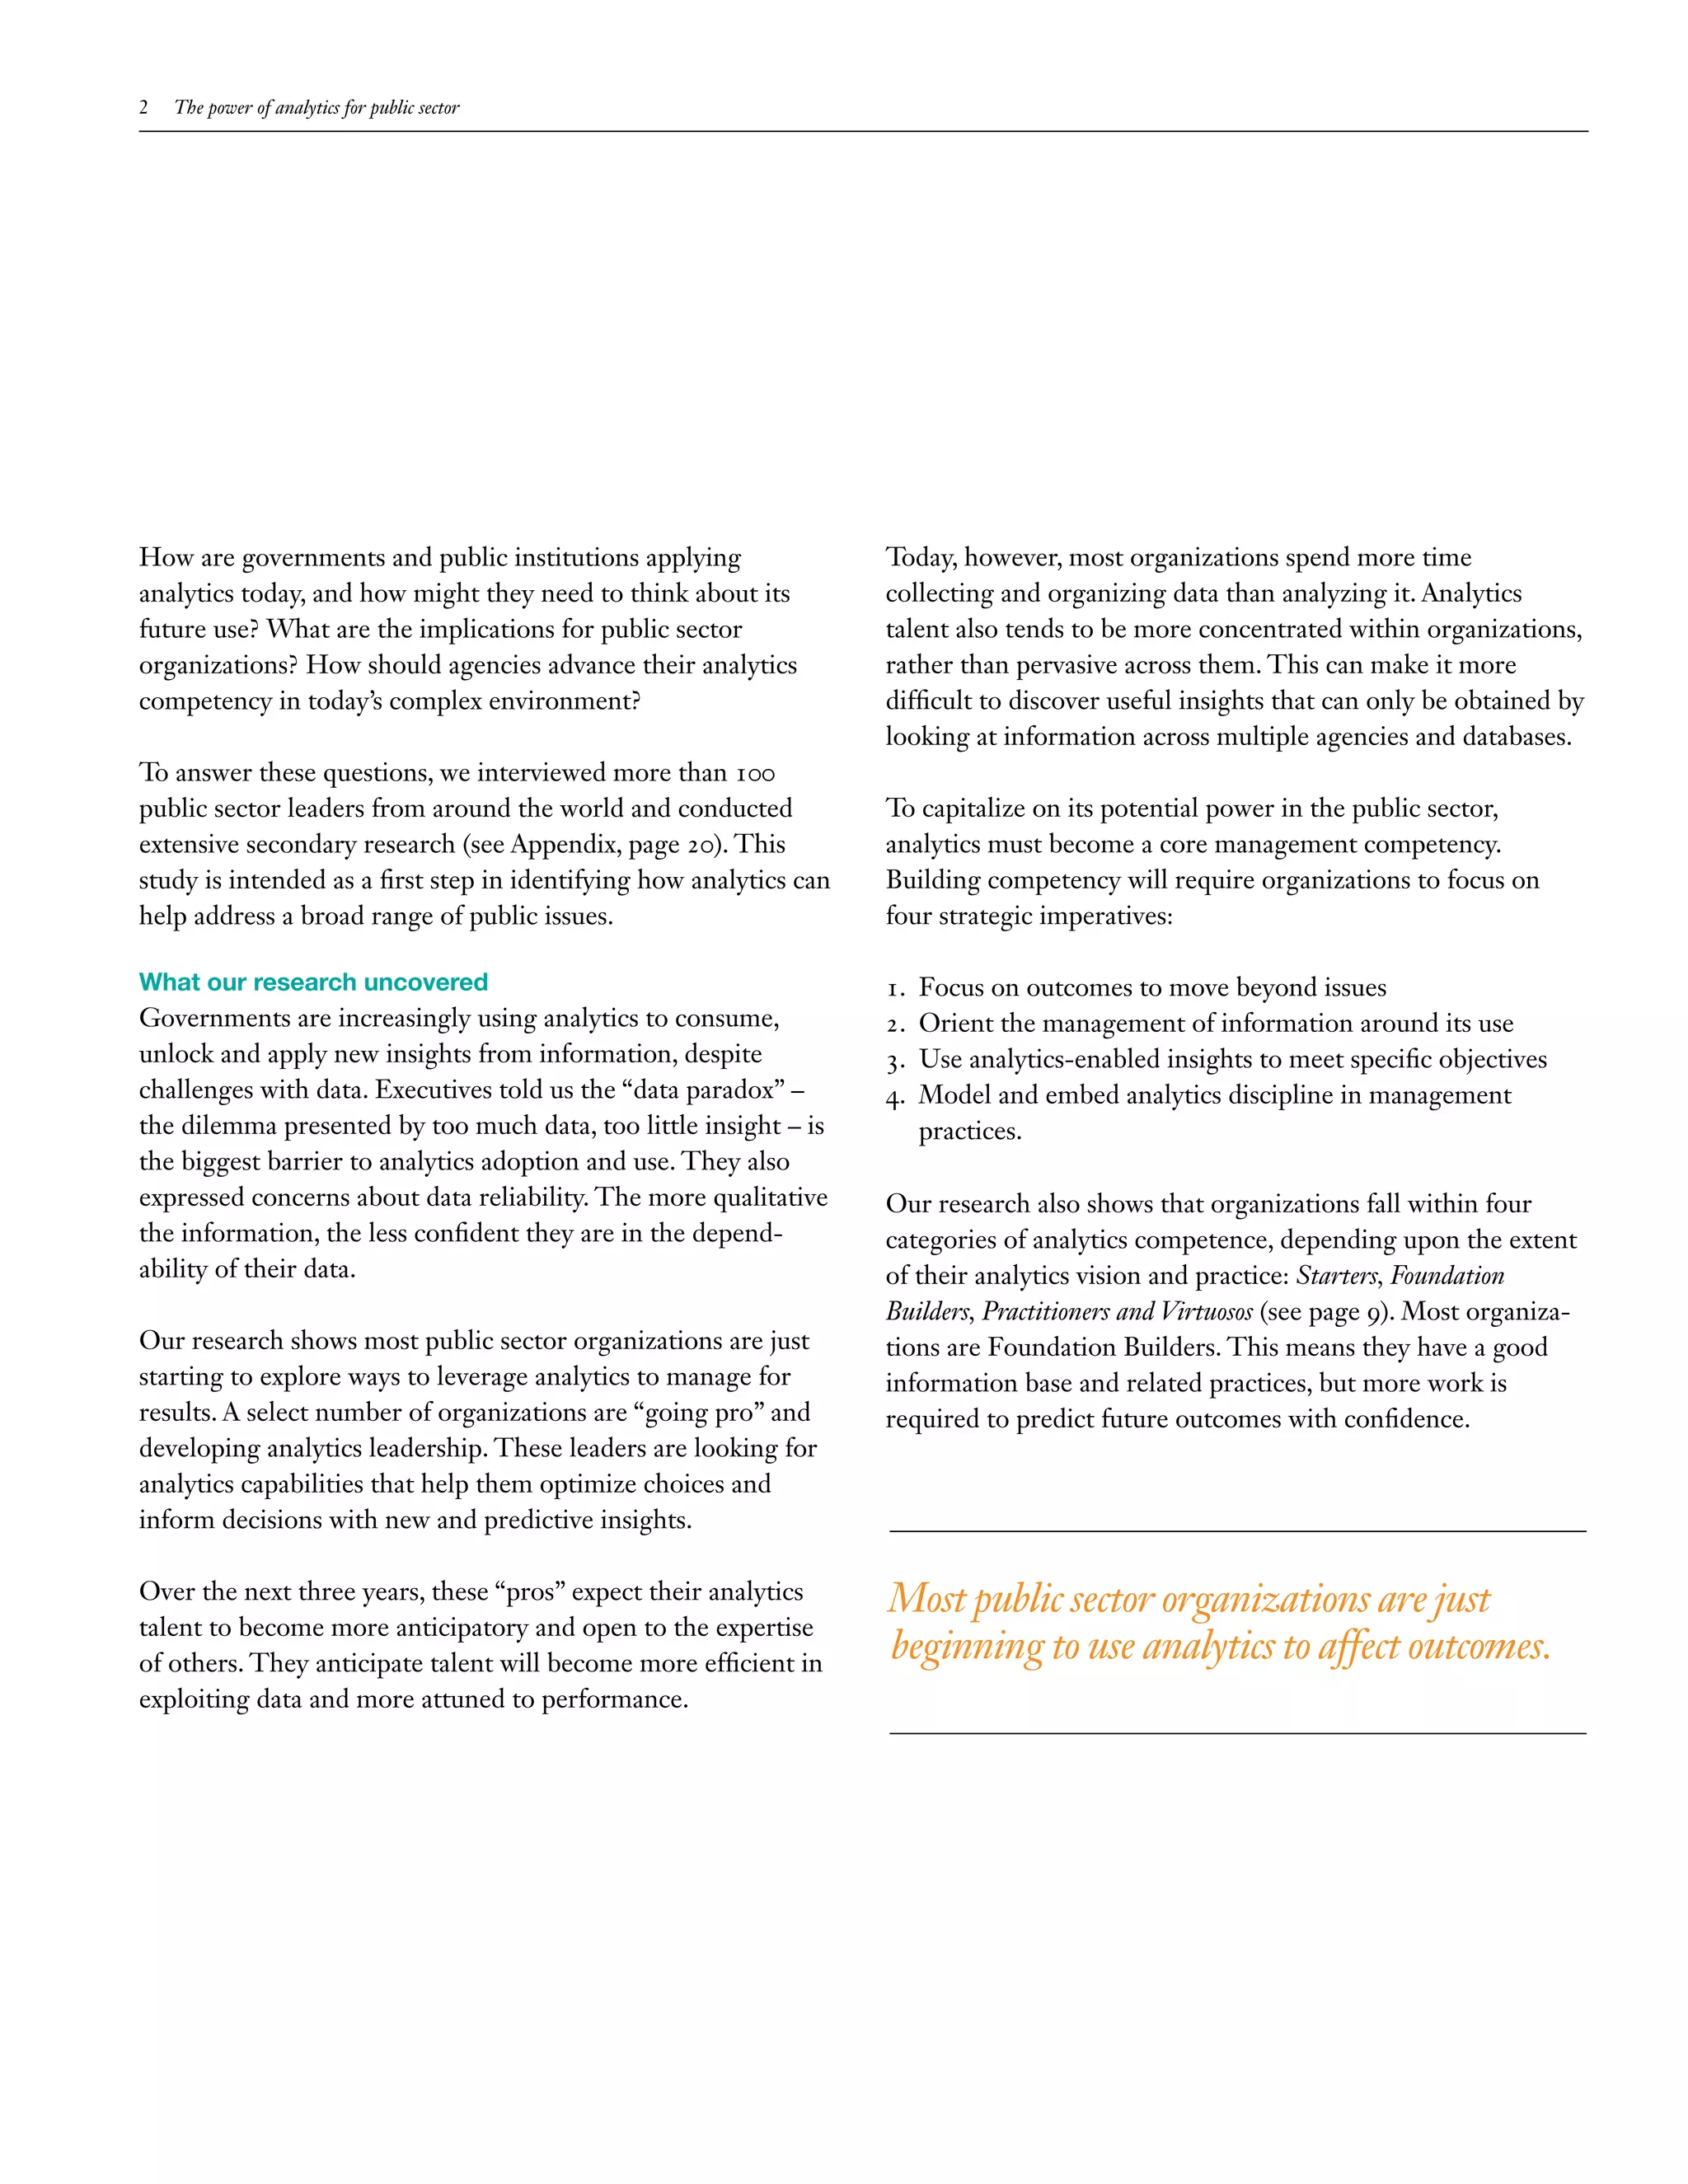
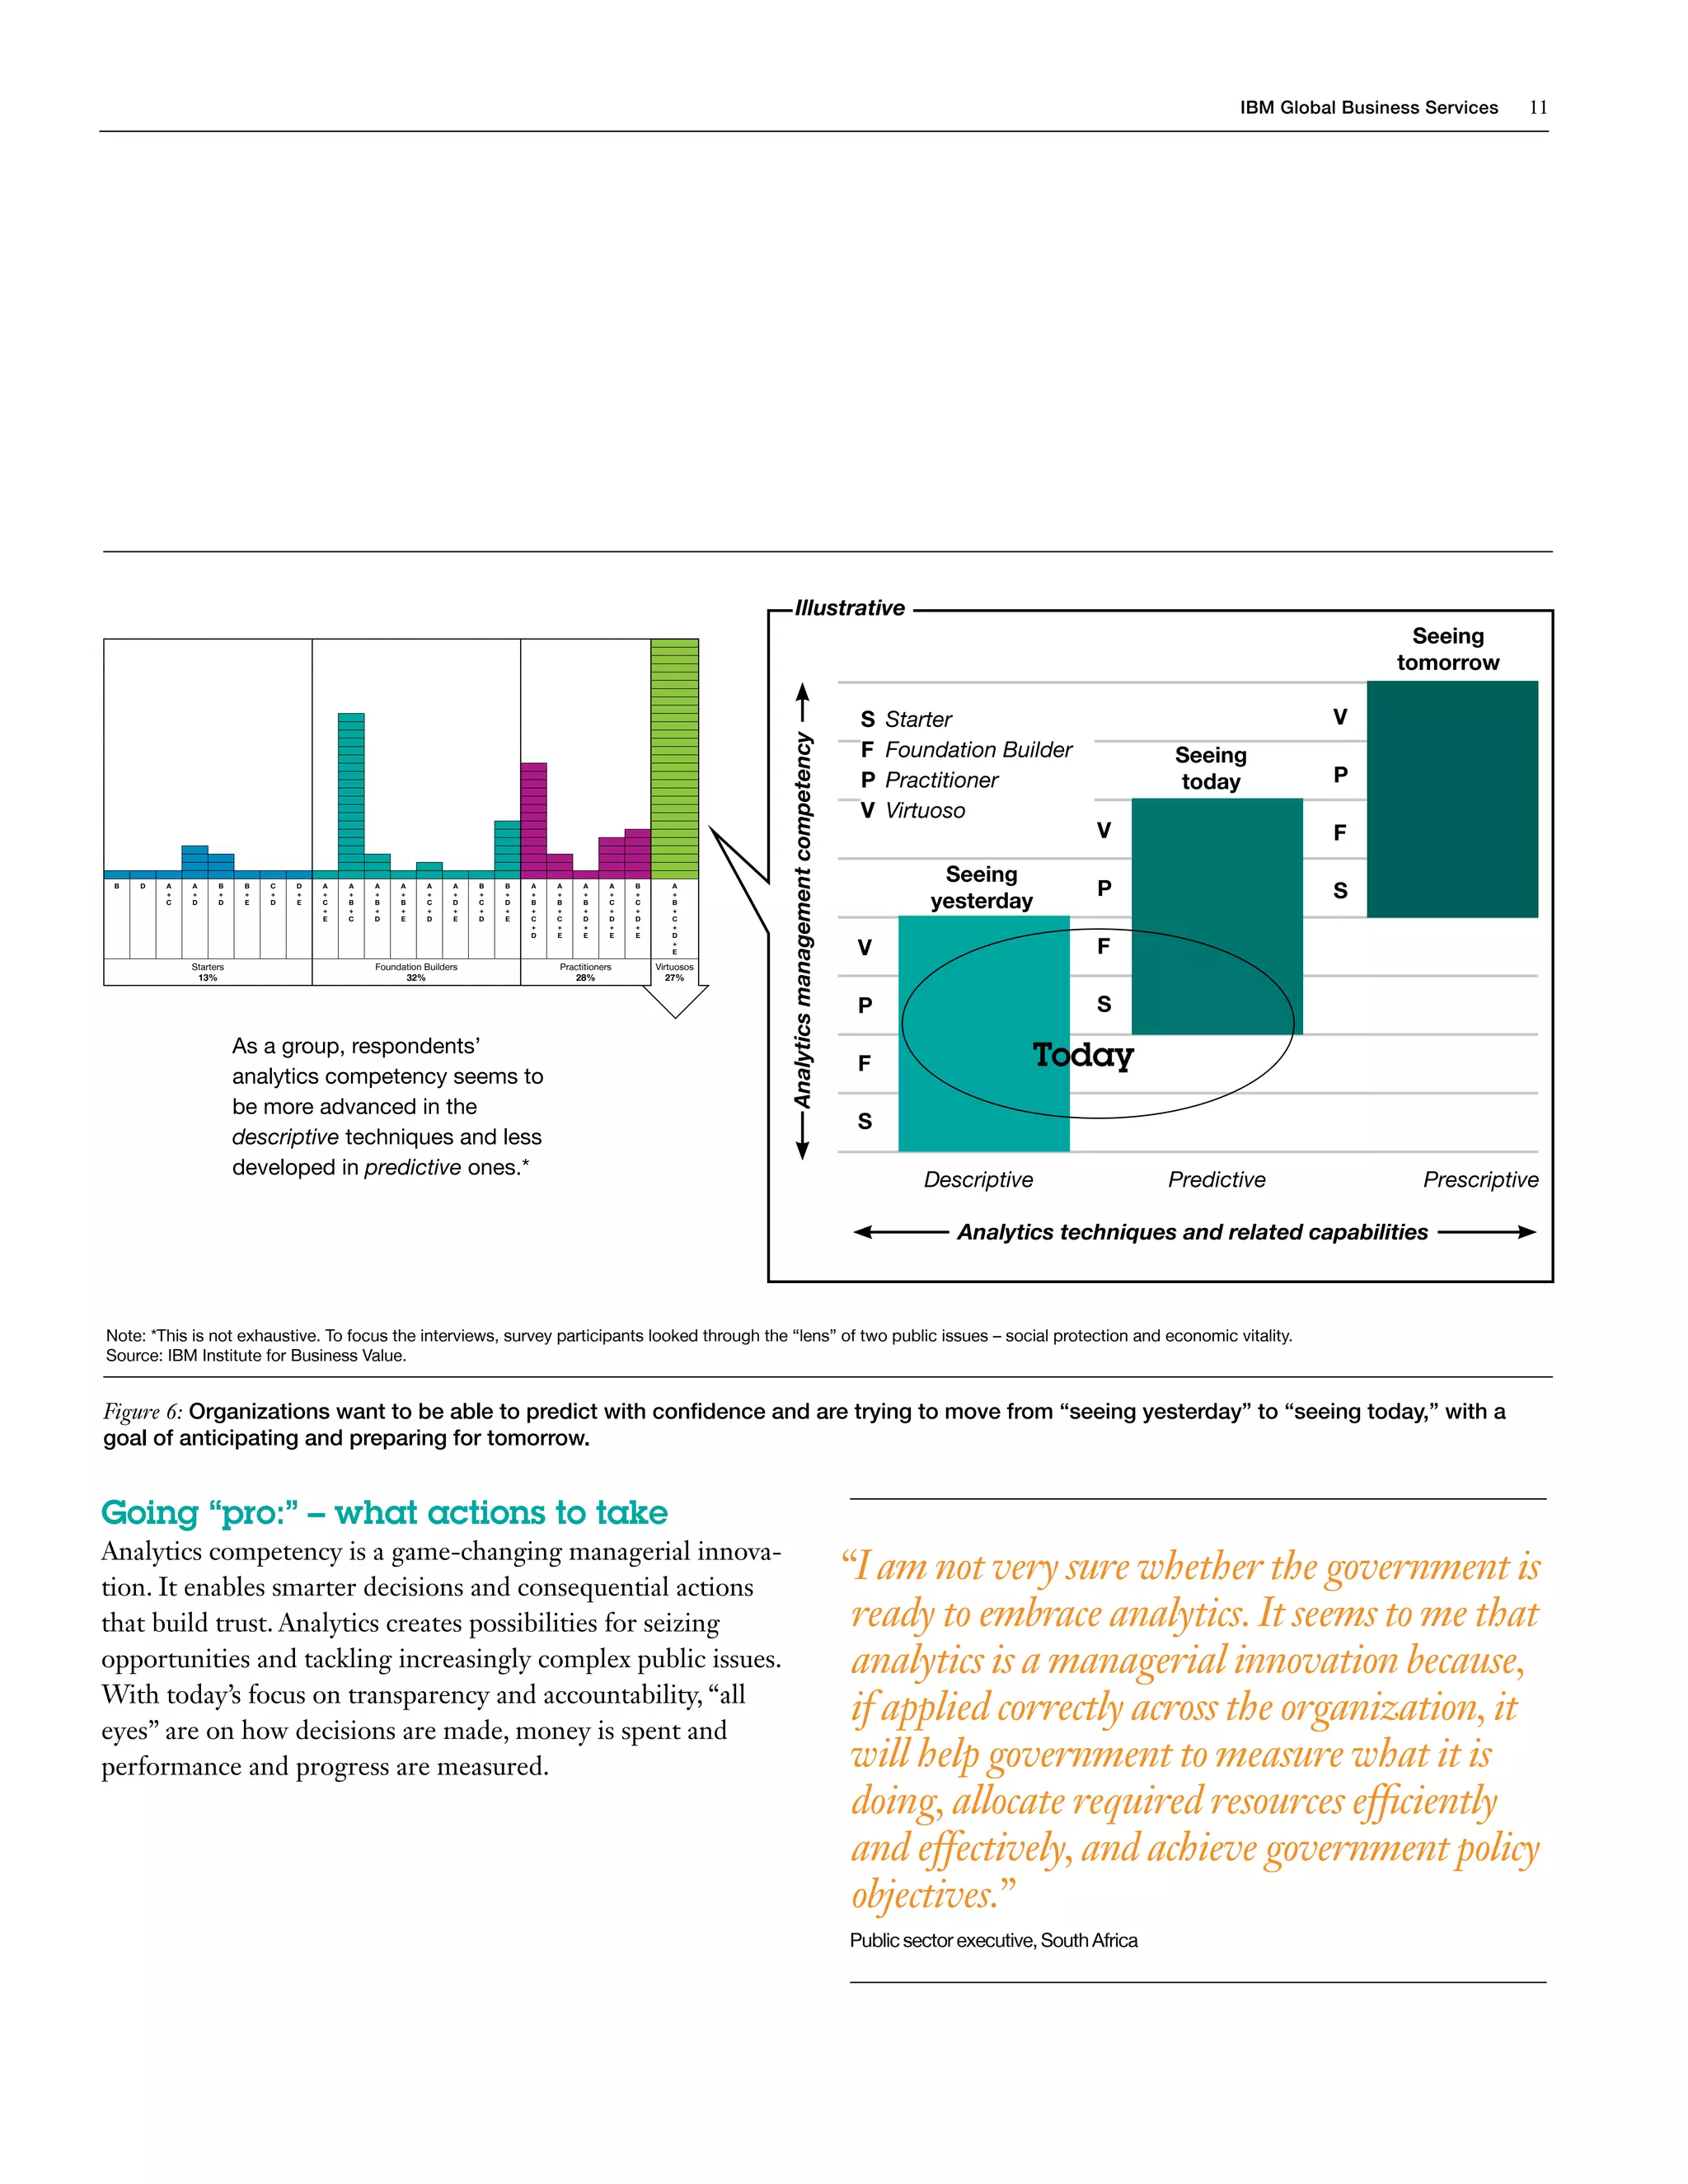
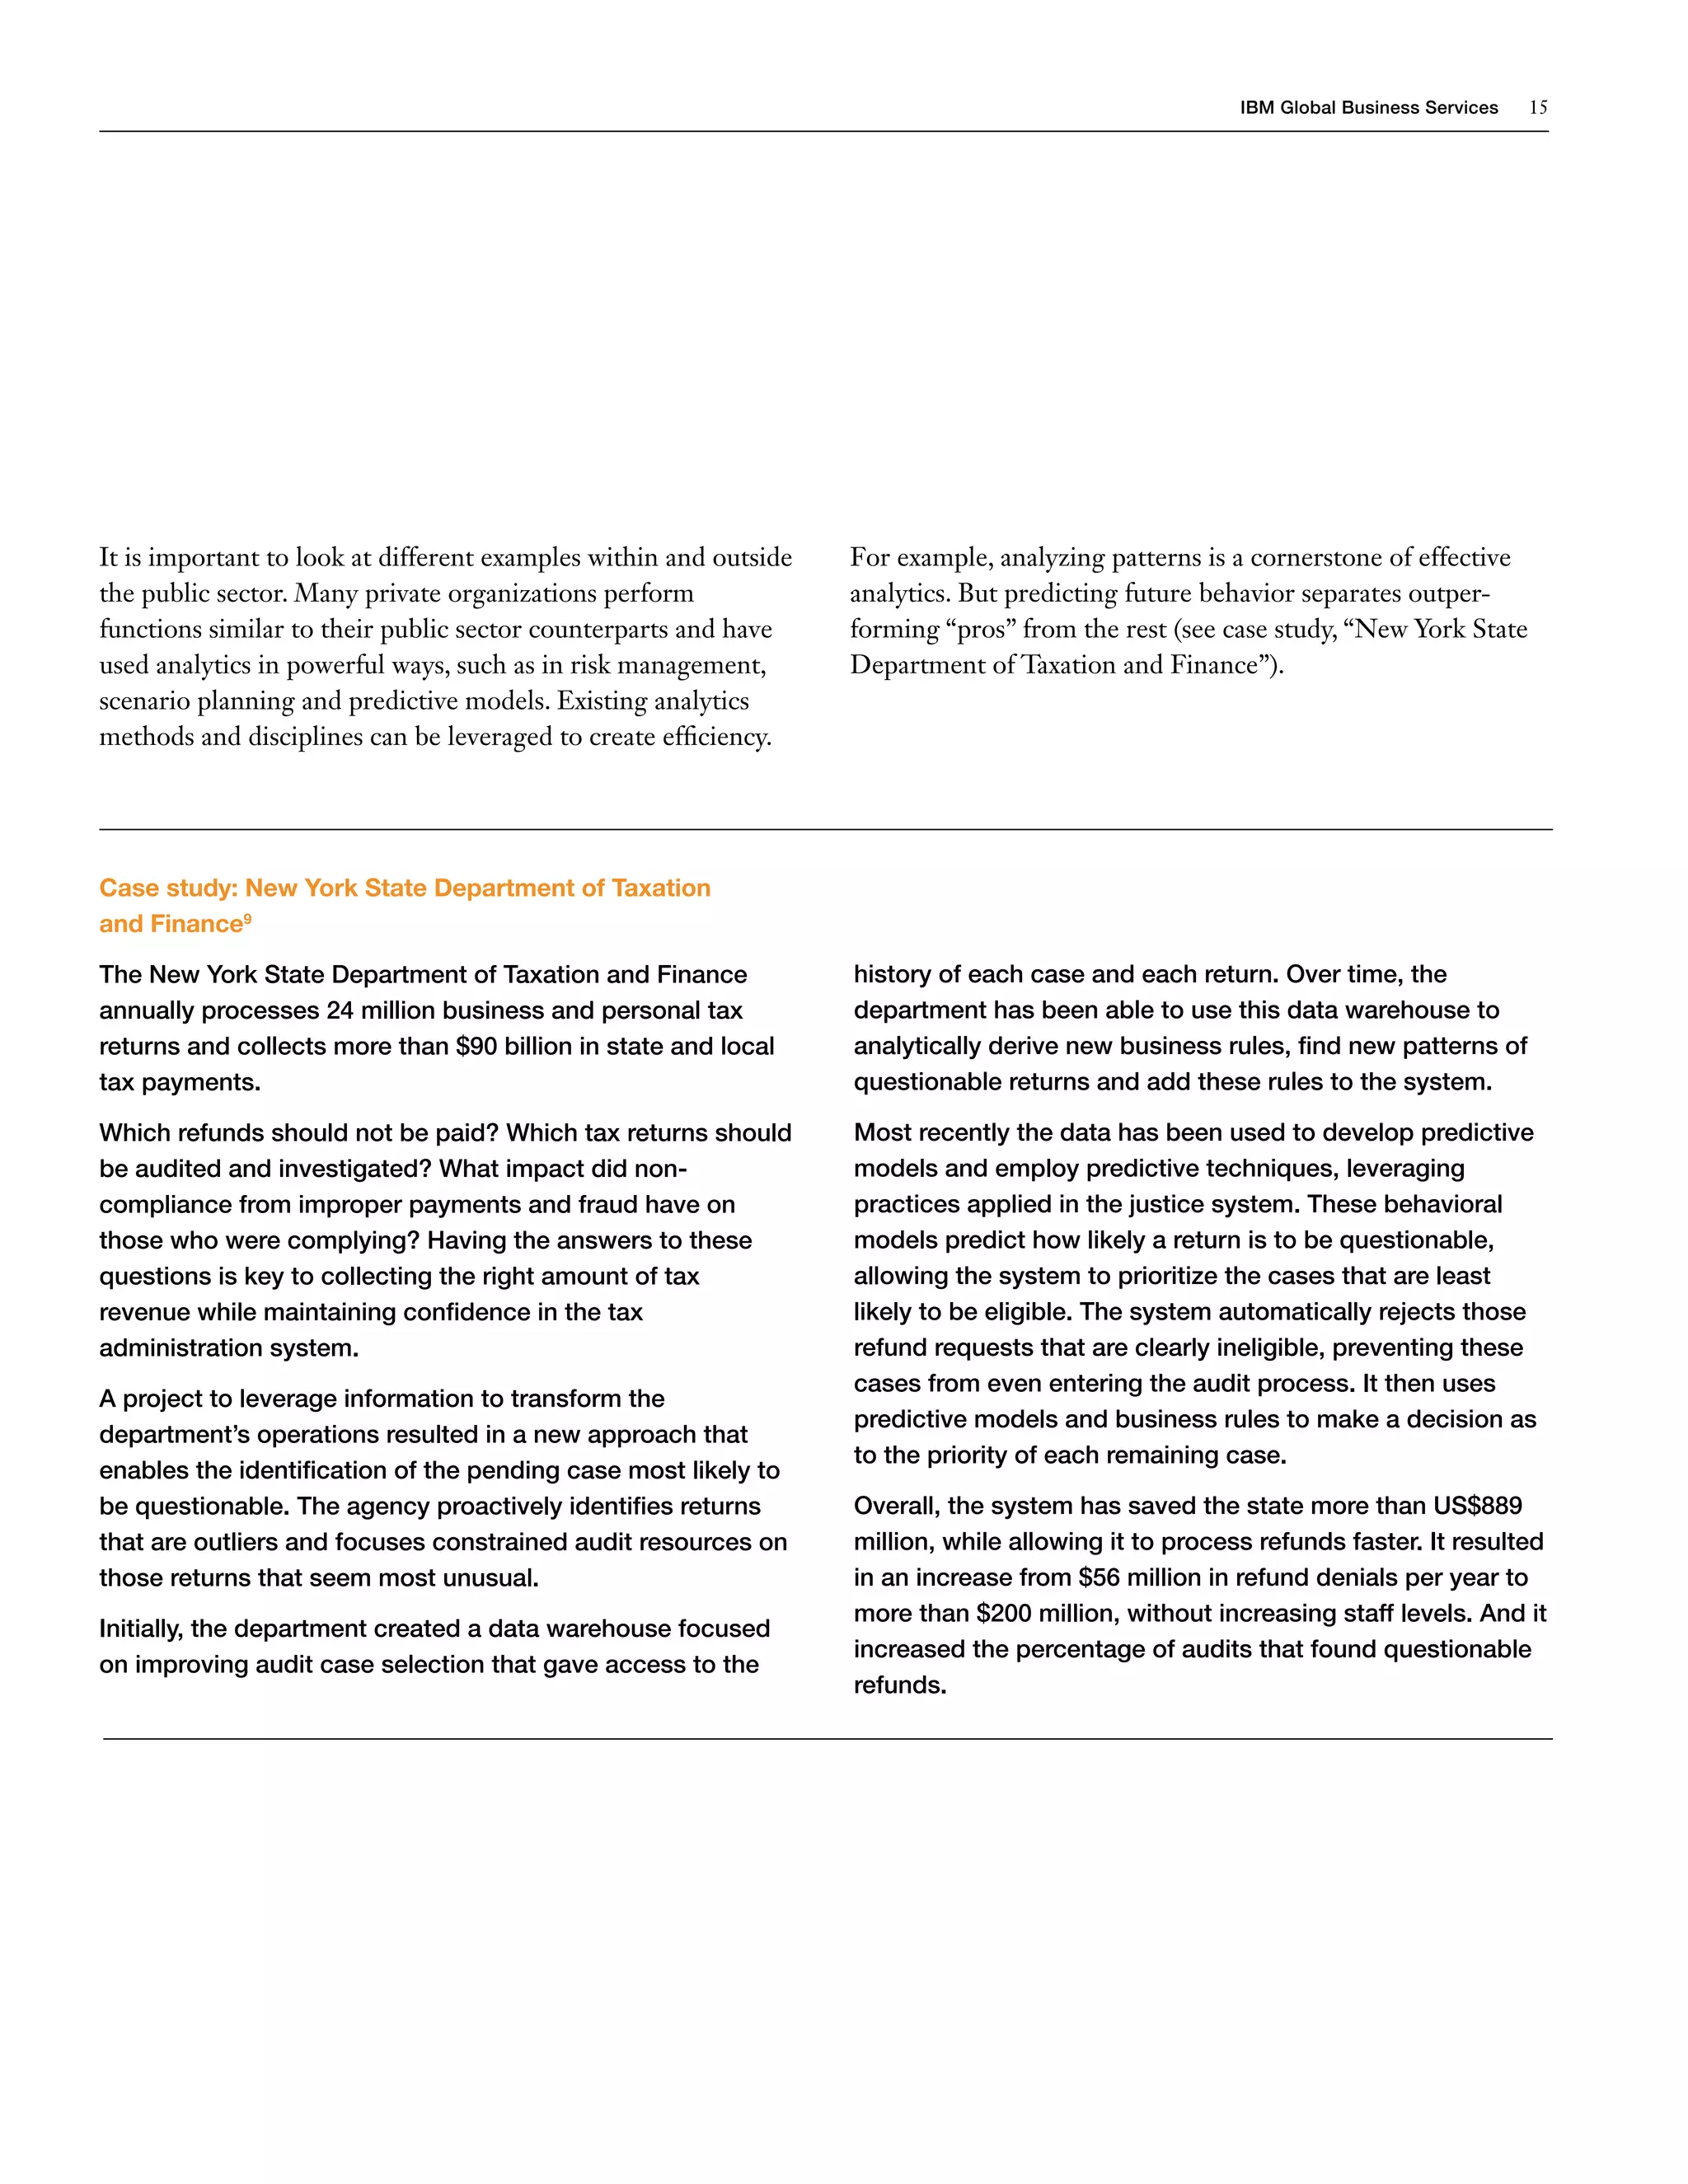
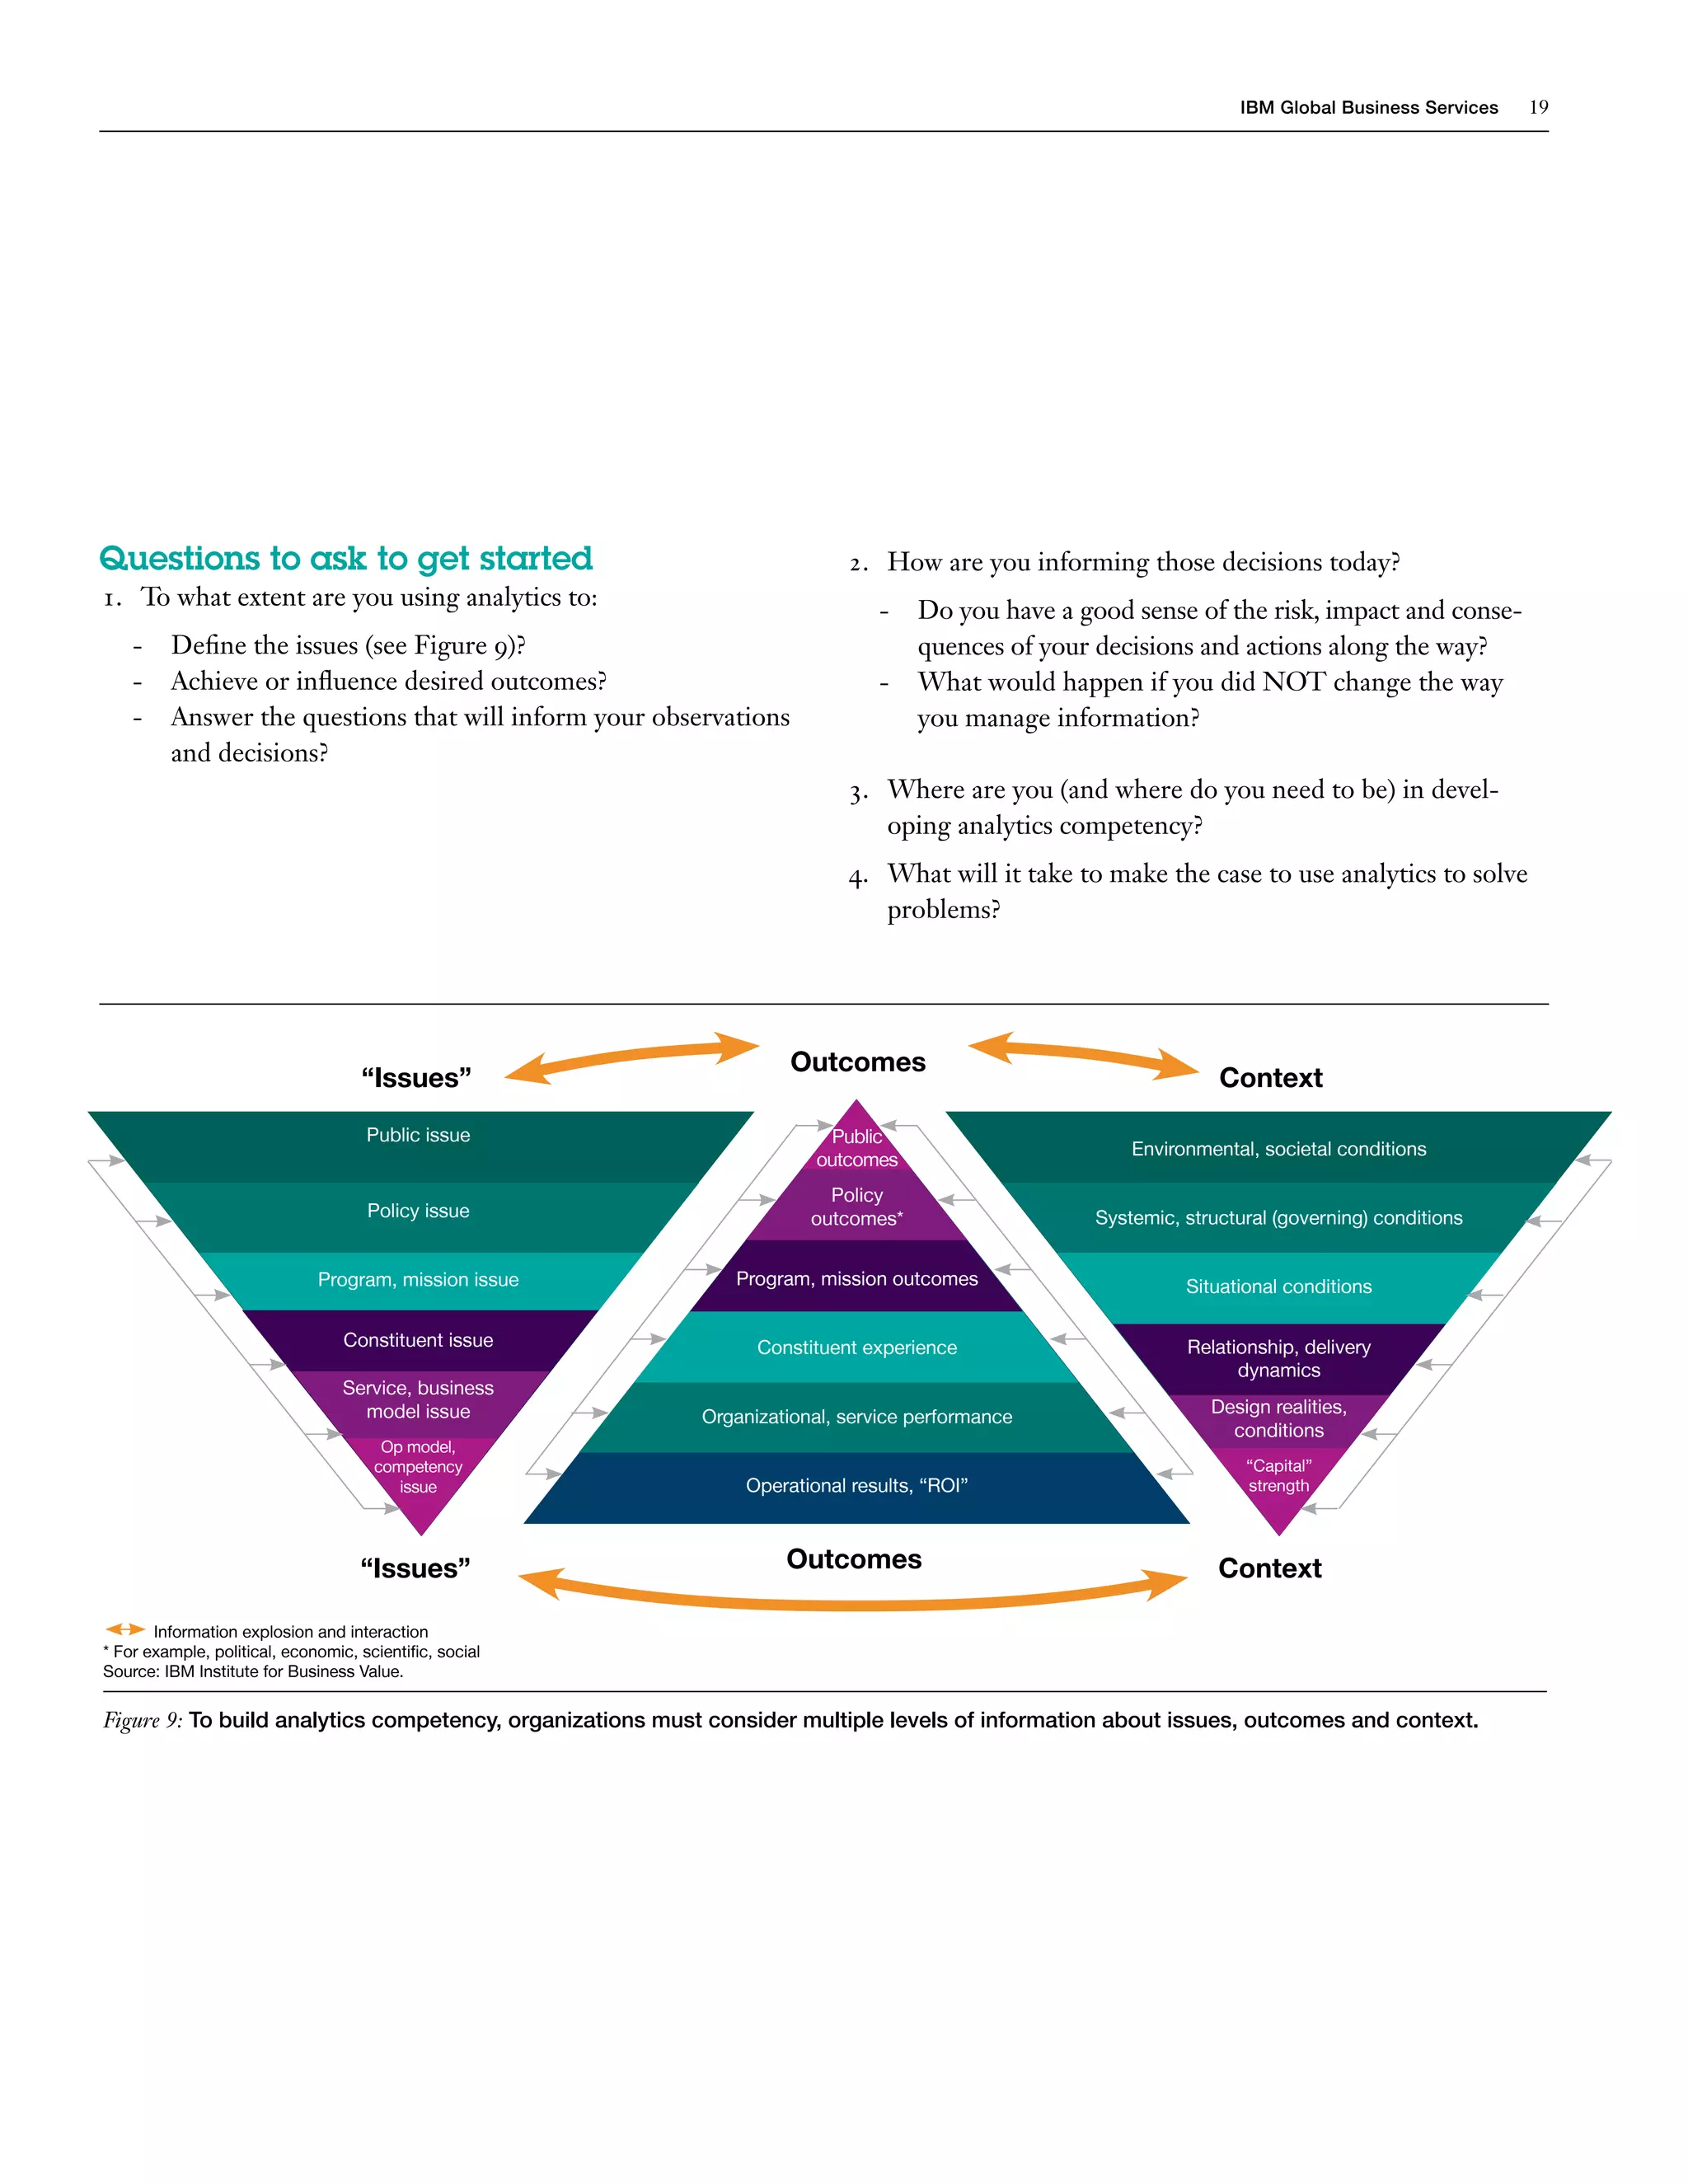
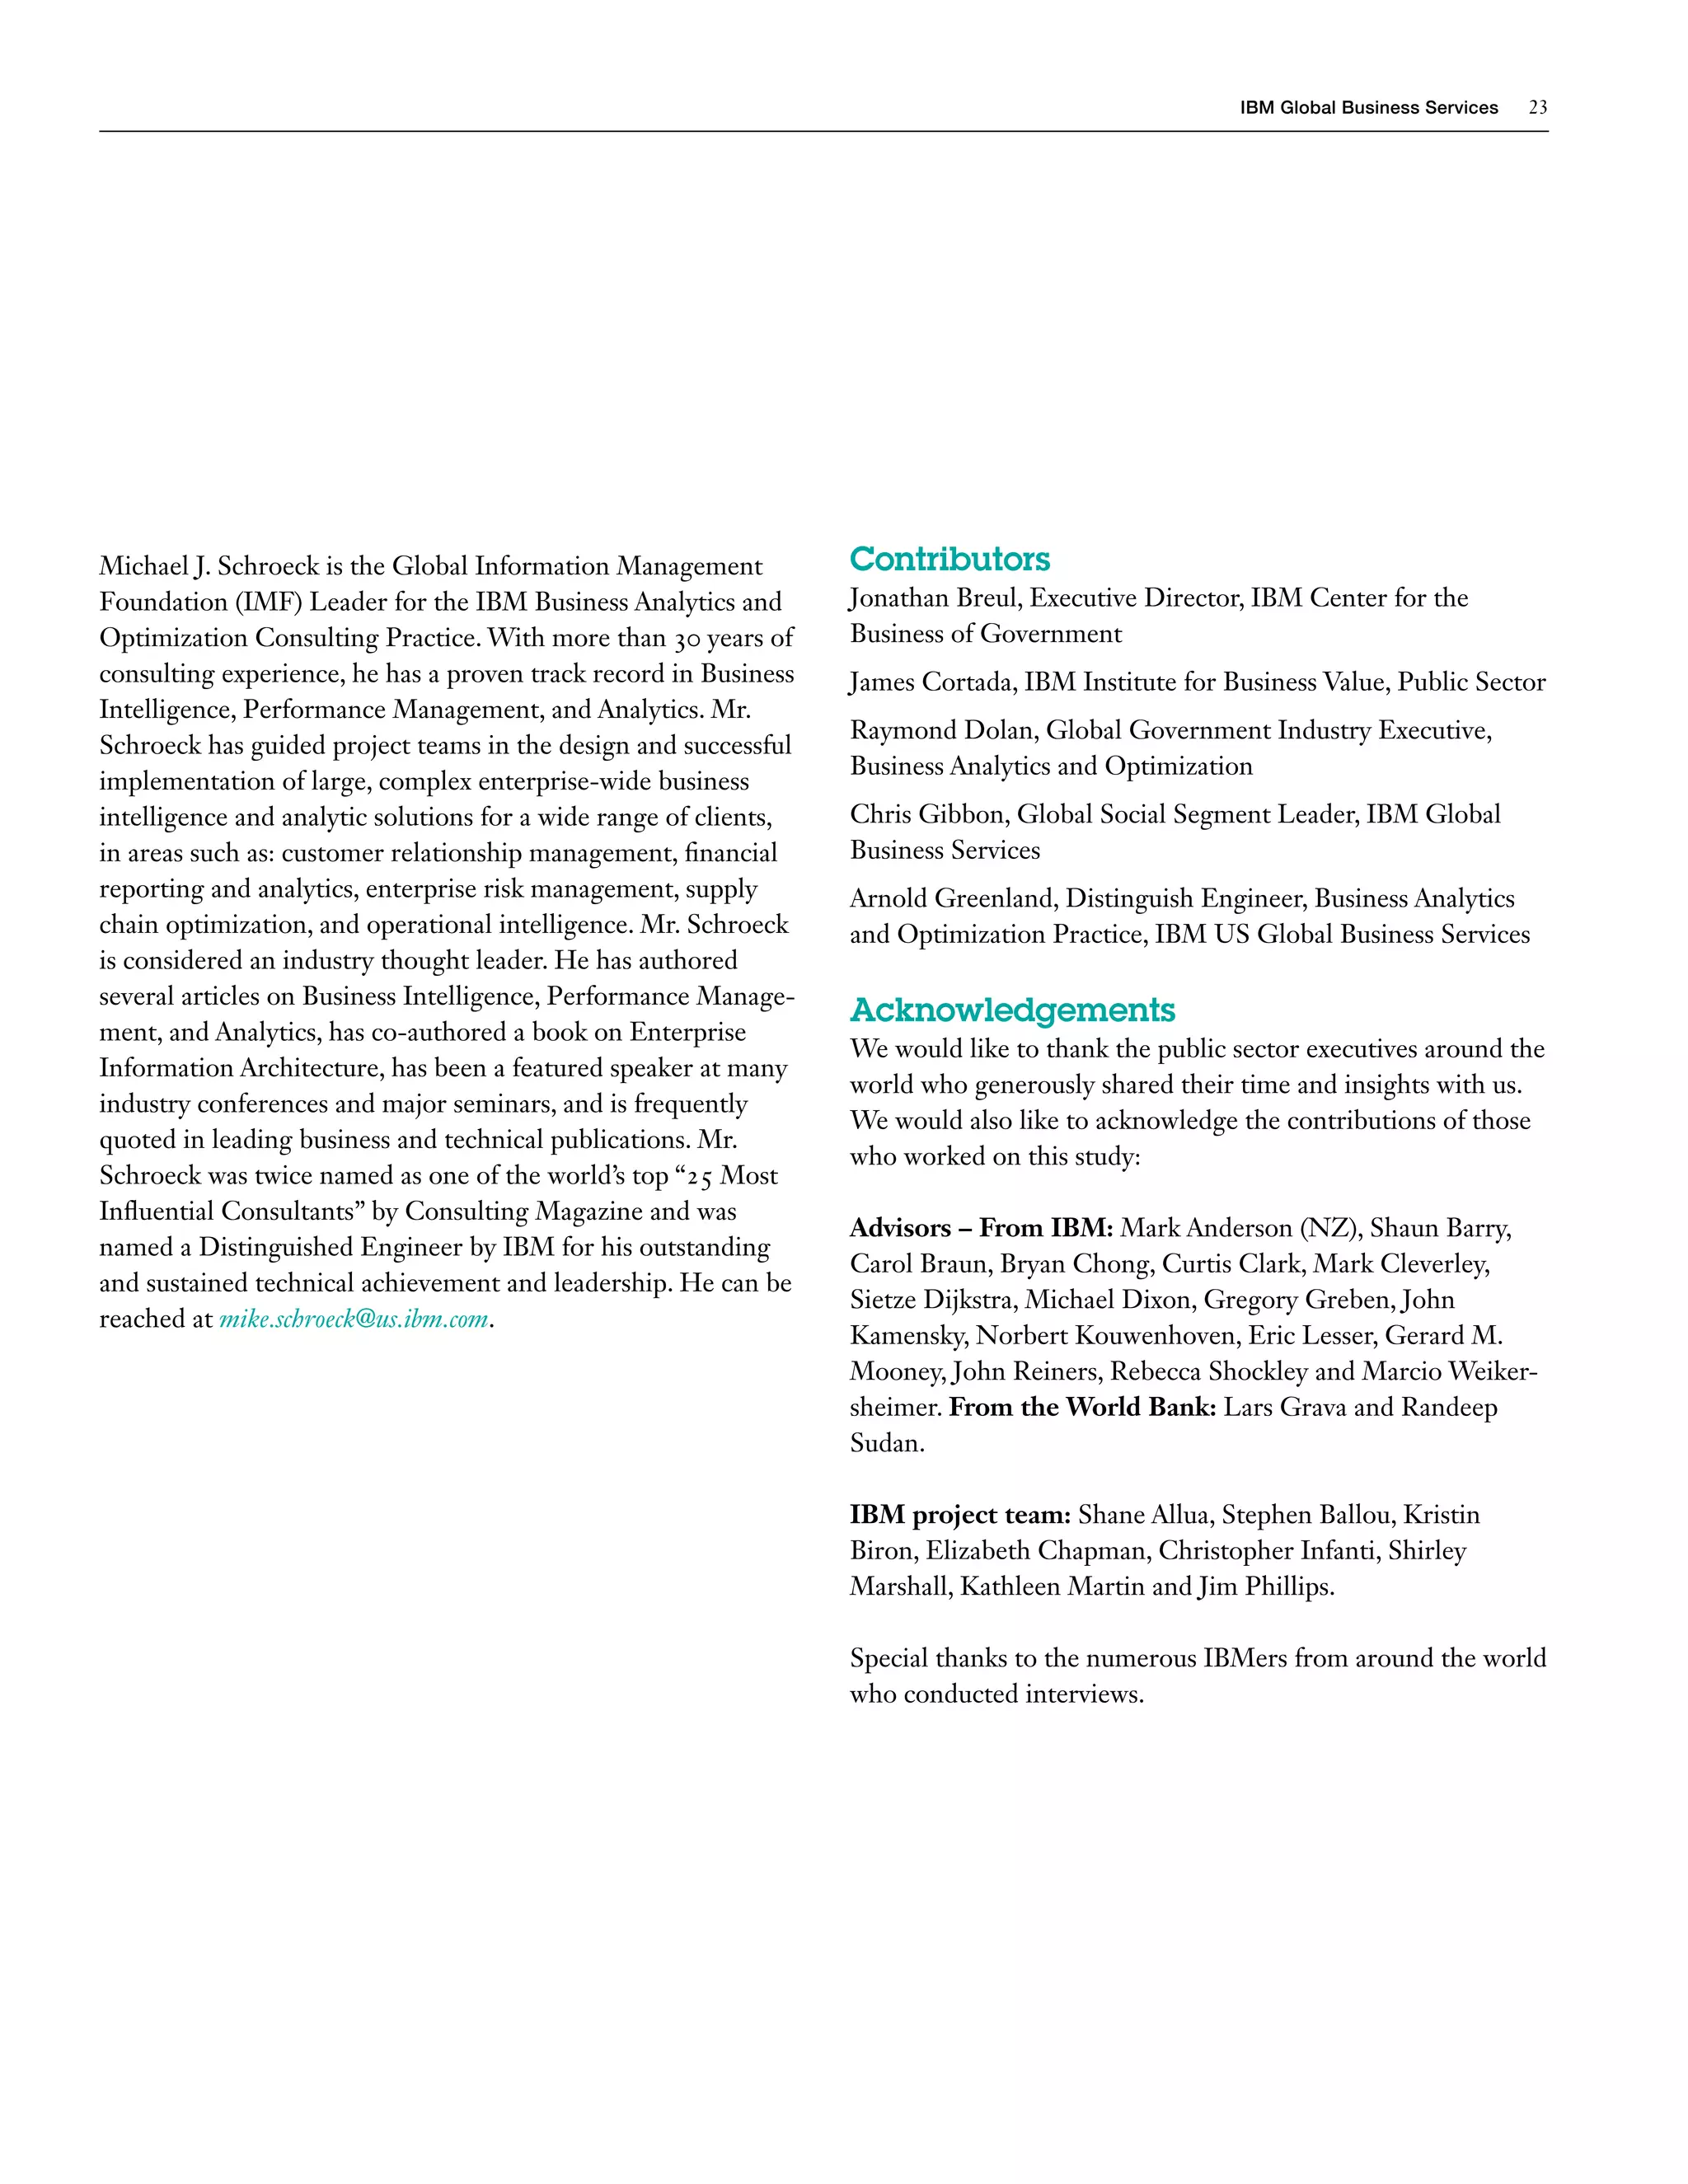
Analytics capability In three years, an interesting clustering occurs. First, the
Analytics capability consists of tools and technologies to make expected improvement of classical analytical techniques
data consumable, insightful and predictive. In comparing the suggests a need to make better choices within constraints.
importance versus effectiveness of key analytics capabilities Techniques that enable informed choices and new insights
today and in three years, we found most organizations varied become dramatically important. Although configuring how
widely in how they assessed where they are against where they work is organized still remains low, its jump in importance
need to be (see Figure 4). Not surprisingly, respondents scored suggests respondents recognize this is a critical enabler,
well in classic analytical techniques. The fact that configuring difficulty notwithstanding.
operations was so low in effectiveness may reflect a resigned
acceptance of the difficulties of accomplishing such a task in
public organizations.
Importance versus effectiveness of key analytics capabilities
(Today and in three years, mean scores)*
3.00 Effectiveness
2.75 Mean (next 3 years)
Today
2.50
In 3 years In three years
2.25 Estimating and measuring
Statistically describing a group, situation, behavior, condition
2.00 Optimizing choices, resources
Predicting events, situations
1.75
Today Detecting non-obvious patterns
1.50 Configuring operations (how work is organized)
1.25
Mean (next 3 years) Importance
1.00
1.00 1.25 1.50 1.75 2.00 2.25 2.50 2.75 3.00
n > 102; mean, next three (3) years (scale 1.00 min, 3.00 max).
* Less important = Grouped responses [1 / 2]; base requirement = responded [3]; Important = Grouped responses [4 / 5].
Source: IBM Institute for Business Value analysis.
Figure 4: Making better decisions remains the top priority, but leaders want to inform them with new and more predictive insights.](https://image.slidesharecdn.com/thepowerofanalyticsforpublicsectorgbe03392usen02-13005669549934-phpapp01/75/The-Power-Of-Analytics-For-Public-Sector-www-ibm-com-gbs-psanalytics-9-2048.jpg)


This document discusses how public sector organizations can build analytics competency to accelerate outcomes. It finds that while governments are increasingly using analytics to unlock insights from data, most are just starting to explore how to leverage analytics and only a select number have developed advanced analytics capabilities and leadership. The document advocates that organizations focus on four strategic imperatives to build competency: focusing on outcomes, orienting information management around use, using analytics to meet objectives, and embedding analytics in management practices.


![Coded Agents – with UiPath SDK + LangGraph [Virtual Hands-on Workshop]](https://cdn.slidesharecdn.com/ss_thumbnails/codedagentsdeck-251215155422-5497c599-thumbnail.jpg?width=640&height=640&fit=bounds)


