
Recommended
Recommended
More Related Content
Similar to A report from the Economist Intelligence UnitThe evolvin.docx
Similar to A report from the Economist Intelligence UnitThe evolvin.docx (20)
More from bartholomeocoombs
More from bartholomeocoombs (20)
Recently uploaded
Recently uploaded (20)
A report from the Economist Intelligence UnitThe evolvin.docx
- 1. A report from the Economist Intelligence Unit The evolving role of data in decision- making Sponsored by and © The Economist Intelligence Unit Limited 20131 The evolving role of data in decision-making About the report 2 Introduction 3 Big data: a misunderstood and misused term 4 The use of big data is becoming entrenched 6 The Alice in Wonderland problem 7 It’s all about the culture 9 The price of neglect and the need for resources 11 Conclusion 12
- 2. Appendix: survey results 13 Contents 1 2 3 4 5 © The Economist Intelligence Unit Limited 20132 The evolving role of data in decision-making About the report In March and April 2013 the Economist Intelligence Unit surveyed 212 global executives on behalf of CSC and EMC to investigate their views on the increasing integration of data, especially “big data”, into organisations’ decision-making processes. Those polled are based in North America (36%), Asia-Pacifi c (26%), Western Europe (37%), and Eastern Europe (1%). Executives hail from 19 sectors and represent 16 functional roles, and all work for companies with revenues exceeding
- 3. US$1bn. In addition, in-depth interviews were conducted with experts from a variety of industries. Our thanks are due to the following for their time and insight (in alphabetical order): l Christopher Frank, Vice President, fi nancial services fi rm l Yuri Levin, Distinguished Professor of Operations Management and Director of Master of Management Analytics program, Queen’s University l Al Raymond, Head of U.S. Privacy & Social Media Compliance ,TD Bank l William Ruh, Vice President and Global Technology Director, General Electric The report was written by Lynn Grenier and edited by Christine Emba. © The Economist Intelligence Unit Limited 20133 The evolving role of data in decision-making As the volume of data has grown and the methods of analysing them have improved, organisations have been integrating data more fi rmly into the decision-making process. However, increasing numbers of traditional and non-traditional data sources are inundating companies with data in
- 4. volumes and types they may not have seen before. Companies are fi nding an increasing gap between the acquisition of data and their meaningful use. Companies have focused extensively on the opportunities and challenges presented by “big data”, recognising that leveraging it to gain competitive advantage can yield signifi cant pay- offs. Research from MIT’s Sloan School of Business indicates that companies that engage in “data-driven decision-making” enjoy a 5 to 6% increase in output and productivity over fi rms that do not. These results are replicated in other metrics, such as asset utilisation, return on equity and market value. The evolving role of data in decision-making, sponsored by CSC and EMC, examines how big data is used in organisations and what impact it has on decision-making. It looks at organisations’ views of what constitutes “big data” and whether they are equipped to work with it properly. The report also examines the role of big data at the most successful companies and what resources are necessary to make use of it. Introduction © The Economist Intelligence Unit Limited 20134 The evolving role of data in decision-making Big Data: data
- 5. sets characterised by their volume, velocity of change and variety of type (the ‘Three Vs‘) that, because of their size and complexity, cannot be analysed through traditional methods. The phrase “big data” means different things to different people. That is not surprising given the amount of hype that surrounds the term and the variety of ways in which marketers have deployed it to promote their products. The generally accepted defi nition of “big data” today is data sets characterised by their volume, velocity of change and variety of type (the ‘Three Vs‘) that, because of their size and complexity, cannot be analysed through traditional methods. However, the McKinsey Global Institute’s 2011 report on big data used a simpler defi nition: “‘Big data’ refers to data sets whose size is beyond the ability of typical database software tools to capture, store, manage and analyse.” An Economist Intelligence Unit Survey conducted in April-May 2013 suggests that some respondents do not include velocity and variety in their defi nition of big data. Indeed, executive interviewees for the report were also divided in their perceptions, with some focusing merely on
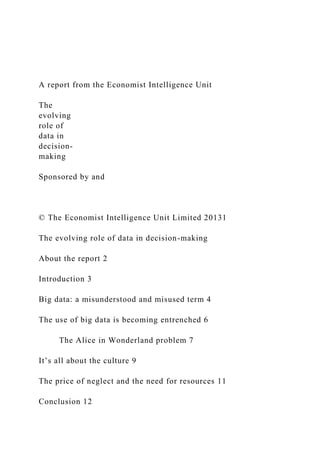
- 6. database size, and others on more extensive criteria, such as data complexity. That the concept of big data is misunderstood is reinforced by some of the organisational functions that report relying on big data use in decision- making, but tend to lean on data volume rather than velocity and variety. The fi nance function leads the pack in its reliance on data (56% of survey respondents) and in frequency of use, with Big data: a misunderstood and misused term 1 Q Source: Economist Intelligence Unit survey, April 2013. Always Often (more than half the time) Sometimes (half the time) Seldom (less than half the time) Never HR management/ Organisational structuring Financial management/ Investment decisions Sales strategy
- 7. Marketing strategy Product development/ Innovation Supply chain management Operations/ Manufacturing Frequency of big data usage in driving decisions How often is big data used to drive decisions in the following areas of your company? Please select one for each area. (% respondents) 8 30 24 27 12 30 33 23 10 4 14 33 35 13 5 15 37 28 16 4 17 28 32 17 5 8 32 29 25 7 13 36 27 17 8 © The Economist Intelligence Unit Limited 20135 The evolving role of data in decision-making 63% of respondents reporting that their fi nance
- 8. function uses it to drive decisions more than half the time. However, though fi nancial data can be high-volume, it tends to be structured and of a predictable velocity. The sources and types of data acquired by respondents may also colour their perceptions of what big data really is. The majority of respondents use unstructured data, such as customer and transaction information, to drive decisions. However, many use data from other sources like customer service interactions and social media, both of which are more likely to be unstructured. At General Electric the three Vs still hold sway, according to William Ruh, vice-president and global technology director. He says that the volume and complexity of the data and the speed with which they are acquired create unique challenges for GE. “Not everything comes in a nice record format,” he says. For instance, GE continually receives real-time sensor data from jet engines that reveal how the engines are performing. But until the company began storing and analysing these data, it was unable to detect patterns that might mean a malfunction was developing, or that would indicate a potential for operational optimisation. Q Source: Economist Intelligence Unit survey, April 2013. Customer data collected by the company (eg, addresses, purchase history)
- 9. Transaction data collected by the company (eg, point of sale data) Externally collected financial data (eg, competitive intelligence) Supply chain/Inventory data (eg, sensor data, product tracking) Inputs from customer service interactions (eg, web/call logs) Demographic or other data supplied by a third party (eg, social media data) Other Sources and types of data used What kinds of big data does your company use today? Please select all that apply. (% respondents) 68 67 59 45 43 40 4
- 10. © The Economist Intelligence Unit Limited 20136 The evolving role of data in decision-making The use of big data is becoming entrenched 2 From human resources (HR) to manufacturing, every organisational function surveyed says it uses big data to drive decision-making at least half the time. And as ratings of companies’ use of data to make decisions increase overall, respondents tend to report that their companies use the data to drive decisions more often across all parts of the organisation. There are regional differences in the adoption of data analysis for decision-making. More than 70% of organisations in Asia-Pacifi c claim only “primitive” or “basic” ability to use available data to drive executive decisions; 42% of North American and 43% of European organisations count themselves among that number. This may be in part because of a shortage of available data; organisations located in Asia-Pacifi c cite “a lack of accurate, timely or relevant data from across the business” and “inconsistent reporting of information among business units, geographies or functional operations” as the biggest obstacles to successful data-based decision-making more often than companies in other regions. Furthermore, signifi cantly fewer respondents (15% in Asia- Pacifi c vs 34% in North America and 33% in Europe) complain of being overwhelmed by the amount and speed of the data reaching the
- 11. organisation. Organisations that perceive themselves as more successful than their peers rate their ability to drive executive decisions with data most highly. Overall, respondents are evenly split in their evaluation of their ability to use available data in executive decisions, with half considering their abilities “primitive” or “basic”, and the other half rating themselves either “advanced” or “outstanding”. However, companies that have benchmarked themselves as more successful than their industry peers also rate themselves as more sophisticated in their use of data than those that Q Source: Economist Intelligence Unit survey, April 2013. Primitive: most analysis is manual or spreadsheet-oriented Basic: just getting started with analytics, data processing tools or systems typically used to build value models Advanced: provides access to large, complex datasets for analytics based on statistical techniques; likely to include predictive models Outstanding: performs real-time analytics on large, complex datasets and has the ability to act on the outcome in near real time Organisations’ ability to use available data to drive executive decisions How would you rate your organisation’s ability to use available data to drive executive decisions today?
- 12. (% respondents) 7 43 44 7 © The Economist Intelligence Unit Limited 20137 The evolving role of data in decision-making According to Christopher Frank, vice president at a fi nancial services fi rm and co-author (with Paul Magnone) of Drinking from the Fire Hose: Making Smarter Decisions Without Drowning in Data, there is a fundamental skill missing in the big data and analytics world that has nothing to do with technology or data. That gap: knowing how to frame and articulate the question being asked in the fi rst place. Mr Frank calls it the Alice in Wonderland problem. Alice, the protagonist of the classic children’s novel, asks the Cheshire Cat for directions. He in turn asks Alice where she wants to go. When she says that she does not know, the cat points out that, in that case, it does not matter which way she goes. The story parallels the use of big data and
- 13. analytics today. Companies can throw all of the expertise and processing power they have available at a data set, but if they do not ask the right question, they will not fi nd a meaningful answer. In many cases, they will just confi rm their own biases. Mr Frank suggests that people look at what surprises them. “Surprise is a bias-killer,” he says. Asking the right question is a skill that can be learned, but people fi rst have to recognise they need it. Then, once they have acquired the skill, they have to practise it. The Alice in Wonderland problem have rated themselves as less successful than their peers. None of the 7% of organisations that said they had the ability to act on their results in near real time (a particularly sophisticated use of data) rated themselves below average in business success compared with their peers. Interestingly, respondents who report “somewhat above average” success compared with their peers tend to use visualisation tools more frequently than those claiming “well above average” success. Could companies on the way up derive more value from tools that speed comprehension of what their data mean? More likely, visualisation tools allow them to more easily determine what question they should be asking of other tools. Christopher Frank, vice-president at a fi nancial services fi rm and co-author of Drinking from the Fire Hose: Making Smarter Decisions Without Drowning in Data (see sidebar), says that in
- 14. an effective analytical culture, users do not want data analytics to give answers so much as to set parameters, winnowing down a large number of variables to fi nd the few that really matter. Successful companies are also more likely to conduct real-time analysis; nearly half (48%) of higher performers use big data in real-time decision-making, but less than a quarter (24%) of lower performers do. Although virtually all organisations use simple techniques such as data mining, successful organisations, particularly those considering themselves well above average compared with their peers, tend to use more sophisticated tools, such as predictive analysis, sentiment analysis, data visualisation and collaborative analysis, on a regular basis. Leading companies also use data to drive strategic decisions almost twice as often as lower performers do. The latter focus more on day-to-day activities, less on fi nding new revenue opportunities and identifying potential new customer offerings. Survey results also reveal that C-level executives tend to categorise their companies’ analytical abilities as advanced; non-C-level-executives are more critical, rating them as either primitive or basic (68%). Since the bulk (68%) of senior executives who completed the survey are at companies with revenue of US$5m or higher, it is likely that they have a more realistic view of their companies’ capabilities, since they are closer to the action. ❛ ❛
- 15. In an effective analytical culture, users do not want data analytics to give answers so much as to set parameters, winnowing down a large number of variables to fi nd the few that really matter. ❜ ❜ Christopher Frank, Vice President, Financial Services Firm © The Economist Intelligence Unit Limited 20138 The evolving role of data in decision-making More successful companies also plan to increase their use of big data and have the greatest expectation of increased value from doing so. Less- successful companies tend to be unsure as to whether they will increase their big data usage. GE is one of the companies increasing its use of big data. Mr Ruh has high hopes for what he calls the “industrial internet”, in which instrumented equipment feeding analytics systems will increase productivity and save money. He says that if, for example, analysis of data from jet engines helps an
- 16. airline use even 1% less fuel, billions of dollars in savings will result. Yet obstacles to the effective use of big data abound. Survey respondents in companies of all sizes, even those enjoying the greatest success, cite lack of data quality and consistency, a shortage of adequate data and the need for resources as key issues. © The Economist Intelligence Unit Limited 20139 The evolving role of data in decision-making It’s all about the culture3 In a data-driven culture, companies approach decision-making from a quantitative point of view and rely less on gut feeling when making major decisions. However, creating such a culture is challenging and requires a fi ne balance between quantitative analysis and the combination of experience, expertise and intuition that allows the analysis to be properly interpreted. “Organisations also need to realise that data has value,” says Al Raymond, head of US privacy and social media compliance at TD Bank. Survey results confi rm this: the less successful the company, the more likely it is to say a lack of internal understanding of the value of the data inhibits its use of big data. Yet at the same time, Mr Raymond notes, companies must be aware of their obligations in
- 17. compliance and customer privacy as they use their data. One-quarter of successful companies cited this as one of the top three obstacles to their use of big data; it was a concern for only 15% of companies of average or below success. Other obstacles to successful data-based decision-making include inconsistent reporting of data among business units, geographies or functions and inadequate tools for collecting, integrating or analysing operational information. Lack of accurate, timely or relevant data from across the business is also a major concern among companies with primitive or basic capabilities. Q Source: Economist Intelligence Unit survey, April 2013. Inconsistent reporting of information among business units, geographies or functional operations Inadequate tools for gathering, integrating or analysing operational information Lack of accurate, timely or relevant data from across the business Inadequate quantitative expertise among executives and support staff Overwhelmed by amount and speed of data that are reaching the organisation Insufficient support from top executives for data analysis as a key component of corporate strategy
- 18. Other Obstacles to data-based decision-making What are the biggest obstacles to successful data-based decision-making in your organisation? Please select up to three. (% respondents) 48 41 40 39 28 17 5 ❛ ❛ Organisations [...] need to realise that data have value. ❜ ❜ Al Raymond, Head of US Privacy and Social Media Compliance, TD Bank
- 19. © The Economist Intelligence Unit Limited 201310 The evolving role of data in decision-making All of these defi ciencies can be remedied in a culture that values the outputs from these data. However, given that time, money or effort may be needed to change a company’s data strategy, organisations must be extremely motivated to change course. Overcoming resistance at the top is key. However, many senior executives are unsure about increasing their use of data in decision-making. Chief fi nancial offi cers (CFOs) are particularly likely to say they have no intention of increasing their use of big data in decision-making (32%), compared with only 9% of senior managers. Chief marketing offi cers (CMOs), who tend to be highly involved in digital marketing and other data-based outreach, are the most likely to say that their organisations are planning to increase their big data use (64%). This corresponds with what Mr Ruh has observed: the greatest near-term opportunity is often seen at more operational levels, where data can have an immediate impact. He says, “The best people are still limited by what they can see.” ❛ ❛ The best people are still limited by what they can see. ❜ ❜ William Ruh, Vice President and Global
- 20. Technology Director, GE © The Economist Intelligence Unit Limited 201311 The evolving role of data in decision-making The price of neglect and the need for resources4 A shortage of employees able to analyse data appropriately can negatively affect data-usage patterns and change perceptions of the role of big data in decision-making. Without the necessary data-handling resources and a system supporting data’s use, companies will struggle to conduct proper analysis and may not be able to make decisions in a timely manner, potentially limiting their effectiveness. Hiring the appropriate data- analysis professionals can also be a driver of cultural change, signalling data’s utility in decision-making to others in the organisation. Analytical sophistication (or lack thereof) affects success. The right analysis has to be applied to data to drive meaningful decisions. This requires appropriate resources and tools. Without those resources, decisions are slower and less sound. In fact, companies that say they make decisions more quickly when using big data also tend to rate their ability to use such data more highly. This skill/ speed relationship also works in the inverse: organisations lacking the right tools and resources make slower decisions.
- 21. The key in many instances is not so much technology as it is people qualifi ed to use it. In “above average” companies, 28% say they already have the talent their company needs to apply big data in decision-making and 44% say they plan to hire more. At less-successful companies, 65% say they do not have the requisite talent and plan to hire over the next 12 months or later. They also say their use of data in decision-making is inhibited by this lack of resources. These trends make it a seller’s market for “data scientists”—people with skills in both advanced math and computer science. Educational institutions are just beginning to offer programmes tailored to the needs of big data, and their graduates are snapped up immediately. At North Carolina State University, for instance, all 84 students who received a master’s degree in analytics had job offers upon graduation, with average annual salaries around US$90,000. An understanding of math and computer science alone is not suffi cient, says Yuri Levin, distinguished professor of management science and operations management at Queen’s University in Kingston, Ontario, and the driving force behind its new Master of Management Analytics programme. He points out that even if companies can fi nd people who can handle the technical side of data analytics, these technical specialists often are unable to communicate their fi ndings to the business. “This is the gap we are trying to fi ll with this programme,” he says. “The key challenge for
- 22. people with technical skills is working with management. People have to understand the business and be able to communicate effectively with non-technical people.” ❛ ❛ The key challenge for people with technical skills is working with management. People have to understand the business and be able to communicate effectively with non-technical people. ❜ ❜ Yuri Levin, Distinguished Professor of Operations, Management and Director of Master of Management Analytics program, Queen’s University © The Economist Intelligence Unit Limited 201312 The evolving role of data in decision-making The role of data is but a single facet of the decision- making process, but it can be a critical one.
- 23. Successful companies have demonstrated that wise use of appropriate analytics on available data has helped them improve their business. With the types of data available growing every day, the amount of potential insight can only increase. To develop that insight, however, organisations must acknowledge the value to be had and secure the appropriate resources to harvest it. This will necessitate a multi-pronged approach: fi rst, organisations must work towards a data- driven culture, where collection and storage of useful information are an integral part of business processes. Second, they must acquire or grow expertise both in data science and their own business trends in order to analyse these data and draw meaningful conclusions. Third, and most importantly, they must marry insights from the analysis with internal expertise, and consciously involve that combined knowledge when making business decisions. Only then will the time and effort spent on the fi rst two steps come to fruition. Conclusion 5 © The Economist Intelligence Unit Limited 201313 The evolving role of data in decision-making Appendix: survey results
- 24. Percentages may not add up to 100% owing to rounding or the ability of respondents to choose multiple responses. Well above average Somewhat above average Average/On par with peers Somewhat below average Well below average How would you rate your company’s success compared with that of your industry peers? (% respondents) 19 50 21 8 2 Primitive: most analysis is manual or spreadsheet-oriented Basic: just getting started with analytics, data processing tools or systems typically used to build value models
- 25. Advanced: provides access to large, complex datasets for analytics based on statistical techniques; likely to include predictive models Outstanding: performs real-time analytics on large, complex datasets and has the ability to act on the outcome in near real time How would you rate your organisation’s ability to use available data to drive executive decisions today? (% respondents) 7 43 44 7 Inconsistent reporting of information among business units, geographies or functional operations Inadequate tools for gathering, integrating or analysing operational information Lack of accurate, timely or relevant data from across the business Inadequate quantitative expertise among executives and support staff Overwhelmed by amount and speed of data that is reaching the organisation Insufficient support from top executives for data analysis as a
- 26. key component of corporate strategy Other What are the biggest obstacles to successful data-based decision-making in your organisation? Please select up to three. (% respondents) 48 41 40 39 28 17 5 © The Economist Intelligence Unit Limited 201314 The evolving role of data in decision-making Very quick Somewhat quick Moderate Somewhat slow
- 27. Very slow How would you rate the speed of decision-making within your organisation? (% respondents) 11 31 36 19 3 Very quick Somewhat quick Moderate Somewhat slow Very slow How would you rate the speed of decision-making within your organisation when using big data as a key resource? (% respondents) 8 27 38
- 28. 23 4 Always Often (more than half the time) Sometimes (half the time) Seldom (less than half the time) Never HR management/ Organisational structuring Financial management/ Investment decisions Sales strategy Marketing strategy Product development/ Innovation Supply chain management Operations/ Manufacturing How often is big data used to drive decisions in the following areas of your company? Please select one for each area. (% respondents)
- 29. 8 30 24 27 12 30 33 23 10 4 14 33 35 13 5 15 37 28 16 4 17 28 32 17 5 8 32 29 25 7 13 36 27 17 8 © The Economist Intelligence Unit Limited 201315 The evolving role of data in decision-making Finance Sales Marketing Strategic planning Operations Research and development Technology Market research
- 30. Supply chain management/Logistics Customer service Human resources/Talent management Other In your organisation, which functional groups rely most heavily on big data? Please select three. (% respondents) 56 35 33 30 27 20 17 17 10 10 6
- 31. 2 One person within the group A team of employees within the group All members of the group An external data analysis group Both internal and external groups Sales Marketing Strategic planning Finance Operations Technology Customer service Research and development
- 32. Market research Supply chain management/Logistics Human resources/Talent management Other Sales (% respondents) 8 55 21 8 8 4 63 16 4 12 17 51 21 3 8 6 61 22 2 10 2 71 10 9 9 9 40 40 6 6 5 43 29 10 14 10 49 39 2 51 31 3 14 5 50 36 9 8 50 33 8 67 33
- 33. © The Economist Intelligence Unit Limited 201316 The evolving role of data in decision-making Customer data collected by the company (eg, addresses, purchase history) Transaction data collected by the company (eg, point of sale data) Externally collected financial data (eg, competitive intelligence) Supply chain/Inventory data (eg, sensor data, product tracking) Inputs from customer service interactions (eg, web/call logs) Demographic or other data supplied by a third party (eg, social media data) Other What kinds of big data does your company use today? Please select all that apply. (% respondents) 68 67 59 45 43
- 34. 40 4 Always Often (more than half the time) Sometimes (half the time) Seldom (less than half the time) Never Predictive analysis Sentiment analysis Data mining Data visualisation Embedded analytics Collaborative analysis To what extent does your organisation use the following types of big data analysis tools? Please select one in each row. (% respondents) 15 33 25 16 11
- 35. 5 17 32 27 19 8 33 33 21 5 10 26 33 19 11 4 21 33 27 15 6 22 37 24 12 Marketing strategy development Inform strategic decision-making Improve day-to-day business operations Identify operational improvements Customer segmentation Generate new revenue streams Make real-time business decisions Mine insights in real time Offer customers products and services that the data suggest they will want to buy Integrate social media channels Derive analytics via machine-to-machine data Other
- 36. How is big data used to make decisions at your organisation? Please select all that apply. (% respondents) 58 54 54 51 50 35 33 18 18 15 15 2 © The Economist Intelligence Unit Limited 201317 The evolving role of data in decision-making Financial projections
- 37. Marketing strategy development Operations/Manufacturing Cost control Sales strategy Customer service Research and development Supply chain/Logistics Risk management Human resources/Productivity measurements Competitive intelligence Regulatory compliance Other Where have you seen big data provide the most value at your organisation in the past two years? Please select up to three. (% respondents) 41 36 32 28
- 38. 26 18 16 13 9 8 8 4 2 Yes No Unsure Does your organisation plan to increase its use of big data in decision-making? (% respondents) 55 18 27 Marketing strategy
- 39. Financial projections Sales strategy Cost control Research and development Operations/Manufacturing Customer service Supply chain/Logistics Human resources/Productivity measurements Regulatory compliance/risk management Where do you see data providing the greatest increase in value in the future? Please select up to three. (% respondents) 51 41 39 28 28 26
- 40. 24 11 11 11 © The Economist Intelligence Unit Limited 201318 The evolving role of data in decision-making Minimal potential Moderate potential Strong potential Financial projections Cost control Customer service Sales strategy Marketing strategy Operations/Manufacturing Research and development
- 41. Supply chain/Logistics Human resources/Productivity measurements Regulatory compliance/risk management To what extent do you believe data can provide increased value in these areas? Please choose one answer in each row. (% respondents) 10 35 54 6 33 61 4 39 57 4 33 62 2 32 66 3 37 60 31 69 46 54 8 38 54 23 77 Machine-to-machine data (eg, unmanned service calls, data logged by machines) Data from social media (eg, facebook, twitter feeds)
- 42. Data from location services (eg, GPS, mobile phones, wireless network recognition) Data from tracking technology (eg, RFID tagging, cookies) Other unstructured data (eg, photographs, unsorted text) Biometric data (eg, iris readings, heart rate reporting) Other What new types of data do you anticipate your company will most likely use in the future? Please select your top two. (% respondents) 44 41 34 28 18 9 5 Increase Decrease Remain the same
- 43. For the purpose of increasing effectiveness, should your organisation increase or decrease its reliance on data in the decision-making process? (% respondents) 77 3 20 © The Economist Intelligence Unit Limited 201319 The evolving role of data in decision-making Forecasting Business process innovation Customised promotions Supply chain enhancements Data-based product/Service innovation Location-based customer contact/services Proactive customer assistance Employee performance tracking Proactive maintenance/Fault detection
- 44. Skills development Other How do you believe the results of big data analysis will most likely be used? Please select up to two. (% respondents) 40 27 25 22 15 14 14 14 12 2 2 Cultural (Lack of internal understanding of data’s value) Talent (skilled worker shortage) Availability (not enough data available)
- 45. Technical (data too complex to integrate or analyse) Financial (high costs are prohibitive) Time (data capabilities take too long) Logistical (too many data sources) Organisational (not everyone would benefit) Security (too many variables, poor governance) Other Nothing has hindered our efforts to increase the use of big data What factors have hindered your company’s increasing its use of big data so far? Please select all that apply. (% respondents) 57 42 39 37 36 36 36
- 46. 26 24 4 0 We don’t see the value in data usage in the decision-making process Data usage in the decision-making process is too expensive for results achieved Traditional forms of expertise are more reliable than data analysis We have not seen results in our use of data in the decision- making process What is the primary reason why you believe that your organisation should decrease its reliance on data in the decision-making process? (% respondents) 43 43 14 0 © The Economist Intelligence Unit Limited 201320
- 47. The evolving role of data in decision-making Inadequate analysis of data for business insights Poor organisation of unstructured data Difficulty finding and retaining qualified staff to manage/analyse data Low data quality Limited availability of data Compliance/Regulatory issues Threats to data security Limited storage capacity Other What are the main obstacles to big data usage in your organisation? Please select up to three. (% respondents) 47 42 33 31 28
- 48. 22 12 9 1 We have the required talent and don’t plan to hire more We have the required talent and plan to hire more in the next 12 months We have the required talent and plan to hire more in the next 1 to 3 years We do not have the required talent but plan to hire in 12 months We do not have the required talent but plan to hire over the next 1 to 3 years We do not have the required talent and plan to outsource We don’t see the need and do not plan to hire Is the talent your company needs to apply big data in decision- making currently available in your organisation? (% respondents) 19 21 24
- 49. 18 11 1 6 United States of America United Kingdom India Germany China, France, Singapore Switzerland, Hong Kong Belgium, Indonesia, Italy Malaysia, Turkey, Australia, Austria, Denmark, Finland, Japan, Netherlands, Spain, Taiwan In which country are you personally located? (% respondents) 36 12 8 7
- 50. 4 3 2 1 Western Europe North America Asia-Pacific Eastern Europe Latin America Middle East and Africa In which region are you personally located? (% respondents) 37 36 26 1 0 0
- 51. © The Economist Intelligence Unit Limited 201321 The evolving role of data in decision-making Board member CEO/President/Managing director CFO/Treasurer/Comptroller CIO/Technology director COO/Operations director CMO/Marketing director Other C-level executive SVP/VP/Director Which of the following best describes your job title? (% respondents) 2 6 21 2 15 16
- 52. 3 35 General management Finance Marketing Strategy and business development Sales Operations and production IT Risk Information and research Supply-chain management R&D Human resources Procurement Legal Customer service Other
- 53. What is your main functional role? Select up to three. (% respondents) 35 30 24 24 19 19 10 9 8 7 4 4 4 2 1 1
- 54. Financial services Manufacturing Healthcare, pharmaceuticals and biotechnology IT and technology Energy and natural resources Consumer goods Professional services Chemicals Transportation, travel and tourism Automotive Retailing Telecommunications Government/Public sector Aerospace/Defence Construction and real estate Agriculture and agribusiness Education Entertainment, media and publishing
- 55. Logistics and distribution What is your primary industry? (% respondents) 14 12 9 8 8 7 6 5 5 4 4 4 3 2 2 2
- 56. 2 2 1 0 44 22 33 less than $1 billion $1 billion to $5 billion $5 billion to $10 billion More than $10 billion What are your organisation’s global annual revenues in US dollars? (% respondents) © The Economist Intelligence Unit Limited 201322 The evolving role of data in decision-making
- 57. Whilst every effort has been taken to verify the accuracy of this information, neither The Economist Intelligence Unit Ltd. nor the sponsor of this report can accept any responsibility or liability for reliance by any person on this white paper or any of the information, opinions or conclusions set out in the white paper. Co ve r: S h ut te rs to ck London 20 Cabot Square London E14 4QW United Kingdom Tel: (44.20) 7576 8000 Fax: (44.20) 7576 8476
- 58. E-mail: [email protected] New York 750 Third Avenue 5th Floor New York, NY 10017 United States Tel: (1.212) 554 0600 Fax: (1.212) 586 0248 E-mail: [email protected] Hong Kong 6001, Central Plaza 18 Harbour Road Wanchai Hong Kong Tel: (852) 2585 3888 Fax: (852) 2802 7638 E-mail: [email protected] Geneva Boulevard des Tranchées 16 1206 Geneva Switzerland Tel: (41) 22 566 2470 Fax: (41) 22 346 93 47 E-mail: [email protected]